Presentation to Credit Investors - Fresenius · This presentation contains forward-looking...
62
Presentation to Credit Investors August 2019 Frankfurt stock exchange: FRE │ US ADR program: FSNUY │ www.fresenius.com/investors
Transcript of Presentation to Credit Investors - Fresenius · This presentation contains forward-looking...

Presentation to Credit Investors
August 2019
Frankfurt stock exchange: FRE │ US ADR program: FSNUY │ www.fresenius.com/investors

Safe Harbor Statement
This presentation contains forward-looking statements that are subject to various risks and uncertainties. Future results could differ materially from those described in these forward-looking statements due to certain factors, e.g. changes in business, economic and competitive conditions, regulatory reforms, results of clinical trials, foreign exchange rate fluctuations, uncertainties in litigation or investigative proceedings, and the availability of financing. Fresenius does not undertake any responsibility to update the forward-looking statements contained in this presentation.
2General Credit Presentation, August 2019, © Fresenius SE & Co. KGaA Investor Relations

A Global Leader in Health Care Products and Services
~€33.5 bn in Sales€3.1 bn net income1
(as of Dec. 31, 2018)
Global presence in 100+ countries
Long-term opportunities in growing, non-cyclical markets
Strong financial performance and cash flow generation
1 Net income incl. attributable to non-controlling interest
Leading market positions
Diversified revenue base with four strong business segments
General Credit Presentation, August 2019, © Fresenius SE & Co. KGaA Investor Relations 3

Strong and Balanced Health Care Portfolio
General Credit Presentation, August 2019, © Fresenius SE & Co. KGaA Investor Relations
Ownership: ~31% Ownership: 100% Ownership: 100% Ownership: 77%
Dialysis ProductsHealth Care Services
Hospital Supplies Hospital Operation Projects and Services for Hospitals
• Dialysis services• Hemodialysis products• Peritoneal dialysis products• Care coordination
Sales 2018: €16.5 bn
• IV drugs• Biosimilars• Clinical nutrition• Infusion therapy• Medical devices/
Transfusion technology
Sales 2018: €6.5 bn
• Acute care• Outpatient services
Sales 2018: €9.0 bn1
• Post-acute care• Project development &
Planning• Turnkey construction• Maintenance & Technical
and total operational management
Sales 2018: €1.7 bn1
4
1 Reflects the transfer of German post-acute care business from Fresenius Helios to Fresenius Vamed as of July 1, 2018

Fresenius Group: Global Sales Base in Growing, Non-Cyclical Markets
General Credit Presentation, August 2019, © Fresenius SE & Co. KGaA Investor Relations 5
€33.5 bn
2018 Sales by Region Sales in € bn
Europe 43%
North America 42%
Asia-Pacific 10%
Latin America 4%
Africa 1% 9 %
CAGR
19.5 20.5
23.5
28.029.5
33.9 33.5
2012 2013 2014 2015 2016 2017 2018

4%5%
13%
0%
6%5%
6%
16%
´11 ´12 ´13 ´14 ´15 ´16 ´17 ´18
Fresenius Group: Strong Track Record of Organic Sales Growth in All Business Segments
General Credit Presentation, August 2019, © Fresenius SE & Co. KGaA Investor Relations 6
1 Due to project delays in Russia and Ukraine
Fresenius Group Business Segments
5%CAGR
1
4%
6%
4% 4%
6% 6% 6%
4%
´11 ´12 ´13 ´14 ´15 ´16 ´17 ´18
2%
5% 5% 5%6%
7% 7%
4%
´11 ´12 ´13 ´14 ´15 ´16 ´17 ´18
9% 9%
5%4%
8%
5%
7% 7%
´11 ´12 ´13 ´14 ´15 ´16 ´17 ´18
4%5%
3%4%
3%4% 4%
3%
´11 ´12 ´13 ´14 ´15 ´16 ´17 ´18

3.9 3.9 4.1
5.15.5
6.36.0
2012 2013 2014 2015 2016 2017 2018
Fresenius Group: Strong Track Record of EBITDA Generation
General Credit Presentation, August 2019, © Fresenius SE & Co. KGaA Investor Relations 7
50%
24%
2%24%
2018 EBITDA by Business Segment EBITDA1 in € bn
€6.0 bn
7%CAGR
1 Before special items

0.02
0.23 0.250.29
0.320.37
0.420.44
0.55
0.62
'93 08 09 10 11 12 13 14 15 16 17 18
25% 24%21% 20% 21% 21% 22% 21% 22% 23% 24%
Fresenius SE: Earnings-Linked Dividend Policy
General Credit Presentation, August 2019, © Fresenius SE & Co. KGaA Investor Relations 8
€ per share
• Dividend growth aligned to EPS1
growth
• Pay-out Ratio: 20% to 25%
Dividend distribution (€m)
Pay-out Ratio
0.75
2018 Pay-out Ratio: 24% Dividend Policy
122 140 155 196 225 238 300 416114 343 445
0.80
1 Before special items

Global Health Care Trends – Strong Growth Fundamentals
Aging population and higher incidence of chronic diseasesWorld population age 60+ will reach >2bn by 20501
Increasing health expenditure per capita, 2014 vs. 1999 – USA $9,403 (+108%), China: $420 (+977%), India: $75 (+317%)2
By 2022, one third of all global health expenditure will occur in Emerging Economies3
9
60+
1/31 WHO: 10 facts on aging and the life course2 World Bank: Health expenditure per capita3 World Economic Forum: Health Systems Leapfrogging in Emerging Economies – Project Paper (2014)
General Credit Presentation, August 2019, © Fresenius SE & Co. KGaA Investor Relations

Fresenius Medical Care: Global Dialysis Market Leader
• The world’s leading provider of dialysis products and services treating more than 339,500 patients1
in ~3,990 clinics1
• Provide highest standard of product quality and patient care
• Expansion in Care Coordination and global dialysis service opportunities; enter new geographies
Global Dialysis Market 2018: • ~€71 bn• ~6% patient growth p.a.
Growth Drivers: • Aging population, increasing incidence of diabetes
and high blood pressure, treatment quality improvements
International30%
Sales 2018:€16.5 bn North America
70%
Dialysis products
Dialysis services
Complete therapy offerings
1 As of June 30, 2019
Market Dynamics
General Credit Presentation, August 2019, © Fresenius SE & Co. KGaA Investor Relations 10

2,1292,409
2,5622,306
'15 '16 '17 '18
15,455
16,570
17,784
16,547
'15 '16 '17 '18
Fresenius Medical Care: Sales an EBIT development
General Credit Presentation, August 2019, © Fresenius SE & Co. KGaA Investor Relations 11
EBIT1 in € millionSales in € million
1 Before special items

Fresenius Kabi: A Leading Global Hospital Supplier
• Comprehensive product portfolio for critically and chronically ill patients
• Strong Emerging Markets presence• Leading market positions in four product
segments
• Focus on organic growth through geographic product rollouts and new product launches
• Development of biosimilars with a focus on oncology and autoimmune diseases
Global Addressable Market 2018: • ~€81 bnGrowth Drivers: • Patent expirations, rising demand for health care
services, higher health care spending in Emerging Markets
Market Dynamics
Emerging Markets30%
Sales 2018:€6.5 bn Europe 34%
North America 36%
Generic IV Drugs
Clinical Nutrition
Infusion Therapy
Medical Devices / Transfusion Technology
General Credit Presentation, August 2019, © Fresenius SE & Co. KGaA Investor Relations
Biosimilars
12

1,197
1,171 1,177
1,139
'15 '16 '17 '18
5,9506,007
6,358
6,544
'15 '16 '17 '18
Fresenius Kabi: Sales and EBIT development
General Credit Presentation, August 2019, © Fresenius SE & Co. KGaA Investor Relations 13
Sales in € million EBIT1 in € million
1 Before special items

• ~5%1 share in German acute care hospital market
• Organic growth based on growing number ofadmissions and reimbursement rate increases
• Ranks as quality leader in the German hospital sector: defined quality targets, publication of medical treatment results, peer review processes
• Key medical indicators, e.g. mortality rate for heart failure, pneumonia below German average
86 hospitals~29,000 beds~1.2 million inpatient
admissions p.a.~4.1 million outpatient
admissions p.a.1 Based on sales 2 German Federal Statistical Office 2018; total costs, gross of the German hospitals
less academic research and teachingAs of July 31, 2019
Fresenius Helios: Europe’s Largest Private Hospital OperatorHelios Germany
German Acute Care Hospital Market: • ~€102 bn2
Growth Drivers: • Aging population leading to increasing
hospital admissions
Largest network & nationwide presence
Acute Care
Market Dynamics
General Credit Presentation, August 2019, © Fresenius SE & Co. KGaA Investor Relations
Outpatient
14

• ~€3.0 bn sales in 2018
• ~12%1 share in Spanish private hospital market
• Market leader in size and quality with excellent growth prospects
• Broad revenue base with privately insured patients, PPPs, self-pay and Occupational Risk Prevention (ORP)
• Strong management team with proven track record
• Cross-selling opportunities
Fresenius Helios: Europe’s Largest Private Hospital Operator Helios Spain
Spanish Private Hospital Market: • ~€14 bn2
Growth Drivers: • Aging population, increasing number of privately
insured patients, greenfield projects, market consolidation
Quirónsalud hospitals in every major metropolitan region of Spain
Acute Care
Occupational Risk Prevention
Outpatient
1 Based on sales2 Market data based on company research. Market definition does neither include
Public Private Partnerships (PPP) nor Occupational Risk Prevention centers (ORP)
Market Dynamics
As of July 31, 2019
50 hospitals ~7,000 beds~12.9 m outpatient admissions p.a. ~0.4 m inpatientadmissions p.a.
15General Credit Presentation, August 2019, © Fresenius SE & Co. KGaA Investor Relations

642 683
1,052 1,052
'15 '16 '17 '18
5,578 5,843
8,668 8,993
'15 '16 '17 '18
Fresenius Helios: Sales and EBIT development
General Credit Presentation, August 2019, © Fresenius SE & Co. KGaA Investor Relations 16
Sales in € million EBIT in € million
2017: 11 months contribution of Helios Spain (Quirónsalud)1 Before special items

• Manages hospital construction/expansion projects and provides services for health care facilities worldwide
• Offers project development, planning, turnkey construction, maintenance as well as technical management, and total operational management
• Strong track record: More than 900 projects in over 90 countries completed
• Leading European post-acute care provider operating in five European countries
Fresenius Vamed: Leading Global Hospital Projects and Services Specialist
Market Dynamics
Growth Drivers: • Emerging Market demand for building and
developing hospital infrastructure• Outsourcing of non-medical services from public to
private operators
Emerging Markets22%
Sales 2018:€1.7 bn Europe 78%
Projects
Services
General Credit Presentation, August 2019, © Fresenius SE & Co. KGaA Investor Relations
Post-acute care
17

1,118
1,160
1,228
'15 '16 '17 '18
1,688
6469
76
110
'15 '16 '17 '18
Fresenius Vamed: Sales an EBIT development
General Credit Presentation, August 2019, © Fresenius SE & Co. KGaA Investor Relations 18
EBIT in € millionSales in € million

Fresenius Group: Key Figures
General Credit Presentation, August 2019, © Fresenius SE & Co. KGaA Investor Relations 19
€m 20181 20171 Growth (cc)5
Sales 33,530 33,886 6%
EBITDA 5,991 6,267 0%Margin 17.9% 18.5%
EBIT 4,561 4,830 -1%Margin 13.6% 14.3%
Interest, net -570 -652 7%
EBT 3,991 4,178 0%
Taxes -880 -1,168 21%
Net Income3 3,111 3,010 8%
Employees4 276,750 273,249
1 Before special items2 4% organic growth, 2% acquisitions, 0% divestitures, -4% currency effects 3 Net income incl. attributable to non-controlling interest4 As of December, 315 Adjusted for IFRS and divestitures of Care Coordination activities

Cash Flow Development by Business Segment
General Credit Presentation, August 2019, © Fresenius SE & Co. KGaA Investor Relations 20
1 Before acquisitions and dividends2 Margin incl. FMC dividend3 Understated: 1.7% excluding €30 million of capex commitments from acquisitions
Operating CF Capex (net) Free Cash Flow1
€m 2018 Margin 2018 Margin 2018 Margin
1,040 15.9% -553 -8.5% 487 7.4%
554 6.2% -434 -4.9% 120 1.3%3
106 6.3% -29 -1.7% 77 4.6%
Corporate/Other -20 n.a -58 n.a. -78 n.a
1,680 10.4%2 -1,074 -6.3% 606 4.1%2
2,062 12.5% -1,003 -6.1% 1,059 6.4%
3,742 11.2% -2,077 -6.2% 1,6654 5.0%
Excl. FMC
Group
Margin = in % of sales

4.8 4.8 4.85 .2 5 .3
5.85 .5 5 .5 5.4
6 .5
3
4
5
6
7
8
2009 2010 2011 2012 2013 2014 2015 2016 2017 2018
Fresenius Group Consistent Cash Generation
% %
%
Capex gross, in % of sales
FCF margin (before acquisitions & dividends)CFFO margin
21General Credit Presentation, August 2019, © Fresenius SE & Co. KGaA Investor Relations
11 .0
12.0
10.3
12.6
11.4
10.9
12.0 12.2
11.6
11.2
8
9
10
11
12
13
14
2009 2010 2011 2012 2013 2014 2015 2016 2017 2018
6.3
7.4
5.6
7 .6
6 .2
5.2
6 .7 6 .7 6.6
5.0
3
4
5
6
7
8
9
2009 2010 2011 2012 2013 2014 2015 2016 2017 2018

Fresenius Group: Proven Track Record of Deleveraging
22
Net Debt/EBITDA1
1 – At actual FX rates for both Net Debt and EBITDA; before special items; pro forma closed acquisitions/divestitures2 – Pro forma excluding advances made for the acquisition of hospitals from Rhön-Klinikum AG3 – Calculated at actual FX rates, for both net debt and EBITDA; including acquisition of the NxStage; excluding IFRS 16 effect (comparable to updated guidance from May 2, 2019)4 – Calculated at actual FX rates, for both net debt and EBITDA; pro forma closed acquisitions/divestitures; according to IFRS 16, the reported Net Debt/EBITDA ratio increased to 3.6x5 – Calculated at expected annual average exchange rates, for both net debt and EBITDA; including acquisition of the NxStage; excluding IFRS 16 effect6 – Before special items7 – Pro forma closed acquisitions/divestitures
3.2x
3.0x
2.7x
2.2x 2.3x
3.5x
3.0x
2.6x
3.6x
3.0x
2.6x
2.8x
2.5x 2.5x
3.4x
2.7x
2.4x
2.8x
2.7x
3.2x3,4
2.0
3.0
4.0
2001 2002 2003 2004 2005 Q1/06 2006 2007 2008 2009 2010 2011 2012 2013 2014 2015 2016 2017 2018 H1/192
Target 20195 towards the upper-end of self-imposed target corridor of 2.5 – 3.0x
Hospitals from
6,7 6,7 6,7 6,7 6,7 7 6,7 6,76
General Credit Presentation, August 2019, © Fresenius SE & Co. KGaA Investor Relations

4
Fresenius Group: Capitalization – June 30, 2019 adjusted for IFRS 16 effect
23
1 Based on market capitalization for FSE and FMC as of June 30, 20192 Before acquisition-related expenses, Pro Forma acquisitions3 EUR/USD exchange rate as of June 30, 2019, except for market capitalization which uses the exchange rate as of June 30, 2019
Instrument per Book Value in € million in $ million3 % oftotal cap EBITDA LTM x
Syndicated Credit Agreement: Revolver (€, US-$) 250 285 0.4% Syndicated Credit Agreement: Term Loan A (€, US-$) 2,044 2,326 3.4% Bonds (€, US-$) 5,491 6,249 9.0% Convertible Bonds 959 1,091 1.6% Schuldschein Loans 1,476 1,680 2.4% Commercial Paper 1,000 1,138 1.6% Other debt 875 996 1.4% Total Debt (FSE excl. FMC), gross 12,095 13,764 19.9% Cash (excl. FMC) 545 620 0.9% Total debt (FSE excl. FMC), net 11,550 13,144 19.0% Total FMC debt, net 8,175 9,303 13.5% Consolidation Adjustments (82) (93)Total consolidated debt, net 19,643 22,354 32.4% 3.2x Market capitalization1 41,046 46,710 67.6% 6.8x
Total capitalization 60,689 69,064 100.0% 10.0x FSE Group EBITDA2 6,047
General Credit Presentation, August 2019, © Fresenius SE & Co. KGaA Investor Relations

4
Fresenius Group: Capitalization – June 30, 2019 according to IFRS 16
24
1 Based on market capitalization for FSE and FMC as of June 30, 20192 Before acquisition-related expenses, Pro Forma acquisitions3 EUR/USD exchange rate as of June 30, 2019, except for market capitalization which uses the exchange rate as of June 30, 2019
Instrument per Book Value in € million in $ million3 % oftotal cap EBITDA LTM x
Syndicated Credit Agreement: Revolver (€, US-$) 250 285 0.4% Syndicated Credit Agreement: Term Loan A (€, US-$) 2,044 2,326 3.1% Bonds (€, US-$) 5,491 6,249 8.3% Convertible Bonds 959 1,091 1.4% Schuldschein Loans 1,476 1,680 2.2% Commercial Paper 1,000 1,138 1.5% Lease Obligations 1,774 2,019 2.7% Other debt 691 786 1.0% Total Debt (FSE excl. FMC), gross 13,685 15,574 20.6% Cash (excl. FMC) 545 620 0.8% Total debt (FSE excl. FMC), net 13,140 14,953 19.8% Total FMC debt, net 12,488 14,211 18.8% Consolidation Adjustments (212) (241) (0.3%)Total consolidated debt, net 25,416 28,923 38.2% 3.6x Market capitalization1 41,046 46,710 61.8% 5.9x
Total capitalization 66,462 75,633 100.0% 9.5x FSE Group EBITDA2 6,971
General Credit Presentation, August 2019, © Fresenius SE & Co. KGaA Investor Relations

Fresenius Group: Broad Mix of Financing Instruments
General Credit Presentation, August 2019, © Fresenius SE & Co. KGaA Investor Relations 25
Commercial Paper 9%
Other financial Liabilities 10%
Syndicated loans 22% Bonds 46%
Equity-neutralconvertible bonds 6%
Total B/S Debt1:
~€21,106 m
1 As of June 30, 2019; adjusted for IFRS 16 effect
• Optimize funding costs and ensure financial flexibility
• Diversify investor base
• Strong liquidity provided by sufficient financial cushion (~€2.7 billion as of June 30, 2019)
Well Positioned to Meet Financing NeedsSchuldschein Loans 7%
Average interest rate/cost of debt2.4% p.a.

26
Fresenius Group:Debt Maturity Profile – June 30, 20191,2
1,940 1,443 1,268 2,316 351 500 0 0 440 0 0 0
1,449
8861,917
2,265
315
2,071500
0 907 0
500
0 0 5000
500
1,000
1,500
2,000
2,500
3,000
3,500
4,000
4,500
5,000
2019 2020 2021 2022 2023 2024 2025 2026 2027 2028 2029 2030 2031 2032
Fresenius Medical Care Fresenius excl. Fresenius Medical Care
Maturity 3.1 years on
average
1 – Based on utilization of major financing instruments2 – Excluding IFRS 16 adjustments
€m
General Credit Presentation, August 2019, © Fresenius SE & Co. KGaA Investor Relations

Fresenius Group excl. Fresenius Medical Care:Debt Maturity Profile – June 30, 20191,2
500714 700
264
1,150
500700
500 500
76
153
9031,172
106
300
393
52
421
207
500
500
873
127
0
500
1,000
1,500
2,000
2,500
2019 2020 2021 2022 2023 2024 2025 2026 2027 2028 2029 2030 2031 2032
Bonds Syndicated Loan Schuldschein Loans Equity-neutral convertible bonds Commercial Papers
Maturity 3.7 years on
average
27
1 – Based on utilization of major financing instruments2 – Excluding IFRS 16 adjustments
€m
General Credit Presentation, August 2019, © Fresenius SE & Co. KGaA Investor Relations

23% 23% 23% 23%
34% 32% 36% 33%
43% 45% 41% 44%
Dec 31, 15 Dec 31, 16 Dec 31, 17 Dec 31, 18
Equity and noncontrolling interest Debt Other liabilities
Fresenius Group: Solid Balance Sheet Structure
Healthy Equity and Liability Split
• Strong equity ratio of >40% on average
• Equity ratio kept in narrow range despite rapid growth of Fresenius Group
General Credit Presentation, August 2019, © Fresenius SE & Co. KGaA Investor Relations 28
43.2 46.7 53.1 56.7
B/S total (€bn)

Fresenius Group: Strong Access to Capital Markets
29
Major Financing Instruments
2009 2010 2011 2012 2013 2014 2015 2016 2017 2018 2019
Bonds€425 m$500 m
€250 m €800 m$1.05 bn
€750 m$1.5 bn
€500 m €1.2 bn$1.2 bn
$300 m €2.6 bn €500 m €1.0 bn$500 m²
SyndicatedLoans
$3.5 bn $898 m $3.85 bn $1.8 bn€2.45 bn
$4.1 bn€700 m
$1.15 bn€2.05 bn
€5.30 bn$3.55 bn
SchuldscheinLoans
€200 m €400 m €125 m €500 m €112 m $400 m €1.0 bn
Convertible Bonds
€900 m €500 m
Equity€1.0 bn €400 m1
1 Private Placement in connection with the acquisition of Quirónsalud2 Incl. June 20, 2019 new $500 Mio. 2019-2029 Bond issued by Fresenius Medical Care
General Credit Presentation, August 2019, © Fresenius SE & Co. KGaA Investor Relations

Fresenius SE: Rating History & Rationale
General Credit Presentation, August 2019, © Fresenius SE & Co. KGaA Investor Relations 30
“FSE delivers solid organic growth thanks to positive underlying growth trends in the life-saving and life-sustaining products and therapies that the group offers.” S&P Jan 08, 2019
“FSE’s rating remains anchored in investment-grade, given its mature and defensive business risk profile, the group’s deleveraging ability based on free cash flow generation, and its record of integrating acquisitions successfully and reducing financial leverage in line with communicated policies.” Fitch Sep 20, 2018
“The Baa3 long term issuer rating of FSE reflects its strong defensive business profile underpinned by large absolute scale, global footprint and segmental diversification within the healthcare market, supported by strong position in its four business segments.” Moody’s May 15, 2018
Rating History Rating Agencies’ Key Statements
In May 2019, S&P upgraded Fresenius to BBB with stable outlook.
S&P Moody‘s Fitch
Corporate Credit Rating BBB Baa3 BBB-
Outlook stable stable stable
Current Credit Ratings

Fresenius Group: 2019 Financial Outlook by Business Segment
General Credit Presentation, August 2019, © Fresenius SE & Co. KGaA Investor Relations 31
€m (except otherwise stated) FY/18 Base1 FY/19e2
Sales growth3 (cc) 16,026 3% – 7%
Net income growth3,4 (cc) 1,341 -2% to 2%
Sales growth (organic) 6,544 3% – 6%
EBIT growth (cc) 1,139 3% – 6%
Sales growth (organic) 8,993 2% – 5%
EBIT 1,052 -5% to -2%
Sales growth (organic) 1,688 ~10%
EBIT growth 110 15% – 20%
1 Before special items and after adjustments2 Before special items (transaction-related expenses, expenses associated with cost optimization program at FMC, revaluations of biosimilars contingent liabilities), adjusted for IFRS 16 effect3 Excluding effects from NxStage transaction4 Net income attribuitable to shareholders of Fresenius Medical Care AG & Co. KGaA
For a detailed overview of adjustments and special items please see the reconciliation tables on slides 46-53 and for the bases.
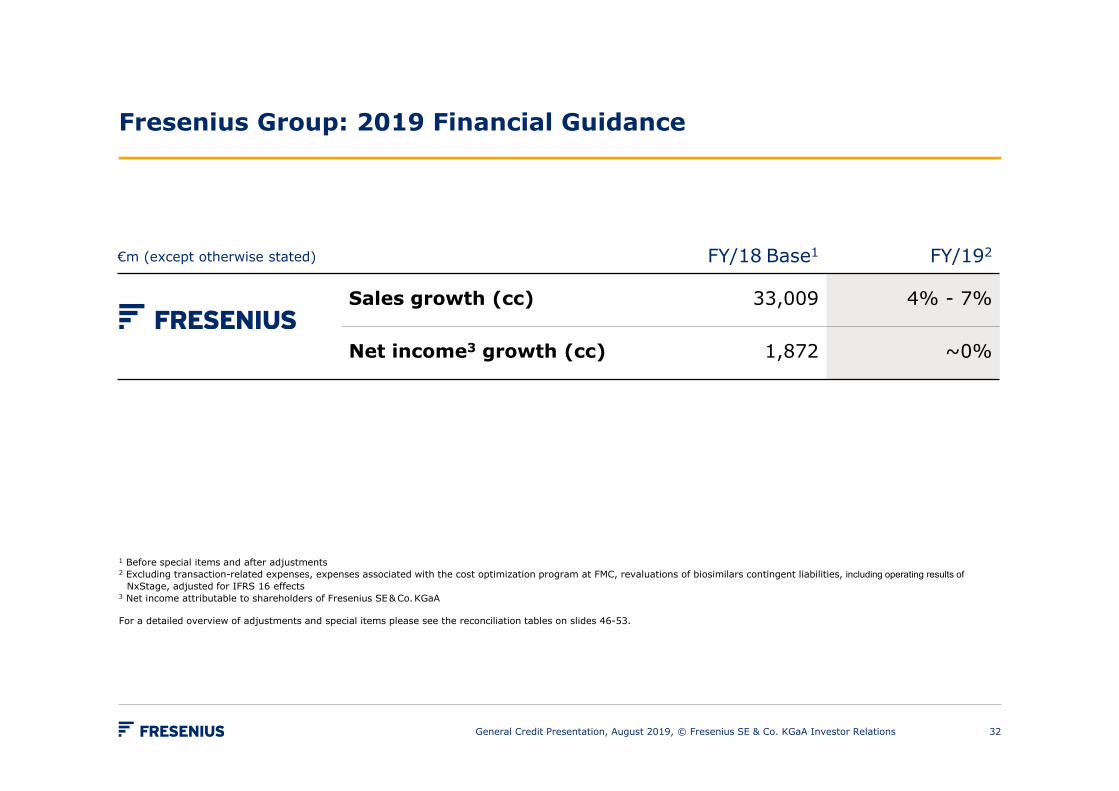
€m (except otherwise stated) FY/18 Base1 FY/192
Sales growth (cc) 33,009 4% - 7%
Net income3 growth (cc) 1,872 ~0%
Fresenius Group: 2019 Financial Guidance
1 Before special items and after adjustments2 Excluding transaction-related expenses, expenses associated with the cost optimization program at FMC, revaluations of biosimilars contingent liabilities, including operating results of
NxStage, adjusted for IFRS 16 effects3 Net income attributable to shareholders of Fresenius SE & Co. KGaA
For a detailed overview of adjustments and special items please see the reconciliation tables on slides 46-53.
32General Credit Presentation, August 2019, © Fresenius SE & Co. KGaA Investor Relations

Fresenius Group: Healthy Growth Targets 2020 – 2023 (CAGRs)
General Credit Presentation, August 2019, © Fresenius SE & Co. KGaA Investor Relations 33
Organic sales growth 4 – 7% (plus ~1% small to mid-size acquisitions)
Organic net income1 growth 5 – 9% (plus ~1% small to mid-size acquisitions)
1 Net income attributable to shareholders of Fresenius SE & Co. KGaA
Before special items

FY/18 base for Fresenius Group Guidance FY/19
General Credit Presentation, August 2019, © Fresenius SE & Co. KGaA Investor Relations 34
€m
Sales reported 33,530
Divestitures of Care Coordination activities at FMC (H1/18) -521
Sales basis for growth rates 33,009
Net Income reported 2,027
Transaction Costs, Akorn, Biosimilars 25
Bridge Financing Costs Akorn 12
Revaluations of Biosimilars contingent liabililties 5
Impact of FCPA related charge 9
Gain related to divestitures of Care Coordination activities -207
Net income (before special items) 1,871
Divestitures of Care Coordination activities at FMC (H1/18) 1
Net income basis for growth rates (before special items and after adjustments) 1,872

FY/18 base for Fresenius Medical Care Outlook FY/19
General Credit Presentation, August 2019, © Fresenius SE & Co. KGaA Investor Relations 35
€m
Sales reported 16,547
Divestitures of Care Coordination activities at FMC (H1/18) -521
Sales basis for growth rates 16,026
Net Income reported 1,982
Impact of FCPA related charge 28
Gain related to divestitures of Care Coordination activities -673
Net income (before special items) 1,337
Divestitures of Care Coordination activities at FMC (H1/18) 4
Net income basis for growth rates (before special items and after adjustments) 1,341

FY/18 base for Fresenius Kabi Outlook FY/19
General Credit Presentation, August 2019, © Fresenius SE & Co. KGaA Investor Relations 36
€m
Sales basis for growth rates 6,544
Transaction Costs Akorn, Biosimilars 34
Revaluations of Biosimilars contingent liabililties 7
EBIT (before special items = base for Kabi guidance) 1,139
The special items are reported in the Group Corporate/Other segment.

IFRS 16 effect on Group P&L
General Credit Presentation, August 2019, © Fresenius SE & Co. KGaA Investor Relations
€m
Q2/19 before special items adjusted for
IFRS 16 effect IFRS 16 effect
Q2/19 before special itemsaccording to
IFRS 16
H1/19 before special items adjusted for
IFRS 16 effect IFRS 16 effect
H1/19 before special itemsaccording to
IFRS 16
Sales 8,779 -18 8,761 17,296 -40 17,256EBITDA 1,461 242 1,703 2,942 462 3,404Depreciation and amortization -380 -205 -585 -750 -406 -1,156EBIT 1,081 37 1,118 2,192 56 2,248Net interest -122 -58 -180 -255 -106 -361Income taxes -219 5 -214 -448 13 -435Noncontrolling interest -260 7 -253 -544 20 -524Net income1
480 -9 471 945 -17 928
37
1 Net income attributable to shareholders of Fresenius SE & Co. KGaA

IFRS 16 effect on Group Balance Sheet and Cash Flow
General Credit Presentation, August 2019, © Fresenius SE & Co. KGaA Investor Relations
Balance Sheet
€m
June 30, 2019adjusted for
IFRS 16 effect IFRS 16 effect
June 30, 2019according to
IFRS 16
Right-of-use-assets 1901 5,587 5,777Lease liabilities 4142 5,773 6,187Equity 25,568 -186 25,382Total assets 59,342 5,587 64,929
38
1 Reclassification from machinery, equipment and rental equipment under capital leases as of December 31, 20182 Reclassifications from capital lease obligations and other liabilities as of December 31, 2018
Cash Flow
€m
Q2/19adjusted for
IFRS 16 effect IFRS 16 effect
Q2/19according to
IFRS 16
H1/19adjusted for
IFRS 16 effect IFRS 16 effect
H1/19according to
IFRS 16
Operating cash flow 1,023 182 1,205 1,141 353 1,494Cash flow before acquisitions and dividends 467 182 649 128 353 481
Free cash flow -437 182 -255 -2,719 353 -2,366Cash provided by/used for financing activities 373 -182 191 1,456 -353 1,103

Fresenius Group: Credit Highlights
General Credit Presentation, August 2019, © Fresenius SE & Co. KGaA Investor Relations 39
Consistent Cash Generation
Proven Track Record of Deleveraging Following Acquisitions
Broad Mix of Financing Instruments
Well-Balanced Maturity Profile
Solid Balance Sheet Structure
Strong Access to Capital Markets

Attachments
General Credit Presentation, August 2019, © Fresenius SE & Co. KGaA Investor Relations 40

Fresenius Group: Key Figures
General Credit Presentation, August 2019, © Fresenius SE & Co. KGaA Investor Relations 41
1 2018 and 2017 before special items; 2018, 2017 and 2016 pro forma acquisitions/divestitures2 2018 and 2017 before special items 3 2016 pro forma Quirónsalud acquisition: 3.154 2016 pro forma Quirónsalud acquisition: 3.09
2018 2017 2016
Debt (€m) thereof US$ denominated
18,98428%
19,04231%
14,78052%
Net debt (€m) 16,275 17,406 13,201
Net debt/EBITDA1,3
Net debt at year-end exchange rate; EBITDA at LTM average FX rates
2.73 2.79 2.39
Net debt/EBITDA1,4
at LTM average FX rates for both net debt and EBITDA
2.71 2.84 2.33
Operating Cash flow/Sales 11.2% 11.6% 12.2%
EBITDA/Interest2 10.5 9.6 9.5

42
Fresenius Group: Debt and Cash Flow Structure – June 30, 2019 adj. for IFRS 16
1 Incl. Fresenius financing subsidiaries2 Controlling stake3 Incl. subsidiaries 4 Based on market capitalization for FMC as of June 30, 20195 Via German holding entities (Fresenius Kabi AG and Fresenius ProServe GmbH)
Fresenius Medical Care
Financing
Fresenius SE Financing
Group Net Debt: ~€19.6 bn
Dividends,Rents, Service Agreements
~31%2 100% 77%100%
- €227 m Net Debt3 €108 m Net Debt3 €40 m Net Debt3€8,175 m Net Debt3
Profit transfer Agreements5
• Separate financing of Fresenius SE and Fresenius Medical Care
• No joint financing facilities or mutual guarantees
• Fresenius Kabi, Fresenius Helios and Fresenius Vamed financed primarily through Fresenius SE to avoid structural subordination
FSE Net Debt:~€11.5 bn
incl. Net Debt of Kabi/Helios/Vamed
StockMarketValue~€6.5 bn4 FSE Net Debt1:
~€11.4 bn
General Credit Presentation, August 2019, © Fresenius SE & Co. KGaA Investor Relations

43
Fresenius Group: Debt and Cash Flow Structure – June 30, 2019 accord. to IFRS 16
1 Incl. consolidation adjustments2 Incl. Fresenius financing subsidiaries3 Controlling stake4 Incl. subsidiaries 5 Based on market capitalization for FMC as of June 30, 20196 Via German holding entities (Fresenius Kabi AG and Fresenius ProServe GmbH)
Fresenius Medical Care
Financing
Fresenius SE Financing
Group Net Debt: ~€25.4 bn1
Dividends,Rents, Service Agreements
~31%3 100% 77%100%
€114 m Net Debt4 €993 m Net Debt4 €354 m Net Debt4€12,488 m Net Debt4
Profit transfer Agreements6
• Separate financing of Fresenius SE and Fresenius Medical Care
• No joint financing facilities or mutual guarantees
• Fresenius Kabi, Fresenius Helios and Fresenius Vamed financed primarily through Fresenius SE to avoid structural subordination
FSE Net Debt:~€13.1 bn
incl. Net Debt of Kabi/Helios/Vamed
StockMarketValue~€6.5 bn5 FSE Net Debt2:
~€11.6 bn
General Credit Presentation, August 2019, © Fresenius SE & Co. KGaA Investor Relations

Fresenius Group: Cash Flow
General Credit Presentation, August 2019, © Fresenius SE & Co. KGaA Investor Relations 44
€m 2018 Margin 2017 Margin ∆ YoY
Operating Cash Flow 3,742 11.2% 3,937 11.6% -5%
Capex (net) -2,077 -6.2% -1,705 -5.0% -22%
Free Cash Flow(before acquisitions and dividends)
1,665 5.0% 2,232 6.6% -25%
Acquisitions (net) -613 -5,865 --
Dividends -904 -924 2%
Free Cash Flow(after acquisitions and dividends) -1,374 -4.1% -4,557 -13.4% --

Fresenius Group: Financial Results by Business Segment
General Credit Presentation, August 2019, © Fresenius SE & Co. KGaA Investor Relations 45
2018 2017 2016 Growth2
2018/2017
Sales €16,547 m €17,784 m €16,570 m 4%1
EBIT €2,306 m €2,562 m €2,409 m 6%1
Sales €6,544 m €6,358 m €6,007 m 7%
EBIT €1,139 m €1,177 m €1,171 m 2%
Sales €8,993 m €8,668 m €5,843 m 6%
EBIT €1,052 m €1,052 m €683 m 3%
Sales €1,688 m €1,228 m €1,160 m 19%
EBIT €110m €76 m €69 m 9%
Sales €33,530 m €33,886 m €29,471 m 6%
EBIT €4,561 m €4,830 m €4,302 m -1%Group
2018 and 2017 before special items
1 FMC on a comparable basis2 Growth rates at constant currency and after adjustments

Fresenius Group: Margins by Business Segment
General Credit Presentation, August 2019, © Fresenius SE & Co. KGaA Investor Relations 46
2018 and 2017 before special items
2018 2017 2016
EBITDA margin 18.3% 18.5% 18.8%
EBIT margin 13.9% 14.4% 14.5%
EBITDA margin 21.9% 23.3% 24.4%
EBIT margin 17.4% 18.5% 19.5%
EBITDA margin 15.9% 16.5% 15.0%
EBIT margin 11.7% 12.1% 11.7%
EBITDA margin 7.9% 7.1% 6.9%
EBIT margin 6.5% 6.2% 5.9%
EBITDA margin 17.9% 18.5% 18.7%
EBIT margin 13.6% 14.3% 14.6%Group

Fresenius SE & Co. KGaA: Overview Bonds
General Credit Presentation, August 2019, © Fresenius SE & Co. KGaA Investor Relations 47
Issuer Volume(in millions)
Coupon type
Coupon (in %)
Maturity/Term
ISIN (RegS)
WKN
Fresenius SE & Co. KGaA€500 Fix 2.875 2013/2020 XS0873432511 A1HEWZ
Fresenius SE & Co. KGaA€450 Fix 3.00 2014/2021 XS1013955379 A1ZB7H
Fresenius SE & Co. KGaA€450 Fix 4.00 2014/2024 XS1026109204 A1ZC60
Fresenius SE & Co. KGaA€ 500 Fix 1.875 2019/2025 XS1936208252 A2NBMS
Fresenius SE & Co. KGaA€ 500 Fix 2.875 2019/2029 XS1936208419 A2NBMT
Fresenius Finance Ireland plc.€700 Fix 0.875 2017/2022 XS1554373164 A19B3F
Fresenius Finance Ireland plc.€700 Fix 1.50 2017/2024 XS1554373248 A19B3G
Fresenius Finance Ireland plc.€700 Fix 2.125 2017/2027 XS1554373677 A19B3H
Fresenius Finance Ireland plc.€500 Fix 3.00 2017/2032 XS1554373834 A19B3J
Fresenius US Finance II, Inc.US$300 Fix 4.25 2014/2021 USU31436AG04 A1ZDVJ
Fresenius US Finance II, Inc.US$300 Fix 4.50 2015/2023 USU31436AH86 A1Z64A

Fresenius Group: Reconciliation
General Credit Presentation, August 2019, © Fresenius SE & Co. KGaA Investor Relations
€m Q2/19 Q2/18 growth rate growth rate (cc)
Net income reported (after special items) 471 652 -28% -29%Transaction costs Akorn 1 27Bridge Financing Costs Akorn - 4Revaluations of biosimilars contingent liabilities 1 -Gain related to divestitures of Care Coordination activities -3 -211Transaction costs NxStage 0 -Expenses associated with the cost optimization program at FMC 1 -
Net income (before special items) 471 472 0% -2%Divestitures of Care Coordination activities at FMC (Q2/2018) - 1
IFRS 16 effect 9 -Net income on a comparable basis 480 473 1% 0%
48

Fresenius Group: Reconciliation
General Credit Presentation, August 2019, © Fresenius SE & Co. KGaA Investor Relations
€m H1/19 H1/18 growth rate growth rate (cc)Sales reported 17,256 16,503 5% 2%Divestitures of Care Coordination activities (H1/2018) at FMC (Fresenius Medical Care) - -509
IFRS 16 effect 40 -Sales on a comparable basis 17,296 15,994 8% 6%
EBIT reported (after special items) 2,233 2,979 -25% -28%Transaction costs Akorn 3 39Bridge Financing Costs Akorn - 1Revaluations of biosimilars contingent liabilities -4 -Gain related to divestitures of Care Coordination activities -11 -820Transaction costs NxStage 20 -Expenses associated with the cost optimization program at FMC 7 -
EBIT (before special items) 2,248 2,199 2% -1%Divestitures of Care Coordination activities at FMC (H1/2018) - -14
IFRS 16 effect -56 -EBIT on a comparable basis 2,192 2,185 0% -3%
Net interest reported (after special items) -363 -307 -18% -15%Bridge Financing Costs Akorn - 7Revaluations of biosimilars contingent liabilities 2 -Net interest (before special items) -361 -300 -20% -17%Divestitures of Care Coordination activities at FMC (H1/2018) - 21
IFRS 16 effect 106 -Net interest on a comparable basis -255 -279 9% 10%
49

Fresenius Group: Reconciliation
General Credit Presentation, August 2019, © Fresenius SE & Co. KGaA Investor Relations
€m H1/19 H1/18 growth rate growth rate (cc)Income taxes reported (after special items) -430 -558 23% 25%Transaction costs Akorn 0 -8Bridge Financing Costs Akorn - -2Revaluations of biosimilars contingent liabilities 0 -Gain related to divestitures of Care Coordination activities 2 147Transaction costs NxStage -5 -Expenses associated with the cost optimization program at FMC -2 -
Income taxes (before special items) -435 -421 -3% 0%Divestitures of Care Coordination activities at FMC (H1/2018) - -1
IFRS 16 effect -13 -Income taxes on a comparable basis -448 -422 -6% -2%
Noncontrolling interest reported (after special items) -516 -1,022 50% 52%
Gain related to divestitures of Care Coordination activities 6 466Transaction costs NxStage -11 -Expenses associated with the cost optimization program at FMC -3 -
Noncontrolling interest (before special items) -524 -556 6% 10%Divestitures of Care Coordination activities at FMC (H1/2018) - -4
IFRS 16 effect -20 -Noncontrolling interest on a comparable basis -544 -560 3% 8%
50

Fresenius Group: Reconciliation
General Credit Presentation, August 2019, © Fresenius SE & Co. KGaA Investor Relations
€m H1/19 H1/18 growth rate growth rate (cc)
Net income reported (after special items) 924 1,092 -15% -18%Transaction costs Akorn 3 31Bridge Financing Costs Akorn - 6Revaluations of biosimilars contingent liabilities -2 -Gain related to divestitures of Care Coordination activities -3 -207Transaction costs NxStage 4 -Expenses associated with the cost optimization program at FMC 2 -
Net income (before special items) 928 922 1% -2%Divestitures of Care Coordination activities at FMC (H1/2018) - 2
IFRS 16 effect 17 -Net income on a comparable basis 945 924 2% 0%
51

Reconciliation according to Fresenius Medical Care
General Credit Presentation, August 2019, © Fresenius SE & Co. KGaA Investor Relations
€m Q2/19 Q2/18 growth rate growth rate (cc)
Sales reported 4,345 4,214 3% 0%Divestitures of Care Coordination activities (Q2/2018) - -258IFRS 16 effect 18 -NxStage operations -79 -Sales adjusted 4,284 3,956 8% 5%
EBIT reported 521 1,401 -63% -65%Gain related to divestitures of Care Coordination activities -11 -833Divestitures of Care Coordination activities (Q2/2018) - -10IFRS 16 effect -30 -NxStage operations 4 -Transaction costs NxStage 4 -Expenses associated with the cost optimization program 3 -EBIT adjusted 491 558 -12% -17%
Net income reported 254 994 -74% -76%Gain related to divestitures of Care Coordination activities -9 -686Divestitures of Care Coordination activities (Q2/2018) - 0IFRS 16 effect 10 -NxStage operations 19 -Transaction costs NxStage 3 -Expenses associated with the cost optimization program 2 -Net income adjusted 279 308 -9% -14%
52

Reconciliation according to Fresenius Medical Care
General Credit Presentation, August 2019, © Fresenius SE & Co. KGaA Investor Relations
€m H1/19 H1/18 growth rate growth rate (cc)
Sales reported 8,478 8,189 4% -1%Divestitures of Care Coordination activities (H1/2018) - -509IFRS 16 effect 40 -NxStage operations -109 -Sales adjusted 8,409 7,680 9% 5%
EBIT reported 1,058 1,898 -44% -47%Gain related to divestitures of Care Coordination activities -11 -820Divestitures of Care Coordination activities (H1/2018) - -14IFRS 16 effect -48 -NxStage operations 16 -Transaction costs NxStage 20 -Expenses associated with the cost optimization program 7 -EBIT adjusted 1,042 1,064 -2% -7%
Net income reported 525 1,273 -59% -61%Gain related to divestitures of Care Coordination activities -9 -674Divestitures of Care Coordination activities (H1/2018) - 5IFRS 16 effect 28 -NxStage operations 33 -Transaction costs NxStage 15 -Expenses associated with the cost optimization program 5 -Net income adjusted 597 604 -1% -6%
53

Reconciliation Fresenius Medical Care according to Fresenius Group
General Credit Presentation, August 2019, © Fresenius SE & Co. KGaA Investor Relations
€m Q2/19 Q2/18 growth rate growth rate (cc)
Sales reported 4,345 4,214 3% 0%Divestitures of Care Coordination activities (Q2/2018) - -258IFRS 16 effect 18 -Sales on a comparable basis 4,363 3,956 10% 7%
EBIT reported (after special items) 521 1,401 -63% -65%Gain related to divestitures of Care Coordination activities -11 -833Transaction costs NxStage 4 -Expenses associated with the cost optimization program 3 -EBIT (before special items) 517 568 -9% -14%Divestitures of Care Coordination activities (Q2/2018) - -10IFRS 16 effect -31 -EBIT on a comparable basis 486 558 -13% -17%
Net income reported (after special items) 254 994 -74% -76%Gain related to divestitures of Care Coordination activities -9 -686Transaction costs NxStage 3 -Expenses associated with the cost optimization program 2 -Net income (before special items) 250 308 -19% -23%Divestitures of Care Coordination activities (Q2/2018) - 0IFRS 16 effect 10 -Net income on a comparable basis 260 308 -16% -20%
54

Reconciliation Fresenius Medical Care according to Fresenius Group
General Credit Presentation, August 2019, © Fresenius SE & Co. KGaA Investor Relations
€m H1/19 H2/18 growth rate growth rate (cc)
Sales reported 8,478 8,189 4% -1%Divestitures of Care Coordination activities (H1/2018) - -509IFRS 16 effect 40 -Sales on a comparable basis 8,518 7,680 11% 7%
EBIT reported (after special items) 1,058 1,898 -44% -47%Gain related to divestitures of Care Coordination activities -11 -820Transaction costs NxStage 20 -Expenses associated with the cost optimization program 7 -EBIT (before special items) 1,074 1,078 0% -5%Divestitures of Care Coordination activities (H1/2018) - -14IFRS 16 effect -48 -EBIT on a comparable basis 1,026 1,064 -4% -8%
Net income reported (after special items) 525 1,273 -59% -61%Gain related to divestitures of Care Coordination activities -9 -674Transaction costs NxStage 15 -Expenses associated with the cost optimization program 5 -Net income (before special items) 536 599 -11% -15%Divestitures of Care Coordination activities (H1/2018) - 5IFRS 16 effect 28 -Net income on a comparable basis 564 604 -7% -11%
55

Reconciliation Fresenius Kabi
General Credit Presentation, August 2019, © Fresenius SE & Co. KGaA Investor Relations
€m Q2/19 Q2/18 growth rate growth rate (cc)
Sales reported 1,691 1,604 5% 5%
Transaction costs Akorn 1 34Revaluations of biosimilars contingent liabilities 3 -EBIT (before special items) 309 289 7% 5%IFRS 16 effect -1 -EBIT on a comparable basis 308 289 7% 4%
Transaction costs Akorn 0 27Revaluations of biosimilars contingent liabilities 2 -Net income (before special items) 209 185 13% 11%IFRS 16 effect 2 -Net income on a comparable basis 211 185 14% 12%
56

Reconciliation Fresenius Kabi
General Credit Presentation, August 2019, © Fresenius SE & Co. KGaA Investor Relations
€m H1/19 H1/18 growth rate growth rate (cc)
Sales reported 3,392 3,207 6% 4%
Transaction costs Akorn 3 39Revaluations of biosimilars contingent liabilities -4 -EBIT (before special items) 613 557 10% 6%IFRS 16 effect -2 -EBIT on a comparable basis 611 557 10% 6%
Transaction costs Akorn 2 31Revaluations of biosimilars contingent liabilities -1 -Net income (before special items) 411 355 16% 11%IFRS 16 effect 3 -Net income on a comparable basis 414 355 17% 12%
57

Reconciliation Fresenius Helios
General Credit Presentation, August 2019, © Fresenius SE & Co. KGaA Investor Relations
€m Q2/19 Q2/18 growth rate
Sales reported 2,349 2,343 0%German post-acute care business transferred from Fresenius Helios to Fresenius Vamed - -117
Sales adjusted for German post-acute care business 2,349 2,226 6%
EBIT reported 276 293 -6%IFRS 16 effect -2 -EBIT adjusted for IFRS 16 effect 274 293 -6%German post-acute care business transferred from Fresenius Helios to Fresenius Vamed - -7
EBIT adjusted for IFRS 16 effect and German post-acute care business 274 286 -4%
58

Reconciliation Fresenius Helios
General Credit Presentation, August 2019, © Fresenius SE & Co. KGaA Investor Relations
€m H1/19 H1/18 growth rate
Sales reported 4,660 4,674 0%German post-acute care business transferred from Fresenius Helios to Fresenius Vamed - -227
Sales adjusted for German post-acute care business 4,660 4,447 5%
EBIT reported 544 571 -5%IFRS 16 effect -4 -EBIT adjusted for IFRS 16 effect 540 571 -5%German post-acute care business transferred from Fresenius Helios to Fresenius Vamed - -10
EBIT adjusted for IFRS 16 effect and German post-acute care business 540 561 -4%
59

Reconciliation Fresenius Vamed
General Credit Presentation, August 2019, © Fresenius SE & Co. KGaA Investor Relations
€m Q2/19 Q2/18 growth rate
Sales reported 467 266 76%German post-acute care business acquired from Fresenius Helios -119 -
Sales adjusted for German post-acute care business 348 266 31%
EBIT reported 22 12 83%IFRS 16 effect -2 -EBIT adjusted for IFRS 16 effect 20 12 67%German post-acute care business acquired from Fresenius Helios -12 -
EBIT adjusted for IFRS 16 effect and German post-acute care business 8 12 -33%
60

Reconciliation Fresenius Vamed
General Credit Presentation, August 2019, © Fresenius SE & Co. KGaA Investor Relations
€m H1/19 H1/18 growth rate
Sales reported 907 515 76%German post-acute care business acquired from Fresenius Helios -229 -
Sales adjusted for German post-acute care business 678 515 32%
EBIT reported 34 18 89%IFRS 16 effect -3 -EBIT adjusted for IFRS 16 effect 31 18 72%German post-acute care business acquired from Fresenius Helios -16 -
EBIT adjusted for IFRS 16 effect and German post-acute care business 15 18 -17%
61

Financial Calendar / Contact
Financial Calendar 30 July 2019 Results Q2/19
29 October 2019 Results Q3/19
Please note that these dates could be subject to change.
ContactInvestor RelationsFresenius SE & Co. KGaAphone: +49 6172 608-2485e-mail: [email protected] further information and current news: www.fresenius.com
Follow us on Twitter www.twitter.com/fresenius_irand LinkedIn: www.linkedin.com/company/fresenius-investor-relations
General Credit Presentation, August 2019, © Fresenius SE & Co. KGaA Investor Relations 62