Presentation to Analysts - Indian Overseas Bank Core Banking Migration was adjudged amongst Top 100...
40
Good People to Grow With Presentation to Analysts December 2016 (in INR)
Transcript of Presentation to Analysts - Indian Overseas Bank Core Banking Migration was adjudged amongst Top 100...
Good People to Grow With
Presentation to Analysts
December 2016
(in INR)

2Good People to Grow With
INDEX
3
Particularsslide
NoParticulars
slide
No
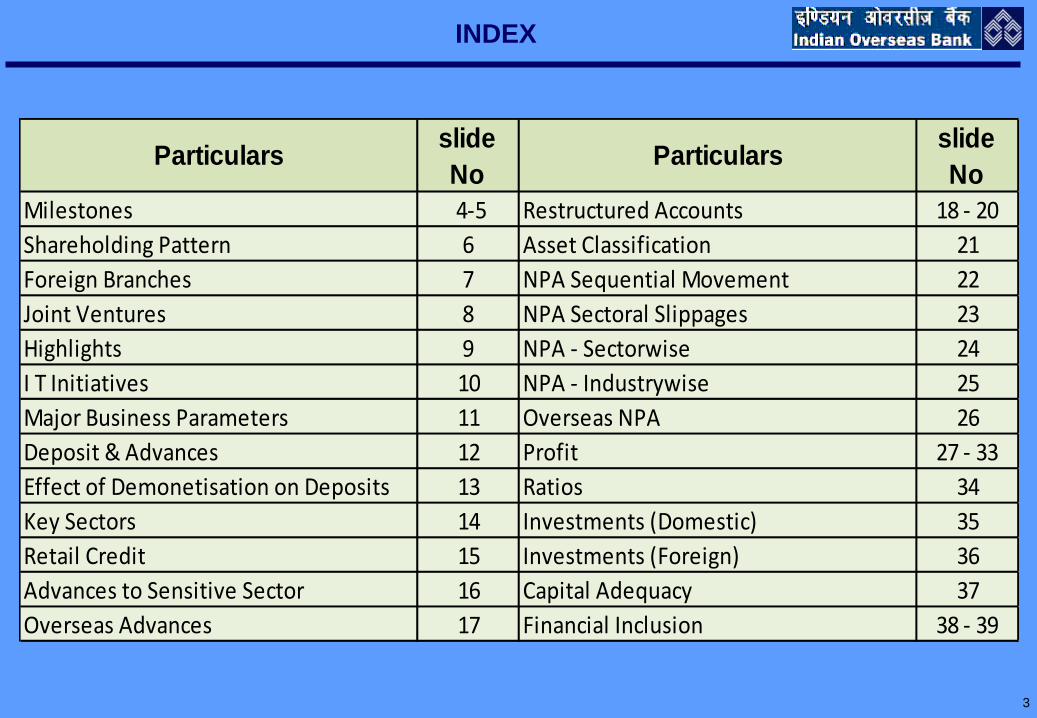
Milestones 4-5 Restructured Accounts 18 - 20
Shareholding Pattern 6 Asset Classification 21
Foreign Branches 7 NPA Sequential Movement 22
Joint Ventures 8 NPA Sectoral Slippages 23
Highlights 9 NPA - Sectorwise 24
I T Initiatives 10 NPA - Industrywise 25
Major Business Parameters 11 Overseas NPA 26
Deposit & Advances 12 Profit 27 - 33
Effect of Demonetisation on Deposits 13 Ratios 34
Key Sectors 14 Investments (Domestic) 35
Retail Credit 15 Investments (Foreign) 36
Advances to Sensitive Sector 16 Capital Adequacy 37
Overseas Advances 17 Financial Inclusion 38 - 39

4
Milestones IOB Young at 79 Years
1937 Opening of Bank Branch simultaneously in India & Abroad
1938 Opening Branch in Kuala Lumpur
1941 Opening Branch in Singapore
1945 Opening Branch in Colombo
1955 Opening Branch in Hong Kong
1957 Bank established its own training centre
1960s Was a decade of inorganic expansion for the Bank. The Bank took over:
The Coimbatore Standard Bank Ltd., The Nanjinnad Bank Ltd.,
The Coimbatore Vasunthara Bank Ltd., The Kulitalai Bank Ltd.,
The Srinivasaperumal Bank and The Venkateswara Bank
1964 Inauguration of IOB’s Head Office in Mount Road – A monument of highest banking tradition
1969 Nationalisation of the Bank
1973 Formation of United Asian Bank Berhad (Indian Bank / IOB / United Commercial Bank)
1974 Official Language Department established in 1974
1977 Bank opened its Tsim Tsa Tsui Branch at Kowloon side of Hongkong
1990 Took over Bank of Tamilnad
1991 Bank moved its Staff College premises to a own spacious learning zone at Koyambedu
2000 Initial Public Offer. Follow on Public Offer in 2003
2005 Launched Debit Card

Milestones - IOB Young at 79 Years
2006 Launched VISA card, Retail Sale of Gold and Non Life Joint Insurance
Bank reached INR 1 lac crore mark in Total Business
2006-07 Bharat Overseas Bank Ltd. was merged with IOB
2007 First Off site ATM at Kamatchi Hospital, Chennai
2009 100% CBS
2011-12 No. of Branches in Tamil Nadu reached 1000, IOB celebrated Platinum Jubilee
2012-13 Received National Award For Excellence in MSME Lending and for outstanding performance for
implementing PMEGP programme in South Zone.
2012-13 Received BANKERS' EXCELLENCE AWARD from ROTARY INTERNATIONAL, USA
2013-14 3000th Branch Vaniangudi opened on 17.8.2013 by Hon. Finance Minister
IOB adjudged Best Public Sector Bank in Priority Sector Lending by Dun & Bradstreet.
The New Indian Express and Sunday Standard's Best Bankers' Award presented to IOB
Agriculture Leadership Award 2013 conferred to our Bank
Award for "BEST RSETI IN THE COUNTRY received by our RSETI Thanjavur
2015-16 IOB has migrated from In-house CBS software “CROWN” to “FINACLE”
IOB adjudged1) Skoch Order of Merit for Financial Inclusion & Automated Data Flow/MIS Project
2) IBA award for The Best use of Data
2016-17 As on 31.12.2016, Total Deposit INR 2,10,861 cr.; Total Advances INR 1,53,875 cr. Total Business Mix is at
INR 3,64,736 cr. No. of Branches – 3394
“Express Intelligent PSU Award” received for implementation of CBS migration to Finacle 10.x Project.
Our Core Banking Migration was adjudged amongst Top 100 Projects in India and conferred “Skoch
Order of Merit” Award during 46th Skoch Summit. 5
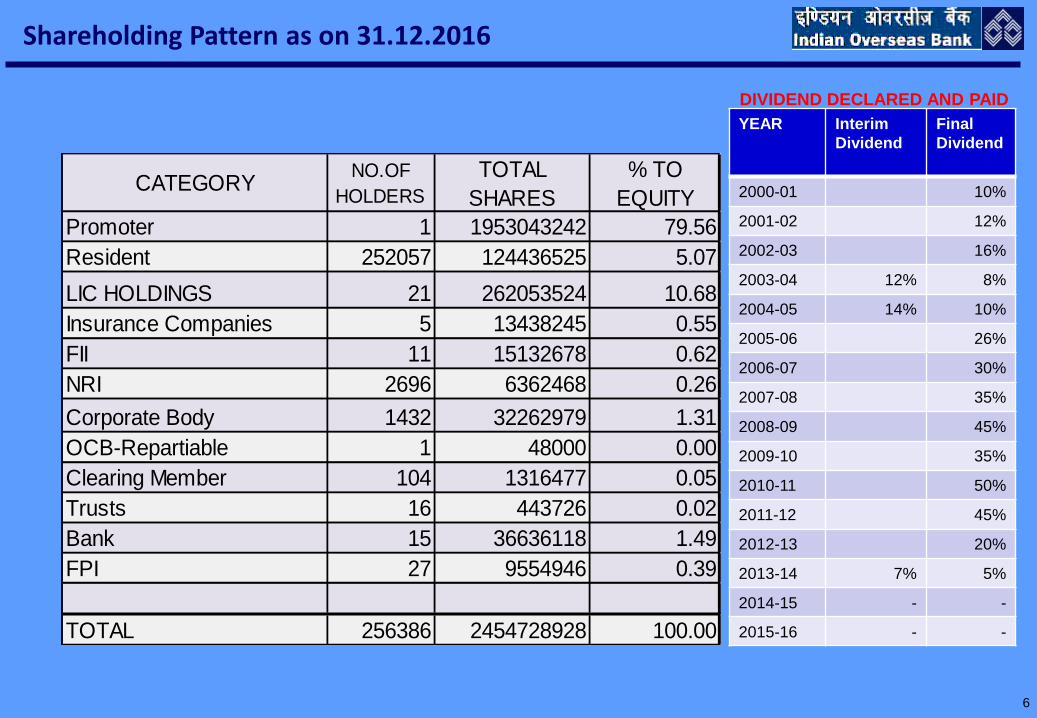
Shareholding Pattern as on 31.12.2016
DIVIDEND DECLARED AND PAID
YEAR Interim
Dividend
Final
Dividend
2000-01 10%
2001-02 12%
2002-03 16%
2003-04 12% 8%
2004-05 14% 10%
2005-06 26%
2006-07 30%
2007-08 35%
2008-09 45%
2009-10 35%
2010-11 50%
2011-12 45%
2012-13 20%
2013-14 7% 5%
2014-15 - -
2015-16 - -
6
CATEGORYNO.OF
HOLDERS
TOTAL
SHARES
% TO
EQUITY
Promoter 1 1953043242 79.56
Resident 252057 124436525 5.07
LIC HOLDINGS 21 262053524 10.68
Insurance Companies 5 13438245 0.55
FII 11 15132678 0.62
NRI 2696 6362468 0.26
Corporate Body 1432 32262979 1.31
OCB-Repartiable 1 48000 0.00
Clearing Member 104 1316477 0.05
Trusts 16 443726 0.02
Bank 15 36636118 1.49
FPI 27 9554946 0.39
TOTAL 256386 2454728928 100.00

Global Footprints – Foreign Branches of the Bank
Singapore -
Serangoon Road
Singapore - Boon Lay
Guangzhou – China
Dubai
Remittance
Centres
Representative
Office
Branches
Singapore
Hong Kong Main
Hong Kong TST
Colombo
Bambalapitiya
Seoul
Bangkok
Sukhumvit, Bangkok
Malaysia:Joint Venture with Bank of Baroda (40%) and Andhra Bank (25%) with our Bank share of 35%
Colombo branches migrated to Finacle Software similar to domestic branches and other overseas branches to be migrated before
March 2017.
J V
Subsidiary
Malaysia
7

Strategic Investments - Joint Ventures
IOB entered into Non Life Insurance Business with Universal Sompo General Insurance (USGI) Company Limited with equity
participation of 19% along with the Following Banks and Institutions
Joint venture Equity Contributors % INR Crs
Allahabad Bank 30 105.00
Indian Overseas Bank 19 66.50
Karnataka Bank 15 52.50
Dabur Investments 10 35.00
Universal Sompo Insurance Inc 26 91.00
Total 100 350.00
8
The Company has entered into Bancassurance tie up with Allahabad Bank, IOB and Karnataka Bank.
Our Bank has entered into Corporate Agency arrangements with effect from 20.12.08 for distribution of USGI products
Bank earned net commission of Rs. 1.87 crore on Health Care Policy in the current financial year up to 31.12.2016.
During the current year up to 31.12.2016, the Bank earned commission from Non Life Sompo (Asset) insurance Rs. 4.04 Crore

Highlights-31.12.2016
Business Mix is Rs. 3,64,736 Crores.
Deposits stood at Rs. 2,10,861 Crores.
CASA Ratio is 36.19 %
Advances stood at Rs 1,53,875 Crores
Operating Profit for Q3 - Dec16 is Rs. 854.64 Crores.
Net Loss for Q3 - Dec16 stands at Rs. 554 Crores
Provision Coverage Ratio is 52.17 %
Gross N.P.A. stood at Rs. 34,502 Crores. (22.42 %)
Net N.P.A. stood at Rs.19,901 Crores. (14.32%)
9

10
IT Initiatives
Core Banking Solution : The Bank has successfully migrated Overseas Branches at Colombo to Finacle 10.2.17
version and other overseas branches will follow soon.
Developments in CBS: Online Retail Loan Processing in Intranet
Reports regarding SBN (Specified Bank Notes) demonetised and new currencies has been deployed for branches /
RO / CO.
Digital Banking Developments : As part of Digital transformation in the Bank, the following IT products are
implemented.
IOB PAY: IOB Pay with Internet Banking has been implemented.
USSD : Non-financial transactions has been implemented.
USSD (*99#) - IMPS using Aadhaar: Currently, IMPS in USSD can be done in any of the following ways:
- Using Account number & using MMID.
UPI : Bank has gone live as issuer in BHIM app of Government of India.
PrePaid Card: VISA Prepaid Cards are launched in Pilot stage.
PAYMENT GATEWAY : Around 80 direct merchants and 4 merchant aggregators are connected to our paymnent
Gateway. The payment gateway application is PCIDSS compliant.
Mobile Banking: The Bank has implemented Mobile POS at 4,500 merchant locations through our service provider
M/s. Bijli Pay. With the recent less-cash thrust, GPRS POS terminals are being deployed across the country in an
aggressive manner.
REACH THROUGH SOCIAL MEDIA.
Bank has recently launched a Twitter account IOBIndia.
A Facebook page named IOB-My Pride has been recently launched for our employees.

Major Business Parameters
Quarter endingINR Crs
11
Key Performance Indicators Dec 15 Mar-16 Jun-16 Sep 16 Dec 16
Business Mix 410,019 397,241 384,040 367,580 364,736
Deposits 230,670 224,514 218,484 208,058 210,861
Advances (Gross) 179,349 172,727 165,556 159,522 153,875
Operating Profit 625 714 691 1,064 855
Net Profit / Net Loss (1425) (936) (1451) (765) (554)
N I M (%) 1.93 1.88 1.87 2.02 2.14
Gross NPA 22,672 30,049 33,913 34724 34,502
Net NPA 14,174 19,213 21,321 20765 19,901
Return on Assets (%) -ve -ve -ve -ve -ve
Return on Equity (%) -ve -ve -ve -ve -ve
Book Value (INR) 72.61 57.62 20.22 40.65 38.39

Deposits & Advances INR Crs
12
Particulars 31.12.2016 31.12.2015 31.03.2016DEPOSITS 210,861 230,670 224,515
Current 12,371 12,066 12,082
Savings 63,933 48,643 52,404
Term Deposits 134,557 169,961 160,029
CASA 76,304 60,709 64,486
CASA RATIO % 36.19 26.32 29.10
ADVANCES 153,875 179,349 172,727
BUSINESS MIX 364,736 410,019 397,242
CD RATIO % 72.97 77.75 76.93
Particulars METRO Urban Semi Urban RuralDEPOSITS (Domestic) 109,307 46,027 32,025 18,639
% 53.06 22.34 15.55 9.05
ADVANCES (Domestic) 88,756 20,818 18,042 13,823
% 62.75 14.72 12.76 9.77

Effect of Demonetisation on Deposits INR Crs
13
As on METRO Urban Semi Urban Rural
31.12.2016 109,307 46,027 32,025 18,639
30.09.2016 102,648 51,149 29,878 18,075
30.06.2016 109,671 52,949 28,887 17,603
31.03.2016 117,409 54,439 28,529 18,179
Particulars 31.12.2016 30.09.2016 30.06.2016 31.03.2016
DEPOSITS 210,861 208,058 218,483 224,515
Current 12,371 10,674 13,117 12,082
Savings 63,933 53,680 52,799 52,404
Term Deposits 134,557 143,704 152,567 160,029
CASA 76,304 64,354 65,916 64,486
CASA Ratio 36.19 30.93 30.17 29.10
Business Mix 364,736 367,580 384,040 397,242

Key Sectors (Domestic Credits)
INR Crs
14
Sector Dec-15 Mar-16 Dec-16
Agriculture 26,903 30,237 29,064
MSME 29,228 31,804 26,377
of Which Micro 12,086 12,097 8,785
Retail Credit 18,495 23,044 20,304

Retail Credit (Breakup)
INR Crs
Jewel Loan to Others portfolio included in Retail Credit from 2nd Half of 2012-13
15
Sector Dec 15 Mar 16 Dec-16
Retail Credit 18,496 23,044 20,304
of Which
- Housing Loans 8,525 9,099 8,755
- Pushpaka 1,504 1,672 1,851
- Educational Loan 4,320 4,442 4,708
- Others 1,899 3,847 3,042
- Jewel Loan to Others 2,248 3,984 1,947

Advances to Sensitive Sectors - Domestic
INR Crs (FUND + NON FUND)
16
Sector Dec 15 Mar 16 Dec 16
Capital Market 1,440 1,473 1,337
Real Estate 24,684 26,342 20,443
of Which
Housing Loan * 10,813 12,721 12,019
Commercial Real Estate 7,475 7,239 5,476
Others (Direct & Indirect) 6,396 6,382 2,938
* Includes Non-Priority Housing Loans
INR Crs
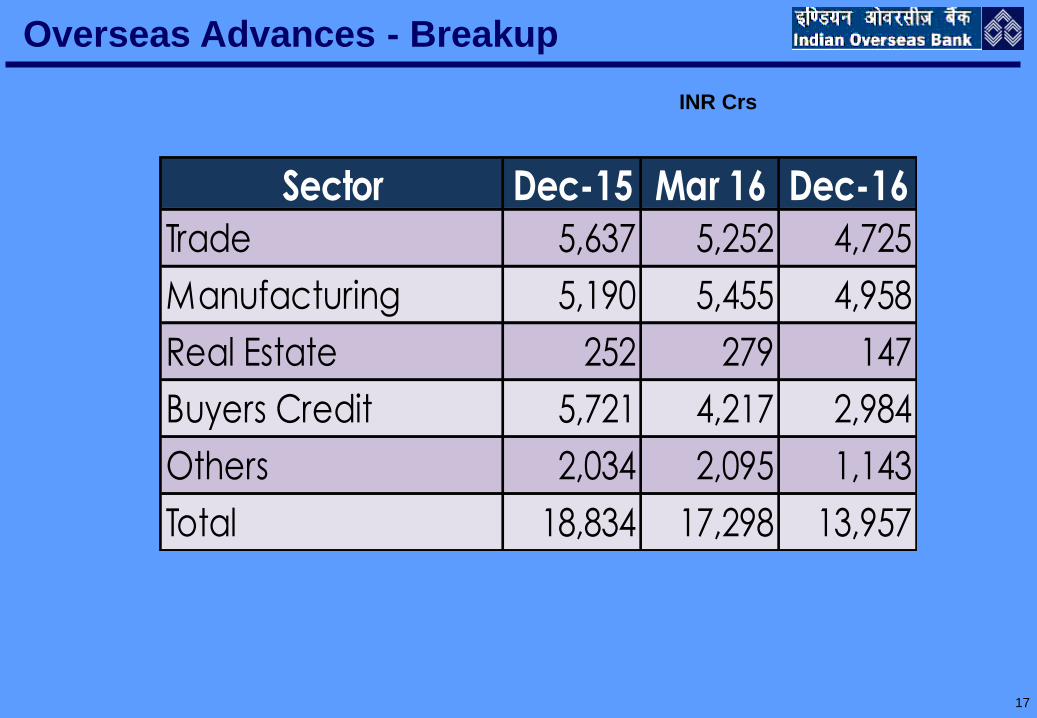
Overseas Advances - Breakup
17
Sector Dec-15 Mar 16 Dec-16
Trade 5,637 5,252 4,725
Manufacturing 5,190 5,455 4,958
Real Estate 252 279 147
Buyers Credit 5,721 4,217 2,984
Others 2,034 2,095 1,143
Total 18,834 17,298 13,957

Restructured Accounts Outstanding Position As On 31.12.2016 INR Crs
Contd….. 18
Sector31.03.2016
Accounts
31.03.2016
Amount
31.03.2016
%
31.12.2016
Accounts
31.12.2016
Amount
31.12.2016
%
Chemical & Pharma 7 346 2 8 494 3
Sugar 2 24 0 2 27 0
Textile 13 605 4 12 621 4
Iron & Steel 41 3606 22 32 3034 19
Auto & Ancillary 3 391 2 3 425 3
Paper 4 99 1 4 257 2
Food Processing 5 347 2 4 350 2
Engineering 11 1656 10 3 843 5
Telecom 2 139 1 1 142 1
Metal Processing 3 406 2 4 503 3
Power 17 4302 26 20 4108 26
Airways 0 0 0 0 0 0
Electronic & Software 1 26 0 1 26 0
Cement 3 329 2 2 123 1
Logistics 1 5 0 1 5 0
Other Industries 16 757 5 11 1262 8
Sub Total 129 13038 78 108 12221 78

Restructured Accounts Outstanding Position As On 31.12.2016 .. contdINR Crs
19
Sector31.03.2016
Accounts
31.03.2016
Amount
31.03.2016
%
31.12.2016
Accounts
31.12.2016
Amount
31.12.2016
%
Sub Total 129 13038 78 108 12221 78
SME 119 589 4 92 536 3
Micro Finance 4 116 1 4 113 1
Infrastructure 26 2301 14 24 2356 15
Comm. Real Estate(CRE) 4 49 0 2 46 0
Trade 10 38 0 9 33 0
Agriculture 60 336 2 53 176 1
HL/EDU/Others 36 53 0 31 53 0
Real Estate
(Other than CRE) 2 96 1 2 113 1
Ceramic, Granite, Marble 3 7 0 2 2 0
Rubber & Plastic 5 51 0 3 54 0
GRAND TOTAL 398 16675 100 330 15705 100
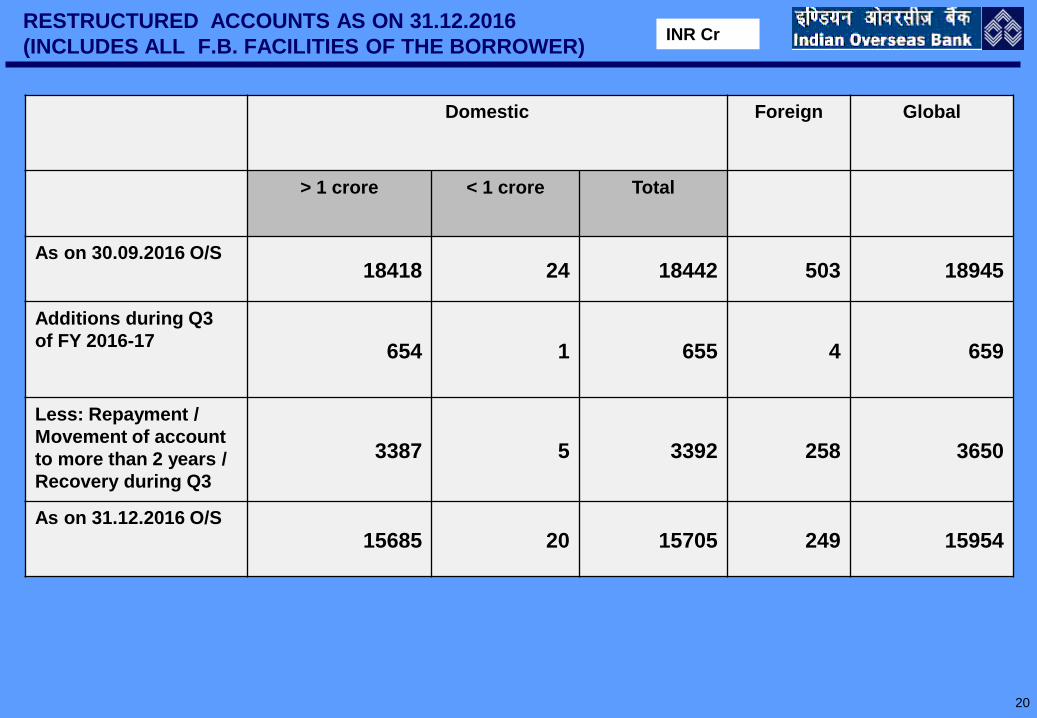
RESTRUCTURED ACCOUNTS AS ON 31.12.2016
(INCLUDES ALL F.B. FACILITIES OF THE BORROWER) INR Cr
20
Domestic Foreign Global
> 1 crore < 1 crore Total
As on 30.09.2016 O/S18418 24 18442 503 18945
Additions during Q3
of FY 2016-17654 1 655 4 659
Less: Repayment /
Movement of account
to more than 2 years /
Recovery during Q3
3387 5 3392 258 3650
As on 31.12.2016 O/S
15685 20 15705 249 15954

Asset Classification wise details of Restructured Accounts
Outstanding
RESTRUCTURED Accounts slipped - ( INR 1 Crore & above)-Domestic
21
Asset Classification
No. of
Accounts
(31.03.2016)
Amount
(INR Crs)
(31.03.2016)
% to Total
No. of
Accounts
(31.12.2016)
Amount
(INR Crs)
(31.12.2016)
% to Total
Standard Assets154 9904 59 95 8245 52
Sub-Standard Assets99 2784 17 63 1833 12
Doubtful Assets144 3983 24 172 5627 36
Loss Assets1 4 0 0 0 0
Total398 16675 100 330 15705 100
Dec 15 Mar 16 Jun 16 Sep 16 Dec 16
No. of A/Cs Slipped
during the quarter 14 40 34 9 6
Amount in INR Crs1346 1749 1115 463 136

NPA SEQUENTIAL MOVEMENT INR Crs
22
Particulars Dec 15 Mar 16 Jun 16 Sep 16 Dec 16
OPENING GROSS NPA 19424 22672 30049 33913 34724
ADD Slippages 4393 9323 5330 2881 1892
LESS
Cash Recovery 379 505 458 574 324
Upgradation 421 480 346 917 1106
Write Off 332 769 408 528 648
Sale to ARC 13 192 253 0 0
Exchange Fluctuation 0 0 0 51 0
De-recog. Interest 0 0 0 0 36
Total Reduction in NPA 1145 1946 1465 2070 2114
Provision for Bad & Doubtful Debts 7116 9405 11100 12393 13130
CLOSING GROSS NPA 22672 30049 33913 34724 34502
Net NPA 14174 19213 21321 20765 19901
Gross NPA Ratio % 12.64 17.40 20.48 21.77 22.42
Net NPA Ratio % 8.32 11.89 13.97 14.30 14.32
Provision Coverage Ratio % 50.36 47.39 47.61 50.19 52.17
NPA of Overseas Branches
(Included in Gross NPA above)2547 3451 3675 3651 3484
Gross Advances 179349 172727 165556 159522 153875

Sectoral Slippages during the quarter ended 31.12.2016
23
INR Cr.AGRI & ALLIED ACTIVITIES 280
SERVICES 247
PERSONAL LOANS 141
Commercial Real Estate 18
SUB TOTAL(A) 687
INDUSTRY
Other Metal & Metal Products 55
Gems & Jewellery 2
Other Food Processing 98
Text iles 79
Steel 138
Mining 21
Chemical, Dyes, Drugs & Pharma 65
Paper & Paper Products 33
Rubber,Plast ic & their Products 1
All Engineering 22
OTHER INDUSTRIES 592
SUB TOTAL(INDUSTRY)(B) 1106
TOTAL SLIPPAGES DOMESTIC(A+B) 1793
OVERSEAS 47
Exchange Fluctuation 52
TOTAL-GLOBAL 1892

Sector Wise Break Up of NPAs
24
INR Cr
CategoryNPA
% to total
Domestic NPA
Agriculture 3723 11.99
Industry 20899 67.31
Services 3970 12.79
Personal 2455 7.91
Total 31047 100.00
Of Which
Commercial Real Estate 327 1.05
Sectorwise NPAs as on 31.12.2016 (Domestic)

25
INR Cr. NPAs – Industry Wise - Domestic
Sl No IndustryNPA as on
31.12.2016
% to total
Domestic
NPA
1 Cotton Textiles/Other textiles 2123 6.84
2 I ron & Steel 9230 29.73
3 Infrastructure 3648 11.75
4 Chemical ,dyes, paints etc 711 2.29
5 Gems & jewellery 176 0.57
6 Construction 142 0.46
7 Other Metal & Metal Products 1147 3.69
8 Paper & paper products 625 2.01
9 * Food Processing 1307 4.21
10 * Sugar 221 0.71
11 All other Industries 3097 9.98
Total Industry 22426 72.23* Food processing and sugar amounting to Rs 1527.48 cr is
included in agri sector.

INR Crs
Overseas NPAs
26
Sector Dec-15 Mar 16 Dec-16
Trade 1,182.25 1,867.94 1241.30
Manufacturing 585.10 821.51 932.89
Real Estate 75.78 67.41 68.51
Others 703.91 694.63 1241.34
Total 2,547.04 3,451.49 3,484.04

PROFIT - SUMMARY
INR Crs
Quarter Ending
27
Particulars Dec 15 Mar 16 Jun 16 Sep 16 Dec 16
Interest Earned 5,912 5,472 5,215 4,992 4,881
Interest Expended 4,565 4,164 3,970 3,706 3,547
Net Interest Income 1,347 1,308 1,245 1,286 1,335
Non Interest Income 534 686 653 970 718
Total Operating Income 1,881 1,994 1,897 2,255 2,053
Operating Expenses 1,256 1,280 1,207 1,191 1,198
Operating Profit 625 714 690 1,064 855
Total Provision 2,050 1,650 2,141 1,829 1,409
Net Profit (1,425) (936) (1,451) (765) (554)
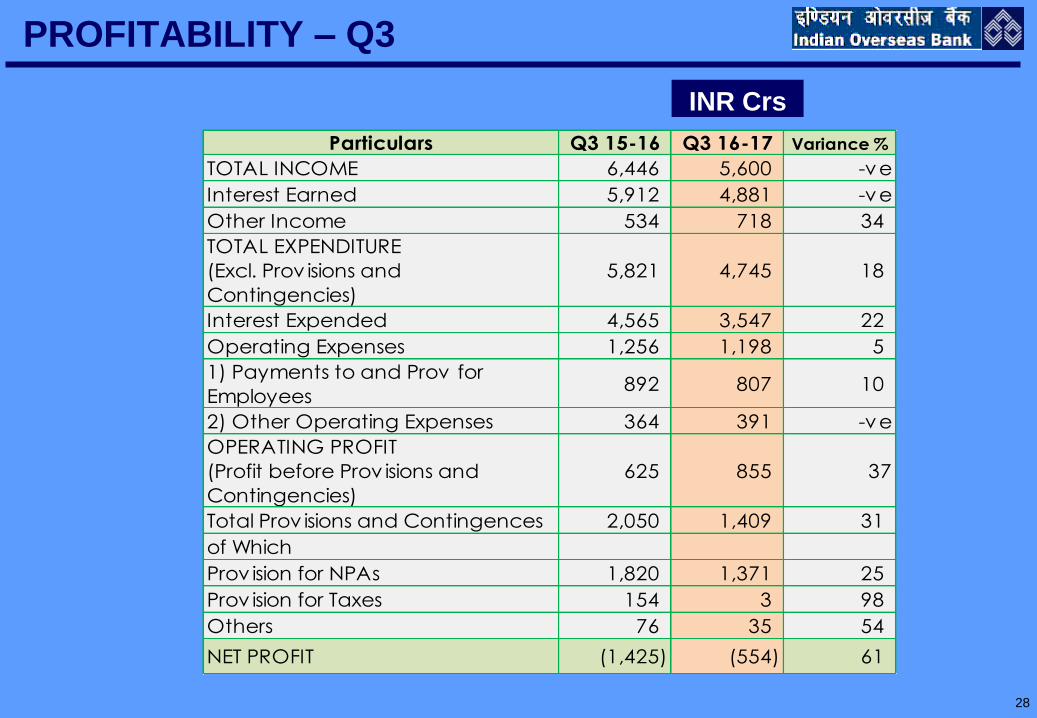
PROFITABILITY – Q3
INR Crs
28
Particulars Q3 15-16 Q3 16-17 Variance %
TOTAL INCOME 6,446 5,600 -ve
Interest Earned 5,912 4,881 -ve
Other Income 534 718 34
TOTAL EXPENDITURE
(Excl. Prov isions and
Contingencies)
5,821 4,745 18
Interest Expended 4,565 3,547 22
Operating Expenses 1,256 1,198 5
1) Payments to and Prov for
Employees892 807 10
2) Other Operating Expenses 364 391 -ve
OPERATING PROFIT
(Profit before Prov isions and
Contingencies)
625 855 37
Total Prov isions and Contingences 2,050 1,409 31
of Which
Prov ision for NPAs 1,820 1,371 25
Prov ision for Taxes 154 3 98
Others 76 35 54
NET PROFIT (1,425) (554) 61

PROFIT – Geographical Distribution – Q3
INR Crs
29
Particulars Q3 15-16 Q3 16-17 Variance %
OPERATING PROFIT
Global 625.00 854.64 36.74
Domestic 577.00 825.61 43.09
Overseas 48.00 29.03 (-ve)
PROVISIONS
Global 2050.00 1409.08 -31.26
Domestic 1858.00 1348.14 -27.44
Overseas 192.00 60.94 -68.26
NET PROFIT/LOSS
Global (1425.00) (554.44) 61.09
Domestic (1281.00) (522.53) 59.21
Overseas (144.00) (31.91) 77.84

PROFIT - NET INTEREST INCOME
INR Crs
30
Dec 15 Mar 16 Jun 16 Sep 16 Dec 16
TOTAL INTEREST INCOME 5,912 5,472 5,216 4,992 4,881
of which
Int Income from Advances 4,198 3,795 3,741 3,649 3,500
Int Income from Investments 1,629 1,594 1,374 1,221 1,254
Other Interest Income 85 83 101 122 127
TOTAL INTEREST EXPENDED 4,565 4,164 3,970 3,706 3,547
of Which
Int Expended on Deposits 3,983 3,713 3,504 3,287 3,182
Int Expended on Borrowings 582 451 466 419 365
Other Int. Expenses - 0.00 0 - 0
NET INTEREST INCOME 1,347 1,308 1,245 1,286 1,335
NET INTEREST MARGIN (%) 1.93 1.88 1.87 2.02 2.14
Domestic (%) 2.02 1.94 1.92 2.08 2.25
Overseas 0.92 1.22 1.36 1.31 0.76
Particulars
Quarter ending
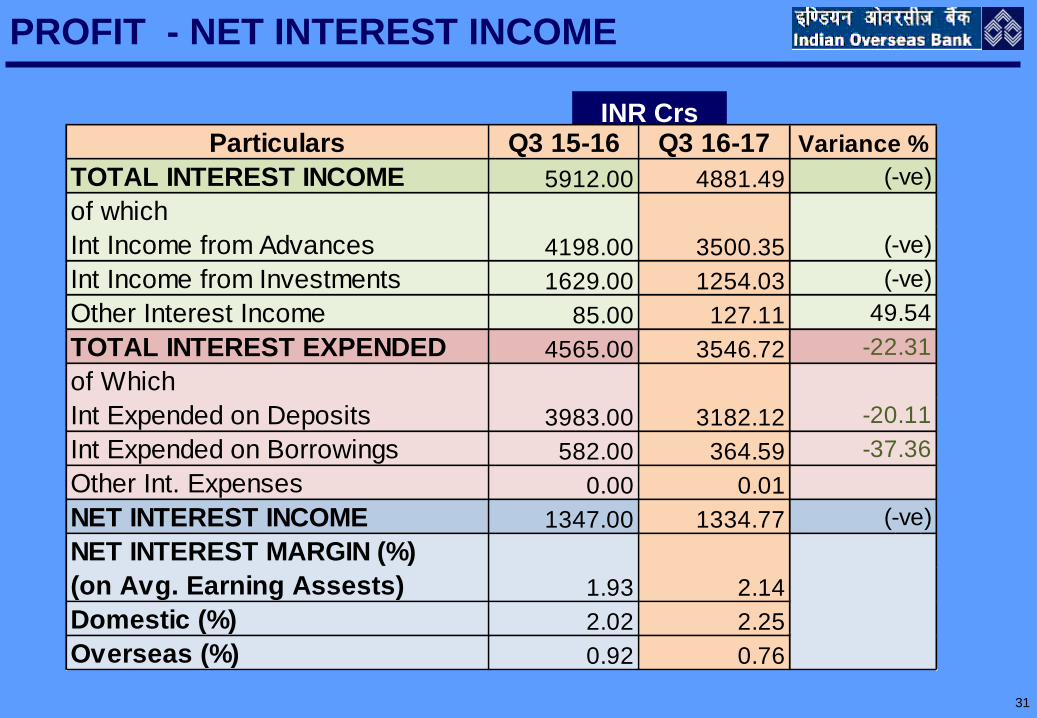
PROFIT - NET INTEREST INCOME
INR Crs
31
Particulars Q3 15-16 Q3 16-17 Variance %
TOTAL INTEREST INCOME 5912.00 4881.49 (-ve)
of which
Int Income from Advances 4198.00 3500.35 (-ve)
Int Income from Investments 1629.00 1254.03 (-ve)
Other Interest Income 85.00 127.11 49.54
TOTAL INTEREST EXPENDED 4565.00 3546.72 -22.31
of Which
Int Expended on Deposits 3983.00 3182.12 -20.11
Int Expended on Borrowings 582.00 364.59 -37.36
Other Int. Expenses 0.00 0.01
NET INTEREST INCOME 1347.00 1334.77 (-ve)
NET INTEREST MARGIN (%)
(on Avg. Earning Assests) 1.93 2.14
Domestic (%) 2.02 2.25
Overseas (%) 0.92 0.76

Non Interest Income (Quarterly Comparison)
INR Crs
Quarter Ending
32
Particulars Dec 15 Mar 16 Jun 16 Sep 16 Dec 16
Total Non Interest Income 534 686 653 970 718
of which
Exchange / Commission 246 283 201 185 202
Profit on Sale of Investments 54 122 155 329 60
Profit on Revaln. Of Investments 0 0 (16) 0 0
Recovery in Written off Accounts 85 135 91 213 249
Other Non Interest Income 149 146 222 243 207

NET PROFIT (Quarterly Comparison) INR Crs
Quarter Ending
33
Particulars Dec 15 Mar 16 Jun 16 Sep 16 Dec 16
OPERATING PROFIT 625 714 691 1064 855
Total Provision 2050 1650 2141 1829 1409
of Which
NPA 1820 3088 2065 1876 1371
Provision for Unhedged FC Exposure 0 0 0 0 0
Standard Advances (60) (167) 98 (115) 59
Prov./Depreciation on Investments 27 (79) 0 (55) 17
Staff Welfare Fund 0 0 0 0 0
Deferred Tax Liability 0 (1249) 0 (31) 0
Income Tax 154 234 3 162 3
Wealth Tax 0 0 0 0 0
Contingencies 1 0 0 0 1
Other General Provisions 0 0 10 (1) 0
Non Performing Investments 1 11 (26) 0 9
Diminution of Securities 0 0 0 0 0
Restructured Accounts 109 (298) (8) (3) (55)
Other Assests (2) 1 0 0 0
Country-wise Risk 0 0 (2) (5) 3
Prov for Restructured Investments 0 109 0 0 0
NET PROFIT / LOSS (1425) (936) (1451) (765) (554)

Cost & Yield Ratios (Quarterly Comparison)
34
Particulars Dec 15 Mar 16 Jun 16 Sep 16 Dec 16
Avg. Cost of Deposits (%) 7.10 6.64 6.42 6.29 6.07
Avg. Yield on Advances (%) 9.25 8.32 8.53 8.65 8.62
Avg. Yield on Investments (%) 7.26 7.22 7.15 7.27 7.11
Avg. Cost of Funds (%) 6.99 6.48 6.45 6.36 6.08
Avg. Yield on Funds (%) 8.48 7.88 7.85 7.83 7.82
Net Interest Margin (%) 1.93 1.88 1.87 2.02 2.14
Business Per Employee (Rs. Crores) 12.59 12.41 12.27 11.93 11.99
Business Per Branch (Rs. Crores) 120.2 116.66 112.65 108.05 107.21
Particulars Dec 15 Mar 16Mar 16
(Annual)Jun 16 Sep 16 Dec 16
Cost to Income Ratio (%) 66.79 64.18 63.53 63.62 52.82 58.37
Return on Assets (%) -ve -ve -ve -ve -ve -ve
Return on Equity (%) -ve -ve -ve -ve -ve -ve
Earning per Share (INR) -ve -ve -ve -ve -ve -ve
Book Value per Share (INR) 72.61 57.62 57.62 20.22 40.65 38.39

INVESTMENTS - Domestic
INR Crs
35
Particulars
AFS HTM HFT TOTAL AFS HTM HFT TOTAL
SLR Investments 17,214.13 46,793.80 20.46 64,028.39 24,973.65 40,571.31 647.97 66,192.93
Of which
Government. Securities 17,214.11 46,790.69 20.46 64,025.26 24,973.63 40,568.20 647.97 66,189.80
Other Approved Securities 0.02 3.11 0.00 3.13 0.02 3.11 0.00 3.13
M Duration (for SLR) 6.05
Non SLR Investments 8,164.25 4,068.46 0.00 12,232.71 7,681.56 4,050.05 0.00 11,731.61
M Duration (Non SLR) 4.74 4.91
M Duration 5.95 4.73
(Entire Portfolio)
Total 25,378.38 50,862.26 20.46 76,261.10 32,655.21 44,621.36 647.97 77,924.54
31.03.2016 31.12.2016

INVESTMENTS – Foreign -31.12.2016
INR Crs
36
Type of InvestmentBook Value
(Gross)
Total
Provision
G - Sec 2925.00 1.15
Bonds - Others 0.00 0.00
MTN,FCCB 526.32 67.42
Shares 0.09 0.00
Joint Venture - Malaysia 199.58 0.00
Total 3650.99 68.57

CAPITAL ADEQUACY
INR Crs
37
Particulars Dec'15 Mar-16 Jun-16 Sep-16 Dec-16
Tier I Capital 14,221 15,040 13,587 14,419 13,799
Tier II Capital 5,094 3,724 3,823 3,288 4,153
Total Capital 19,315 18,764 17,410 17,707 17,952
Common Equity Tier I 12,770 13,787 12,472 13,319 12,699
Total Net Assets (Terminal) 287,706 274,437 268,312 251,900 255,085
Risk Weighted Assets 198,599 194,179 183,871 174,432 166,567
CRAR – TIER I (%) 7.16 7.75 7.39 8.27 8.28
CRAR – TIER II (%) 2.57 1.92 2.08 1.88 2.49
CRAR (%) 9.73 9.66 9.47 10.15 10.78
CET I 6.43 7.10 6.78 7.64 7.62
38
Financial Inclusion
The Business Correspondents (BC) have carried out 54.84 Million transactions
(5,48,49,887) through their Micro ATM devices upto 31.12.2016, since inception of
Financial Inclusion.
Apart from carrying out regular Banking transactions, Business Correspondents also
make payments under Social Security Schemes of State / Central Governments, like
Pension to Widows, Old Age Pension, Payment under Mahatma Gandhi National Rural
Employment Guarantee Scheme (MGNREGS), Cash Dole to Sri Lankan Tamil Refugees,
for which the credits were made directly to the SB accounts of beneficiaries.
BC can open SB accounts through e-KYC mode. As on 31.12.2016, BCs have opened
2,65,020 SB accounts through their Micro ATM, using e-KYC.
BCs are also involved in collection of small value deposits, personal accident insurance
under PMSBY, Life Insurance under PMJJBY, Recovery of assinged NPA accounts,
Aadhaar seedings, etc.,

39
Financial Inclusion
As on 31.12.2016, our enrolment count under Jan Suraksha and Pension
Schemes are as follows:
Jan Suraksha Schemes:
Pension Schemes:
Schemes Status of
renewal as on
30.06.2016
Enrolment
during Q2 &
Q3 of 2016-17
Status of
enrolment as
on 31.12.16
(Cumulative)
PMJJBY 814028 15134 829162
PMSBY 2637866 29562 2667428
Total 3451894 44696 3496590
2015-2016 (Cumulative) 18,540
2016-2017 (Cumulative) 45,309
Total APY Enrolments 63,849

4040
Thank You