Presentation: TM-30, Color Preference, and More · TM-30, Color Preference, and More . 3 R a (CRI)...
98
Michael Royer, Ph.D. Lightfair April 27, 2016 Lighting Engineer Pacific Northwest National Laboratory TM-30, Color Preference, and More
Transcript of Presentation: TM-30, Color Preference, and More · TM-30, Color Preference, and More . 3 R a (CRI)...

Michael Royer, Ph.D. Lightfair
April 27, 2016 Lighting Engineer
Pacific Northwest National Laboratory
TM-30, Color Preference, and More

3
Ra (CRI) = 77
Ra (CRI) = 83
R9 = 22
Ra (CRI) = 75
R9 = 20

4

5
Ra (CRI) = 98 Ra (CRI) = 77
Ra (CRI) = 83
R9 = 83 R9 = 22

6

7
1. Can I accurately predict how the colors in a space will appear?
2. Will a given appearance be liked (or perceived as natural,
saturated, etc.)?
3. How will color quality evolve in a changing lighting industry?
Topics

8
Is TM-30 More Accurate?
CRI Calculation Engine (1974) TM-30 Calculation Engine (2015)
CIE 1964 U*V*W* CAM02-UCS (CIECAM02)
Von Kries CAT CIE CAT02
8 color samples 99 color samples
Medium chroma/lightness
Spectral sensitivity varies
Uniform color space coverage
Spectral sensitivity neutral
Variety of real objects Munsell samples only
Technical
Improvement
Ref Illuminant Step Function Ref Illuminant Continuous (Uses same reference sources, but
blended between 4500 K and 5500 K)
No lower limit for scores 0 to 100 scale (fidelity)
Nice to Have
Fidelity Only Fidelity, Gamut, Graphical, Hues Philosophical
Change

9
TM-30: A Set of Tools for Understanding Color Rendition
Fidelity Index (Rf)
Gamut Index (Rg)
High Level Average Values
TM-30 Calculation Engine
Modern Color Science New Color Samples
Color Vector Graphic
Color Distortion Graphic
Graphical Representations
Skin Fidelity (Rf,skin)
Fidelity by Hue (Rf,h#)
Chroma Shift by Hue (Rcs,h#)
Fidelity by Sample (Rf,CES#)
Specific Sample Fidelity
R9
CRI Calculation Engine
Outdated Color Science Limited Color Samples
Ra (CRI)
Average Fidelity
Detailed Values

10
Color Fidelity
Fidelity Index (Rf)
The accurate rendition of color
so that they appear as they
would under familiar
(reference) illuminants
(0-100)
TM-30 Method for Evaluating Color Rendition

11
Perfect Fidelity
Increase
Saturation
Decrease
Saturation
Positive Hue Shift
Negative Hue Shift
CRI = 80 CRI = 80
Constant Fidelity (CRI)
(Also possible to change
lightness, not shown)

12
Color Shifts
Desaturating
(more dull)
Saturating
(more vivid)
Hue shift
(more orange)
Hue shift
(more pink)
Reference color

13
What’s the reference?
4000K
4500K 5000K
5000K
5500K
6000K
CCT ≥ 5000 K CCT < 5000 K
CIE D Series
(Model of Daylight)
Planckian Radiation
(Think Incandescent)
CRI:
CCT ≥ 5500 K 5500 K > CCT > 4500 K CCT ≤ 4500 K
CIE D Series
(Model of Daylight)
Planckian Radiation
(Think Incandescent)
Proportional blend of
D Series and Planckian
TM-30:

14
Reference Sources

15
49 point spread (error) in fidelity score at CRI of 80.
40
50
60
70
80
90
100
50 60 70 80 90 100
TM-3
0 R
f
CIE Ra
5,000 Real and Modelled* SPDs *All modelled SPDs composed of combinations of Gaussian primaries; chromaticity on Planckian locus between 2700 K and 7000 K
For more information: Smet KAG, David A, Whitehead L. 2015. Why color space uniformity and sample set spectral uniformity are essential for color rendering measures. Leukos 12(1–2):39–50.

16
Color Fidelity
Fidelity Index (Rf)
TM-30 Method for Evaluating Color Rendition
The accurate rendition of color
so that they appear as they
would under familiar
(reference) illuminants
(0-100)
Color Gamut
The average level of
saturation relative to familiar
(reference) illuminants.
Gamut Index (Rg)
~60-140 when Rf > 60

17
60
70
80
90
100
110
120
130
140
50 60 70 80 90 100
Gam
ut
Ind
ex, R
g
Fidelity Index, Rf
Reduced Fidelity
Incr
ease
d S
atur
atio
n D
ecre
ased
Sat
urat
ion
Reference
Illuminant
• Evaluate tradeoffs between fidelity and saturation.
• Cohesive system from the same calculation engine.
• But average values don’t
tell the whole story…

18
Gamut Shape
Changes over different
hues
Color Vector Graphic
Hue Bin Fidelity
Hue Bin Chroma Shift
Color Fidelity
Fidelity Index (Rf)
The accurate rendition of color
so that they appear as they
would under familiar
(reference) illuminants
(0-100)
Color Gamut
The average level of
saturation relative to familiar
(reference) illuminants.
Gamut Index (Rg)
~60-140 when Rf > 60
TM-30 Method for Evaluating Color Rendition

19
Rf = 75 | Rg = 100 | CCT = 3500 K Rf = 75 | Rg = 100 | CCT = 3500 K
Decreased Saturation
Increased Saturation
Hue Shift
Color Vector Graphics and Gamut Shape
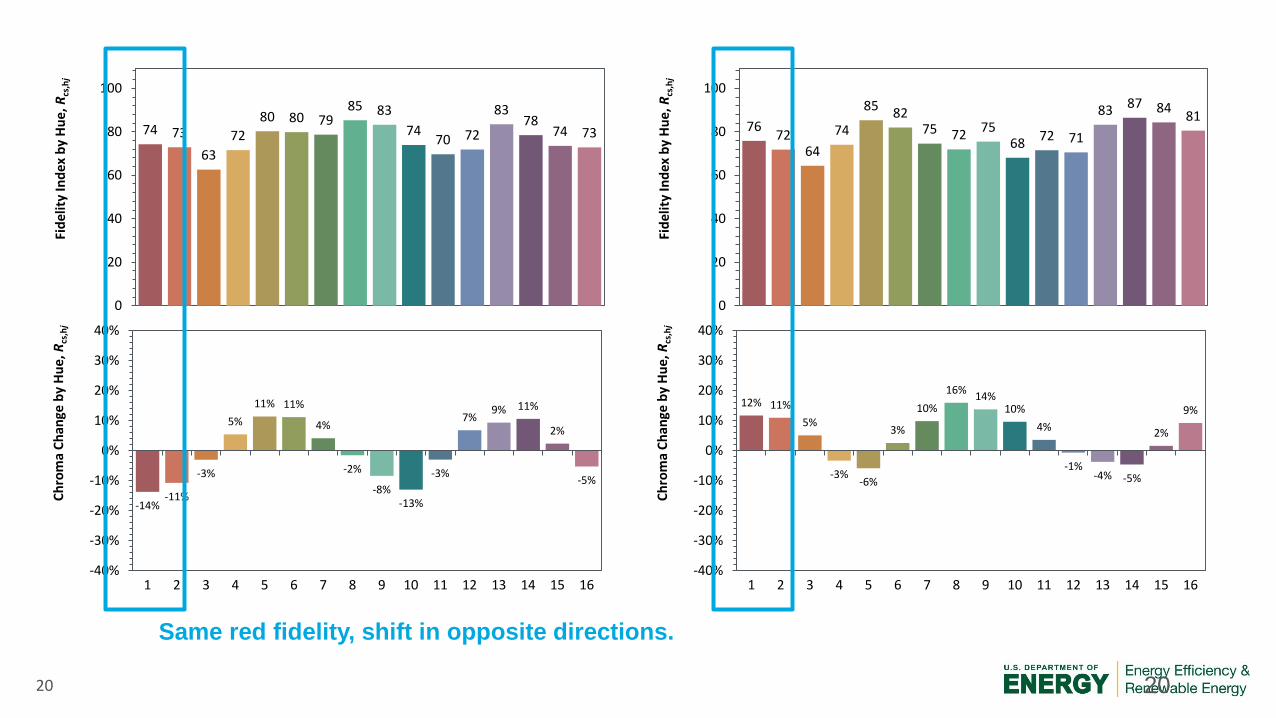
20 20
76 72
64
74
85 82 75 72
75 68
72 71
83 87 84 81
0
20
40
60
80
100
Fid
elit
y In
de
x b
y H
ue
, Rcs
,hj
12% 11%
5%
-3% -6%
3%
10%
16% 14%
10%
4%
-1% -4% -5%
2%
9%
-40%
-30%
-20%
-10%
0%
10%
20%
30%
40%
1 2 3 4 5 6 7 8 9 10 11 12 13 14 15 16
Ch
rom
a C
han
ge b
y H
ue,
Rcs
,hj
74 73
63
72
80 80 79 85 83
74 70 72
83 78
74 73
0
20
40
60
80
100
Fid
elit
y In
de
x b
y H
ue
, Rcs
,hj
-14% -11%
-3%
5%
11% 11%
4%
-2%
-8% -13%
-3%
7% 9% 11%
2%
-5%
-40%
-30%
-20%
-10%
0%
10%
20%
30%
40%
1 2 3 4 5 6 7 8 9 10 11 12 13 14 15 16
Ch
rom
a C
han
ge b
y H
ue,
Rcs
,hj
Same red fidelity, shift in opposite directions.
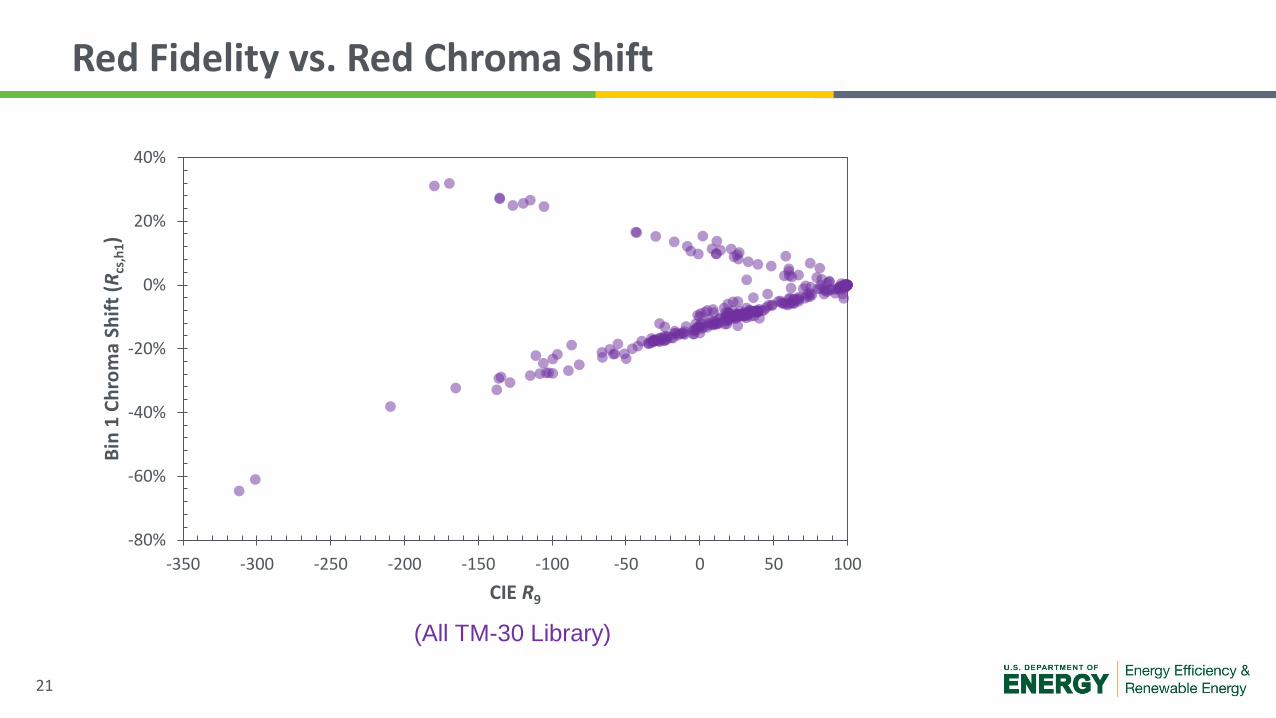
21
Red Fidelity vs. Red Chroma Shift
-80%
-60%
-40%
-20%
0%
20%
40%
-350 -300 -250 -200 -150 -100 -50 0 50 100
Bin
1 C
hro
ma
Shif
t (R
cs,h
1)
CIE R9
(All TM-30 Library)

22
Red Fidelity vs. Red Chroma Shift
-80%
-60%
-40%
-20%
0%
20%
40%
-350 -300 -250 -200 -150 -100 -50 0 50 100
Bin
1 C
hro
ma
Shif
t (R
cs,h
1)
CIE R9
(Existing Commercial Sources)

23
Red Fidelity vs. Red Chroma Shift
-80%
-60%
-40%
-20%
0%
20%
40%
0 10 20 30 40 50 60 70 80 90 100
Bin
1 C
hro
ma
Shif
t (R
cs,h
1)
Bin 1 Fidelity (Rf,h1)

24
Linguistic Relativity Applied to TM-30
A study by British researchers suggests that color words in a given language shape human perception
of color, perhaps explaining why some native English-speaking children, familiar with the rainbow of
colors in the Crayola 64-pack, actually can tell "rust" from "brick" and "moss" from "sage,"
while children who grow up speaking languages with fewer color names lump such hues
together. The research on English children and children in seminomadic Namibian tribes appeared in
the December issue of the Journal of Experimental Psychology: General (Vol. 133, No. 4). Cognitive
psychologist Akira Miyake, PhD, of the University of Toronto, says that the study "addresses an age-
old question: To what extent does language shape or even determine the way we think?"
TM-30 provides a new language to communicate color rendering. To
truly be beneficial, the lighting industry will have to change its thinking
on color rendering.

Halogen (MR16) TM-30 Library Source No. 80
Rf = 99
Rg = 99
Rf,skin = 99
R a = 99
R 9 = 93
Rf,h1
Rcs,h1
= 98
= -1%
CCT = 2988 K
D uv = 0.0010
LER = 180
0
10
20
30
40
50
60
70
80
90
100
CES
01
CES
04
CES
07
CES
10
CES
13
CES
16
CES
19
CES
22
CES
25
CES
28
CES
31
CES
34
CES
37
CES
40
CES
43
CES
46
CES
49
CES
52
CES
55
CES
58
CES
61
CES
64
CES
67
CES
70
CES
73
CES
76
CES
79
CES
82
CES
85
CES
88
CES
91
CES
94
CES
97
Fid
elit
y In
dex
by
Sam
ple
, Rf,
CES
i

High Pressure Sodium TM-30 Library Source No. 56
Rf = 32
Rg = 61
Rf,skin = 34
R a = 17
R 9 = -225
Rf,h1
Rcs,h1
= 5
= -48%
CCT = 1971 K
D uv = -0.0001
LER = 382
0
10
20
30
40
50
60
70
80
90
100
CES
01
CES
04
CES
07
CES
10
CES
13
CES
16
CES
19
CES
22
CES
25
CES
28
CES
31
CES
34
CES
37
CES
40
CES
43
CES
46
CES
49
CES
52
CES
55
CES
58
CES
61
CES
64
CES
67
CES
70
CES
73
CES
76
CES
79
CES
82
CES
85
CES
88
CES
91
CES
94
CES
97
Fid
elit
y In
dex
by
Sam
ple
, Rf,
CES
i

Neodymium Incandescent TM-30 Library Source No. 88
Rf = 86
Rg = 109
Rf,skin = 84
R a = 77
R 9 = 15
Rf,h1
Rcs,h1
= 78
= 11%
CCT = 2756 K
D uv = -0.0048
LER = 136
0
10
20
30
40
50
60
70
80
90
100
CES
01
CES
04
CES
07
CES
10
CES
13
CES
16
CES
19
CES
22
CES
25
CES
28
CES
31
CES
34
CES
37
CES
40
CES
43
CES
46
CES
49
CES
52
CES
55
CES
58
CES
61
CES
64
CES
67
CES
70
CES
73
CES
76
CES
79
CES
82
CES
85
CES
88
CES
91
CES
94
CES
97
Fid
elit
y In
dex
by
Sam
ple
, Rf,
CES
i

Linear Fluorescent F32T8/835 TM-30 Library Source No. 38
Rf = 75
Rg = 99
Rf,skin = 84
R a = 79
R 9 = -5
Rf,h1
Rcs,h1
= 74
= -12%
CCT = 3563 K
D uv = -0.0002
LER = 349
0
10
20
30
40
50
60
70
80
90
100
CES
01
CES
04
CES
07
CES
10
CES
13
CES
16
CES
19
CES
22
CES
25
CES
28
CES
31
CES
34
CES
37
CES
40
CES
43
CES
46
CES
49
CES
52
CES
55
CES
58
CES
61
CES
64
CES
67
CES
70
CES
73
CES
76
CES
79
CES
82
CES
85
CES
88
CES
91
CES
94
CES
97
Fid
elit
y In
dex
by
Sam
ple
, Rf,
CES
i

Linear Fluorescent F32T8/835 TM-30 Library Source No. 37
Rf = 81
Rg = 102
Rf,skin = 90
R a = 86
R 9 = 15
Rf,h1
Rcs,h1
= 79
= -8%
CCT = 3483 K
D uv = 0.0008
LER = 348
0
10
20
30
40
50
60
70
80
90
100
CES
01
CES
04
CES
07
CES
10
CES
13
CES
16
CES
19
CES
22
CES
25
CES
28
CES
31
CES
34
CES
37
CES
40
CES
43
CES
46
CES
49
CES
52
CES
55
CES
58
CES
61
CES
64
CES
67
CES
70
CES
73
CES
76
CES
79
CES
82
CES
85
CES
88
CES
91
CES
94
CES
97
Fid
elit
y In
dex
by
Sam
ple
, Rf,
CES
i

Ceramic Metal Halide 835 TM-30 Library Source No. 62
Rf = 79
Rg = 100
Rf,skin = 78
R a = 84
R 9 = -29
Rf,h1
Rcs,h1
= 74
= -12%
CCT = 3083 K
D uv = -0.0024
LER = 294
0
10
20
30
40
50
60
70
80
90
100
CES
01
CES
04
CES
07
CES
10
CES
13
CES
16
CES
19
CES
22
CES
25
CES
28
CES
31
CES
34
CES
37
CES
40
CES
43
CES
46
CES
49
CES
52
CES
55
CES
58
CES
61
CES
64
CES
67
CES
70
CES
73
CES
76
CES
79
CES
82
CES
85
CES
88
CES
91
CES
94
CES
97
Fid
elit
y In
dex
by
Sam
ple
, Rf,
CES
i

PC White LED TM-30 Library Source No. 184
Rf = 81
Rg = 94
Rf,skin = 86
R a = 81
R 9 = 0
Rf,h1
Rcs,h1
= 75
= -13%
CCT = 3429 K
D uv = 0.0001
LER = 332
0
10
20
30
40
50
60
70
80
90
100
CES
01
CES
04
CES
07
CES
10
CES
13
CES
16
CES
19
CES
22
CES
25
CES
28
CES
31
CES
34
CES
37
CES
40
CES
43
CES
46
CES
49
CES
52
CES
55
CES
58
CES
61
CES
64
CES
67
CES
70
CES
73
CES
76
CES
79
CES
82
CES
85
CES
88
CES
91
CES
94
CES
97
Fid
elit
y In
dex
by
Sam
ple
, Rf,
CES
i

Hybrid LED (PC+Red) TM-30 Library Source No. 92
Rf = 89
Rg = 105
Rf,skin = 97
R a = 94
R 9 = 89
Rf,h1
Rcs,h1
= 91
= -1%
CCT = 2776 K
D uv = 0.0011
LER = 336
0
10
20
30
40
50
60
70
80
90
100
CES
01
CES
04
CES
07
CES
10
CES
13
CES
16
CES
19
CES
22
CES
25
CES
28
CES
31
CES
34
CES
37
CES
40
CES
43
CES
46
CES
49
CES
52
CES
55
CES
58
CES
61
CES
64
CES
67
CES
70
CES
73
CES
76
CES
79
CES
82
CES
85
CES
88
CES
91
CES
94
CES
97
Fid
elit
y In
dex
by
Sam
ple
, Rf,
CES
i

RGB LED TM-30 Library Source No. 108
Rf = 80
Rg = 114
Rf,skin = 81
R a = 71
R 9 = -27
Rf,h1
Rcs,h1
= 70
= 15%
CCT = 3906 K
D uv = 0.0027
LER = 299
0
10
20
30
40
50
60
70
80
90
100
CES
01
CES
04
CES
07
CES
10
CES
13
CES
16
CES
19
CES
22
CES
25
CES
28
CES
31
CES
34
CES
37
CES
40
CES
43
CES
46
CES
49
CES
52
CES
55
CES
58
CES
61
CES
64
CES
67
CES
70
CES
73
CES
76
CES
79
CES
82
CES
85
CES
88
CES
91
CES
94
CES
97
Fid
elit
y In
dex
by
Sam
ple
, Rf,
CES
i

PC White LED TM-30 Library Source No. 175
Rf = 95
Rg = 103
Rf,skin = 98
R a = 97
R 9 = 98
Rf,h1
Rcs,h1
= 97
= 0%
CCT = 2733 K
D uv = -0.0031
LER = 252
0
10
20
30
40
50
60
70
80
90
100
CES
01
CES
04
CES
07
CES
10
CES
13
CES
16
CES
19
CES
22
CES
25
CES
28
CES
31
CES
34
CES
37
CES
40
CES
43
CES
46
CES
49
CES
52
CES
55
CES
58
CES
61
CES
64
CES
67
CES
70
CES
73
CES
76
CES
79
CES
82
CES
85
CES
88
CES
91
CES
94
CES
97
Fid
elit
y In
dex
by
Sam
ple
, Rf,
CES
i
35
7
35

36 36
1

37
2
37

38
3
38

39
4
39

40
5
40

41
TM-30 Experiment at PNNL

42
Illuminance: ~20 fc
CCT: 3500 K
Lighting Conditions: 26
Objects: Generic Consumer, balanced hues
Application: Undefined
Participants (28): 18-65, 16 females 12 males
Rating Questions: Normal-Shifted, Saturated-Dull, Like-Dislike

43

44

45

46

47
48

49
70
80
90
100
110
120
130
60 70 80 90 100
IES
TM-3
0 R
g
IES TM-30 Rf
Model r2 = 0.68
p =
0.0
00
p = 0.042
Dislike
Like
5.5
5.0
4.5
4.0
3.5
1
2 3
Are two metrics enough to know preference?

50
Same Fidelity, Same Gamut, Significantly Different Rating.
Duv
0.0005
83 Rf
98 Rg
CCT
3513 K
Duv
0.0007
84 Rf
102 Rg
CCT
3506 K
21 22
5.0 3.1
SPD
Mean
Preference
Rating
SPD
Mean
Preference
Rating
Rank: 2 of 26 Rank: 20 of 26
Gamut Shape is Important for Preference

51
R² = 0.81
1
2
3
4
5
6
7
8
-25% -20% -15% -10% -5% 0% 5% 10% 15% 20% 25% 30%
Me
an P
refe
ren
ce R
atin
g
Hue Bin 16 Chroma Shift (Rg,h16)
Dislike
Like
Red Chroma Shift and Preference?

52
Rcs,h16 = 7% Rcs,h16 = 5%
Red Chroma Shift and Preference?

53 53
Normalness = Fidelity + Red Fidelity/Saturation
Saturation = Red Saturation
Preference = Fidelity + Red Saturation
Rf > 80 Rf,h1 > 80 0% < Rcs,h1 < 8%
Maximize Rcs,h16, Rcs,h1
Rf > 74 0% < Rcs,h16 < 15%
0% < Rcs,h1 < 15%
(Rg > 100)
Context =

54
Existing versus Future?
When designed for CRI/Efficiency, sources tend to look like this:
When designed for color preference, sources tend to look like this:
F32T8/735 F32T8/835 Blue-Pump PC
LED (81 CRI)

56
Preference versus Fidelity: An examination of the preference for increased (red) saturation.

57

58

59
1 2 3 4 5 6 7

60
1 2 3 4 5 6 7

61
1 2 3 4 5 6 7

62
1 2 3 4 5 6 7

63
Preference for High (Red) Saturation
1. Many (every?) study has shown preference for increased saturation, particularly for reds.
2. We remember colors to be more saturated than they actually are, and more like primary colors.
3. Increased saturation can improve color discrimination. It may also improve the signal difference
for opponent channels.
4. Saturation counters the natural decay pattern of foods.
5. The neodymium incandescent lamp has been a very successful commercial product over a long
period of time.
6. Take a look at other industries, such as photography.
7. Look at product packaging, cosmetics, etc.
8. Interior illuminances are much lower than exterior daylight illuminances. The Hunt effect.

64
Fidelity or (Targeted) Saturation?
Studies showing preference
for increased saturation:
Studies showing preference
for high fidelity:
Smet and others, 2010
Rea and Freyssinier, 2010
Liu and others, 2012
Islam and others, 2013
Szabo and others, 2014
Wei and others, 2014
Wei and others, 2015
Ohno and others, 2015
Jost-Boissard and others, 2015 Teunissen and
others, 2016
Lin and others, 2015
Wei and Houser, 2016a
Royer and others, In Press
Sanders, 1959
Judd, 1967
Jerome, 1972
Thornton, 1974
…

65
Memory Color

66
Memory Color
Why some colors appear more memorable than
others: A model combining categories and particulars
in color working memory.
Bae, Gi-Yeul; Olkkonen, Maria; Allred, Sarah R.; Flombaum, Jonathan I.
Journal of Experimental Psychology: General, Vol 144(4), Aug 2015, 744-
763.

67
Memory Color

68
Photoreceptors and Opponent Channels
0.0
0.5
1.0
1.5
2.0
380 480 580 680 780
Rel
ativ
e Se
nsi
tivi
ty
Wavelength (nm)
Estimates of Cone Spectral Sensitivities
l(λ)
m(λ)
s(λ)
-1.0
-0.5
0.0
0.5
1.0
380 480 580 680 780
Rel
ativ
e Se
nsi
tivi
ty
Wavelength (nm)
Opponenent Signals
k/w(λ)
r/g(λ)
r/g(λ)
y/b(λ)
y/b(λ)

69
Photoreceptors and Opponent Channels
0.0
0.2
0.4
0.6
0.8
1.0
1.2
1.4
1.6
1.8
2.0
380 430 480 530 580 630 680 730 780
Re
lati
ve S
en
siti
vity
Wavelength (nm)
Estimates of Cone Spectral Sensitivities
l(λ) m(λ)
s(λ)
Preferred
Not Preferred

70
Photoreceptors and Opponent Channels
Saturating source provides 22% stronger
red-green signal, blue-yellow channel
unchanged.

71
Decay Processes

72
Decay Processes

73
Neodymium (Reveal) Lamp: Long-term Evidence
Standard Incandescent Neodymium Incandescent

74
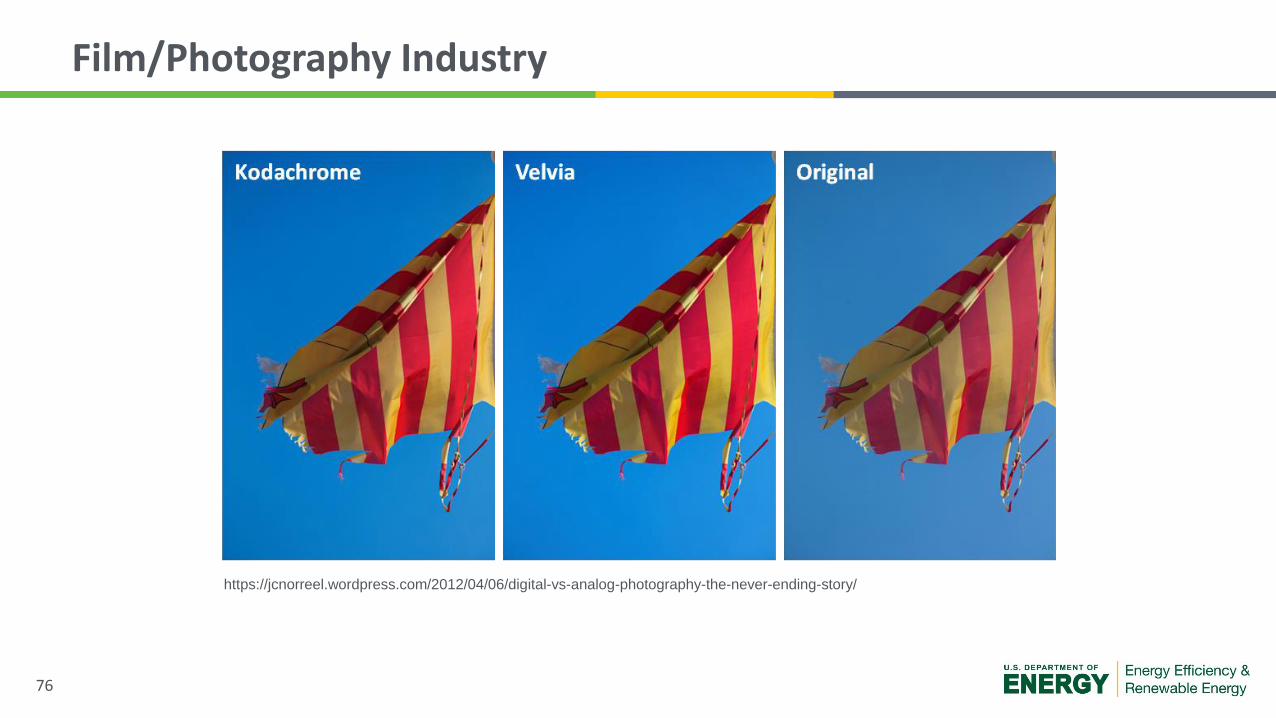
Film/Photography Industry
Velvia Film:
Velvia moved colours around, shifting yellows to reds, separating yellow
greens from blue greens to produce a vivid colour range in foliage. It did
boost saturation but other films had done so previously. It's that it
purified low level saturation that produced the revelation. It could
take a 'mucky' uniform green and purify the colours and separate out the
yellow greens from the blue greens, creating strong contrast and interest.
Tim Parkin https://www.onlandscape.co.uk/2011/05/psychology-of-saturation/

75
Film/Photography Industry
Velvia Film:
After twenty-five years of using Kodachrome film whenever sharpness was of the utmost importance, I
abruptly gave up on it in February 1990 after seeing tests of an amazing new slide film from
Japan…. Fuji’s introduction of ISO 50 Velvia at the Photo Marketing Association show in Las Vegas…
After I returned home, I ran controlled comparisons of Velvia against Kodachrome 25, Kodachrome 64 and
Fuji Pro 50. On my own light table the next morning, I clearly saw the end of an era. Velvia was the best of
all existing worlds. Its resolution exceeded that of Kodachrome 25 and the other test films in high-contrast
tests simulating daylight and equaled Kodachrome 25 in soft light. Its color saturation and separation of
tones exceeded those of Fuji Pro 50 and the other films. I was aware that many photographers would
prefer Kodachrome’s relatively muted colors, but I believed much of this was due to a conditioned
constancy illusion that Kodachrome slides accurately represented the natural world. I knew better and fully
expected Velvia to establish a new constancy illusion with picture editors and the public… I wanted to see
the world freshly through this new tool and to push it to the limit to see what it would do. Over the years,
the limitations of other films had caused me to consider certain kinds of subject matter and lighting as
impossible. Murky renditions of greens in shadow under a blue sky on Kodachrome became vivid on
Velvia. Fuji Pro 50 renditions of delicate foliage have very strong color, but also a lack of resolution that
calls attention to itself, especially when compared with Kodachrome 25. Velvia holds both color and
sharpness.
Galen Rowell Via http://landscapephotographyblogger.com/did-velvia-film-change-landscape-photography/
76
Film/Photography Industry
https://jcnorreel.wordpress.com/2012/04/06/digital-vs-analog-photography-the-never-ending-story/

77
Film/Photography Industry
Red shirt photography:
Even though Kodachrome was already unnaturally bright, photographers ... splashed the
strongest possible colors in their pictures so that they would be more effective in print.
One result was that the staff photographers - who were constantly being sent to colorful places
to slake what was seen as the public's unquenching thirst for colorful scenes - would often
find themselves needing more color to take advantage of the color film and would resort to
placing the people in costume.
C.D.B. Bryan, National Geographic Society: 100 Years of Adventure and Discovery, National Geographic Society (ISBN
0810936968)
Via https://en.wikipedia.org/wiki/Red_shirt_(photography)

78
Film/Photography Industry
Red shirt photography:
(From Movie)
https://mrhalfdome.wordpress.com/2011/04/26/alex-honnold-in-national-geographic/

79
Packaging and Cosmetics

80
Why Red?
The empirical work that we have reviewed clearly indicates that color can carry meaning and have
an important influence on affect, cognition, and behavior in achievement and
affiliation/attraction contexts. Red, especially, has been shown to be a critical color in this
regard. This should come as no surprise, as red has long been identified as a unique, special color.
Ellis (1900), for example, commenced his prescient essay “The Psychology of Red” with the
following: “Among all colors, the most poignantly emotional tone undoubtedly belongs to red”
(p. 365). Many things in biology, culture, and language point to the poignancy and prominence of
red. Red is the color of blood and, therefore, the color of life and (when spilled) death. Dynamic
variation in visible blood flow on the face and body of a conspecific communicates critical,
adaptation-relevant information, from the pallor of fear, to the flush of sexual interest or
arousal, to the florid crimson of anger and imminent aggression (Changizi 2009). More static
individual differences in visible blood flow are indicative of cardiac health or illness (Stephen et
al. 2011). Red is the color of ripe fruit, and vivid red (especially against a green background) allows
such ripe fruit to be detected from afar (Regan et al. 2001). Red is the color of many
aposematic (warning) signals conveyed on the bodies of poisonous insects and reptiles
(Stevens & Ruxton 2012). Red is regarded by anthropologists to have been the first chromatic
color used in symbolic fashion in interpersonal communication, and the use of red ochre in
prehistoric cave painting is thought to be the first use of chromatic color in art (Henshilwood et al.
2009). Red is a term that appears in all or nearly all lexicons, and red is the first chromatic term to
emerge in most of these languages (Kay & Maffi 1999). Given all of this, the contemporary use of
red in signs (e.g., alarms, sirens), symbols (e.g., hearts, crosses), and sayings (e.g., “in the red,”
“roll out the red carpet”) seems fitting, and the preponderance of red effects observed in the current
literature is sensible.

81
Why Red?
Achievement vs. Attractiveness Scenarios
“Critically, color meanings and effects are posited to be context specific.”

82
Why Red?
…competitors randomly assigned to red relative to blue sportswear were
more likely to win the competition…[Hill & Barton 2005]
…red teams win more virtual matches than blue teams…[Illie et
al 2008]

83
Why Red?
These data suggest that the red effect may be present in some countries but not
others, perhaps as a function of culture-specific learned associations to red that run
counter to, and weaken the influence of, any inherent meaning. Likewise, the strength
of the red effect may vary as a function of team versus one-on-one
competition…[Kocher & Sutter 2008]

84
Why Red?
…experimental studies indicated that individuals who viewed red before or during
anagram, analogy, and math tasks performed worse than those who viewed green or
achromatic control colors. [Elliot et al. 2007]
…several studies have demonstrated that red is implicitly associated with failure and
danger in achievement situations.

85
Why Red?
This research has revealed that faces that are redder (presumably due to blood
perfusion), yellower (presumably due to carotenoids), and lighter are rated as healthier
and more attractive…
…homogeneous facial skin color distribution (i.e., more even skin color) negatively
predicts perceptions of age and positively predicts perceptions of health and
attractiveness.

86
Why Red?
…men rate women as more attractive and sexually desirable when the women are
viewed within a red picture border or in red clothing. [Elliot & Niesta 2008]

87
Why Red?
men are more likely to contact a woman displaying red on a dating website (Gueguen &
Jacob 2013b), tip waitresses in red more generously (Gueguen & Jacob 2012, 2013a),
are more likely to approach a woman at a bar wearing red lipstick (Gueguen 2012c), are
more likely to pick up a woman hitchhiker wearing red (Gueguen 2012b), ask more
intimate questions of and sit closer to a woman in red (Niesta Kayser et al. 2010), and
walk more quickly to an interview on dating conducted by a woman in red (Meier et al.
2012)

88
Why Red?
…faces of men photographed while wearing red are rated as more attractive, even when
no color is made visible to the rater. [Roberts et al. 2010].

89
Hunt Effect
(Illustration)

90
Hunt Effect
Mark D. Fairchild
Color Appearance Models
Figure 6.10

91
Arguments Against Saturating Sources
1. Hue shifts are objectionable, and hue shifts accompany saturation
increases.
2. Designers don’t choose more saturated colors for surfaces.
3. Hues will be distorted versus natural daylight.
4. Studies that show preference for increased saturation have all
been short term.
Based on all prior research, this effect is at least
counterbalanced by increases in saturation, since
increased saturation is always preferred.
Do we really know that they aren’t? Look at film. Cadbury
has reformulated packaging to account for
LEDs/Fluorescent.
Have any studies shown this? No study has shown a
preference for high fidelity sources.
Interior lighting has many difference from daylighting.

92
Energy Considerations

93
Energy Considerations
0
50
100
150
200
250
300
350
400
450
0 20 40 60 80 100 120 140
LER
Fidelity Index (Rf)

94
Energy Considerations
0
50
100
150
200
250
300
350
400
450
-150 -100 -50 0 50 100 150 200
LER
Provisional Preference Model

95
Going Forward
Additional Research
1. Are some hue shifts acceptable in order to increase saturation, or are small hue shifts too
objectionable?
2. Do long-term results reflect short-term results?
Industry Changes
1. Use new measures (TM-30) to develop and specify preferred sources.
2. Avoid regulations that limit options for spectral engineering of preferred sources.
3. Are there ethical obligations?

96
TM-30 Integration Status
1. LED Lighting Facts, ENERGY STAR collecting TM-30/SPD data. No regulations in effect.
2. Many manufacturers beginning to provide TM-30 data. Some new products being
released. Product development takes time.
a. Overly restrictive regulations can stifle product development and force a one-size-
fits-all solution.
3. Specifiers beginning to look at TM-30 data.
4. CIE expected to adopt Rf as a replacement for CRI by the end of the year. Official
transition will be gradual.
a. CIE committees not structured to consider an evaluation framework like TM-30.

97
Thoughts for the Future
1. Color-rendering tuning?
2. User customizable color rendering? (Store end caps, worker satisfaction)
3. Dim to vibrant?
4. How many choices are needed?
5. Consumer preference index?

98
1. A metric value doesn’t tell you how the product will perform in any given environment.
Context is critical! Individual preferences vary! Illuminance levels vary!
2. An average color rendering metric shouldn’t be used to predict how a source will render
reds, or skin tones, or any specific set of objects.
3. TM-30 offers substantially more information, which is essential for evaluating color
rendering characteristics.
4. TM-30 is an evaluation framework, not a ranking system.
98
Understanding the Tool

99 99
IES Technical Memorandum (TM) 30-15 (Includes Excel Calculators):
IES Method for Evaluating Light Source Color Rendition http://bit.ly/1IWZxVu
Optics Express journal article that provides overview of the IES method:
Development of the IES method for evaluating the color rendition of light sources http://bit.ly/1J32ftZ
Application webinar co-sponsored by US Department of Energy and Illuminating Engineering Society:
Understanding and Applying TM-30-15: IES Method for Evaluating Light Source Color Rendition http://1.usa.gov/1YEkbBZ
Technical webinar co-sponsored by US Department of Energy and Illuminating Engineering Society:
A Technical Discussion of TM-30-15: Why and How it Advances Color Rendition Metrics http://1.usa.gov/1Mn15LG
LEUKOS journal article supporting TM-30’s technical foundations:
Smet KAG, David A, Whitehead L. 2015. Why Color Space and Spectral Uniformity Are Essential for Color
Rendering Measures. LEUKOS. 12(1,2):39-50. http://dx.doi.org/10.1080/15502724.2015.1091356
Resources

100
LEUKOS editorial discussing next steps:
Royer MP. 2015. IES TM-30-15 Is Approved—Now What? Moving Forward with New Color Rendition
Measures. LEUKOS. 12(1,2):3-5. http://dx.doi.org/10.1080/15502724.2015.1092752
Lighting Research and Technology, Open Letter:
Correspondence: In support of the IES method of evaluating light source colour rendition
(More than 30 authors) http://dx.doi.org/10.1177/1477153515617392
DOE Fact Sheet on TM-30 http://energy.gov/eere/ssl/downloads/evaluating-color-rendition-using-ies-tm-30-15
DOE TM-30 FAQs Page: http://energy.gov/eere/ssl/tm-30-frequently-asked-questions
Resources