Présentation PowerPoint - engie.com · Net recurring income group share In €bn NRIgs...
36
April 2018
Transcript of Présentation PowerPoint - engie.com · Net recurring income group share In €bn NRIgs...

April 2018

SUMMARY
At a glance
- ENGIE today 4
- Low CO2 power generation 5
- Leader in global infrastructure 6
- Integrated customer solutions 7
- ENGIE around the world 8
Strategy &
transformation plan
- Sectorial context 10-13
- Strategy 14
- Transformation plan 15-17
- CSR objectives 18
2017 full year
results
- Transformation plan 90 % completed after 2 years 20
- Key figures 21
- Breakdown of Ebitda 22
- Investments focused on growth businesses 23
- Signifiant progress made on portfolio rotation 24
- 2018 guidance: sustain organic growth 25
- 2018 Dividend increase 26
ENGIE and you- Stock reporting 28-32
- bonus dividend 33
- 2018 General Meeting 34
- Useful information 35
- Agenda 36
Navigation through this document is facilitated by an interactive summary that takes you directly to the pages you want
and allows you to return to the summary at any time, using the arrow in the bottom right-hand corner of each page.
Clickable links also provide more details about some subjects

At a glance

ENGIE TODAY
4
CUSTOMER SOLUTIONSLOW CO2 POWER
GENERATIONGLOBAL INFRASTRUCTURE
ENGIE is focused on its 3 core businesses to lead the global energy transition

LOW CO2 POWER GENERATION
5
Natural gas
Renewables
Nuclear
Coal
Other(3)
8%
7% (vs 13 % in 2015)
6%
23% (vs 18 % en 20158)
56%
89% low CO2
102.7 GW(1)
World’s leading independent
producer
102.7 GW(1) installed
> 89% low CO2
23% renewables(2)
(1) figures at 100% as of 12/31/2017
(2) Excluding pumped-storage hydroelectric capacity
(3) Including pumped-storage hydroelectric capacity
Capacity breakdown
As of 12/31/2017

LEADER IN GLOBAL INFRASTRUCTURE
6
3.4
0.2
1.8
1.1
0.3
Europe EBITDA
Infrastructures
2017, in € billions
ca. 32,500 km of network - no. 2
in Europe
ca. 21 billion m3 of regas
capacity - no. 2 in Europe
ca. 12 billion m3 of storage
capacity - no. 1 in Europe
ca. 200,000 km of grid – no. 1
in Europe
€3.8 bn EBITDA on global infrastructure worldwide
France distribution
Transmission
Storage
LNG terminals

24 million of customers in
the world
Global leader in energy
solutions for cities
320 DHC networks worldwide
INTEGRATED CUSTOMER SOLUTIONS
7
EBITDA
by activity
2017, in € billion
0.7
0.4
1.1
2.3
B2B Business to Business
B2T Business to Territories
B2C Business to Customers
Solutions for individuals: green electricity offers, energy and breakdown services, My Power (photovoltaic panels for self-consumption), Elec Car …
Solutions for companies: energy and comsumption management solutions, intelligent digital control, blu.e solution, the software platform to help energy management ...
Solutions for territories: micro-grids, combined storage solutions for solar electricity and batteries, heating and cooling networks, green mobility ...

Breakdown of revenues by
geographic area
ENGIE AROUND THE WORLD
8
€65 bn in 2017
3.9North
America
Latin
America
A
f
r
i
c
a
EuropeAsia, Middle East
&Oceania
4.3
50.95.5
0.4
€65 bn
2017

Strategy
& transformation plan

10
OPPORTUNITIES ARISING FROM A REVOLUTION
DECARBONISATION DECENTRALISATION DIGITALISATION
This energy revolution is intensifying and becoming global, structured by three major trends

10,000
8,000
6,000
4,000
2,000
0
16%
12%
8%
4%
0%
Aggregate Additional capacity in GW
Low CO2 technologies
Coal Gas Other Wind Solar
Renewables Nuclear Gas Wind Solar Other renewables
2015 2020 2025 2030
Sources: Bloomberg New Energy Finance, AIE, ENGIE 2015
(1) CAGR:compound annual growth rate
11
Development of the global energy mix up until 2030
Additional capacity 2015-2030
(CAGR (1) by technology)
Natural gas & renewable energies, drivers of a global energy transition

44%(80% today)
36%
20%
Decentralised solutions
In 2030
12
SIGNIFICANT INCREASE IN DECENTRALISED SOLUTIONS WORLDWIDE
Source: AIE, Energy for All, 2011; MIT 2015
B2C, off-grid solutions
Centralised power generation
B2T & B2B microgrids
• The revolution in energy storage and
generation technologies is prompting the
emergence of smaller, competitive,
decentralised infrastructure.
• Consequently, infrastructure and offers need
to be adapted to the coexistence of centralised
and decentralised energy solutions.

13
DIGITALISATION, A PIVOTAL ELEMENT IN THE ENERGYREVOLUTION
• In a world where infrastructure is
becoming smaller, digital technology is
accelerating this trend and occupying
a central role, especially with regard to
guaranteeing a balance between
energy generation and consumption at
all times.
• For example, the number of
connected objects in the world will
quadruple by 2020 to total 25 billion*.
Big Data
Autonomousgeneration
Predictive
maintenance
Energyoptimisation
Smarthomes
Smartcities
Seamlesscustomerjourneys
* Source Gartner 2015

AMBITIONS for 2018
LOWER EXPOSURE
TO COMMODITY PRICES
DOWNSTREAMPRIORITY TO
LOWEST CO2 OPTIONS
CO2 LIGHT ACTIVITIES(2)
EBITDA >90%
CO2
CONTRACTED/REGULATED(1)
EBITDA > 85%
CUSTOMER SOLUTIONS DEVELOPMENT
(1) Excluding merchant power generation, E&P and LNG supply & sales
(2) Low CO2 power generation, gas infrastructures & LNG, downstream
14
3 CLEAR DIRECTIONS

15
A 3-year transformation plan based on 4 pillars
* Net of DBSO proceeds; excluding Capex related to E&P and upstream / midstream LNG (including Touat and Cameron) for EUR 0.3 billion and Corporate Capex for EUR 0.2 billion
15
Agile and connected
Technology-focused
Talent-oriented
Adapt
the Group
Redesign
and simplify
the portfolio
€14,3 billion*
Growth in CAPEX
€15 billion
Portfolio rotation
(net debt reduction)
Pave the way for
the future
€1billion
Spendings in
innovation/digital
Improve
efficiency
€1.3 billion
(net EBITDA increase)

16
FOCUS OUR STRENGTHS ON OUR 3 CORE BUSINESSES
Coal
Activities with
exposure to commodity
prices
Exploration & production
LNG upstream activities
CAPEX
PORTFOLIO
ROTATION
Integrated solutions
for customers:
- Energy efficiency
- Energy supply
- Cities and customers
- Decentralised
renewables
- Heating/cooling networks
Gas distribution
Transmission
LNG terminals & sales
Storage
Solar
hydraulic, wind
Gas
GLOBAL
INFRASTRUCTURE
LOW CO2 POWER
GENERATION
CUSTOMER
SOLUTIONS
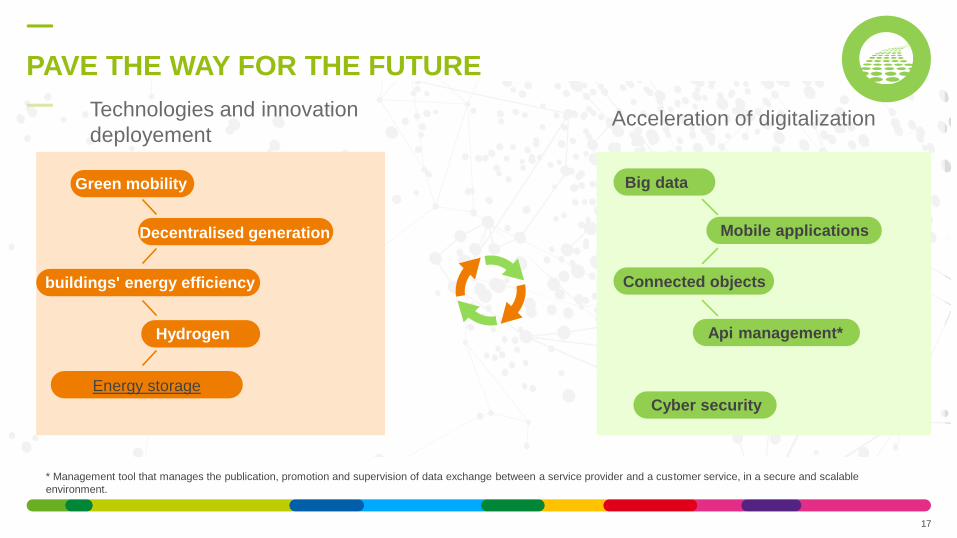
Acceleration of digitalizationTechnologies and innovation
deployement
17
PAVE THE WAY FOR THE FUTURE
Green mobility
Decentralised generation
buildings' energy efficiency
Hydrogen
Energy storage
Big data
Mobile applications
Connected objects
Api management*
Cyber security
* Management tool that manages the publication, promotion and supervision of data exchange between a service provider and a customer service, in a secure and scalable
environment.

18
CSR OBJECTIVES TO SUPPORT THE GROUP PERFORMANCE
Objective Indicator
Target value in
2020
Effective value in
2016
Effective value in
2017
Supporting our
customers in the energy
transition
Satisfaction rate among our B2C customers 85% 81% 83%
Renewables Share of renewable energy in the generating capacity 25% 19.5% 23.1%
Greenhouse gasemissions
% reduction in ratio of CO2 emissions to energy production compared with 2012
-20% -11.3% -18.1%
Stakeholder dialogue% of industrial activities covered by a suitable dialogue
and consultation mechanism100% 20% 48%
Gender diversity % of women in the Group’s workforce 25% 21.9% 22.2%
Health and safety Internal frequency rate for occupational accidents <3 3.6 3.3

2017 FY Results

20
• Acquisitions on new
promising markets (EV
Box, Icomera)
• A Business Unit
dedicated to renewable
hydrogen
• Lean 2018:
Identified
• Target raised by €100
million, for a total or
€1.3 billion of net gains
expected at Ebitda
level by 2018
• HQ adaptation to the
Group's new
challenges
• Involvement of
managers in the
Group’s transformation
PAVE THE WAY FOR THE FUTURE
IMPROVE EFFICIENCY
REDESIGN AND SIMPLIFY THE PORTFOLIO
ADAPT THE GROUP
Additional Medium-term
growth drivers
Improve
competitiveness
Refocus on
growth engines Agile organization
• Rotation program well
advanced
• Investment program
well engaged
• Growth engines
already account for
of EBITDA
90%
97%
91%
100%

in €bn
REVENUES 65.0 + 1.7%
EBITDA 9.3 + 5.3%
NET RECURRING INCOME GROUP SHARE(1) 2.6(1) 2.4-2.6
CASH-FLOW FROM OPERATIONS 8.3
NET DEBT / EBITDA 2.25 x 2.5 x
CREDIT RATING A- / A2 «A » Category
DIVIDEND €0.70 / action €0.70 / action
NET INCOME RESULT, GROUP SHARE 1.4 €bn
KEY FIGURES
21
2017 Results ∆ organic
2017/2016 Indication/Guidance 2017
(1) NRIgs excluding IFRS 5 treatment for E&P, i.e. excluding the D&A upside (EUR 0.1 billion) from IFRS 5 accounting treatment (ENGIE E&P International business classified as “discontinued operations”), therefore underlying contribution of of E&P of EUR 0.2 billion
9.3-9.9

BREAKDOWN OF EBITDA
22
EBITDA by métiers In €bn
2.3
3.8
(0.8) Others
9.3(1)
4,1
Global Infrastructure (3)
Client Solutions
Low CO2 Power generation(2)
(1) Excluding others and low co2 merchant power generation for €1bn (2) including €1bn of low co2 merchant power generation(3) Including €0.03bn upstream

INVESTMENTS FOCUSED ON GROWTH BUSINESSES
23
2.2
1.8
0.5
4.5
1.8 0.7
€14.3bn(1)
(1)Net of DBSO proceeds; excl. E&P and LNG upstream/midstream Capex (including Touat and Cameron) for €0.3bn and corporate Capex for €0.2bn
B2T
B2C
RES
Thermal
contracted
Thermal
Merchant*
€7.1bn 50%
B2B
€4.6bn 32%
€2.6bn 18%
Growth Capex 2016-18
In €bn
Capex plan by geographies
France
36%
Latam
33%
Rest
of the world
16%
Europe
15%
Customer soluitions Infrastructures
Power generation– Renewable & thermal contracted
Power generation– Merchant
* exposure to commodity prices

SIGNIFICANT PROGRESS MADE ON PORTFOLIO
ROTATION
24
Bookedas of Dec
2017
Closed2018 YTD
Signed(closing
in progress)
Processlaunched
Total netdebt
reduction
8.7
+3.0
15
+1.6
€13.2bn of disposals executed Ahead of plan with already ~ 90% executed to date
~ € 9bn closed in 2016-17,
mainly:
US merchant & coal assets
€ 3bn closed to date in 2018:
E&P, Loy Yang B, Egaz-Degaz
LNG diposal expected to close
in 2018
Net debt impact
In €bn

25
2018 GUIDANCE: SUSTAINED ORGANIC GROWTH
Net recurring income group share
In €bnNRIgs €2.45-2.65bn
without E&P and LNG contributions
Dividend:
Final dividend 2017 to be paid in May New
policy in 2018
Leverage & rating:
“A” category rating Net debt / EBITDA ≤
2.5xexcluding E&P
and LNG2018e
2.36(2)
2.45-2.65(3)
2017reported
2.660,10 D&A uplift(1)
+ 8 %
(1) Coming from IFRS 5 treatment of E&P(2) Without E&P and LNG contributions and without IFRS 9 and IFRS 15 treatments(3) Main assumptions: no E&P and LNG contributions, average weather in France, full pass through of supply costs in French regulated gas tariffs,
no significant accounting treatment changes except for IFRS 9 and IFRS 15, no major regulatory and macro-economic changes, market commodity prices as of 12/31/2017, average forex for 2018: €/$: 1.22; €/BRL: 3.89, no significant impacts from disposals not already announced.
* ENGIE completed the sale of its exploration & production
activities in 2018 and the sale of its LNG upstream activities is
underway.
*

2018 DIVIDEND INCREASE
26
0.7 0.7
2017 2018 2018 - upgraded
0.75
Dividend per share (DPS) in € per share
+7.1%
71%Indicative pay
out ratio(1)70%66%
(1) Basé sur le RNRpg des activités poursuivies ; calculé sur le milieu de fourchette de la guidance 2018
Previous DPS policy
Upgraded
2018 DPS

ENGIE and you

IndicesMarkets2017 Stock market information
THE SHARE
28
ISIN code*: FR0010208488
Ticker symbol**: ENGI
2017 higher: €15.16
2017 lower: €10.77
Last (12/29/2017) : €14.34
Market capitalization as of 31/12/2017:
35 €bn
ca. 6,500,000 shares traded per day on
average in 2017
Euronext paris (compartiment A)
Euronext Bruxelles
Eligible for the deferred settlement
service (SRD) and equity savings plan
(PEA)
Indices : CAC 40, BEL 20, Euro Stoxx
50, Stoxx Europe 600, MSCI Europe,
Euronext 100, FTSE Eurotop 100,
Euro Stoxx Utilities, Stoxx Europe
600 Utilities
EGS indices : Dow Jones
sustainability(World, Europe),
Euronext Vigeo Eiris (World 120,
Eurozone 120, Europe 120, France
20, CAC 40 Governance)
*The ISIN (International Securities Identification Numbers) code is an international standard for identifying and tracking a financial
instrument.
**The ticker symbol is an initials (diminutive of the name) appearing beside the ISIN code of the values facilitating their
identification.

2017 PERFORMANCE
29
10,5
11
11,5
12
12,5
13
13,5
14
14,5
15
15,5
02/01/2017 02/04/2017 02/07/2017 02/10/2017
ENGIE Euro Stoxx Utilities CAC 40 BEL 20
29/12/2017
Gross
Perf
Total
Shareholder
Return
ENGIE +18% +25,5%Euro Stoxx
Utilities +16% +16%
BEL 20 +10% +10%
CAC 40 +9% +13%
Source : Thomson Reuters – based on ENGIE shareprice
* Sectoral benchmark indexing European companies producing and distributing gas, electricity and water : A2A, EDP-Energias, EDF, Enagas, Endesa, Enel, ENGIE, E.ON, Iberdrola, Innogy, Italgas, Gas Natural SDG, RED
Electrica, Rubis, RWE, SNAM, SUEZ, Terna, Uniper, Véolia Environnement
*

PERFORMANCE SINCE 2018
30
BEL 20 -3%
FY Results
03/08/2018
12
12,5
13
13,5
14
14,5
15
02/01/2018 17/01/2018 01/02/2018 16/02/2018 03/03/2018 18/03/2018 02/04/2018
ENGIE Euro Stoxx Utilities CAC 40 BEL 20*
CAC 40 -1%
ENGIE -1%
Euro Stoxx
Utilities -2%
Source : Thomson Reuters – based on ENGIE shareprice
* Sectoral benchmark indexing European companies producing and distributing gas, electricity and water : A2A, EDP-Energias, EDF, Enagas, Endesa, Enel, ENGIE, E.ON, Iberdrola, Innogy, Italgas, Gas Natural SDG, RED
Electrica, Rubis, RWE, SNAM, SUEZ, Terna, Uniper, Véolia Environnement

In 2017, ENGIE achieved one of the best performances of the CAC 40, driven by significant advances in its transformation plan.
Since the beginning of 2018, the sector and the share have been penalized by:
renewed pressure on interest rates in Europe benefiting so-called "cyclical" values to the detriment of so-called "defensive"
values (sectorial rotation)
the recent rise of the euro against the dollar
SUEZ profit warning ( 23 January 2018) of its 2017 earnings objectives and 2018 outlook
The publication of the Group's results on March 8 was welcomed with a rise of 3.8% at closing, outperforming the CAC 40 and
the sector by around 250 basis points. The growth outlook and the rise in the dividend of 7.1% for 2018 have positively
surprised.
SHARE PRICE EVOLUTION ANALYSYS
31

PERFORMANCE COMPARED TO THE MAIN INDICES
32
En %
ENGIE* 5%
Euro Stoxx
Utilities 4,7%
BEL 20 3,6%
CAC 40 3,3%
Return to April 6
Source : Thomson Reuters
* Based on dividends paid in 2017
OAT 10 years
France 0,9%
2
3
4
5
6
7
8
9
10
02/01/2017 02/04/2017 02/07/2017 02/10/2017 02/01/2018 02/04/2018
Rendement ENGIE Rendement Euro Stoxx Utilities Rendement CAC 40 Rendement BEL 20

A BONUS DIVIDEND
33
Register your shares prior to December 31, 2018 to benefit in 2021 from the bonus dividend related
to 2020.
ENGIE rewards the sharehoders’ loyalty
+ 10%bonus dividend for all shareholders who registered shares
(directly or indirectly for at least 2 continuous years
For more information on the dividend policy, go to engie.com

ANNUAL GENERAL MEETING: FRIDAY, 18 MAY, 2018
34
An Internet area, secured and dedicated to the vote
prior to the General Assembly will be open from April
30 9am until May 17 at 3pm.
If you are a bearer shareholder: Log in to your bank's
website, you can vote online if your institution has
signed up for the Votaccess system.
If you are a registered shareholder: connect to the site
sharinbox.societegenerale.com
Access the live or deferred broadcast of the
General Assembly from 2.30 pm
The Annual General Meeting will be held on May 18 at the Palais
des Congrès in Paris at 2.30 pm
An Assembly that will open a new page in the history of ENGIE,
with the last term of Gérard Mestrallet as Chairman of the Group;
the appointment of a new independent director, Jean-Pierre
Clamadieu, who will transition into the role of chairman, will thus be
submitted for approval to shareholders.
Find all the documentation on engie.com/ag
Discover all the terms and conditions of participation in
the General Meeting and the resolutions on the agenda
in the digital version of the Notice of Meeting 2018,
available on engie.com/ag.

PRACTICAL INFORMATION
35
ENGIE shrae price
Holding registered securities
The dividend
The loyalty bonus
General Meeting
The tax framework for your shares
Press releases
Publications by ENGIE
ETRE ACTIONNAIRE ENGIE LIENS UTILES
engie.com/actionnaires
engie.com/club
Mes questions d’argent (in french)
Euronext, Paris stock exchange
L’Ecole de la Bourse (in French)
placedesactionnaires.com (in French)
Lexicon (in French)
facebook.com/actionnairesengie
[email protected] (France)
(from France)
[email protected] (Belgium)
(from Belgium)
0 800 300 030
0 800 25 125
BEING AN ENGIE SHAREHOLDER
USEFUL LINKS CONTACT US

AGENDA
36
Thursday, may 24
Payment of the balance dividend:
€0.35 per shareTueday, may 15
Financial information as of 31 March 2018
Friday, may 18
Annual General Meeting
Friday, July 27
2018 first Half results