Presentation Outline - Pages - Home WARMING & CLIMATE CHANGE ... 0 5 10 15 20 25 Population...
34
2/29/2016 1 SCAG’s Role in Southern California’s Regional Growth: Demographic Perspective of Sustainability and Global Collaboration SCAG-KRIHS Workshop Strategies of Sustainable Metropolitan Development November 8, Los Angeles, CA Frank Wen Research & Analysis Southern California Association of Governments 2 Presentation Outline Introduction Southern California or SCAG Region Southern California Association of Governments (SCAG) Major Demographic Trends Aging Two Simulations Projected future job growth Impact on Income, expenditures, and taxes Paid Implications and Policy Responses
-
Upload
truongdung -
Category
Documents
-
view
217 -
download
0
Transcript of Presentation Outline - Pages - Home WARMING & CLIMATE CHANGE ... 0 5 10 15 20 25 Population...

2/29/2016
1
SCAG’s Role in Southern California’s Regional Growth: Demographic Perspective of Sustainability and Global Collaboration
SCAG-KRIHS WorkshopStrategies of Sustainable Metropolitan Development
November 8, Los Angeles, CA
Frank Wen
Research & AnalysisSouthern California Association of Governments
2
Presentation Outline
Introduction Southern California or SCAG Region Southern California Association of Governments
(SCAG)
Major Demographic Trends Aging
Two Simulations Projected future job growth Impact on Income, expenditures, and taxes Paid
Implications and Policy Responses

2/29/2016
2
Overview of SCAG Region
4
Characteristics associated with SCAG Region or Southern California
Happiest place on the earth, Hollywood, Movie & Stars, Earthquake, Weather, Beaches, . . . .
The motion picture/television, music, fashion, popular culture, and entertainment capital of the world
Gateway between the Pacific Rim countries and rest of world Racial/ethnic diversity: largest Asian immigrants and business
centers in the US, including Chinese, Korean & others Diversity of community types, interests and needs—The best
Chinese food is in LA not in Taiwan, Hong Kong or China Largest manufacturing, defense and defense-related high tech
industry base in the US and in the world World class universities, research institutes (UCLA/USC, Cal Tech/
JPL), and university/professional sports teams Polycentric development patterns, automobile capital of the world

2/29/2016
3
6 Counties193 Cities6 Counties193 Cities
Population18.2 million now
22 million by 2035
Population18.2 million now
22 million by 2035
2012 GDP $ 924 Billion2012 GDP $ 924 Billion
7.6 million jobs today9.4 million by 2035
7.6 million jobs today9.4 million by 2035
16th largest economyin the world
16th largest economyin the world
Shares the characteristics of many nations
Shares the characteristics of many nations

2/29/2016
4
GDP
World Economy Ranking: 2012 EstimatesRank Country/Region GDP ($Bil.)
1.2.3.4.5.6.
United StatesChinaJapanGermanyFranceUnited Kingdom
15,6858,2275,9643,4012,6092,441
7.8.9.
10.
BrazilRussiaItaly
IndiaCanada
2,3962,0222,0142,0031,8251,81911.
12.13.14.15.
16.17.
AustraliaSpainMexicoSouth Korea
IndonesiaTurkey
1,5421,3521,1771,156
924878794
California
SCAG 6-County Area
Most socially& culturally diverse region in the world
Most socially& culturally diverse region in the world
18 million people now… 22 million by 203518 million people now… 22 million by 2035

2/29/2016
5
9
Shift in Hispanic Ethnicity: SCAG Region
• SCAG region will be majority Hispanic by 2025
• Hispanic population overall has
- Lower income
- Lower educational attainment
- Low government representation
- Larger household size
- Younger
10

2/29/2016
6
Imperial Los Angeles Orange Riverside SanBernardino Ventura SCAG Region
1980 25.4% 23.2% 16.7% 16.8% 13.2% 14.7% 20.6%
1990 28.9% 32.7% 23.9% 14.8% 13.2% 17.0% 27.2%
2000 32.2% 36.2% 29.9% 19.0% 18.6% 20.7% 31.0%
2010 30.7% 35.4% 30.0% 21.6% 21.3% 22.5% 30.6%
0%
5%
10%
15%
20%
25%
30%
35%
40%
SCAG Region Foreign Born Population Peaked in 2000
Region’s Share of U.S. Total
Total Population
MexicanKorean (341,960)VietnameseFilipinoJapaneseChineseOther Hispanic
Population
Source: 2010 Census
5.8%
20.5%23.4%19.8%31.7%19.3%15.1%7.4%
Diversity
Diversity

2/29/2016
7
250,187661,907
1,193,705
2,657,9693,312,460
4,997,221
7,823,721
10,055,351
11,589,678
14,640,802
16,516,006
18,073,10818,305,781
0.33%0.72%
1.12%
2.16%
2.51%
3.28%
4.33%
4.90%5.10%
5.87%5.87%
5.84%
5.83%
0%
1%
2%
3%
4%
5%
6%
7%
0
2,000,000
4,000,000
6,000,000
8,000,000
10,000,000
12,000,000
14,000,000
16,000,000
18,000,000
20,000,000
1900 1910 1920 1930 1940 1950 1960 1970 1980 1990 2000 2010 2012
SCAG Region Total Population and Share of U.S. Population 1900-2012
Population
Share of U.S. Population (Use right Scale)
Source: Bureau of the Census and California Department of Finance. Created by Dr. Simon Choi, Community Development, Planning and Policy Department, SCAG.
Shift in Ethnic Composition
0%
10%
20%
30%
40%
50%
60%
70%
80%
90%
100%
1960 1980 2000
Source: U.S. Census Bureau. Data in 1960 was estimated by James Allen and Eugene Turner. 2002. Changing Faces, Changing Places.
Notes: (1) "Asian Alone" also includes Pacific Islander. (2) "Other Race Alone" is too small to be shown (at 0.2 percent in 2000).(3) Only the 2000 Census included the "Two or More Races" category to which people may choose to belong.
Non-Hispanic White
2006
Hispanic
Asian Alone(1)
American Indian Alone
Other Race Alone(2)Two or More Races(3)African American Alone
10%
44%82%
34%

2/29/2016
8
Sources of Growth
2000-2006
Natural Increase
55%Foreign Immigration
44%
DomesticMigration 1%
Population by City
• Largest cities – Los Angeles: 3.8 million
– Long Beach: 468K
• Smallest cities– City of Vernon: 112
– City of Industry: 222
• Average city population: 64K (excluding LA and LB)– 19 cities < 10,000 (10%)
– 134 cities < 100,000 (70%)
– 29 cities - 200,000 (15%)
– 7 cities - 400,000 (4%)

2/29/2016
9
Largest Metropolitan Planning Organization (MPO) & Council of Government (COG)
Largest Metropolitan Planning Organization (MPO) & Council of Government (COG)
Founded in 1965Founded in 1965
191 Cities,6 Counties6 County Trans. Commissions
SCAG is Structured toResolve Regional IssuesSCAG is Structured toResolve Regional Issues
City Hall
Cities Too Small
State of California
State Too BIG
A Regional Forum that fosters collaboration and cooperation to compete globally and flourish locally
The Solution

2/29/2016
10
• Sustainable Communities Strategy (SCS) and Land Use
• Transportation
• Goods Movement
• Housing
• Air Quality
• Funding
• Long Term Growth Forecast
• Water
• and More...
SCAG Deals With Various Regional Planning Topics/Issues
19
20
Regional Challenges:
CONGESTION
AGING INFRASTRUCTURE
GLOBAL WARMING & CLIMATE CHANGE
ENVIRONMENTECONOMY
COMPETITIVENESS

2/29/2016
11
SCAG Organization ChartSCAG Organization Chart
Regional Council
Executive Director
Legal Services
PlanningPolicy/Gov. Relations
Administration
• Transportation Planning
• Land Use & Environmental Planning
• Regional Services & Public Affairs
• Legislation• Media & Public
Affairs
• Finance• Contract• HR• IT
Team WorkTeam Work
•150 SCAG staff
•Collaborate and team up with universities, top consultants, and stakeholders
•Partnership with automobile manufacturers and technology developers, and local/regional business leaders

2/29/2016
12
Policy-Making Process
Meets once a year:
Set the agency’s planning and policy priorities
Adopt SCAG’sGeneral Fund budget
Elect SCAG president
Approve changesin bylaws

2/29/2016
13
84 Voting Members
Meets once a month
Composed of:
Elected Officials from 65 Districts
6 County Representatives
6 County Transportation Commission Representatives
Mayor of Los Angeles
Tribal Nations
Receives Advice from Policy Committees
Executive Administration Committee
Energy & Environment Committee
Community, Economic & Human Development
Transportation Committee

2/29/2016
14
SCAG Staff Facilitates Policy & Decision Making SCAG Staff Facilitates Policy & Decision Making
SCAG Staff Work With Task Force and Committee Members to Make the Plans for their Area of Expertise as Practical and Effective as Possible
Regional Council
Energy & Environment Committee
Transportation & Communications Committee
Administration Committee
Community, Economic & Human Development
Plans and Policies Crafted & Endorsed
Final Approval
Collaboration with Partner Organizations Collaboration with Partner Organizations
SCAG
LOCALLOCAL COMMUNITYCOMMUNITY
FEDERALFEDERALSTATESTATE
SubregionsGeneral Public
Developer Orgs.Public Health Orgs.
Local JurisdictionsCo. Transportation CommissionsAir Quality Management Districts
Highway (FHA)Transit (FTA)
Aviation (FAA)Railroad (FRA)
Environment (EPA)Housing (HUD)
Transportation(DOT/CTC)Air Quality (CARB)Councils of Government(CALCOG)Housing (HCD)

2/29/2016
15
Planning Functions & Activities Are Funded By
Federal & State Transportation and Other Planning Grants (over 90%)$
$ Membership Dues
Regional Council Activities
Annual General Assembly
Legislation Coordination
SCAG Also Acts AsSCAG Also Acts As
•ForecastingAn InformationClearing House
GIS/Mapping
Forecasting
Regional Statistics
Data/Analysis
-800,000
-600,000
-400,000
-200,000
0
200,000
400,000
600,000
800,000
1,000,000
70-75 75-80 80-85 85-90 90-95 95-00 00-05 05-10 10-15 15-20 20-25 25-30 30-35 35-40
SCAG Region California
-800,000
-600,000
-400,000
-200,000
0
200,000
400,000
600,000
800,000
1,000,000
70-75 75-80 80-85 85-90 90-95 95-00 00-05 05-10 10-15 15-20 20-25 25-30 30-35 35-40
SCAG Region California
10,090
11,642
14,732
16,616
18,759
20,627
22,410
23,937
0
2,500
5,000
7,500
10,000
12,500
15,000
17,500
20,000
22,500
25,000
1970 1980 1990 2000 2010 2020 2030 2040
10,090
11,642
14,732
16,616
18,759
20,627
22,410
23,937
0
2,500
5,000
7,500
10,000
12,500
15,000
17,500
20,000
22,500
25,000
1970 1980 1990 2000 2010 2020 2030 2040

2/29/2016
16
ProgressProgressVisionVision
Leadership Leadership
Which promote economic growth, personal well-being, and livable communities for all Southern Californians
&&
Major Major
Responsibilities,Responsibilities,Programs, Programs,
Projects Projects

2/29/2016
17
33
Next Steps
Address Greenhouse Gas (GHG) Emissions as an element of the RTP
34
New Programs and SubcommitteesImplementation Assistance for SCS
• Expanded Compass Blueprint
• Green Region Initiative
• General Plan Update Assistance
• New Subcommittees in 6 focus areas1. Transit/High Speed Rail
2. Active Transportation
3. Goods Movement
4. Transportation Finance
5. Public Health
6. Sustainability

2/29/2016
18
35
Major Demographic Trends
Aging
Diversity
Focus on Aging,
Will discuss diversity/ethnicity impacts and implications in another slide presentation
36
CSIS Global Aging Initiative
Richard JacksonDirector and Senior Fellow, Global Aging Initiative

2/29/2016
19
37
Headwind/Drag or Penalty Instead of “Dividend”
Labor force supply (size)—maturing of young population, with accompanying public policies
• Public health• Family planning• Education• Economic policies
38
Dowell MyersSchool of Policy, Planning,
and DevelopmentUniversity of Southern California
For more informationGoogle “popdynamics” 2007
Thomas & ZnaneckiAward
CA’s 3 Demographic Revolutions

2/29/2016
20
39
Aging and the Macroeconomy: Long-Term Implications of an Older Population

2/29/2016
21
2/29/2016
22
44
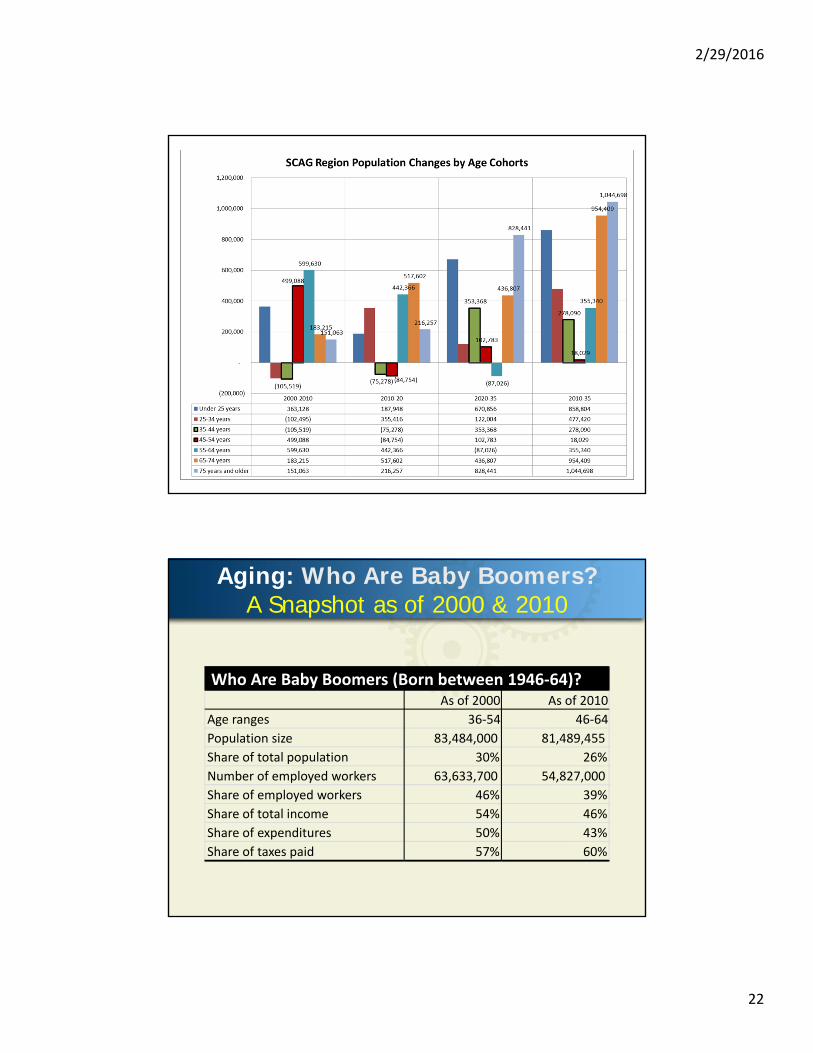
Aging: Who Are Baby Boomers? A Snapshot as of 2000 & 2010
As of 2000 As of 2010
Age ranges 36‐54 46‐64
Population size 83,484,000 81,489,455
Share of total population 30% 26%
Number of employed workers 63,633,700 54,827,000
Share of employed workers 46% 39%
Share of total income 54% 46%
Share of expenditures 50% 43%
Share of taxes paid 57% 60%
Who Are Baby Boomers (Born between 1946‐64)?

2/29/2016
23
Labor Force Participation Rates (%)by Age and Gender: 2010
0
10
20
30
40
50
60
70
80
90
100
16_24 25_34 35_44 45_54 55_64 65_74 75_up
Both
Male
Female

2/29/2016
24
$0
$2,000
$4,000
$6,000
$8,000
$10,000
$12,000
$14,000
$16,000
$18,000
0-19 20-34 35-44 45-54 55-64 65-74 75-84 85 andAbove
Other Retirement All Other Public Transfers
Public Education
Social Security
Health Care
Government Related Services Per Capita
Government Related Services Per Capita

2/29/2016
25
49
If Demography is Destiny…
y y
0
100,000
200,000
300,000
400,000
500,000
600,000
700,000
800,000
900,000
1,000,000
1,100,000
1,200,000
1,300,000
1,400,000
70-75 75-80 80-85 85-90 90-95 95-00 00-05 05-10 10-15 15-20 20-25 25-30 30-35 35-40
SCAG Region California
Source: State of California, Department of Finance, Race/Ethnic Population with Age and Sex Detail, 1970-2040. Sacramento, CA, December 1998.
Age 65+ Population Growing--Impact on:Workforce/Job/Economy, Health Care Services, Public/Private Finance
50
Shift in Ages of the Population (2010 & 2035) SCAG Region
5.5
6.4
10.6
11.8
2.0
4.0
0 5 10 15 20 25
Population (millions)
Historic and Projected Population By Age Group
0-20
21-64
65+
2010
2035
30%
29%
59%
53%
11%
18%
Source: US Census Bureau, SCAG
50

2/29/2016
26
51
Alternative View Point:Growing Debate About Dwindling Innovation
Will we ever invent anything this useful
again?
52
A Slower Productivity Growth in Place?

2/29/2016
27
53
A simulation: Projected Job growth
1. Use projected population growth by age cohorts
2. Apply assumptions of future labor force participation rates by age
3. Derive the growth in labor force

2/29/2016
28
55
U.S. Labor Force Participation Rates Assumptions for Old Age Cohorts
0%
5%
10%
15%
20%
25%
30%
35%
40%
45%
50%
55%
60%
65%
70%
55-64 65-74 75+
lab
or
forc
e p
arti
cip
atio
n r
ate
1980 1990 2000 2010 2025 2040
56
SCAG Historical* and Projected** Employment Growth
3.6% 3.5%
1.9%
4.5%
1.5%
2.8%
-1.1%
2.6%2.4%
1.7%2.1%
0.8% 0.8% 0.7% 0.6% 0.7% 0.7%
-1.5%
-1.0%
-0.5%
0.0%
0.5%
1.0%
1.5%
2.0%
2.5%
3.0%
3.5%
4.0%
4.5%
5.0%
19
60
-65
19
65
-70
19
70
-75
19
75
-80
19
80
-85
19
85
-90
19
90
-95
19
95
-00
19
60
-00
20
00
-05
20
05
-10
20
10
-15
20
15
-20
20
20
-25
20
25
-30
20
30
-35
20
35
-40
* Historical job growth rates are calculated using non-farm wage and salary jobs only
** Projected employment growth rates are calculated using total jobs (total wage and salary jobs plus self-employment)
WHY? it is aging and baby boomer retirement after 2010 cause this low job growth

2/29/2016
29
58
A simulation: Projected Impacts on Income/Expenditure/Taxes Paid
1. Use historical and projected population/household growth by age cohorts
2. Apply assumptions of household income, expenditures, and taxes paid by age cohorts
3. Derive the projected growth in income, expenditure, and taxes paid
4. Compare with a fixed household distribution by age cohorts as 2010.

2/29/2016
30

2/29/2016
31
Summary Demography is destiny!?
The region’s population is aging and will be more diversified
Population growth by age cohorts provides valuable information on timing and phasing of future growth challenges
The slow growth of employment after 2010 is particularly worrisome, the region needs collectively to communicate this demographic trends, to build up consensus, and to assess the likely impacts in every aspects of our life and regional planning
An aging society will also generate new opportunities--different growing industries, ethnic markets, and communities
Population aging will post challenges and crisis, however, challenges and crisis can be met with a reasonable set of policy
choices and early-on planning.
Collectively we may need think out of the box for nonconventional solutions

2/29/2016
32
New Demographics?
Tomorrow’s elderly will behave differently from today’s elderly--Baby Boomers will be different from their parents. But how?
Some of the elderly workers will stay longer in the labor force. But to what extent?
Most baby boomers will age in place, but what are many boomers next move?
Will the young behaves differently? The cheapest generation: They don’t like to drive or too poor to drive or move out?
Will the native born second generation immigrants fare better than baby boomers?
New Demographics (Continued)?
Will immigrants continue to cram into crowded quarters as they come to the region for jobs?
Will the different lifestyle and housing needs of aging Baby Boomers and young Hispanics shape development patterns and affect voting decisions on land use issues?
Will there be an intergenerational agreement/contract or conflicts regarding how to fund the boomer retirements and health care demand and balance the government budget and support for that services
International collaboration and cooperation, including immigration and assistance in developing countries a must in the future?
The projected surge of the number of middle class in developing countries—How to attract them, both their investment and intellectual assets?

2/29/2016
33
65
Milken Institute Population Aging Initiative
66
Strategies/Solutions1. Market responses/new products: multiple-generation housing, share
kitchen/bath dormitory style Apt or Condo (redefine overcrowding, housing with problems?)
2. New planning areas: Aging friendly cities/house, and neighborhood design or retrofit for an aging society
3. Institutional/legislature/economic incentives: delay retirement, raise ages for full retirement benefits, health care or retirement reform, budget cut, raise taxes
4. Innovation/productivity: Is an aging society less innovative and productive? Long term energy costs and sources from natural gas
5. Traditional fiscal stimulus/monetary policies-POMO*/Austerity: Are they feasible? Will they work? Political acceptable?
6. Encourage more kids? Currently unused/under utilized labor force?7. Immigration/Foreign direct investment (How to attract them?)8. Others?9. Governance

2/29/2016
34
International/Intergenerational Social Contract or Conflicts?
• Encourage more children?!
• A short cut?: welcome more immigrants
• Children’s education
• Workforce training• Older worker’s issue • Seniors’ Pensions, health care • Home-Sellers• Retirement and aging to foreign
countriesMature Adults:• Maximum Financial
Contributions• Emerging middle
class from Asian developing countries
• Foreign direct investment
• Replacement Workers• New Taxpayers• New Home Buyers• International Students• New immigrants
the cycle of
roles
$$
$$
$$
$$
Source: SCAG revision based on Immigrants and Boomers, Chapter 9
Thank you!Frank Wen ([email protected])
Southern California Association of Governments


![[XLS]registrar.uconn.edu · Web view2622 30 19 0 11 0 0 1165 25 13 12 0 0 0 2489 1 0 1 0 0 0 1133 20 14 6 0 0 0 1150 20 14 6 0 0 0 1155 20 9 11 0 0 0 1156 20 9 11 0 0 0 1152 20 16](https://static.fdocuments.us/doc/165x107/5b06f3007f8b9ad5548d91f9/xls-view2622-30-19-0-11-0-0-1165-25-13-12-0-0-0-2489-1-0-1-0-0-0-1133-20-14-6.jpg)