Presentation on UNCTAD LDCs Report 2013 by Dr Fahmida Khatun
47
UNCTAD’S LDCs REPORT 2013 Growth with Employment for Inclusive & Sustainable Development Dhaka: 20 November 2013 Media briefing on the Occasion of the Global Launch
Transcript of Presentation on UNCTAD LDCs Report 2013 by Dr Fahmida Khatun
UNCTAD’S LDCs REPORT 2013 Growth with Employment
for Inclusive & Sustainable Development
Dhaka: 20 November 2013
Media briefing on the Occasion of the Global Launch
Outline
2
q Information on LDCs
q Recent Trends & Outlook for the LDCs
q Comparative Analysis of Bangladesh’s Performance with Respect to other LDCs
q Exploring Demographic Dynamics in the LDCs
q Employment Trends in LDCs
q A Framework for Linking Employment Creation & Development of Productive Capacities in the LDCs
q Policy Recommendations for Employment-Intensive Growth in the LDCs

Information on LDCs
3
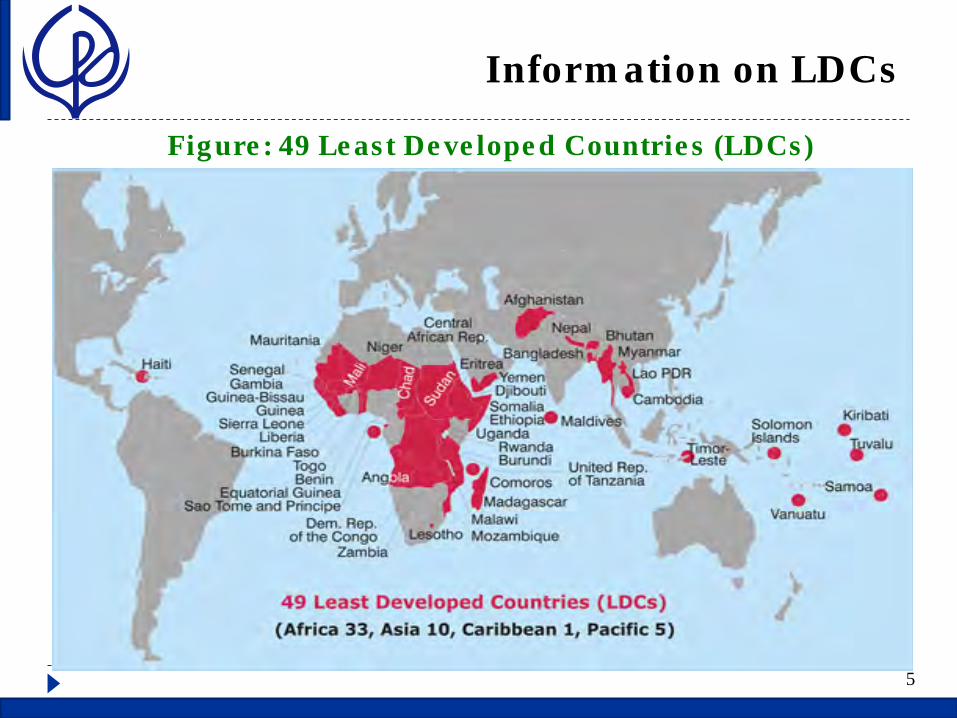
§ The LDC category was established in 1971 § Since 1971, only 3 countries have so far "graduated"
from the category:
ü Botswana in 1994, ü Cape Verde in 2007 & ü Maldives in January 2011
§ Samoa is expected to graduate in December 2014 § In 1971, there were 25 LDCs; in 2013, there are 49
LDCs.
Information on LDCs
4
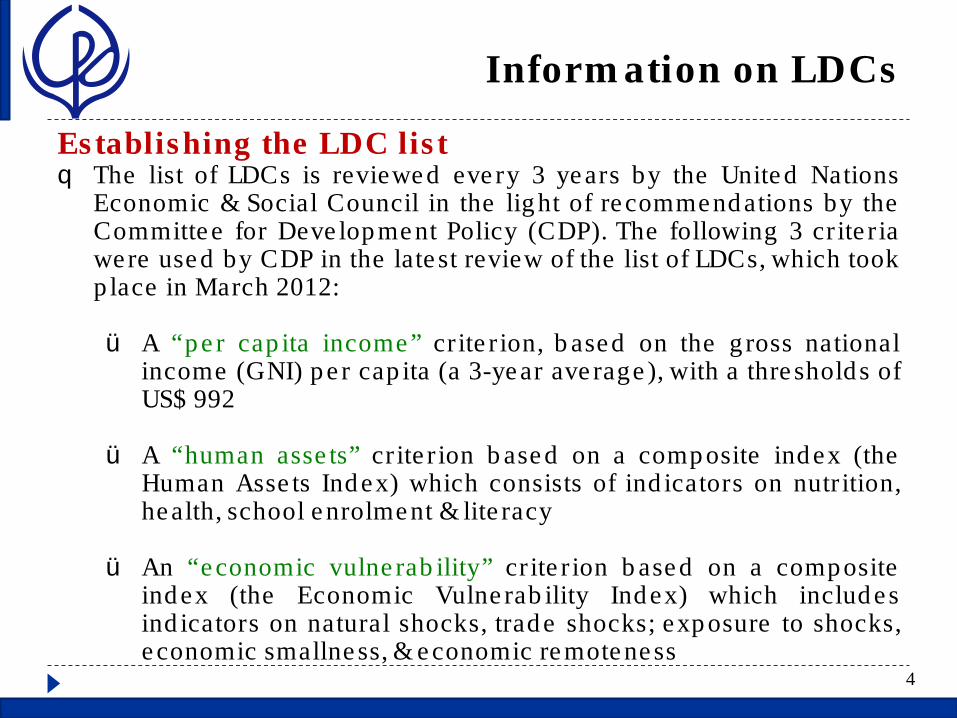
Establishing the LDC list q The list of LDCs is reviewed every 3 years by the United Nations
Economic & Social Council in the light of recommendations by the Committee for Development Policy (CDP). The following 3 criteria were used by CDP in the latest review of the list of LDCs, which took place in March 2012:
ü A “per capita income” criterion, based on the gross national
income (GNI) per capita (a 3-year average), with a thresholds of US$ 992
ü A “human assets” criterion based on a composite index (the Human Assets Index) which consists of indicators on nutrition, health, school enrolment & literacy
ü An “economic vulnerability” criterion based on a composite index (the Economic Vulnerability Index) which includes indicators on natural shocks, trade shocks; exposure to shocks, economic smallness, & economic remoteness
Information on LDCs
5
Figure: 49 Least Developed Countries (LDCs)
6
Recent Trends & Outlook for the
LDCs
Recent Trends & Outlook for the LDCs
7
Recent Trends § Despite the slow global recovery, real GDP growth in the LDCs
has picked up from 4.5 % in 2011 to 5.3 % in 2012 § There were 15 LDCs with growth rates exceeding 6 %, but also
10 with growth rates below 3 % § 31 LDCs had an investment rate below the 25% benchmark § The gross domestic savings rate was lower than the gross
capital formation rate in 40 of the 48 LDCs in 2011
Recent Trends & Outlook for the LDCs
8
Recent Trends § The share of agriculture in GDP decreased in 33 LDCs &
increased in 14 between 1999–2001 & 2009–2011 § The share of manufacturing increased in only 19 LDCs, stayed
the same in 3, & decreased in 25 § The share of services in GDP increased in 28 LDCs, remained
unchanged in 1, & declined in 18 For the LDCs as a group, the average share of agriculture declined from 31.4 % of GDP in 1999–2001 to 25.6 % in 2009–2011 while the share of manufacturing stayed the same, at around 10 % of GDP
Recent Trends & Outlook for the LDCs
9
Recent Trends § The current account deficit for the LDCs as a group widened
substantially, from $10.5 billion in 2011 to $28.8 billion in 2012 § The terms of trade for the LDCs as a group continued to
improve in the 3 years since their sharp deterioration of 2009 § With respect to exports, the strong growth of about 25 % in
both 2010 & 2011 stalled to a mere 0.6 % in 2012 § The composition of LDCs’ merchandise exports reflects the
dominant position of fuels, which account for more than half of the total.
Recent Trends & Outlook for the LDCs
10
Recent Trends § The largest items in the import structure of the LDCs as a
group are food (36.9 %) & agricultural raw materials (22 %)
High prices of food, especially of cereals, remain a major problem for poor people in the LDCs.
§ FDI inflows to LDCs hit a record high of almost $26 billion in
2012, which is about 20 % more than in 2011 § The flow of workers’ remittances to the LDCs continued to
expand in 2012, reaching a new record of $30.5 billion
Recent Trends & Outlook for the LDCs
11
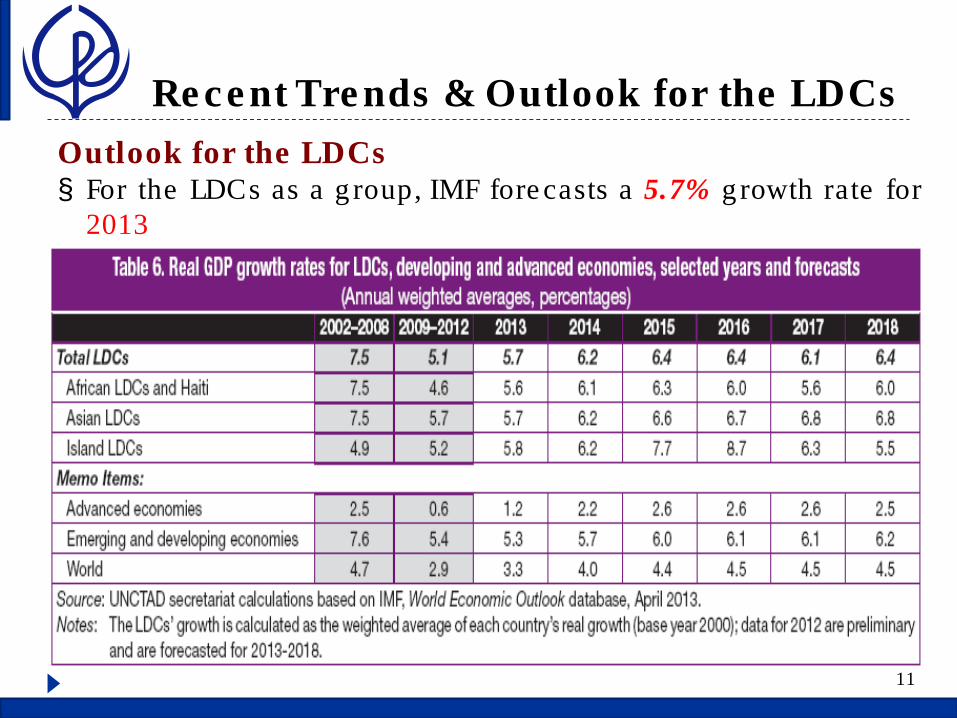
Outlook for the LDCs § For the LDCs as a group, IMF forecasts a 5.7% growth rate for
2013
Recent Trends & Outlook for the LDCs
12
Outlook for the LDCs The outlook for the LDCs in the short to medium term is not very good § The recent slowdown of world trade likely to have further
negative impacts on the prospects of the LDCs § The short-term outlook for commodity prices is highly uncertain,
not only because of possible supply-side disruptions (energy, food), but also because of demand uncertainties
§ North America is forecast to become self-sufficient in energy
production by the end of the decade... à will have a significant impact on the fuel-exporting LDCs, whose income from oil could be substantially reduced
13
Comparative Analysis of Bangladesh’s Performance with
Respect to other LDCs
Comparative Analysis of Bangladesh’s Performance
14
Country GNI per capita (current dollar)
Economic Vulnerabili
ty Index
Human
Assets Index
Income Level Human Developme
nt Index Rank
Multi-dimensional Poverty
Index
2012 CDP 2012 Review 2012 2012 2012
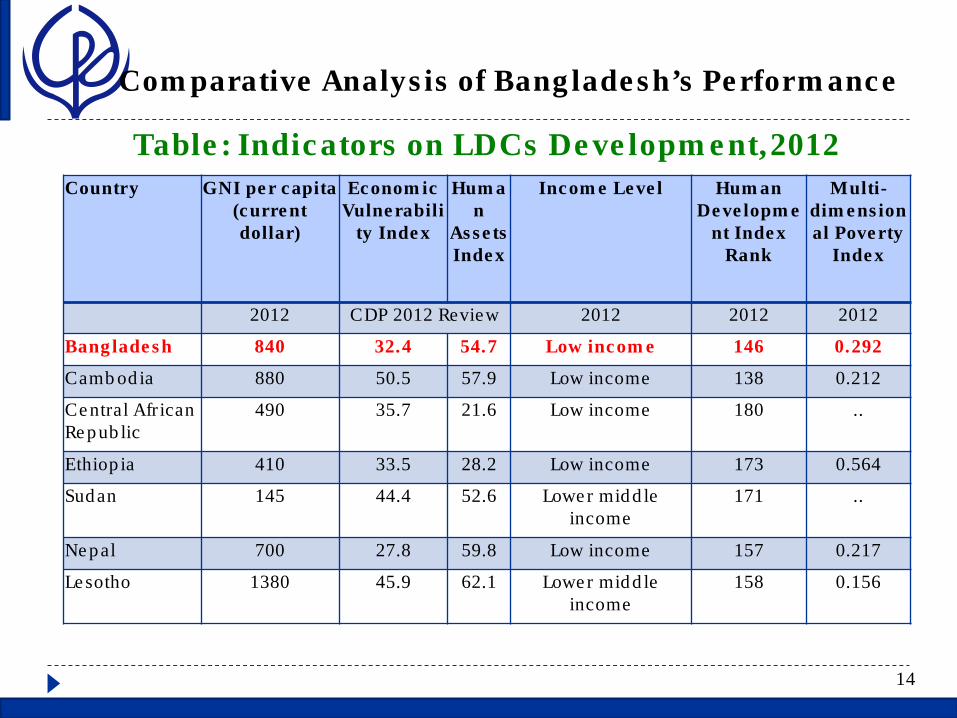
Bangladesh 840 32.4 54.7 Low income 146 0.292
Cambodia 880 50.5 57.9 Low income 138 0.212
Central African Republic
490 35.7 21.6 Low income 180 ..
Ethiopia 410 33.5 28.2 Low income 173 0.564
Sudan 145 44.4 52.6 Lower middle income
171 ..
Nepal 700 27.8 59.8 Low income 157 0.217
Lesotho 1380 45.9 62.1 Lower middle income
158 0.156
Table: Indicators on LDCs Development,2012
Comparative Analysis of Bangladesh’s Performance
15
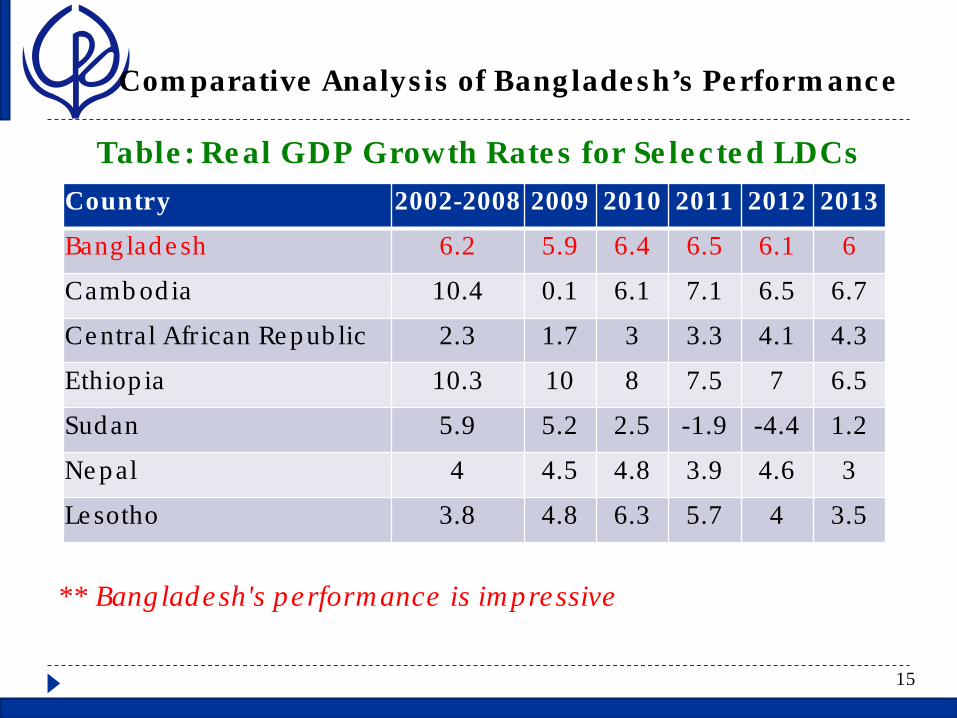
Table: Real GDP Growth Rates for Selected LDCs
** Bangladesh's performance is impressive
Country 2002-2008 2009 2010 2011 2012 2013
Bangladesh 6.2 5.9 6.4 6.5 6.1 6
Cambodia 10.4 0.1 6.1 7.1 6.5 6.7
Central African Republic 2.3 1.7 3 3.3 4.1 4.3
Ethiopia 10.3 10 8 7.5 7 6.5
Sudan 5.9 5.2 2.5 -1.9 -4.4 1.2
Nepal 4 4.5 4.8 3.9 4.6 3
Lesotho 3.8 4.8 6.3 5.7 4 3.5
Comparative Analysis of Bangladesh’s Performance
16
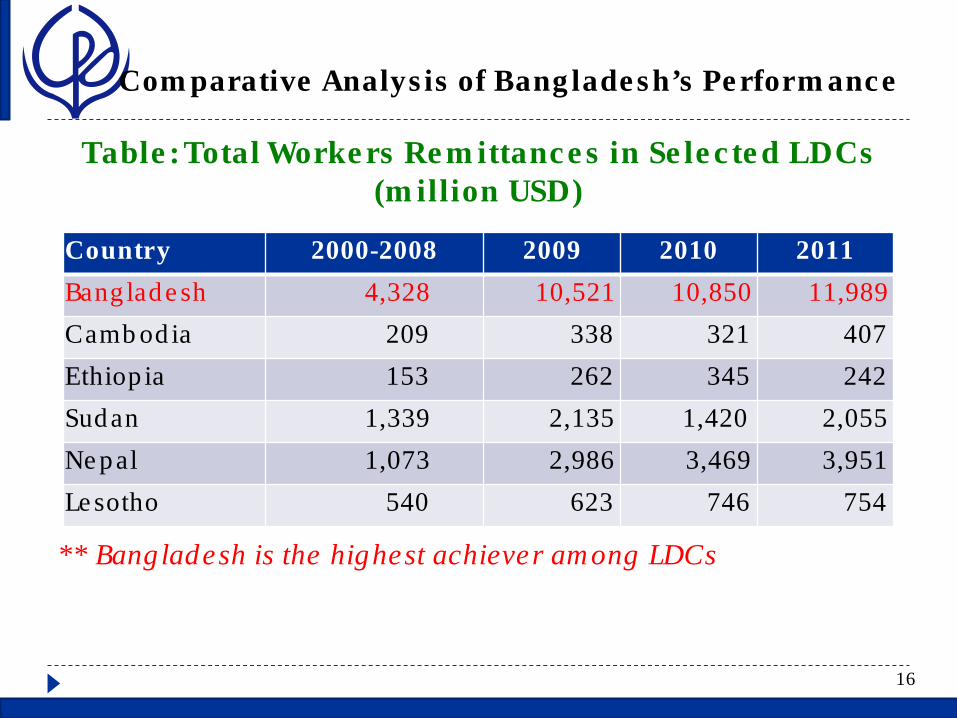
Table: Total Workers Remittances in Selected LDCs (million USD)
** Bangladesh is the highest achiever among LDCs
Country 2000-2008 2009 2010 2011 Bangladesh 4,328 10,521 10,850 11,989 Cambodia 209 338 321 407 Ethiopia 153 262 345 242 Sudan 1,339 2,135 1,420 2,055 Nepal 1,073 2,986 3,469 3,951 Lesotho 540 623 746 754
17
Exploring Demographic Dynamics in the LDCs
Exploring Demographic Dynamics in the LDCs
18
Rationale for Addressing Growth with Employment in LDCs § The LDCs have generally enjoyed more than 10 years of
economic growth à Such growth has not generated enough “quality” jobs, especially for the young
§ The LDCs’ employment growth lagged behind their rapid GDP
expansion during the 2000s § Creating more jobs & better jobs is the only sustainable
way to alleviate poverty
Exploring Demographic Dynamics in the LDCs
19
Rationale for Addressing Growth with Employment in LDCs § For most LDCs, their most valuable asset is their people, in
particular the young à engaging people in productive employment can ensure that growth is inclusive § The central premise of this Report is that employment creation
on a large scale is intrinsically linked to the development of productive capacities
à This Report suggests a policy framework that links employment creation & the development of productive capacities in LDCs
Exploring Demographic Dynamics in the LDCs
20
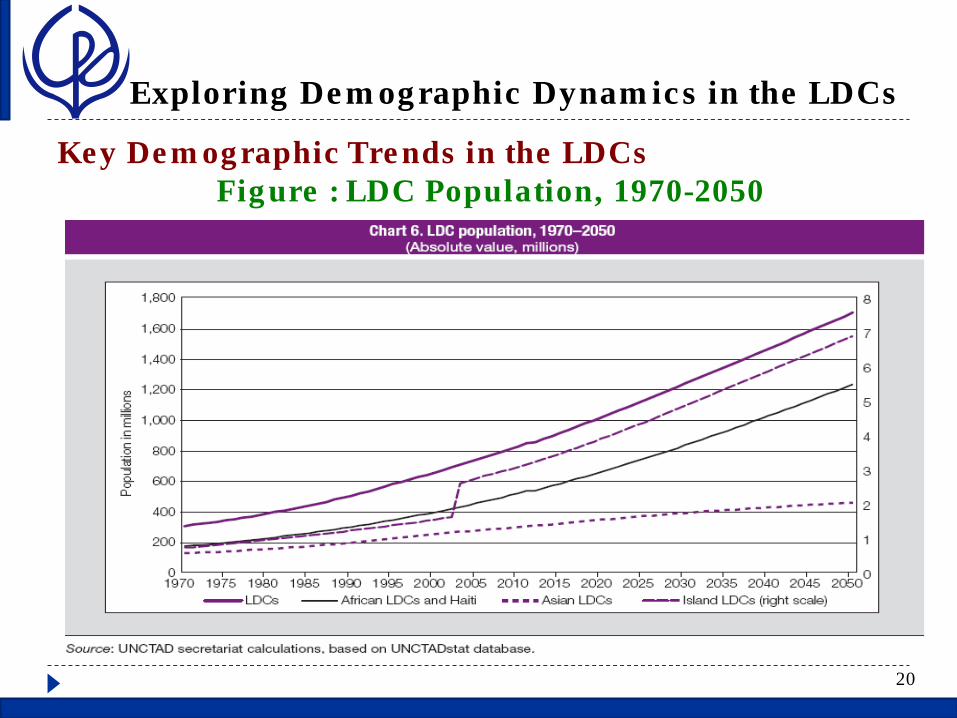
Key Demographic Trends in the LDCs Figure : LDC Population, 1970-2050
Exploring Demographic Dynamics in the LDCs
21
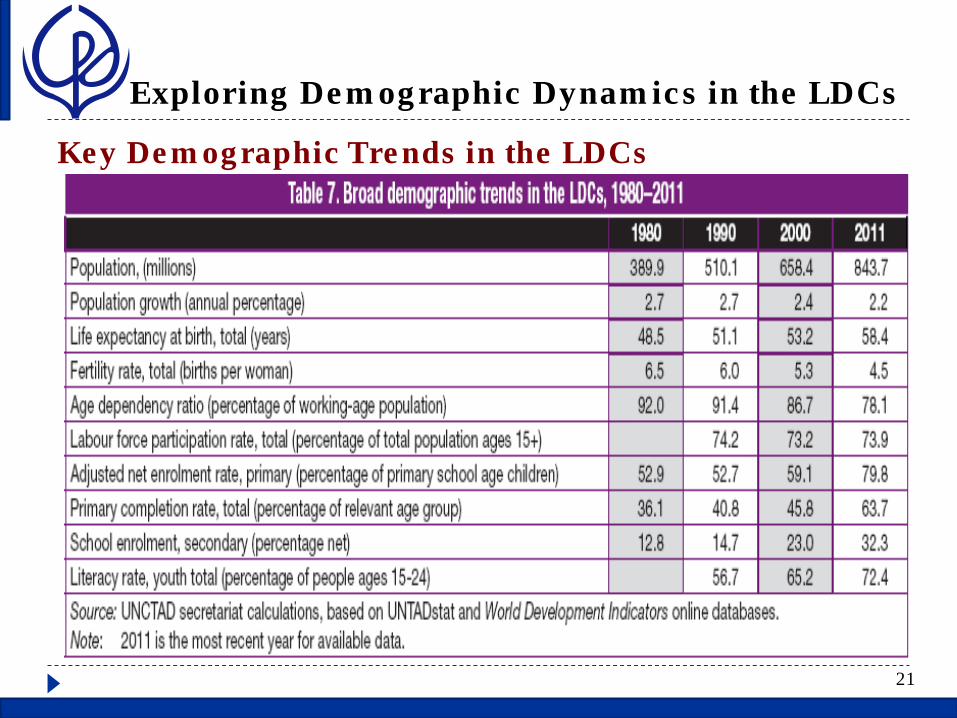
Key Demographic Trends in the LDCs
Exploring Demographic Dynamics in the LDCs
22
Key Demographic Trends in the LDCs § The LDC population is forecast to grow from 858 million in
2011 to 1 billion by 2020 & 1.7 billion by 2050 § The LDCs have the world’s highest population growth rate, at
2.2% per annum — almost twice the 1.2 % of other developing countries
§ Between 2010 & 2050, the LDC working-age population is
expected to increase by an average 15.7 million people per year
§ By 2050, one in four 15–24-year olds worldwide will live in an
LDC
Exploring Demographic Dynamics in the LDCs
23
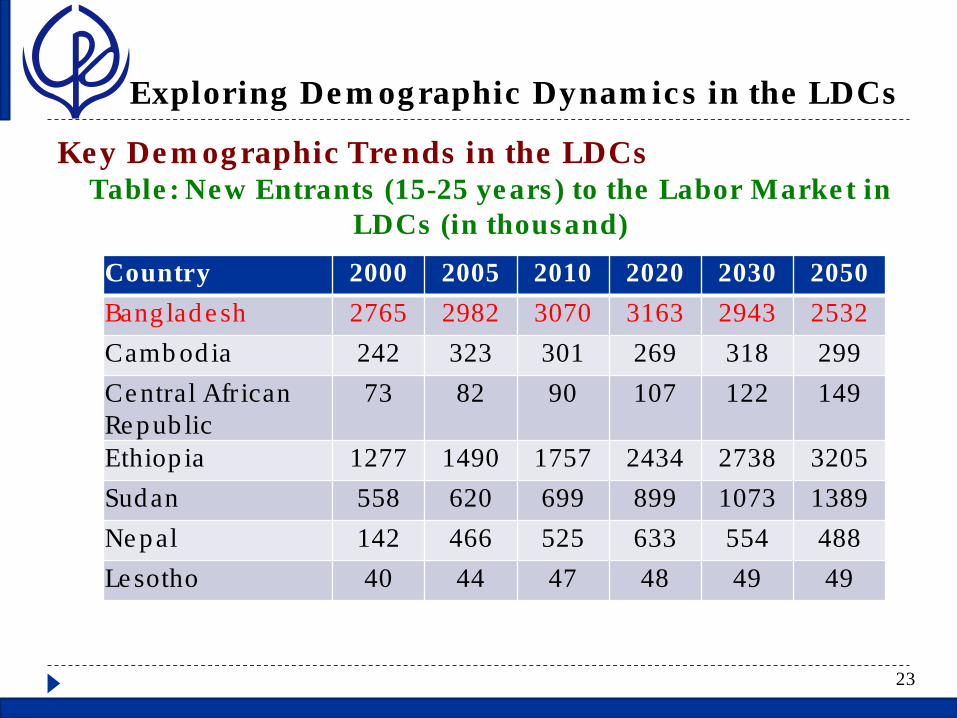
Key Demographic Trends in the LDCs Table: New Entrants (15-25 years) to the Labor Market in
LDCs (in thousand)
Country 2000 2005 2010 2020 2030 2050 Bangladesh 2765 2982 3070 3163 2943 2532 Cambodia 242 323 301 269 318 299 Central African Republic
73 82 90 107 122 149
Ethiopia 1277 1490 1757 2434 2738 3205 Sudan 558 620 699 899 1073 1389 Nepal 142 466 525 633 554 488 Lesotho 40 44 47 48 49 49
Exploring Demographic Dynamics in the LDCs
24
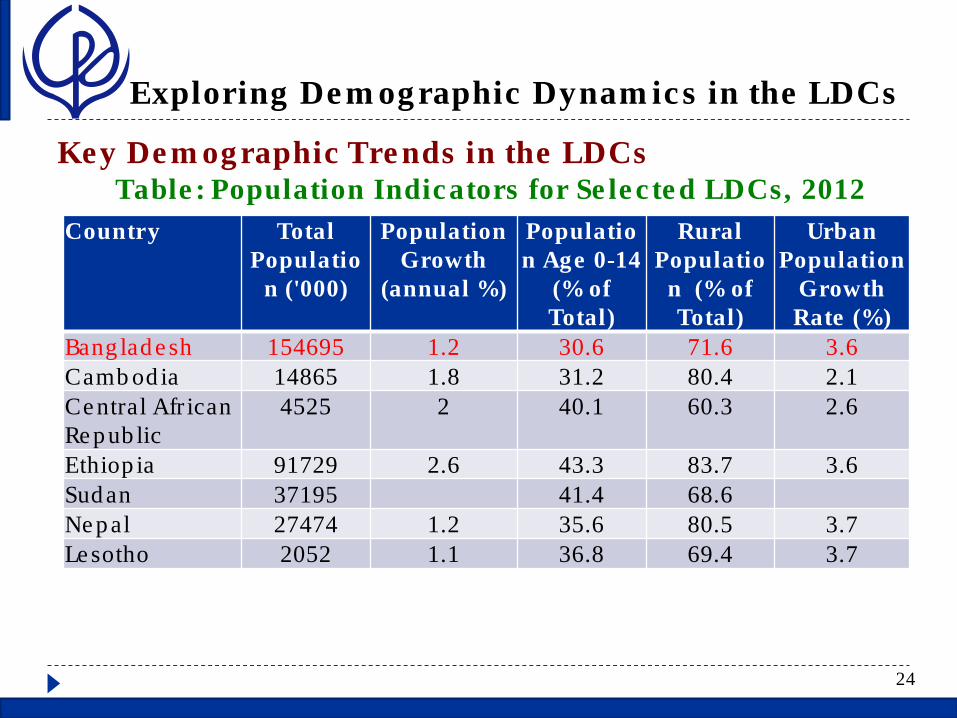
Key Demographic Trends in the LDCs Table: Population Indicators for Selected LDCs, 2012
Country Total
Population ('000)
Population Growth
(annual %)
Population Age 0-14
(% of Total)
Rural Populatio
n (% of Total)
Urban Population
Growth Rate (%)
Bangladesh 154695 1.2 30.6 71.6 3.6 Cambodia 14865 1.8 31.2 80.4 2.1 Central African Republic
4525 2 40.1 60.3 2.6
Ethiopia 91729 2.6 43.3 83.7 3.6 Sudan 37195 41.4 68.6 Nepal 27474 1.2 35.6 80.5 3.7 Lesotho 2052 1.1 36.8 69.4 3.7
Exploring Demographic Dynamics in the LDCs
25
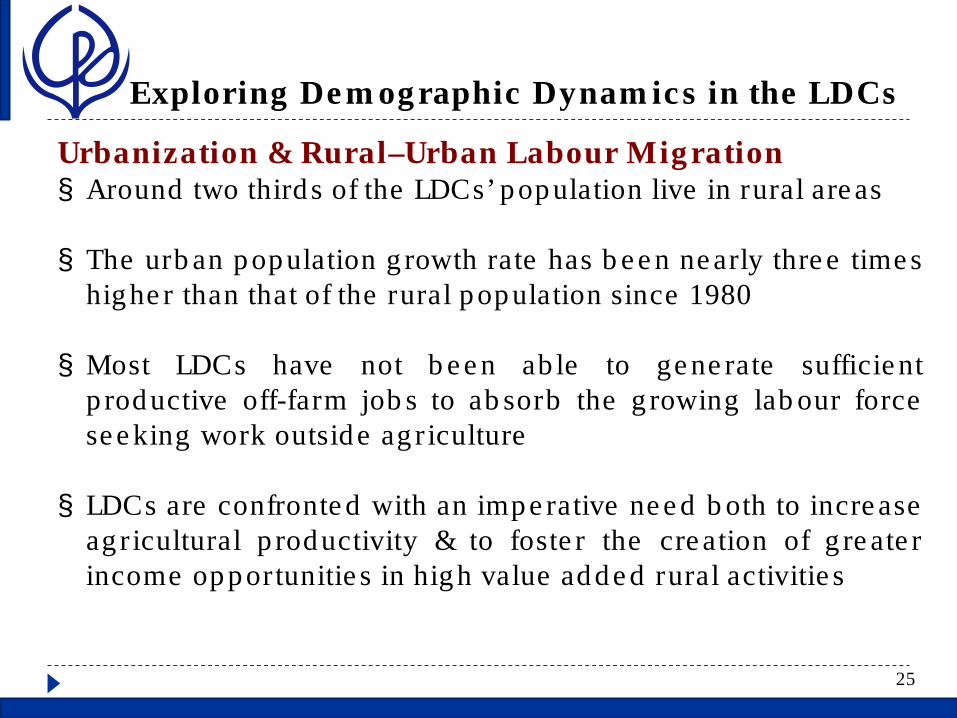
Urbanization & Rural–Urban Labour Migration § Around two thirds of the LDCs’ population live in rural areas § The urban population growth rate has been nearly three times
higher than that of the rural population since 1980 § Most LDCs have not been able to generate sufficient
productive off-farm jobs to absorb the growing labour force seeking work outside agriculture
§ LDCs are confronted with an imperative need both to increase
agricultural productivity & to foster the creation of greater income opportunities in high value added rural activities
26
Employment Trends in LDCs
Employment Trends in LDCs
27
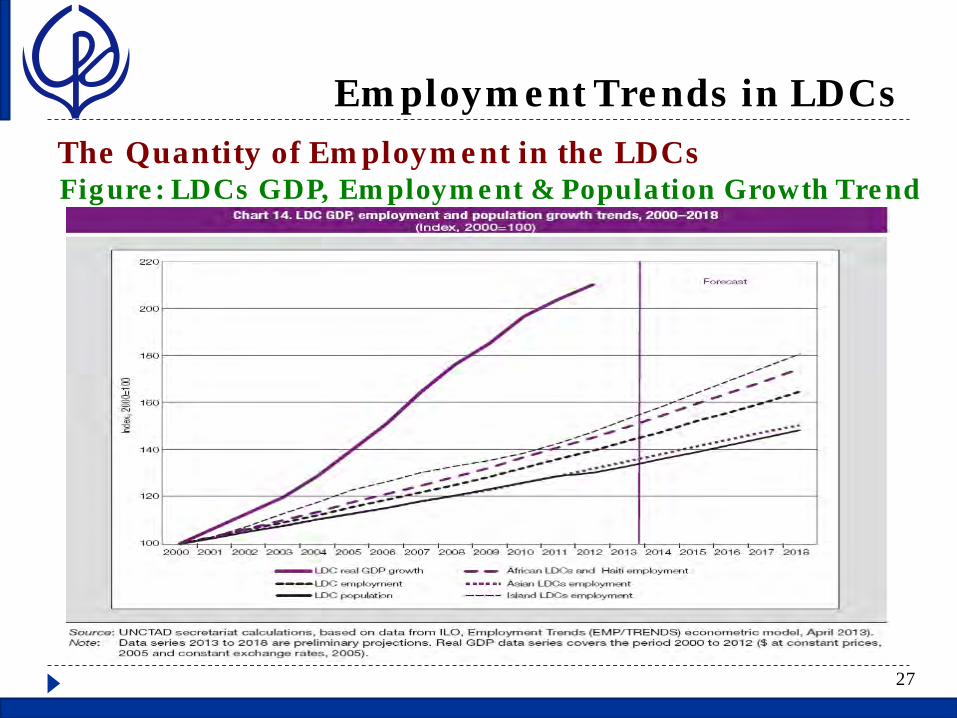
The Quantity of Employment in the LDCs Figure: LDCs GDP, Employment & Population Growth Trend
Employment Trends in LDCs
28
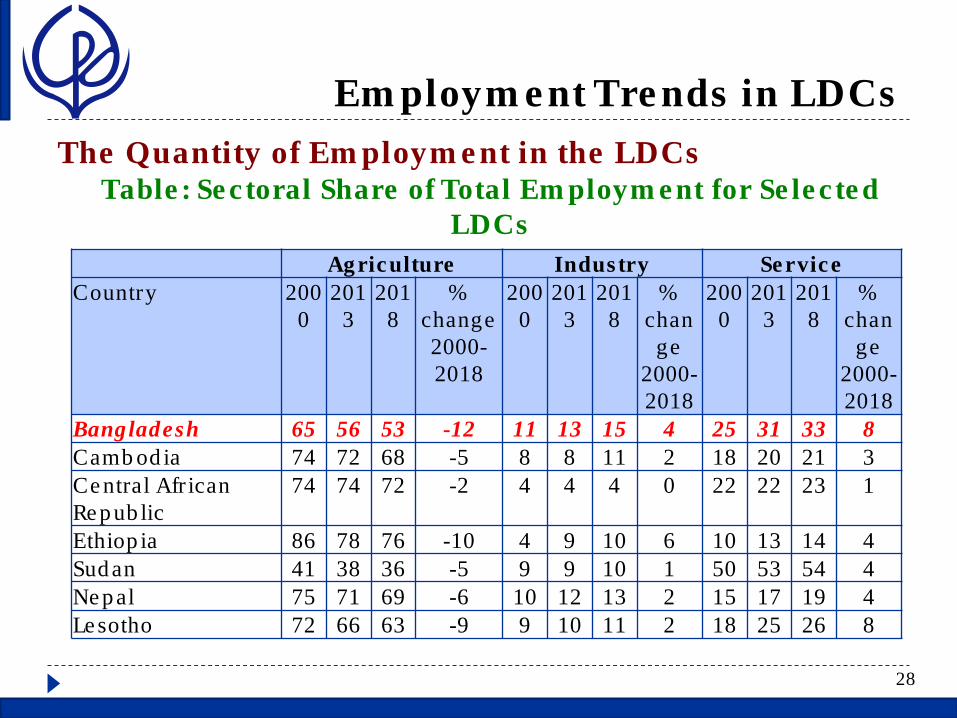
The Quantity of Employment in the LDCs Table: Sectoral Share of Total Employment for Selected
LDCs
Agriculture Industry Service Country 200
0 201
3 201
8 %
change 2000-2018
2000
2013
2018
% chan
ge 2000-2018
2000
2013
2018
% chan
ge 2000-2018
Bangladesh 65 56 53 -12 11 13 15 4 25 31 33 8 Cambodia 74 72 68 -5 8 8 11 2 18 20 21 3 Central African Republic
74 74 72 -2 4 4 4 0 22 22 23 1
Ethiopia 86 78 76 -10 4 9 10 6 10 13 14 4 Sudan 41 38 36 -5 9 9 10 1 50 53 54 4 Nepal 75 71 69 -6 10 12 13 2 15 17 19 4 Lesotho 72 66 63 -9 9 10 11 2 18 25 26 8
Employment Trends in LDCs
29
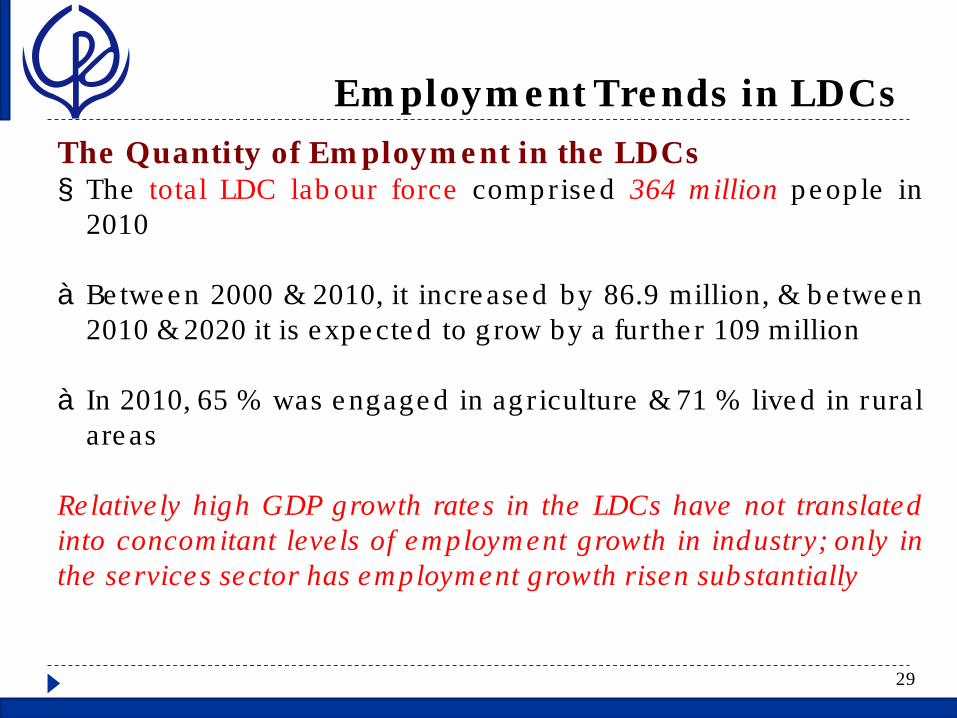
The Quantity of Employment in the LDCs § The total LDC labour force comprised 364 million people in
2010 àBetween 2000 & 2010, it increased by 86.9 million, & between
2010 & 2020 it is expected to grow by a further 109 million àIn 2010, 65 % was engaged in agriculture & 71 % lived in rural
areas
Relatively high GDP growth rates in the LDCs have not translated into concomitant levels of employment growth in industry; only in the services sector has employment growth risen substantially
Employment Trends in LDCs
30
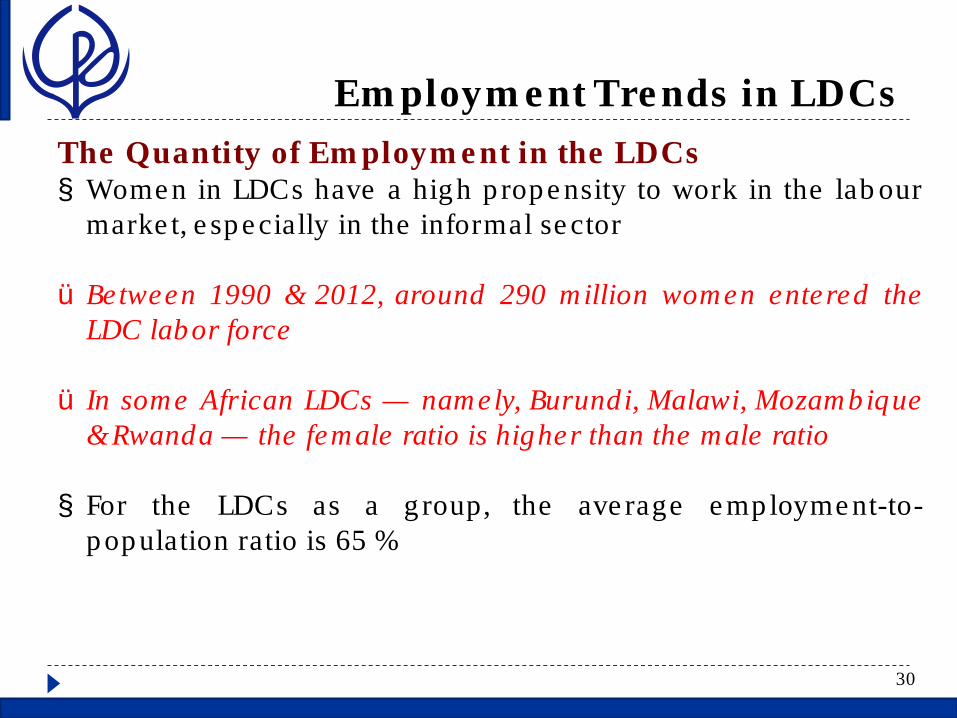
The Quantity of Employment in the LDCs § Women in LDCs have a high propensity to work in the labour
market, especially in the informal sector ü Between 1990 & 2012, around 290 million women entered the
LDC labor force ü In some African LDCs — namely, Burundi, Malawi, Mozambique
& Rwanda — the female ratio is higher than the male ratio § For the LDCs as a group, the average employment-to-
population ratio is 65 %
Employment Trends in LDCs
31
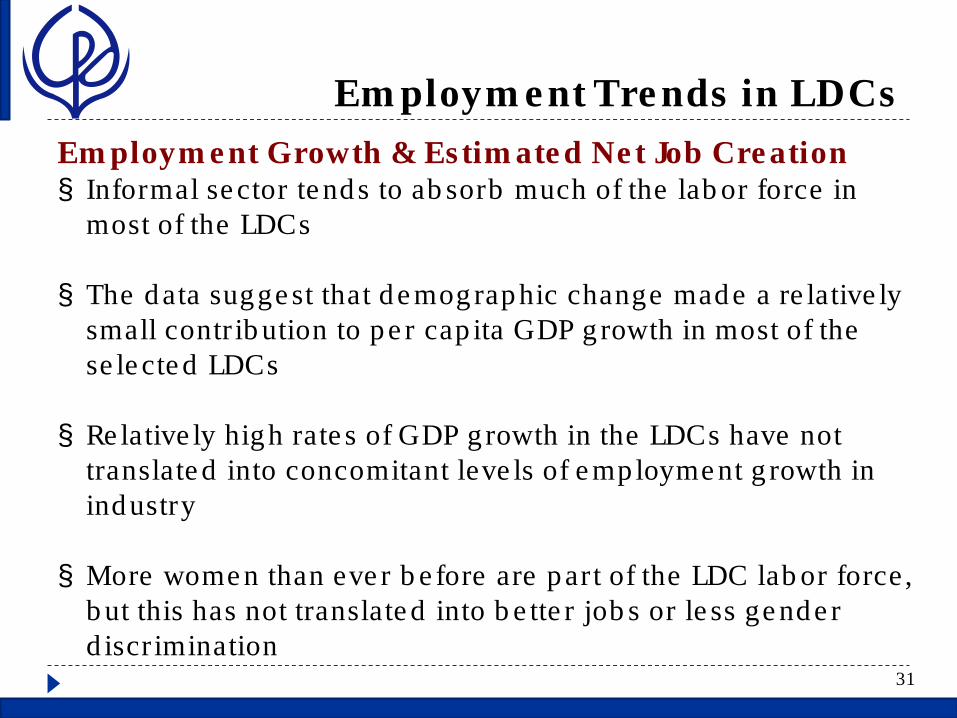
Employment Growth & Estimated Net Job Creation § Informal sector tends to absorb much of the labor force in
most of the LDCs § The data suggest that demographic change made a relatively
small contribution to per capita GDP growth in most of the selected LDCs
§ Relatively high rates of GDP growth in the LDCs have not
translated into concomitant levels of employment growth in industry
§ More women than ever before are part of the LDC labor force,
but this has not translated into better jobs or less gender discrimination
32
A Framework for Linking Employment Creation & Development of Productive
Capacities in the LDCs
Linking Employment Creation & Development of Productive Capacities in LDCs
33
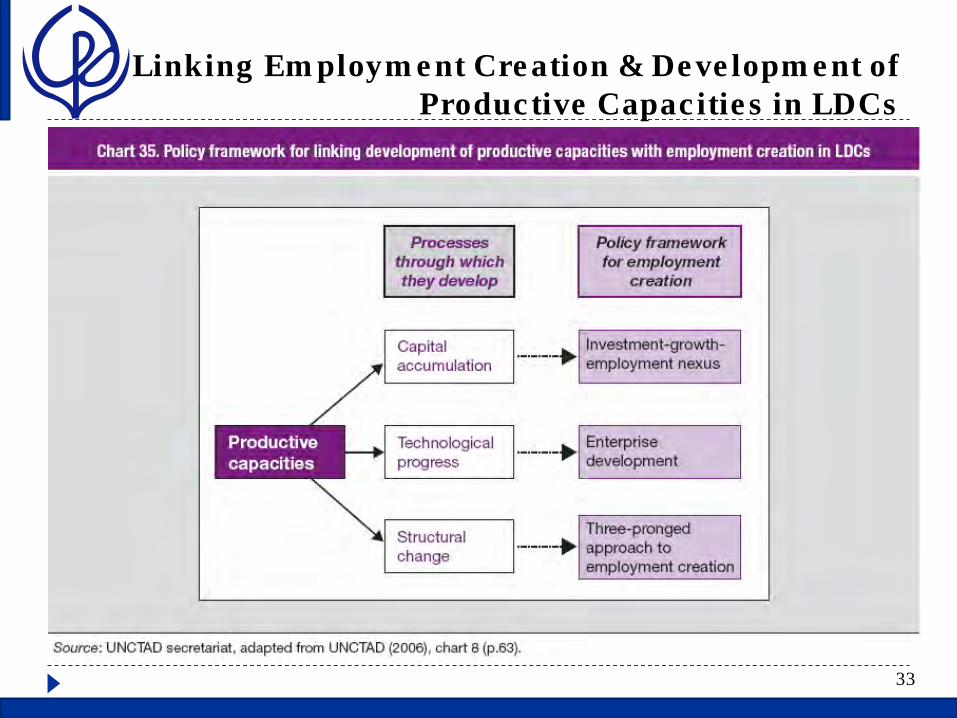
Linking Employment Creation & Development of Productive Capacities in LDCs
34
Investing to Develop Productive Capacities: Capital Accumulation § The successful cases of long-term economic growth have
invariably been associated with investment rates of 25 % or more
§ Given the relatively weak development of the private sector in
many LDCs, the primary investment push should come from the public sector
§ Public gross fixed capital formation (public investment) for the
group of 38 LDCs on average stood at 7.2 % of GDP over the period 1999–2001. Ten years later (2009– 2011), it reached on average 8.8 % of GDP
Linking Employment Creation & Development of Productive Capacities in LDCs
35
Enterprise Development & Technological Change § Successful enterprise development will enable the LDCs to
improve both the quantity & quality of employment creation § A substantial number of LDCs farms can learn & acquire
technologies from other developing countries, rather than from advanced economies, or can develop & use home-grown technologies
Linking Employment Creation & Development of Productive Capacities in LDCs
36
Structural Change § Transfer of labour from low productivity agriculture to low
productivity service activities in urban areas à cannot provide the surplus population released from agriculture with productive employment § The process of structural change should ideally be led by
üconsolidation & expansion of the modernizing core of the economy ücomposed of high value added üknowledge-intensive & competitive activities in
manufacturing & mining ümechanized agriculture & ümodern services
Linking Employment Creation & Development of Productive Capacities in LDCs
37
Structural Change § This Report has proposed a 3 approaches to employment
creation which addresses subsistence activities, tradables, & non-tradables
§ The logic behind the 3 pronged approach to employment
creation is that an increase in agricultural productivity releases labour that has to be absorbed by the rest of the economy — i.e., by tradable & non-tradable activities
§ Given that the tradables sectors are less likely to provide an
abundance of employment opportunities, employment creation in nontradable activities becomes critical
Linking Employment Creation & Development of Productive Capacities in LDCs
38
How to Adjust the Framework to Conditions in different LDCs Fuel & mineral producers & exporters § The policy challenge is to ensure that higher prices of
commodities &/or productivity growth in the extractive sector translate into greater domestic demand & more investment.
§ The priorities for these countries should be private sector
development organized around the extractive sectors with backward & forward linkages, & the investment-growth-employment nexus in non-tradables sector

Linking Employment Creation & Development of Productive Capacities in LDCs
39
How to adjust the Framework to Conditions in different LDCs Producers & exporters of agricultural products § Public investment should provide solid infrastructure to
connect the producers with major centers of consumption § For larger countries the development of agriculture can be
coupled with the development of domestic industry, enabling them to benefit from the complementarities & synergies between the two § For smaller countries, exporting agricultural surpluses &
developing production for international niche markets are viable options
Linking Employment Creation & Development of Productive Capacities in LDCs
40
How to adjust the Framework to Conditions in different LDCs Producers & exporters of manufactured goods § The first priority is to upgrade to more value added activities
in areas where some industrial capabilities already exist § The second priority for these countries is to cheapen wage
goods, especially food
41
Policy Recommendations for Employment Intensive Growth in the
LDCs
Policy Recommendations
42
Macroeconomic Strategies § Macroeconomic policies need to be reoriented away from a
single-minded focus on price stability & budget balance towards a strategy that is more focused on growth with sustainable employment creation
§ LDC Governments can strive to strengthen the mobilization of
external resources from both traditional & non-traditional sources § Regional funding of infrastructure can boost labour-intensive
public works projects, e.g. in the context of regional integration schemes or of internationally funded border crossing infrastructure projects
§ Monetary policy should aim at expanding credit for investments
& generating more productive employment.
Policy Recommendations
43
Managing the External Sector § LDC Governments should consider trade policy more
creatively, & look to regional arrangements as a way to stimulate the development of synergies across productive sectors.
§ Capital account regulations can be a useful component of
maximizing the benefits while minimizing the costs of free capital flows
§ In some LDCs, stabilization funds may be a particularly
effective instrument for managing volatility, caused by strong fluctuation in international prices of commodities
Policy Recommendations
44
State-led Employment Creation § Construction is a particularly fruitful area for encouraging
more labour intensive activities. § Building activities that use local materials, local technologies
& local small-scale enterprises have much greater potential to generate employment.
§ Labour-intensive techniques led to two to five times more
employment creation than alternative techniques. § Private activities account for the bulk of employment in LDCs
today, & will clearly continue to do so in future.
Policy Recommendations
45
Policies to Foster Entrepreneurship § Financial policy should be designed so that financial services
reach MSMEs & excluded groups § State development banks can provide long-term financing to
domestic companies on more favorable terms than market institutions
§ Microfinance per se is not an appropriate financing model for
enterprise development
Policy Recommendations
46
Policies to Foster Entrepreneurship § LDC policymaker need to pay more attention to ensuring that
clusters & EPZs are embedded in the national economy through linkages, labour movement & spillovers
§ Rural development is one of the main pillars of policies to
create more & better jobs in LDCs § Public investment must provide the lead in the
development of rural transport, irrigation, warehousing, energy, marketing & communications
§ Policies are needed to make institutional credit available
to all farmers, including tenants, women farmers & those without clear l& titles

47


![[XLS] · Web viewSADEKA KHATUN KHATUN SADEKA SAMEMA KHATUN MD JOSIMUDDIN NASRAT BANU HABIBUDDIN MAIAN MD AJMAUL ANSARI MD AFSAR ALI AKASH DAS KHAGENDRANATH DAS KHATUN HASNAHANA ...](https://static.fdocuments.us/doc/165x107/5aee60f77f8b9a585f919f59/xls-viewsadeka-khatun-khatun-sadeka-samema-khatun-md-josimuddin-nasrat-banu-habibuddin.jpg)