Presentation on Presentation on PerformancePerformance for ...
16
1/31/2014 12:10 PM 1 Presentation on Presentation on Performance Performance for the for the 9M/Quarter December 2013 9M/Quarter December 2013 1 2 Overview of Performance 2 Particulars Rs. Crore YOY Growth % Operating Profit : - Q3 Dec’13 2702 0.8 - 9M Dec'13 8211 1.9 Net profit : - Q3 Dec’13 755 -42.1 - 9M Dec'13 2536 -29.9 Total Business : 746780 9.3 Total Assets : 521918 11.0 Deposits : 420647 9.0 Credit : 326133 9.7
Transcript of Presentation on Presentation on PerformancePerformance for ...

1/31/2014 12:10 PM
1
Presentation on Presentation on PerformancePerformance
for the for the
9M/Quarter December 20139M/Quarter December 2013
1
2
Overview of Performance
2
Particulars Rs. Crore YOY Growth %
Operating Profit ::
- Q3 Dec’13 2702 0.8
- 9M Dec'13 8211 1.9
Net profit ::
- Q3 Dec’13 755 -42.1
- 9M Dec'13 2536 -29.9
Total Business :: 746780 9.3
Total Assets :: 521918 11.0
Deposits :: 420647 9.0
Credit :: 326133 9.7
1/31/2014 12:10 PM
2
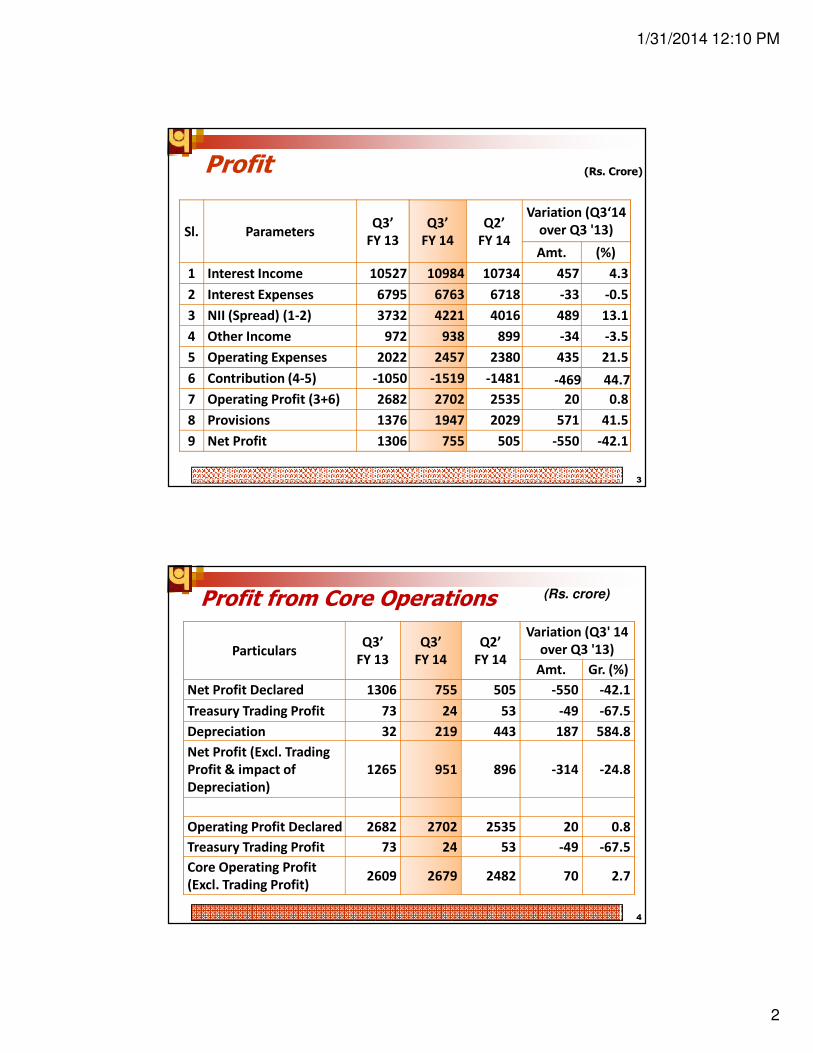
Profit (Rs. Crore)
3
Sl. Parameters Q3’
FY 13
Q3’
FY 14
Q2’
FY 14
Variation (Q3‘14
over Q3 '13)
Amt. (%)
1 Interest Income 10527 10984 10734 457 4.3
2 Interest Expenses 6795 6763 6718 -33 -0.5
3 NII (Spread) (1-2) 3732 4221 4016 489 13.1
4 Other Income 972 938 899 -34 -3.5
5 Operating Expenses 2022 2457 2380 435 21.5
6 Contribution (4-5) -1050 -1519 -1481 -469 44.7
7 Operating Profit (3+6) 2682 2702 2535 20 0.8
8 Provisions 1376 1947 2029 571 41.5
9 Net Profit 1306 755 505 -550 -42.1
Profit from Core Operations (Rs. crore)
4
Particulars Q3’
FY 13
Q3’
FY 14
Q2’
FY 14
Variation (Q3' 14
over Q3 '13)
Amt. Gr. (%)
Net Profit Declared 1306 755 505 -550 -42.1
Treasury Trading Profit 73 24 53 -49 -67.5
Depreciation 32 219 443 187 584.8
Net Profit (Excl. Trading
Profit & impact of
Depreciation)
1265 951 896 -314 -24.8
Operating Profit Declared 2682 2702 2535 20 0.8
Treasury Trading Profit 73 24 53 -49 -67.5
Core Operating Profit
(Excl. Trading Profit) 2609 2679 2482 70 2.7

1/31/2014 12:10 PM
3
Provisions (Rs. Crore)
5
Sl. ParticularsQ3’
FY 13
Q3’
FY 14
Q2’
FY 14
Variation (Q3' 14
over Q3 '13)
Amt. %
1
Provision towards NPAs
(Net of floating
provisions)
466 1083 1005 616 132.2
2Standard Adv. incl.
Standard Restructured310 278 434 -33 -10.5
4Depreciation on
Investment 32 219 443 187 584.8
5 Income Tax 575 357 131 -218 -37.9
6 Others -7 11 17 18
7 Total Provision 1376 1947 2029 571 41.5
Break-up : Income (Rs. Crore)
6
Sl. Parameters Q3’
FY 13
Q3’
FY 14
Q2’
FY 14
Variation (Q3' 14
over Q3 '13)
Amt. (%)
1 Interest on Advances 7885 8246 8023 361 4.6
2 Interest on Investments 2507 2599 2568 92 3.7
3 Other Interest Income 136 139 142 3 2.2
4 Interest Income (1+2+3) 10527 10984 10734 457 4.3
5 Other Income 972 938 899 -34 -3.5
of which
6 Core Non-Interest Income 708 775 783 67 9.5
7 Recovery in Written off a/cs 145 86 69 -59 -40.7
8 Trading Profit 73 24 53 -49 -67.5
9 Dividend from Liquid MF 50 41 30 -9 -18.0
10 Residual (incl. Derivative inc) -4 13 -35 16 -464.2
11 Total Income (4+5) 11499 11922 11633 423 3.7

1/31/2014 12:10 PM
4
Fee Based Income (Rs. Crore)
7
Sl. Particulars Q3’
FY 13
Q3’
FY 14
Q2’
FY 14
Variation (Q3' 14
over Q3 '13)
Amt. (%)
1 Processing Fees 72 87 102 15 21.1
2 LC/LG Income 190 199 178 9 4.7
3 Bills & Remittance 93 106 107 13 13.5
4 Incidental Charges 58 64 43 6 9.6
5 Inc from ATM operations 83 95 87 13 15.3
6 Income from Ins & MF 13 15 13 2 16.9
7 Misc. Income 84 101 91 17 20.6
8 Exchange Profit 114 107 161 -7 -6.3
9Core Non Interest
Income708 775 783 67 9.5
Break-up : Expenditure(Rs. Crore)
8
Sl. Parameters Q3’
FY 13
Q3’
FY 14
Q2’
FY 14
Variation (Q3' 14
over Q3 '13)
Amt. (%)
1 Intt. Paid on Deposits 6407 6315 6335 -92 -1.4
2 Intt. Paid on Borrowings 107 178 116 71 66.6
3 Others 282 270 267 -12 -4.2
4 Total Interest Paid (1+2+3) 6795 6763 6718 -33 -0.5
5 Estab. Expenses 1407 1758 1659 351 24.9
Of Which
5a Employee Benefits (AS-15) 515 649 579 134 26.1
6 Other Operating Expenses 614 699 721 85 13.8
7 Operating Expenses (5+6) 2022 2457 2380 435 21.5
8 Total Expenses (4+7) 8817 9220 9098 403 4.6

1/31/2014 12:10 PM
5
Cost & Yield Ratios (Annualized)
9
Sl.Sl. Particulars Particulars Q 3’Q 3’
FY FY 20132013
Q 3’Q 3’
FY FY 2014 2014
Q 2’Q 2’
FY FY 2014 2014
11 Cost of Deposit [%] Cost of Deposit [%] 6.756.75 6.336.33 6.446.44
22 Cost of Fund [%] Cost of Fund [%] 5.705.70 5.185.18 5.265.26
33 Yield on Advances [%] Yield on Advances [%] 10.9010.90 10.6010.60 10.4410.44
44 Yield on Investment [%] Yield on Investment [%] 7.937.93 7.847.84 7.897.89
55 Yield on Fund [%] Yield on Fund [%] 8.838.83 8.418.41 8.418.41
66 Net Interest Margin [%] Net Interest Margin [%] 3.473.47 3.573.57 3.473.47
Profitability Ratios (Annualized)
10
Sl. Sl. Particulars Particulars Q 3’Q 3’
FY FY 20132013
Q 3’Q 3’
FY FY 2014 2014
Q 2’Q 2’
FY FY 2014 2014
1 Return on Assets [%] 1.09 0.58 0.40
2 Return on Net worth [%] 17.42 8.91 6.11
3 Opt. Profit to AWF [%] 2.24 2.07 1.99
4 Cost to Income Ratio [%] 42.98 47.62 48.43
5 Estb. Exp. To Total Exp. [%] 15.96 19.07 18.23
6 Opt. Exp. To AWF [%] 1.69 1.88 1.86
7 Book Value per Share [Rs] 884.01 936.85 936.06
8 Earnings per share [Rs] 153.97 85.15 57.20
Cost to Income Ratio excl. Wage Revision: 44.13%

1/31/2014 12:10 PM
6
Quarterly Net Interest Margin
3.33
3.963.91
4.064.13
3.913.84
3.953.88
3.503.60
3.503.47
3.51 3.523.47
3.57
3.00
3.50
4.00
4.50
5.00NIM
11
Profit (Rs. Crore)
12
Sl. Parameters Dec'12 Dec'13 Mar'13
Variation (Dec'13
over Dec'12)
Amt. (%)
1 Interest Income 31509 32122 41893 613 1.9
2 Interest Expenses 20437 19978 27037 -459 -2.2
3 NII (Spread) (1-2) 11073 12144 14857 1072 9.7
4 Other Income 3047 3180 4216 133 4.4
5 Operating Expenses 6064 7113 8165 1049 17.3
6 Contribution (4-5) -3017 -3933 -3949 -916 30.4
7 Operating Profit (3+6) 8056 8211 10907 155 1.9
8 Provisions 4439 5675 6160 1236 27.8
9 Net Profit 3617 2536 4748 -1081 -29.9

1/31/2014 12:10 PM
7
Profit from Core Operations (Rs. crore)
13
Particulars Dec'12 Dec'13 Mar'13
Variation (Dec'13
over Dec'12)
Amt. (%)
Net Profit Declared 3617 2536 4748 -1081 -29.9
Treasury Trading Profit 219 360 487 141 64.1
Depreciation -87 754 104 841
Net Profit (Excl. Trading
Profit & impact of
Depreciation)
3311 2930 4365 -380 -11.5
Operating Profit
Declared8056 8211 10907 155 1.9
Treasury Trading Profit 219 360 487 141 64.1
Core Operating Profit
(Excl. Trading Profit) 7836 7851 10421 15 0.2
Provisions (Rs. Crore)
14
Sl. Particulars Dec'12 Dec'13 Mar'13
Variation (Dec'13
over Dec'12)
Amt. (%)
1
Provision towards NPAs
(Net of floating
provisions)
2506 2762 3336 256 10.2
2Standard Adv. Incl.
Standard Restructured490 994 874 504 102.9
4Depreciation on
Investment -87 754 104 841
5 Income Tax 1531 1120 1774 -411 -26.9
6 Others -2 44 71 46
7 Total Provision 4439 5675 6160 1236 27.8

1/31/2014 12:10 PM
8
Break-up : Income (Rs. Crore)
15
Sl. Parameters Dec'12 Dec'13 Mar'13
Variation (Dec'13
over Dec'12)
Amt. (%)
1 Interest on Advances 24057 24144 31855 87 0.4
2 Interest on Investments 7124 7606 9530 482 6.8
3 Other Interest Income 328 372 509 43 13.2
4 Interest Income (1+2+3) 31509 32122 41893 613 1.9
5 Other Income 3047 3180 4216 133 4.4
of which
6 Core Non-Interest Income 2338 2469 3054 131 5.6
7 Recovery in Written off a/cs 292 241 421 -51 -17.5
8 Trading Profit 219 360 487 141 64.1
9 Dividend from Liquid MF 179 134 233 -45 -25.1
10 Residual (incl. Derivative inc) 19 -24 21 -43 -225.4
11 Total Income (4+5) 34556 35302 46109 745 2.2
Fee Based Income (Rs. Crore)
16
Sl. Particulars Dec'12 Dec'13 Mar'13
Variation
(Dec'13 over
Dec'12)
Amt. (%)
1 Processing Fees 419 455 519 36 8.6
2 LC/LG Income 545 556 735 11 2.0
3 Bills & Remittance 302 309 395 6 2.1
4 Incidental Charges 117 137 153 19 16.6
5 Inc from ATM operations 234 263 311 30 12.7
6 Income from Ins & MF 33 43 55 10 29.5
7 Misc. Income 234 275 305 41 17.5
8 Exchange Profit 454 431 581 -23 -5.0
9 Core Non Interest Income 2338 2469 3054 131 5.6

1/31/2014 12:10 PM
9
Break-up : Expenditure(Rs. Crore)
17
Sl. Parameters Dec'12 Dec'13 Mar'13
Variation (Dec'13
over Dec'12)
Amt. (%)
1 Intt. Paid on Deposits 19261 18801 25501 -459 -2.4
2 Intt. Paid on Borrowings 325 372 416 47 14.4
3 Others 851 804 1120 -46 -5.5
4 Total Interest Paid (1+2+3) 20437 19978 27037 -459 -2.2
5 Estab. Expenses 4253 5033 5675 779 18.3
Of Which
5a Employee Benefits (AS-15) 1795 1807 2102 12 0.7
6 Other Operating Expenses 1811 2080 2490 270 14.9
7 Operating Expenses (5+6) 6064 7113 8165 1049 17.3
8 Total Expenses (4+7) 26501 27091 35202 590 2.2
Cost & Yield Ratios (Annualized)
18
Sl.Sl. Particulars Particulars 9M 9M
Dec’12 Dec’12
9M 9M
Dec’13Dec’13
FYFY
Mar’13Mar’13
11 Cost of Deposit [%] Cost of Deposit [%] 6.886.88 6.406.40 6.826.82
22 Cost of Fund [%] Cost of Fund [%] 5.805.80 5.245.24 5.705.70
33 Yield on Advances [%] Yield on Advances [%] 11.1711.17 10.5110.51 11.0611.06
44 Yield on Investment [%] Yield on Investment [%] 7.907.90 7.847.84 7.897.89
55 Yield on Fund [%] Yield on Fund [%] 8.948.94 8.438.43 8.838.83
66 Net Interest Margin [%] Net Interest Margin [%] 3.523.52 3.523.52 3.523.52

1/31/2014 12:10 PM
10
Profitability Ratios (Annualized)
19
Sl. Sl. Particulars Particulars 9M 9M
Dec’12 Dec’12
9M 9M
Dec’13Dec’13
FYFY
Mar’13Mar’13
1 Return on Assets [%] 1.03 0.67 1.00
2 Return on Net worth [%] 16.08 9.97 15.19
3 Opt. Profit to AWF [%] 2.29 2.15 2.30
4 Cost to Income Ratio [%] 42.95 46.42 42.81
5 Estb. Exp. To Total Exp. [%] 16.05 18.58 16.12
6 Opt. Exp. To AWF [%] 1.72 1.87 1.72
7 Book Value per Share [Rs] 884.01 936.85 884.03
8 Earnings per share [Rs] 142.19 95.54 139.52
Cost to Income Ratio excl. Wage Revision: 42.89%
Business (Rs. Crore)
20
Sl. Parameters Dec'12 Mar'13 Dec'13Variation % Over
Mar'13 Dec'12
1 Total Business 683098 700285 746780 6.6 9.3
Out of Which
Overseas Business 45362 48335 57112 18.2 25.9
Overseas Business (USD Mio) 8370 9057 9265 2.3 10.7
2 Total Deposit 385785 391560 420647 7.4 9.0
3 Total Advances 297313 308725 326133 5.6 9.7
4 CD Ratio [%] 77.07% 78.84% 77.53%

1/31/2014 12:10 PM
11
Deposit (Rs. Crore)
CASACASA asas percentagepercentage toto CoreCore DepositDeposit isis atat 4141..5858%%21
Sl. Parameters Dec'12 Mar'13 Dec'13Variation % Over
Mar'13 Dec'12
1 Total Deposit 385785 391560 420647 7.4 9.0
2 Overseas Deposit 15263 16277 22220 36.5 45.6
Overseas Deposit (USD Mio) 2885 3139 3595 14.5 24.6
3 Differential Rate Dep. Incl. CD 59071 48921 21396 -56.3 -63.8
Share of DRI Dep. to Total % 15.31 12.49 5.09
4 Inter Bank Deposit (Term) 13919 11114 12174 9.5 -12.5
5 Inter Bank Deposit (CA) 2160 2974 1990 -33.1 -7.8
6 Core Deposit 312795 331525 387077 16.8 23.7
Core Dep. To Total (%) 81.08% 84.67% 92.02%
7 SB Deposit 117097 123470 133814 8.4 14.3
8 Current Deposit 25345 29874 27147 -9.1 7.1
9 CASA Deposit 142442 153344 160961 5.0 13.0
Share of CASA To Dom. Dep. (%) 38.4% 40.9% 40.4%
10 Core Term Deposit 172513 181154 228106 25.9 32.2
Advances- Sectoral(Rs. Crore)
MSME Advances: Rs. 69918 Cr. YoY Gr. 24.99%22
Sl. Parameters Dec'12 Mar'13 Dec'13
% Share in
Gr. Non-
food cr.
Variation
Dec'13/Dec'12
Amt. (%)
1 Global Gross Advances 303759 315243 334581 30822 10.1
2 Overseas Advances 30100 32058 34893 4793 15.9
3 Domestic Gross Advances 273659 283185 299688 26029 9.5
3a Food Credit 6691 6057 7146 455 6.8
3b Dom. Non-Food Gross Adv. 266968 277128 292542 100.0 25574 9.6
- of Which (Sl. No. 4 to 9)
4 Agriculture & Allied 41750 38055 44149 15.1 2399 5.7
5 Industry 123210 125415 137318 46.9 14108 11.5
- of Which
5a MSME Manufacturing 35894 37593 43661 14.9 7767 21.6
5b Large Industry 87316 87822 93657 32.0 6341 7.3
6 Retail Loans 30695 31721 36066 12.3 5371 17.5
Of which
6a Housing 13715 14332 16005 5.5 2291 16.7
6B Car/Vehicle 2785 2880 3239 1.1 454 16.3
6c Education 3976 3999 4228 1.4 252 6.3
6d Other Retail Loans 10219 10510 12593 4.3 2374 23.2
7 Commercial Real Estate 9140 9220 7666 2.6 -1474 -16.1
8 NBFC 11513 11052 11728 4.0 215 1.9
9 Services & Others 50660 61665 55615 19.0 4954 9.8

1/31/2014 12:10 PM
12
Advances Advances ––Industry wise BreakupIndustry wise Breakup (Rs. Crore)
23
Particulars
Dec-12 Mar'13 Dec'13Variation
Dec'13/Dec'12
Amt. Share %
to NFCAmt.
Share %
to NFCAmt.
Share %
to NFCAmt. (%)
Food Processing 5716 2.1 6240 2.3 7317 2.5 1601 28.0
Textiles 8560 3.2 9269 3.3 9841 3.4 1281 15.0
Chemical & Chemical Products 3563 1.3 4022 1.5 4844 1.7 1281 36.0
Cement & Cement Products 2315 0.9 2295 0.8 2354 0.8 39 1.7
Basic Metal & Metal Products 19442 7.3 20430 7.4 23116 7.9 3674 18.9
-Iron & Steel 15901 6.0 16810 6.1 20359 7.0 4458 28.0
Paper & paper products 1399 0.5 1482 0.5 1535 0.5 136 9.7
Petroleum 1447 0.5 1496 0.5 1552 0.5 105 7.3
All Engineering Products 4831 1.8 5088 1.8 5234 1.8 403 8.3
Vehicles & Vehicle parts 958 0.4 1143 0.4 941 0.3 -17 -1.8
Construction 1871 0.7 1806 0.7 2274 0.8 403 21.5
Infrastructure 52529 19.7 53277 19.2 56870 19.4 4341 8.3
-Power 27651 10.4 27726 10.0 31985 10.9 4334 15.7
-Tele-Communication 8066 3.0 8116 2.9 6599 2.3 -1467 -18.2
- Roads & Ports 10446 3.9 11145 4.0 11408 3.9 962 9.2
- Others 6366 2.4 6289 2.3 6877 2.4 511 8.0
Residual 20579 7.7 18867 6.8 21441 7.3 862 4.2
Industry 123210 46.2 125415 45.3 137318 47.0 14108 11.5
Investment (Rs. Crore)
24
Sl Particulars Dec'12 Mar'13 Dec'13
1 Gross Investment 130712 130313 141851
2 Held To Maturity (HTM) 92670 91267 96424
3 Available For Sale (AFS) 36726 37027 44247
4 Held For trading (HFT) 1316 2019 1180
5 Duration (AFS) 4.57 4.39 4.30
6 Modified Duration (AFS) 4.35 4.17 4.05
7 Duration Total Portfolio 4.90 4.76 4.78
8 Modified Duration Total Portfolio 4.70 4.56 4.56
9 Net demand & time Liabilities 368327 378653 403177
10 SLR (%) 29.82 27.98 28.80
11 SLR HTM to Total SLR (%) 82.01 82.99 82.11
12 HTM To Gross Investment (%) 70.90 70.04 67.98
13 Total SLR 110228 107445 114948
14 Total Non SLR 20065 22868 26903

1/31/2014 12:10 PM
13
25
Break up of Gross Credit as per Asset Class(Rs. Crore)
Standard Adv. (Excl.
Std. Restructured)
Restructured
Standard (O/S)NPA
Gross
Advances
FY 2008-09 153234 466 2507 156207
FY 2009-10 183261 1830 3214 188306
FY 2010-11 237356 2264 4379 243999
FY 2011-12 277618 11555 8720 297893
FY 2012-13 276658 25119 13466 315243
FY 2013-14
9M Dec'13 286504 31285 16596* 334385
Sl. Standard Restructured A/cs (O/s) No. Amt. O/s DFV
1 Under CDR 31 4068 379.3
2 Under SME 290 232 7.51
3 Others (Non-CDR) 34 1867122.28
Total 355 6167509.09
01.04.2013 to 31.12.2013 (Current 9M )
*This includes restructured NPA amounting to Rs. 434.83 cr. as on Dec'13*This includes restructured NPA amounting to Rs. 434.83 cr. as on Dec'13
Sectorwise O/S Restructured Accounts (Rs. Crore)
01.04.2013 to 31.12.2013 (Current 9M )
Cumulative
26
Sl.
Standard
Restructured
A/cs (O/s)
No.Amt.
O/s
1 Under CDR 92 13958
2 Under SME 482 1157
3 Others (Non-CDR) 393 16170
Total 967 31285
SlRestructured
Accounts No.
Amt.
O/s
Diminutio
n in Fair
Value
1 Standard Adv. 355 6167 509
2 NPA 5 119 32
Total 360 6285 541
Sl. Sector
(Standard A/Cs)Mar'13
Apr-
Dec13
O/S
Amt
%age
Share
A Agriculture 140 150 289 0.9
B Housing 1 0 1 0.0
C Real Estate 347 18 365 1.2
D Industry 21030 4535 25565 81.7
E Others 3601 1464 5065 16.2
Total 25119 6167 31285 100.0
Out of the Above Major Industries/Sectors
1 Iron & Steel 4221 1643 5864 18.7
2 Infrastructure 11344 958 12302 39.3
Out of which 0.0
Power 9075 659 9734 31.1
Telecom 948 142 1090 3.5
3 Drilling 615 0 615 2.0
4 Textiles 793 573 1365 4.4
5 Aviation 1615 0 1615 5.2
6 Sugar 548 193 741 2.4
7 Paper/Printing 174 0 174 0.6
8 Chemical/Fertiliser/Drugs 684 94 778 2.5
9 Cement 22 18 40 0.1
10 Manufacturing 42 15 56 0.2
11 Engineering 360 0 360 1.2
12 Auto parts 5 140 145 0.5
13 Hotel 582 154 736 2.4
14 Education 450 291 740 2.4
15 Finance 83 0 83 0.3

1/31/2014 12:10 PM
14
Non-Performing Assets ( Rs. Crore)
27
Sl. Parameters Dec'12 Mar'13 Dec'13
1 NPA as at the beginning of Yr. 8720 8720 13466
2 Cash Recovery 1499 1942 2107
3 Upgradation 809 962 623
4 Write Off 90 997 1256
5 Total Reduction (2+3+4) 2399 3901 3985
6 Fresh Addition 7677 8647 7115
-Fresh slippages 6978 7809 6255
-Debits in existing NPA A/cs 699 838 860
7 Gross NPAs end period 13998 13466 16596
8 Eligible Deductions incl. Provisions 6412 6229 7512
9 Net NPAs 7586 7237 9084
10 Recovery in written-off debt A/Cs 292 421 241
Particulars Dec'12 Mar'13 Dec'13
Gross NPA% 4.61% 4.27% 4.96%
Net NPA% 2.56% 2.35% 2.80%
NPA Coverage Ratio 55.97% 58.83% 58.55%
Capital Adequacy (Basel III)(Rs. Crore)
28
Sl. Particulars Dec'12 Mar'13 Dec'13 Dec'13
Capital Fund BASEL II BASEL III
1 Tier I 26897 31664 32038 30562
2 Tier II 9485 9608 9491 8871
3 Total (Tier I+II) 36382 41273 41529 39433
4 Risk-weighted Assets 312143 324380 357489 357924
5 Capital Adequacy Ratio 11.66% 12.72% 11.62%11.02%
6 Tier I 8.62% 9.76% 8.96%
CET: 8.16%
Add. T I: 0.38%
Total Tier I: 8.54%
7 Tier II 3.04% 2.96% 2.65% 2.48%
1/31/2014 12:10 PM
15
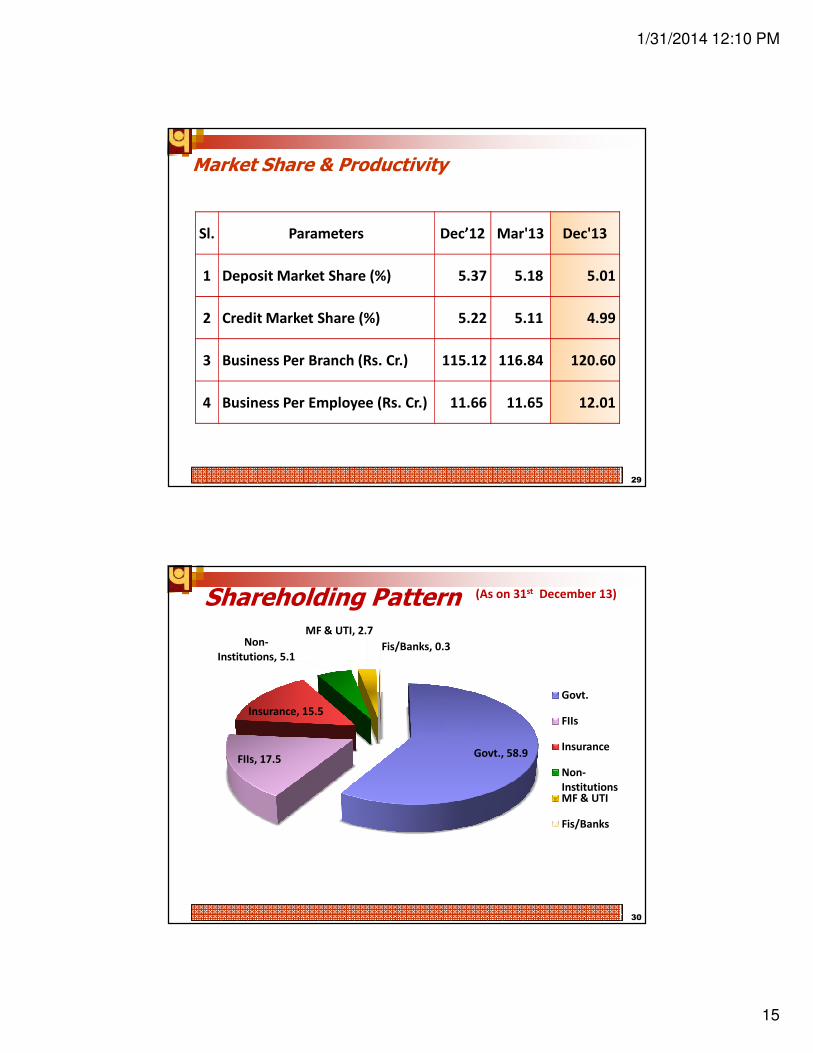
Market Share & Productivity
29
Sl. Parameters Dec’12 Mar'13 Dec'13
1 Deposit Market Share (%) 5.37 5.18 5.01
2 Credit Market Share (%) 5.22 5.11 4.99
3 Business Per Branch (Rs. Cr.) 115.12 116.84 120.60
4 Business Per Employee (Rs. Cr.) 11.66 11.65 12.01
Shareholding Pattern (As on 31st December 13)
30
Govt., 58.9FIIs, 17.5
Insurance, 15.5
Non-
Institutions, 5.1
MF & UTI, 2.7
Fis/Banks, 0.3
Govt.
FIIs
Insurance
Non-
InstitutionsMF & UTI
Fis/Banks

1/31/2014 12:10 PM
16
Capacity Building – Expanding Network
56 new branches & 121 new ATMs added during Quarter 3 FY 14.56 new branches & 121 new ATMs added during Quarter 3 FY 14.31
Population Group wise Branches
(31st Dec'13)
Metro UrbanSemi-
UrbanRural
996 1286 1440 2353
16.40 21.17 23.70 38.73
ATM Network
Dec'11 Dec'12 Dec'13
5793 6058 66985000
5200
5400
5600
5800
6000
6200
Dec'11 Dec'12 Dec'13
5393
5788
6075
Total Domestic Branches
32