Presentation of the article Clustering of EEG Occipital Signals using K-means (IEEE Ecuador...
21
Clustering of EEG Occipital Signals using K-means Víctor Asanza, Kerly Ochoa, Christian Sacarelo, Carlos Salazar, Francis Loayza, Carmen Vaca and Enrique Peláez Escuela Superior Politécnica del Litoral, ESPOL Facultad de Ingeniería en Electricidad y Computación Centro de Tecnología de información
-
Upload
victor-asanza-armijos -
Category
Data & Analytics
-
view
511 -
download
0
Transcript of Presentation of the article Clustering of EEG Occipital Signals using K-means (IEEE Ecuador...
Clustering of EEG Occipital Signals using K-means
Víctor Asanza, Kerly Ochoa, Christian Sacarelo, Carlos Salazar, Francis Loayza, Carmen Vacaand Enrique Peláez
Escuela Superior Politécnica del Litoral, ESPOL
Facultad de Ingeniería en Electricidad y Computación
Centro de Tecnología de información
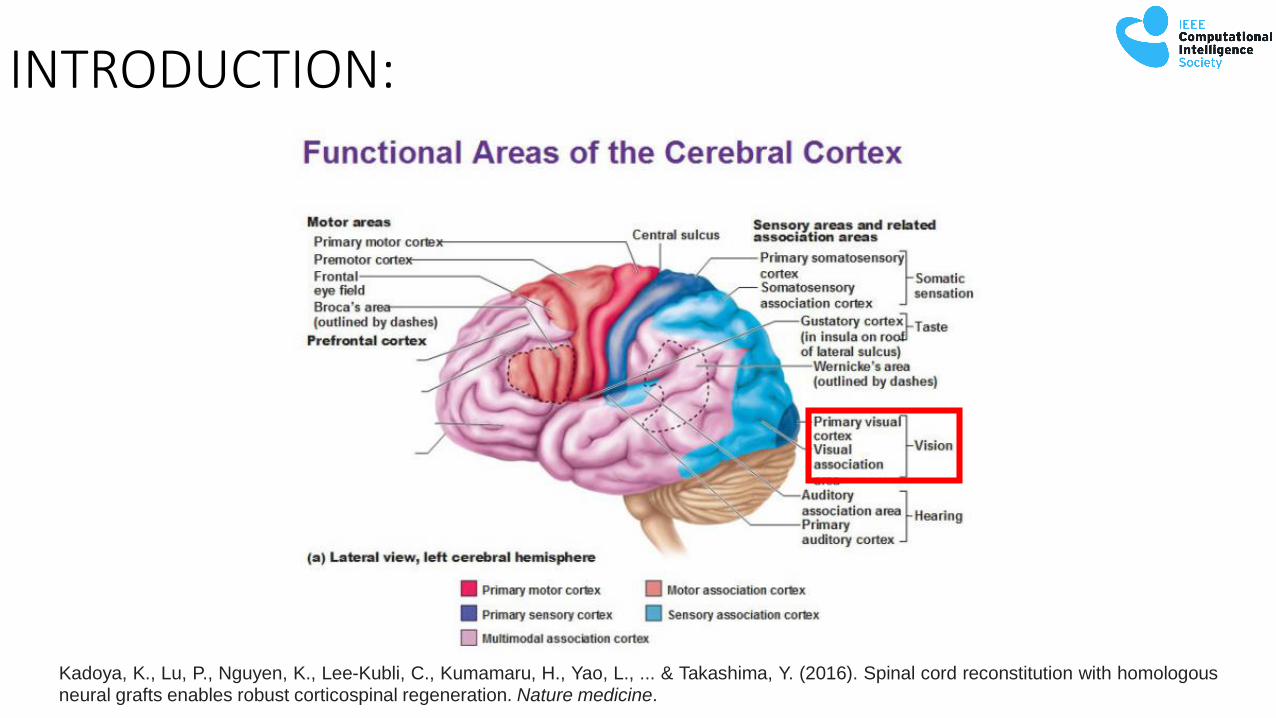
INTRODUCTION:
Kadoya, K., Lu, P., Nguyen, K., Lee-Kubli, C., Kumamaru, H., Yao, L., ... & Takashima, Y. (2016). Spinal cord reconstitution with homologousneural grafts enables robust corticospinal regeneration. Nature medicine.
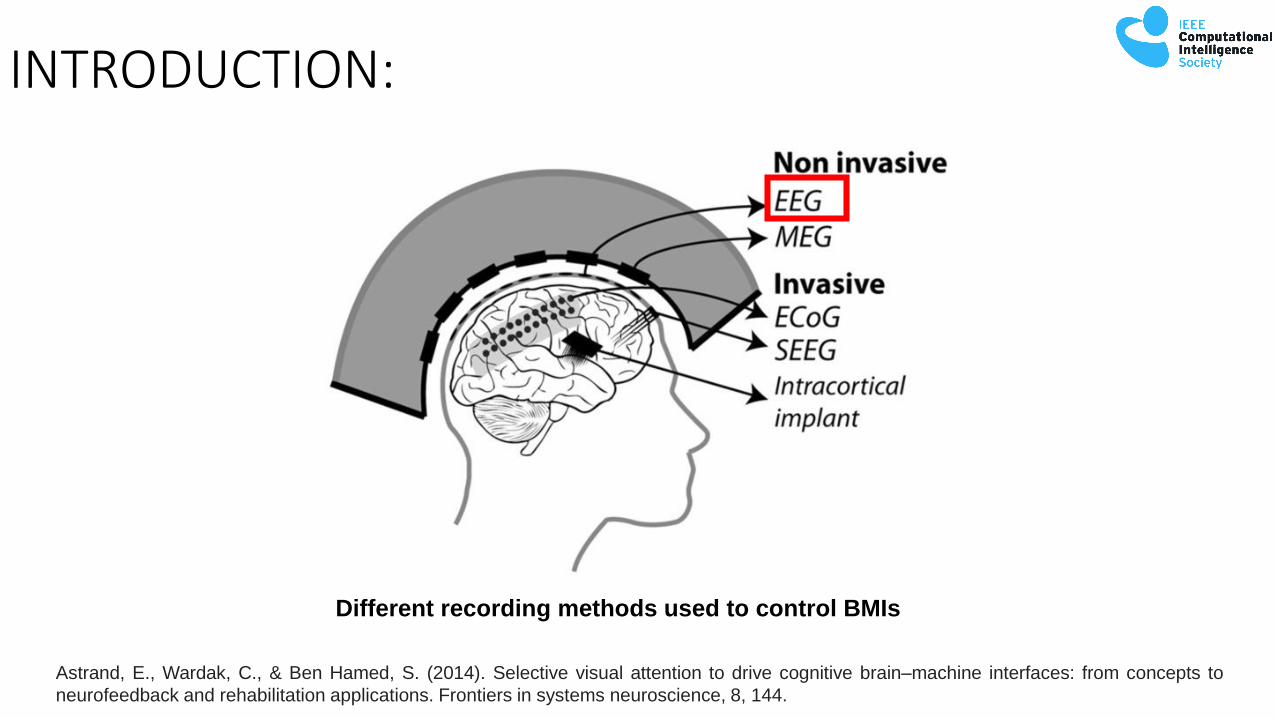
Astrand, E., Wardak, C., & Ben Hamed, S. (2014). Selective visual attention to drive cognitive brain–machine interfaces: from concepts to
neurofeedback and rehabilitation applications. Frontiers in systems neuroscience, 8, 144.
Different recording methods used to control BMIs
INTRODUCTION:
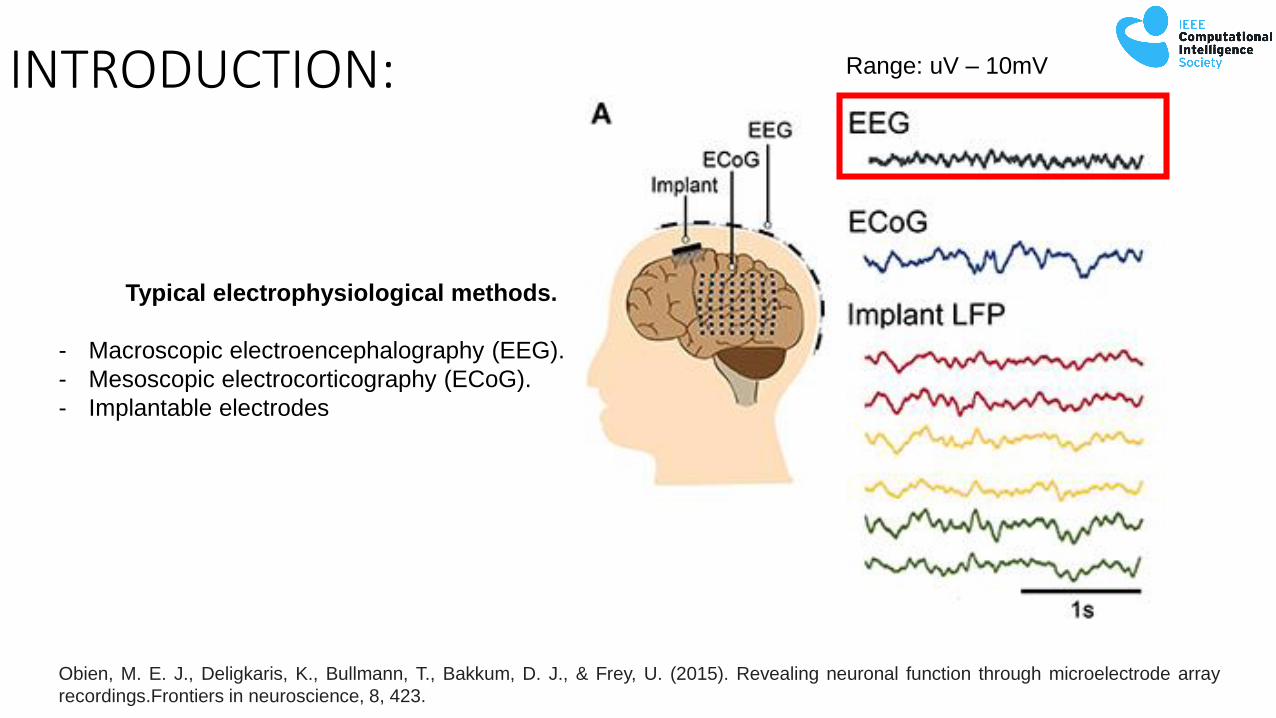
Obien, M. E. J., Deligkaris, K., Bullmann, T., Bakkum, D. J., & Frey, U. (2015). Revealing neuronal function through microelectrode array
recordings.Frontiers in neuroscience, 8, 423.
Typical electrophysiological methods.
- Macroscopic electroencephalography (EEG).
- Mesoscopic electrocorticography (ECoG).
- Implantable electrodes
Range: uV – 10mVINTRODUCTION:
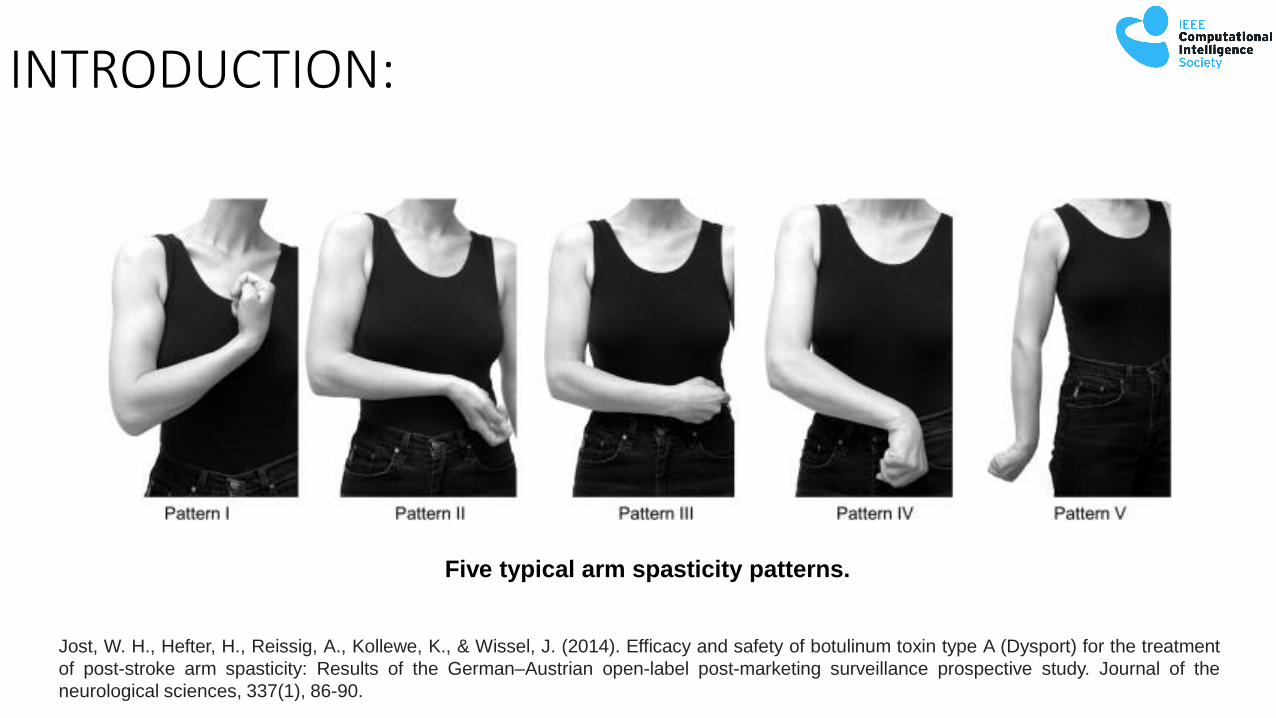
Jost, W. H., Hefter, H., Reissig, A., Kollewe, K., & Wissel, J. (2014). Efficacy and safety of botulinum toxin type A (Dysport) for the treatment
of post-stroke arm spasticity: Results of the German–Austrian open-label post-marketing surveillance prospective study. Journal of the
neurological sciences, 337(1), 86-90.
Five typical arm spasticity patterns.
INTRODUCTION:

Emotiv EEG electrode locations
www.emotiv.com
INTRODUCTION:
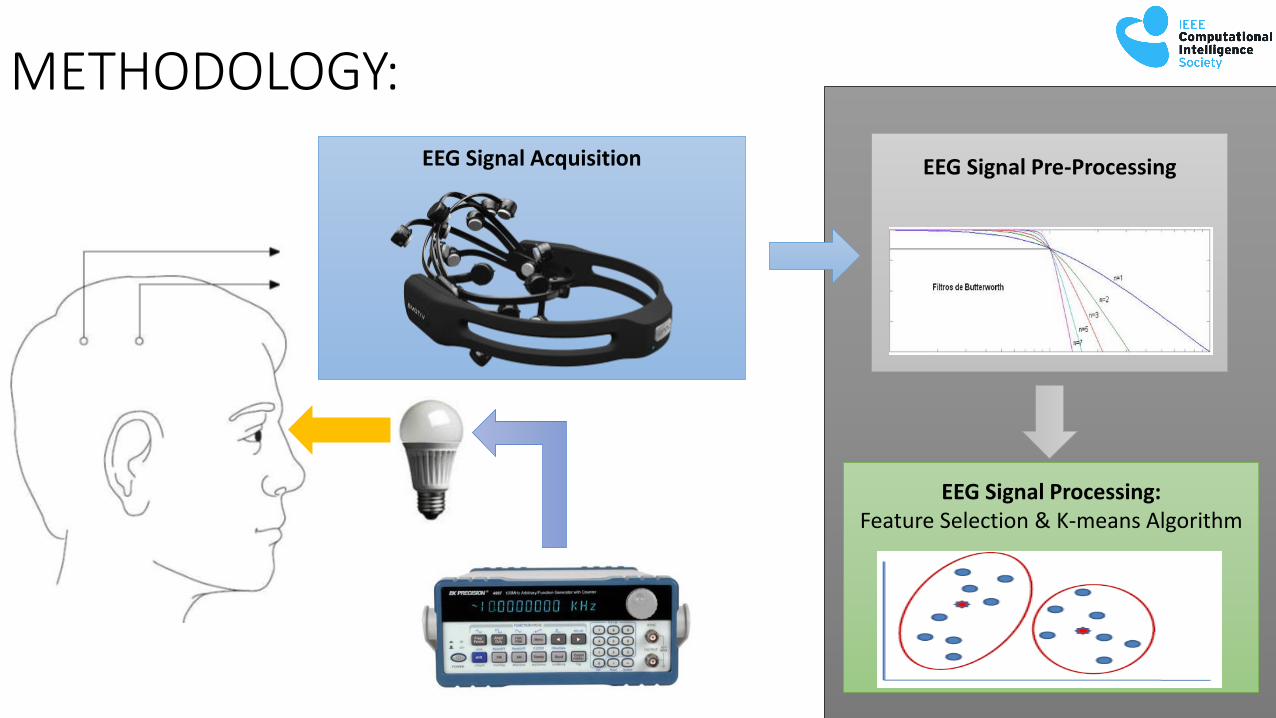
EEG Signal Pre-ProcessingEEG Signal Acquisition
EEG Signal Processing: Feature Selection & K-means Algorithm
METHODOLOGY:

METHODOLOGY:
Visual stimuli generated by a display with LEDs used to acquire the occipital EEG signals.
VOLUNTEERS
Number of healthyvolunteers:
5
Repeat an experiment : 10 times
EMOTIV EPOC
Sampling Rate: 128 samples por second
Channels: 14
Resolution: 14 bits
VISUAL STIMULATION
Frequency: 5, 6, 7, 8, 9, 24, 26, 27, 28, 29 Hz
Duration Time: 19,5 seconds
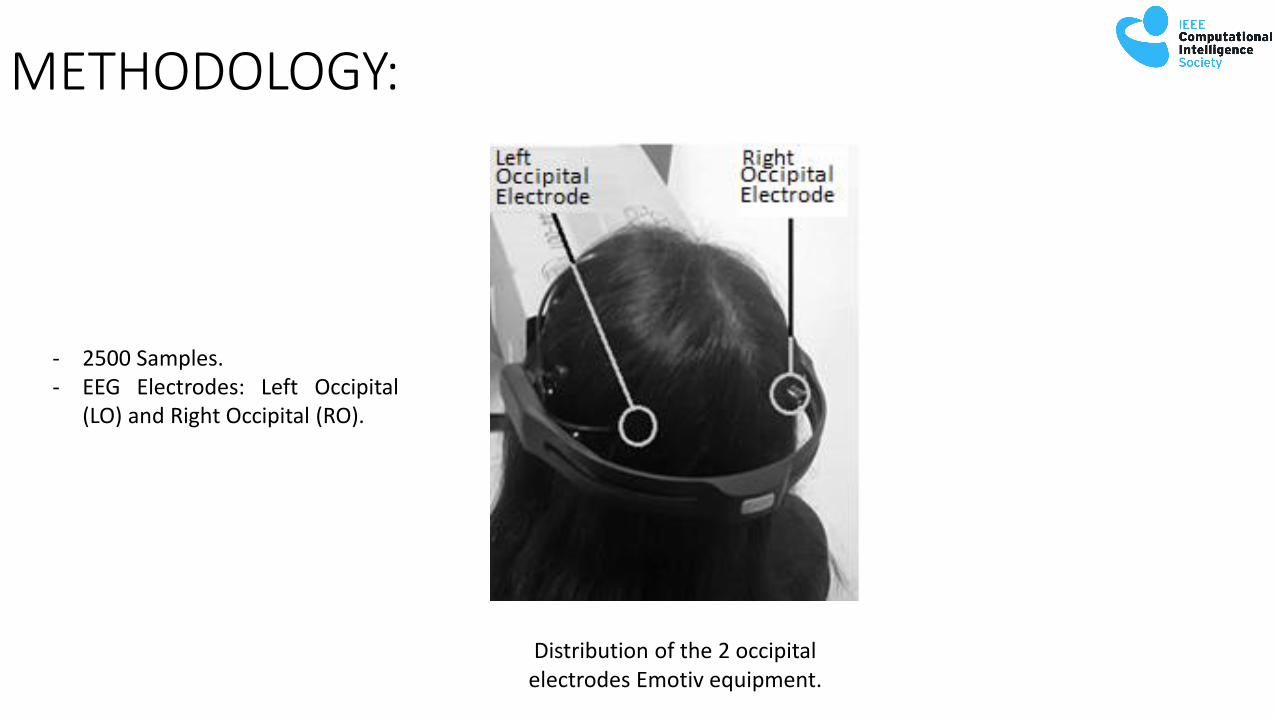
Distribution of the 2 occipital electrodes Emotiv equipment.
- 2500 Samples.- EEG Electrodes: Left Occipital
(LO) and Right Occipital (RO).
METHODOLOGY:

DC artifacts present in the occipital EEG signals 5Hz visual stimulus.
2500 x 20 10 Frequencies LO10 Frequencies RO
2500 Samples
METHODOLOGY:
2500 x 20 10 Frequencies LO10 Frequencies RO
2500 Samples
2500 x 20 10 Frequencies LO10 Frequencies RO
2500 Samples
2500 x 20 10 Frequencies LO10 Frequencies RO
2500 Samples
2500 x 20 10 Frequencies LO10 Frequencies RO
2500 Samples
f=: 5, 6, 7, 8, 9, 24, 26, 27, 28, 29 Hz

An analysis to the FFT frequency of the EEG signal.
METHODOLOGY:

a) Histogram of the EEG signal without pre-processing to occipital area with5Hz visual stimulus.
b) Comparison between the distribution of the EEG acquired data vs datafrom a normal distribution.
- H0: EEG were not normal distributed with zero mean and variance value of 1.
- H1: EEG were normal distributed with zero mean and variance value of 1.
METHODOLOGY:

Butterworth filter 3er Orden (2-40)Hz
METHODOLOGY:
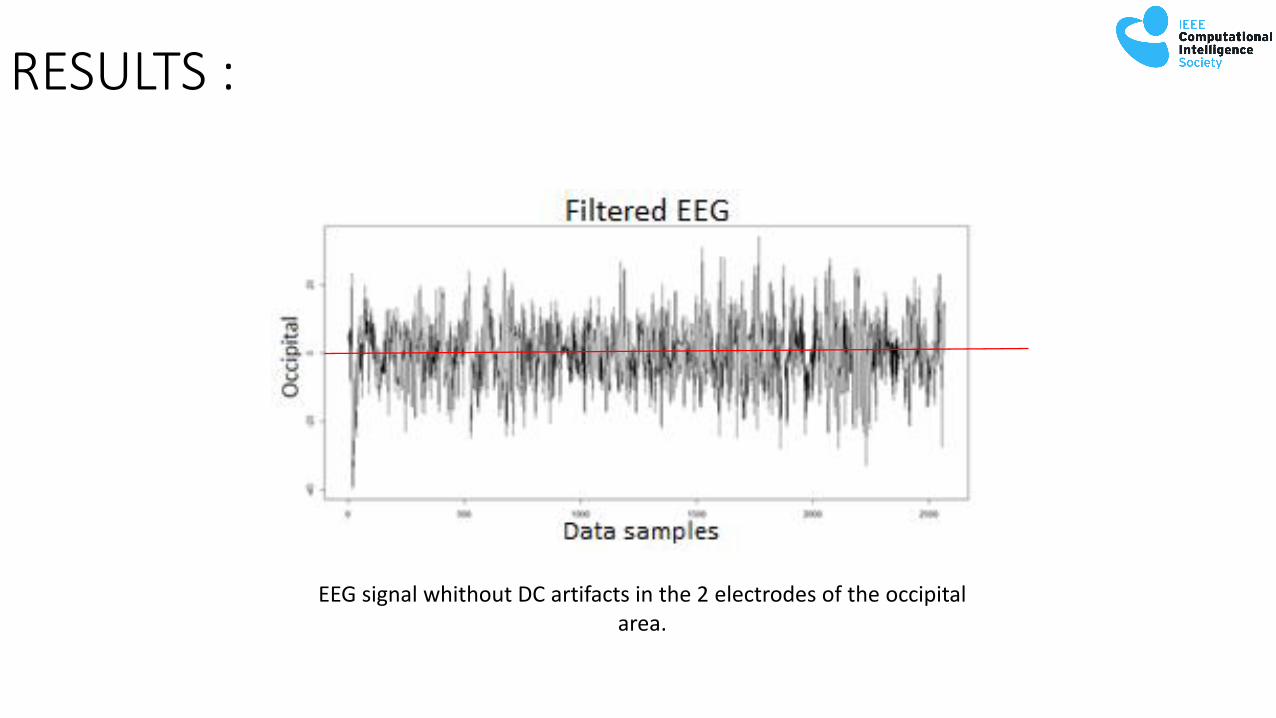
RESULTS :
EEG signal whithout DC artifacts in the 2 electrodes of the occipital area.
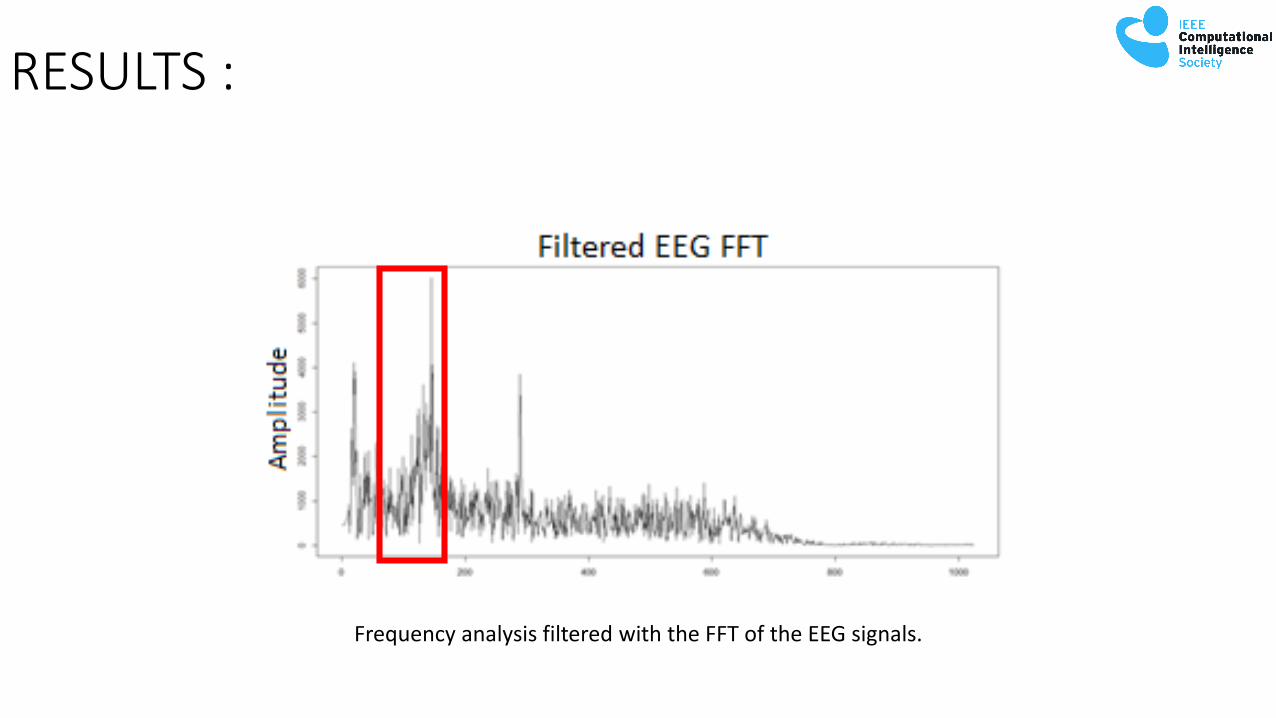
Frequency analysis filtered with the FFT of the EEG signals.
RESULTS :

a) Histogram of the EEG signal with pre-processing to occipital area with 5Hz visual stimulus.
b) Comparison between the distribution of the EEG acquired data vs data from a normal distribution.
- H0: EEG were not normal distributed with zero mean and variance value of 1.
- H1: EEG were normal distributed with zero mean and variance value of 1.
RESULTS :
RESULTS :
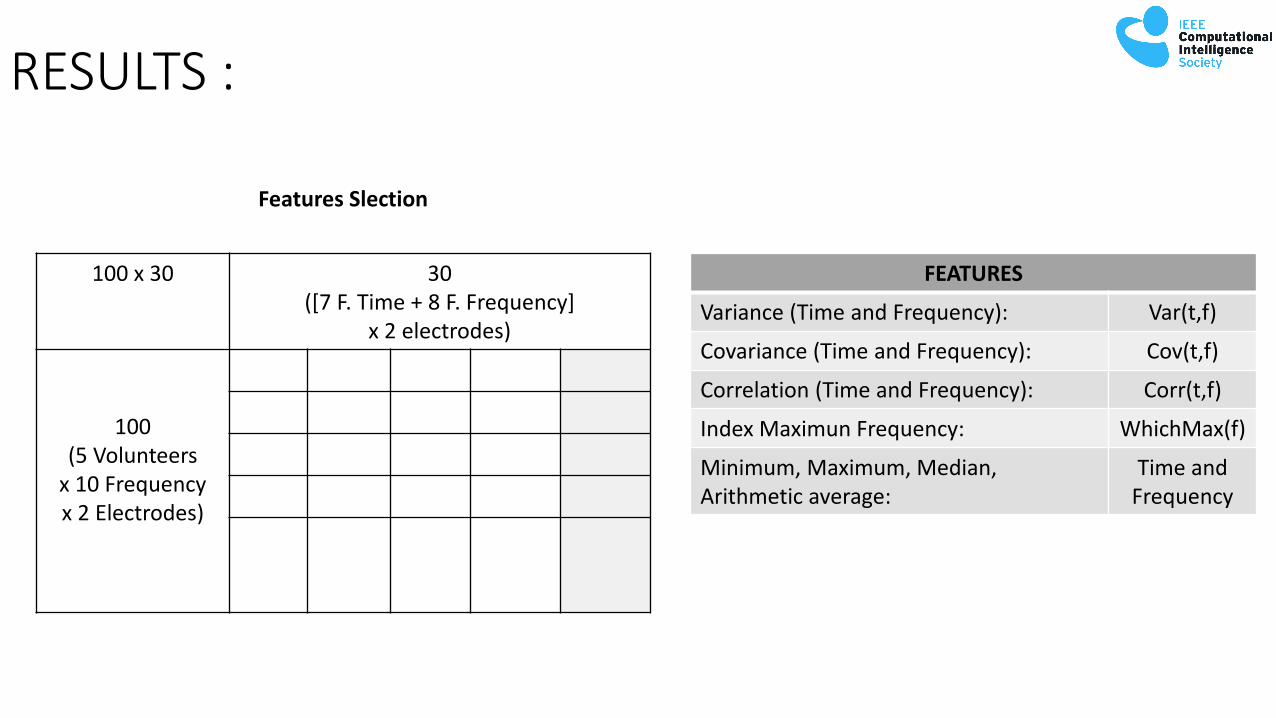
FEATURES
Variance (Time and Frequency): Var(t,f)
Covariance (Time and Frequency): Cov(t,f)
Correlation (Time and Frequency): Corr(t,f)
Index Maximun Frequency: WhichMax(f)
Minimum, Maximum, Median, Arithmetic average:
Time and Frequency
Features Slection
100 x 30 30 ([7 F. Time + 8 F. Frequency]
x 2 electrodes)
100(5 Volunteers
x 10 Frequencyx 2 Electrodes)
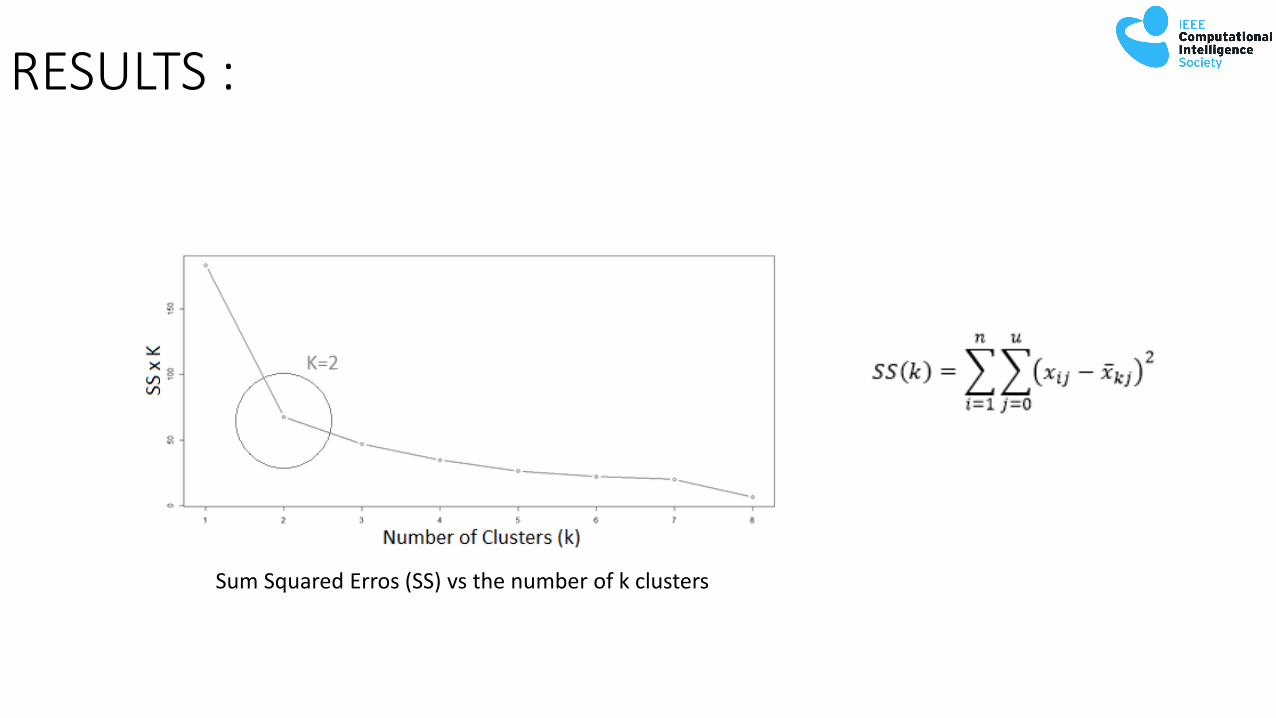
Sum Squared Erros (SS) vs the number of k clusters
RESULTS :

HIT RESULTS USING K-MEANS TO DIFFERENT GROUPS OF FEATURES.
EEG signals in the frequency range 5-9 Hz (cluster 1) and in the range of 24 to 29 Hz (cluster 2).
RESULTS :
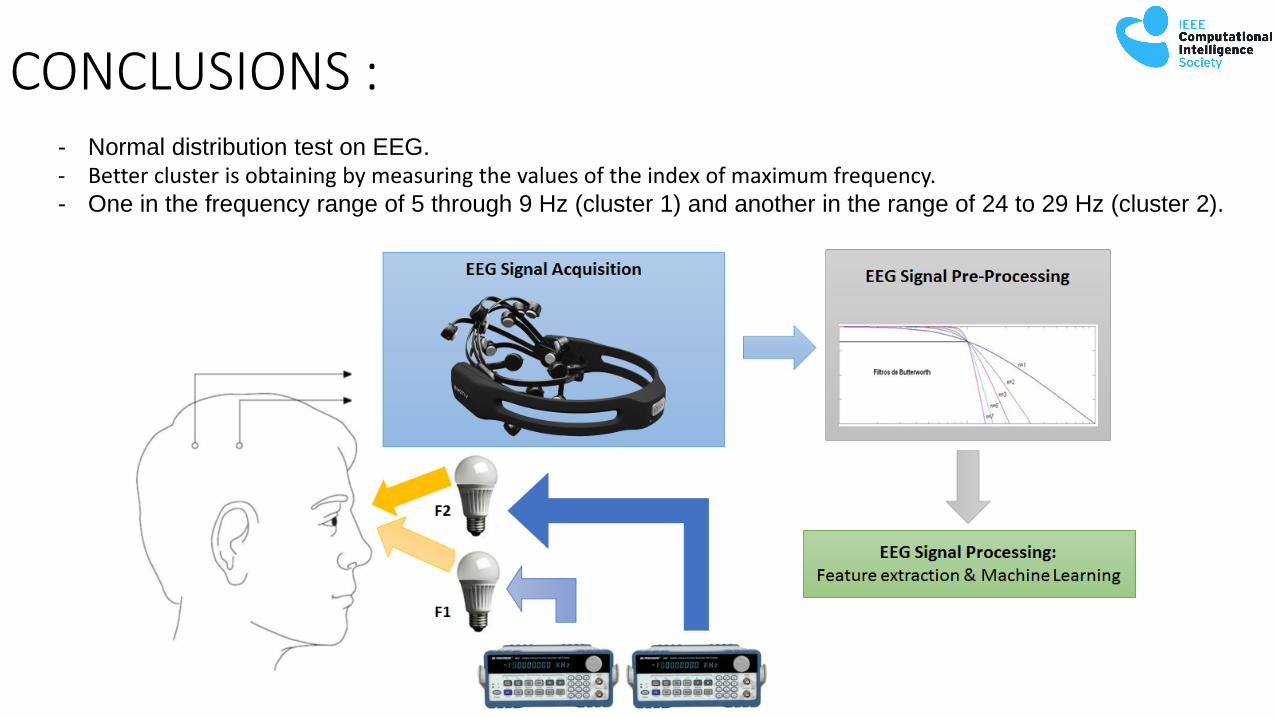
CONCLUSIONS :- Normal distribution test on EEG.
- Better cluster is obtaining by measuring the values of the index of maximum frequency.- One in the frequency range of 5 through 9 Hz (cluster 1) and another in the range of 24 to 29 Hz (cluster 2).

To learn more about this work:
- IEEExplore: http://ieeexplore.ieee.org/abstract/document/7750874/
- Mail vasanza: [email protected]
- Project: Semantic Interpretation of Brain Signals