Presentation of Results NSSE 2003 Florida Gulf Coast University Office of Planning and Institutional...
33
Presentation of Results NSSE 2003 Florida Gulf Coast University Office of Planning and Institutional Performance
-
Upload
juniper-skinner -
Category
Documents
-
view
213 -
download
0
Transcript of Presentation of Results NSSE 2003 Florida Gulf Coast University Office of Planning and Institutional...

Presentation of Results
NSSE 2003
Florida Gulf Coast University
Office of Planning and Institutional Performance

Program Overview
Why is Engagement Important?
Results of particular interest to FGCU Performance on NSSE – unadjusted data The Institutional Engagement Index
Using NSSE Data Extending and Integrating the process
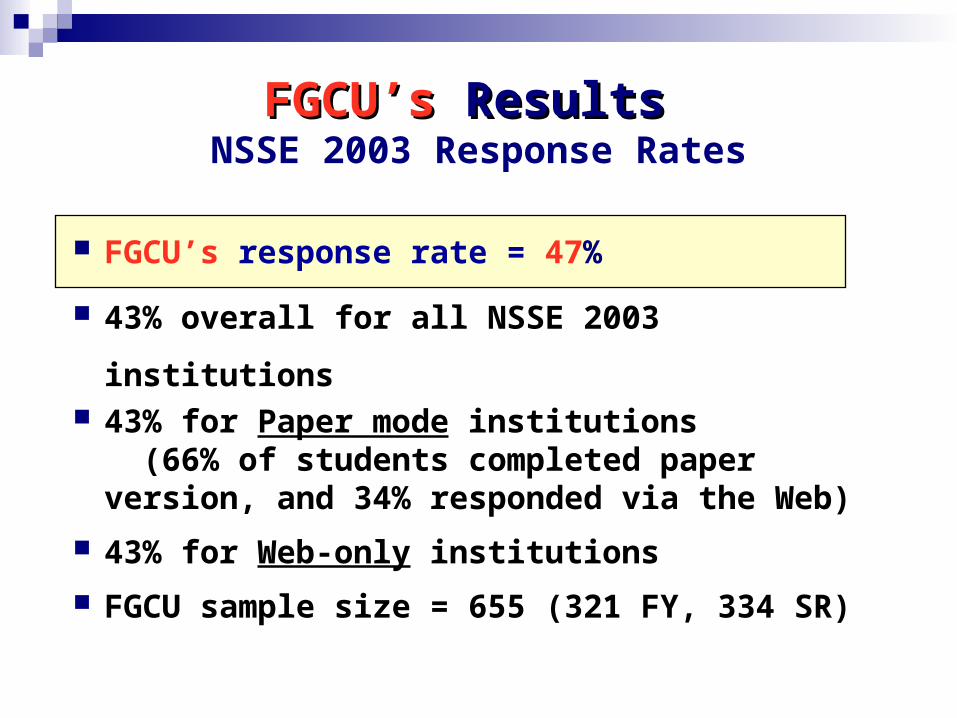
FGCU’s response rate = 47%
43% overall for all NSSE 2003 institutions 43% for Paper mode institutions
(66% of students completed paper version, and 34% responded via the Web)
43% for Web-only institutions
FGCU sample size = 655 (321 FY, 334 SR)
FGCU’sFGCU’s ResultsResults NSSE 2003 Response Rates

About this survey Administration
Administered to random sample of first-year & senior students
Paper & Web-based survey
Flexible to accommodate consortium questions
Multiple follow-ups to increase response rates
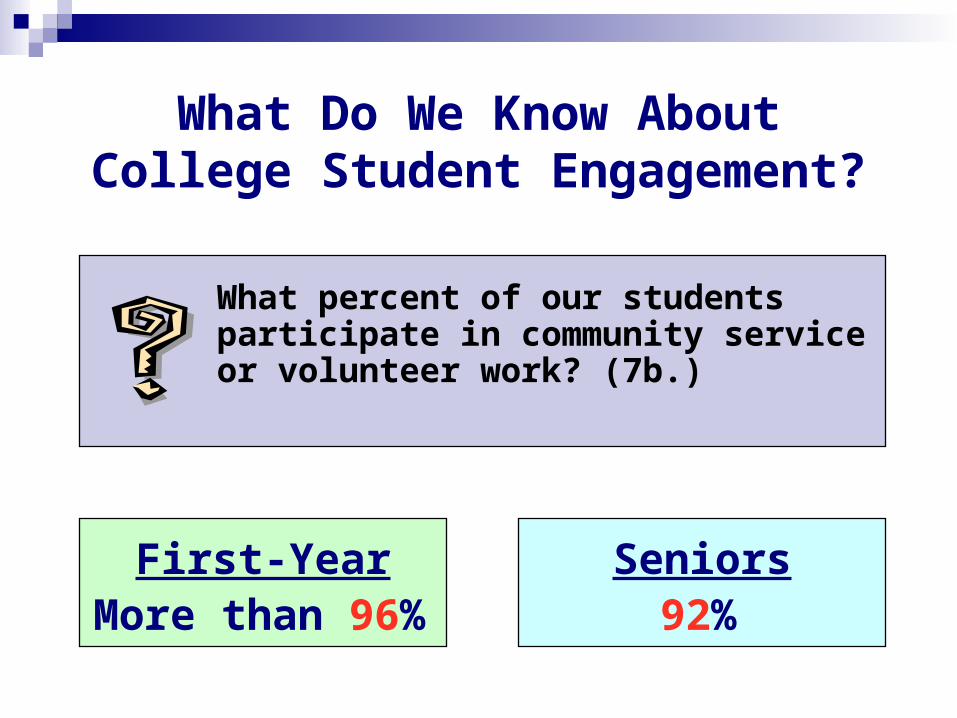
What Do We Know AboutCollege Student Engagement?
What percent of our students participate in community service or volunteer work? (7b.)
First-Year SeniorsMore than 96% 92%

What Do We Know AboutCollege Student Engagement?
What percent of FGCU students spent more than 5 hours per week participating in co-curricular activities?(9d.)
First-Year SeniorsAbout 20% 10%

In thinking about your undergraduate program as a whole, including your major, have you done a culminating senior experience (e.g., senior comprehensive exam, capstone course, thesis or project)? (7h.)
0
10
20
30
40
50
60
70
80
No Yes
%
Seniors Masters
Seniors NSSE
Seniors FGCU
FGCU’sFGCU’s ResultsResultsCarnegie Group Comparison re senior experienceCarnegie Group Comparison re senior experience
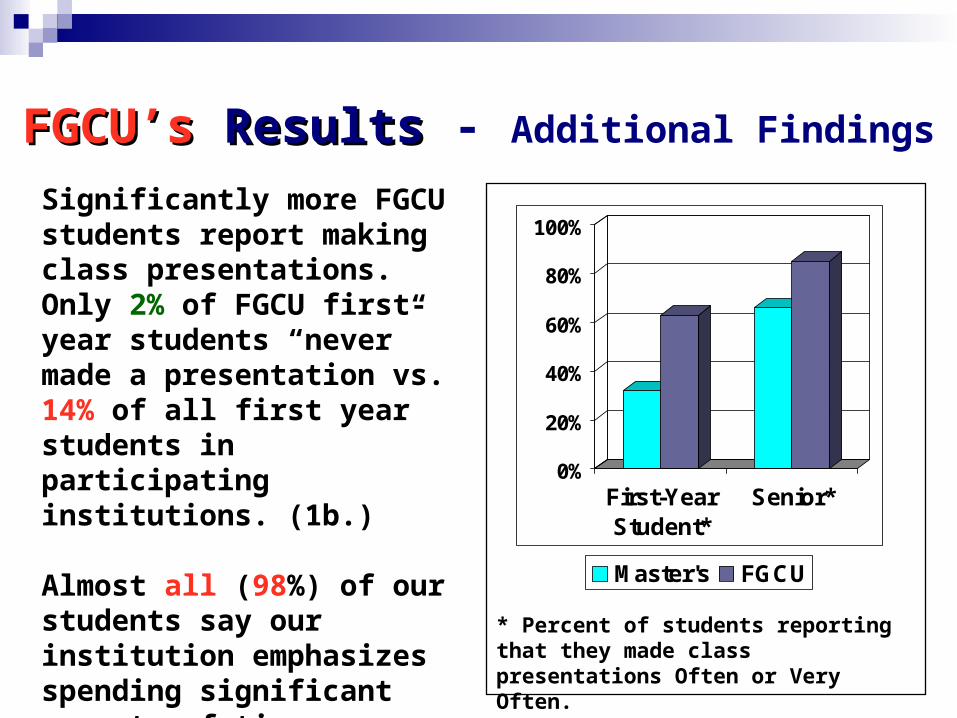
FGCU’sFGCU’s ResultsResults - Additional Findings
Significantly more FGCU students report making class presentations. Only 2% of FGCU first-year students “never” made a presentation vs. 14% of all first year students in participating institutions. (1b.)
Almost all (98%) of our students say our institution emphasizes spending significant amounts of time on studying and academic work. (10a.)
0%
20%
40%
60%
80%
100%
First-YearStudent*
Senior*
Master's FGCU
* Percent of students reporting that they made class presentations Often or Very Often.
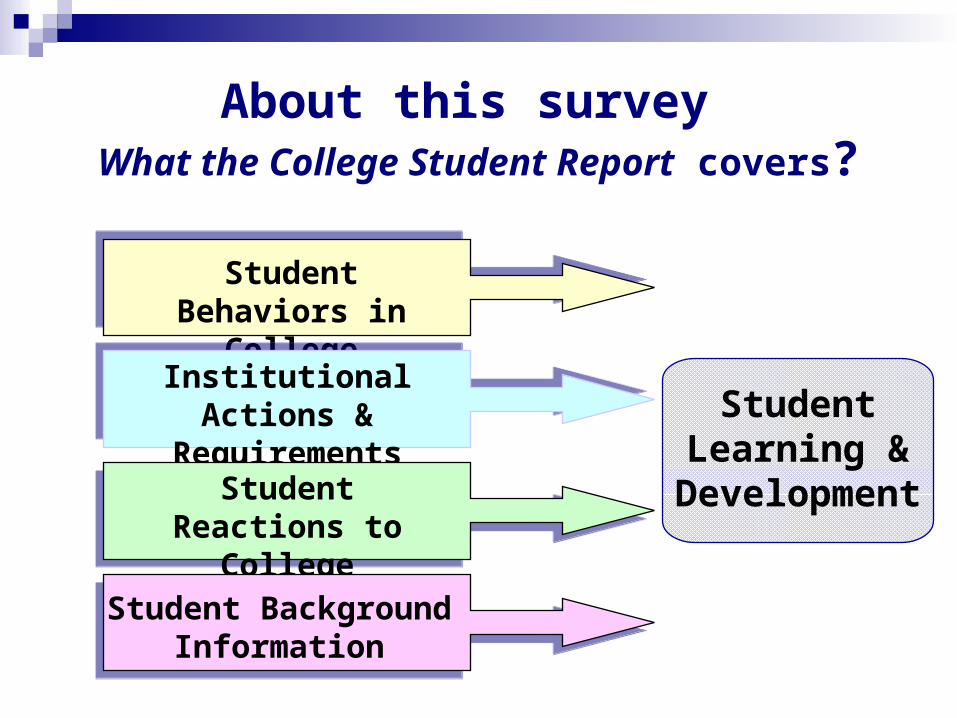
About this survey What the College Student Report covers?
Student Behaviors in College
Institutional Actions & Requirements
Student Reactions to College
Student BackgroundInformation
Student Learning &
Development

About this survey.Use and Validity of Self-Reports
Requested information is known to respondents
Questions phrased clearly & unambiguously
Respondents take questions seriously and thoughtfully
Answering does not threaten, embarrass, or violate privacy or compel a socially desirable response
National assessment experts designed the NSSE survey, The College Student Report,
to meet all these conditions

What Really Matters in College: Student Engagement
The research is unequivocal: students who are actively involved in both academic and out-of-class activities gain more from the college experience than those who are not so involved
Pascarella & Terenzini. (1991). Pascarella & Terenzini. (1991). How college affects studentsHow college affects students

Why is Engagement Important?Good Educational Practices
Student-faculty contact Active learning Prompt feedback Time on task High expectations Cooperation among students Respect for diverse talents and
ways of learning
“Seven principles of good practice in undergraduate education” (Chickering and Gamson, 1987)
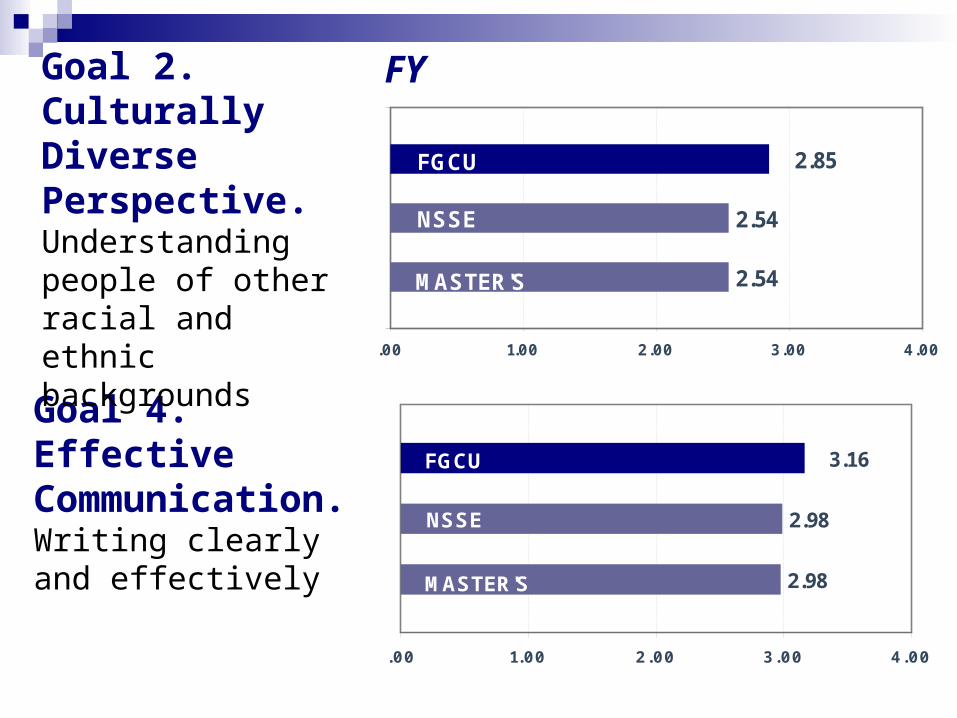
2.54
2.54
2.85
.00 1.00 2.00 3.00 4.00
FGCU
NSSE
MASTER'S
Goal 4. Effective Communication.Writing clearly and effectively
2.98
2.98
3.16
.00 1.00 2.00 3.00 4.00
FGCU
MASTER'S
NSSE
Goal 2. Culturally Diverse Perspective.Understanding people of other racial and ethnic backgrounds
FY
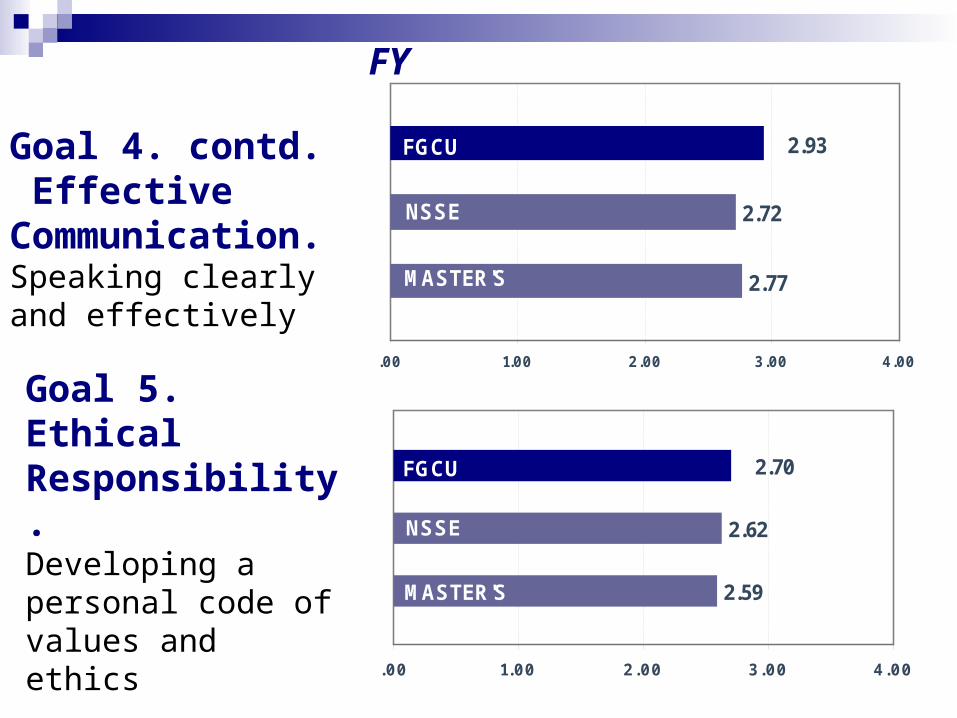
Goal 4. contd. Effective Communication.Speaking clearly and effectively
2.77
2.72
2.93
.00 1.00 2.00 3.00 4.00
FGCU
MASTER'S
NSSE
2.59
2.62
2.70
.00 1.00 2.00 3.00 4.00
FGCU
MASTER'S
NSSE
Goal 5. Ethical Responsibility.Developing a personal code of values and ethics
FY

Goal 7. Problem-Solving Abilities.Thinking critically and analytically
3.14
3.20
3.23
.00 1.00 2.00 3.00 4.00
FGCU
MASTER'S
NSSE
2.90
2.91
3.24
.00 1.00 2.00 3.00 4.00
FGCU
MASTER'S
NSSE
Goal 8. Technological Literacy.Using computing and information technology
FY

Goal 9. Community Awareness and Involvement.Contributing to the welfare of your community
2.30
2.34
2.71
.00 1.00 2.00 3.00 4.00
FGCU
MASTER'S
NSSE
FY

Goal 4. Effective Communication.Writing clearly and effectively
Goal 2. Culturally Diverse Perspective.Understanding people of other racial and ethnic backgrounds
SR
2.55
2.55
2.58
.00 1.00 2.00 3.00 4.00
FGCU
MASTER'S
NSSE
3.08
3.09
3.20
.00 1.00 2.00 3.00 4.00
FGCU
MASTER'S
NSSE
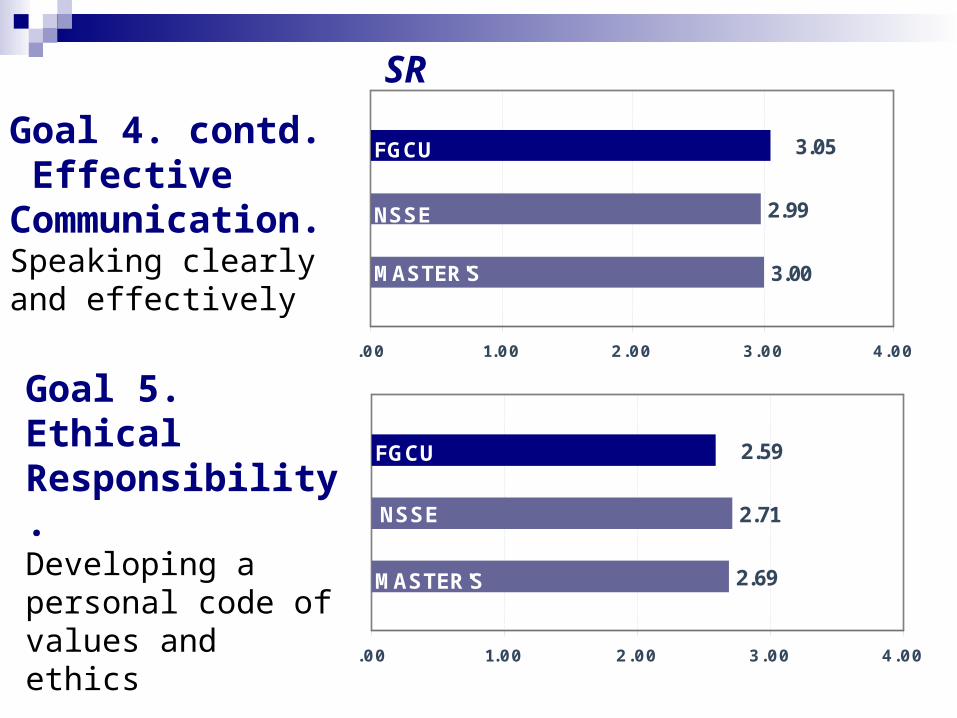
Goal 4. contd. Effective Communication.Speaking clearly and effectively
Goal 5. Ethical Responsibility.Developing a personal code of values and ethics
SR
3.00
2.99
3.05
.00 1.00 2.00 3.00 4.00
FGCU
MASTER'S
NSSE
2.69
2.71
2.59
.00 1.00 2.00 3.00 4.00
FGCU
MASTER'S
NSSE

Goal 7. Problem-Solving Abilities.Thinking critically and analytically
Goal 8. Technological Literacy.Using computing and information technology
SR
3.30
3.35
3.43
.00 1.00 2.00 3.00 4.00
FGCU
MASTER'S
NSSE
3.15
3.15
3.43
.00 1.00 2.00 3.00 4.00
FGCU
MASTER'S
NSSE

Goal 9. Community Awareness and Involvement.Contributing to the welfare of your community
SR
2.38
2.40
2.64
.00 1.00 2.00 3.00 4.00
FGCU
MASTER'S
NSSE
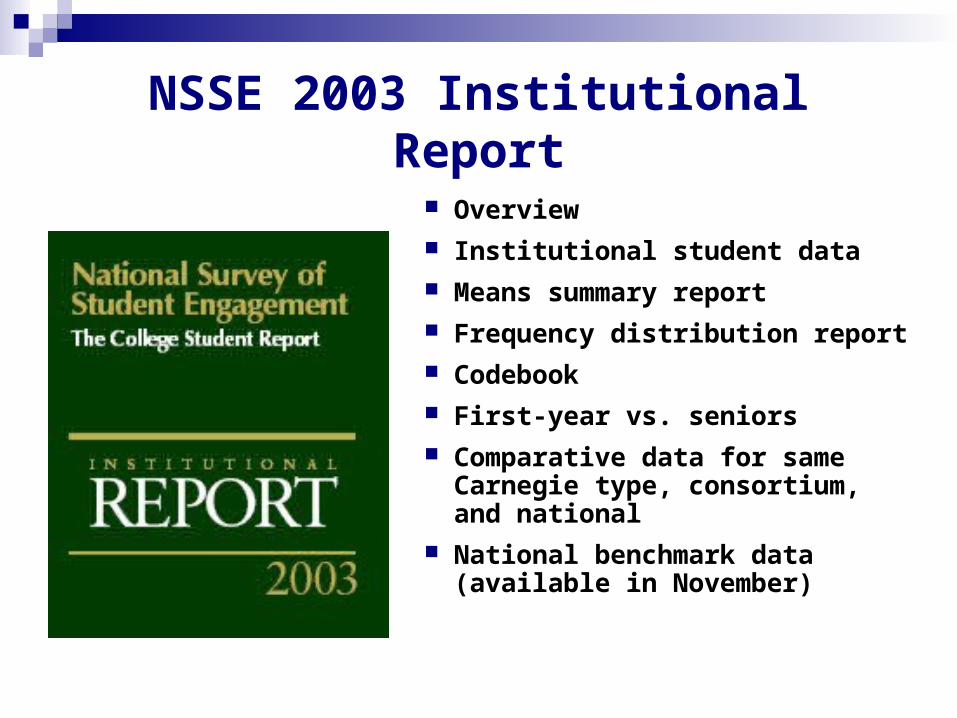
NSSE 2003 Institutional Report
Overview Institutional student data Means summary report Frequency distribution report Codebook First-year vs. seniors Comparative data for same
Carnegie type, consortium, and national
National benchmark data (available in November)
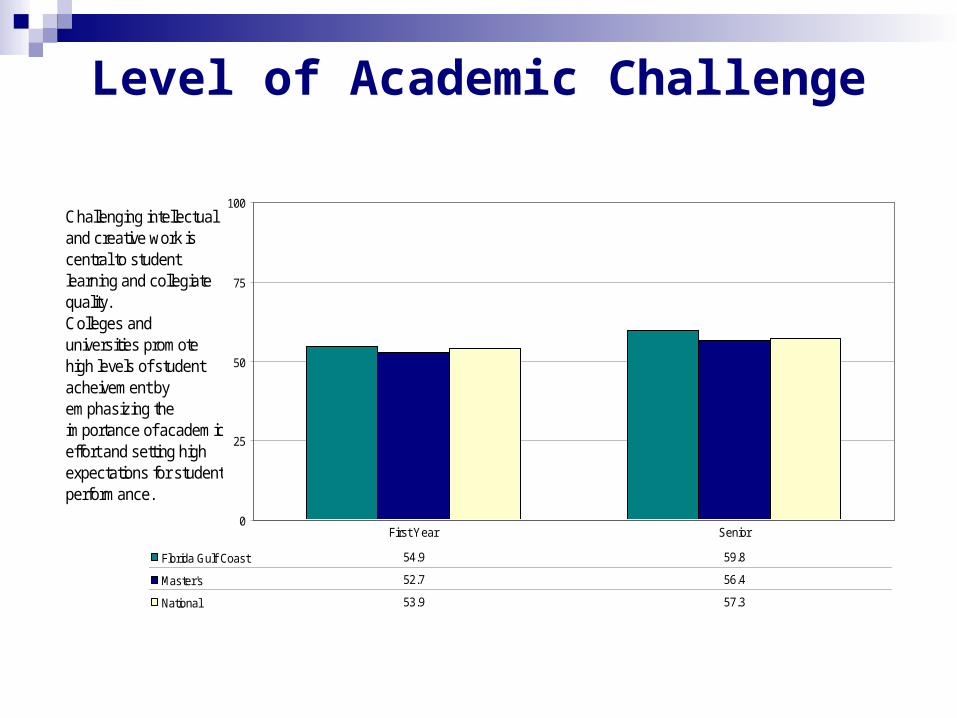
Level of Academic Challenge
0
25
50
75
100
Florida Gulf Coast 54.9 59.8
Master's 52.7 56.4
National 53.9 57.3
First Year Senior
Challenging intellectual and creative work is central to student learning and collegiate quality.Colleges and universities promote high levels of student acheivement by emphasizing the importance of academic effort and setting high expectations for student performance.

Active & Collaborative Learning
0
25
50
75
100
Florida Gulf Coast Master's National
Florida Gulf Coast 49.6 54.1
Master's 41.1 50.2
National 41.8 50.1
First Year Senior
Students learn more when they are intensely involved in their education and asked to think about what they are learning in different settings. Collaborating with others in solving problems or mastering difficult material prepares students for the messy, unscripted problems they will encounter daily during and after college.

Student-Faculty Interaction
0
25
50
75
100
Florida Gulf Coast Master's National
Florida Gulf Coast 38.3 41.4
Master's 35.7 42.4
National 37.2 44.2
First Year Senior
Students learn firsthand how experts think about and solve practical problems by interacting with faculty members inside and outside the classroom. As a result, their teachers become role models, mentors, and guides for continuous, life-long learning.
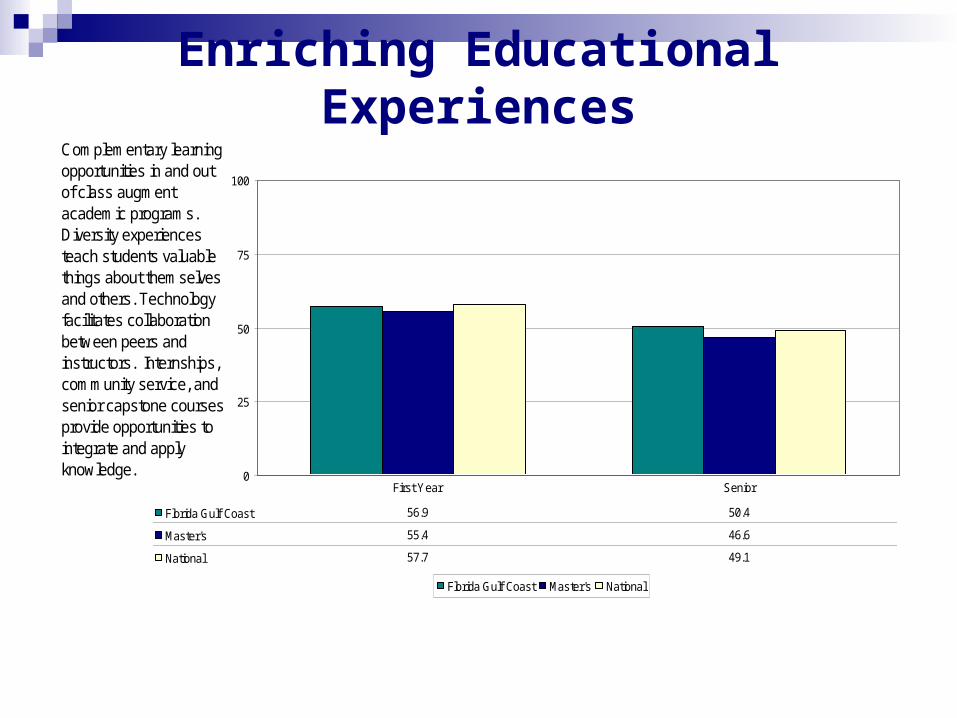
Enriching Educational Experiences
0
25
50
75
100
Florida Gulf Coast Master's National
Florida Gulf Coast 56.9 50.4
Master's 55.4 46.6
National 57.7 49.1
First Year Senior
Complementary learning opportunities in and out of class augment academic programs. Diversity experiences teach students valuable things about themselves and others. Technology facilitates collaboration between peers and instructors. Internships, community service, and senior capstone courses provide opportunities to integrate and apply knowledge.

Supportive Campus Environment
0
25
50
75
100
Florida Gulf Coast Master's National
Florida Gulf Coast 64.2 59.7
Master's 61.1 58.6
National 61.8 58.8
First Year Senior
Students perform better and are more satisfied at colleges that are committed to their success and cultivate positive working and social relations among different groups on campus.

Standardized Residuals
-1.0
0.0
1.0
2.0
3.0
4.0
Level of AcademicChallenge
Active & CollaborativeLearning
Student-FacultyInteraction
Enriching EducationalExperiences
Supportive CampusEnvironment
First YearSenior

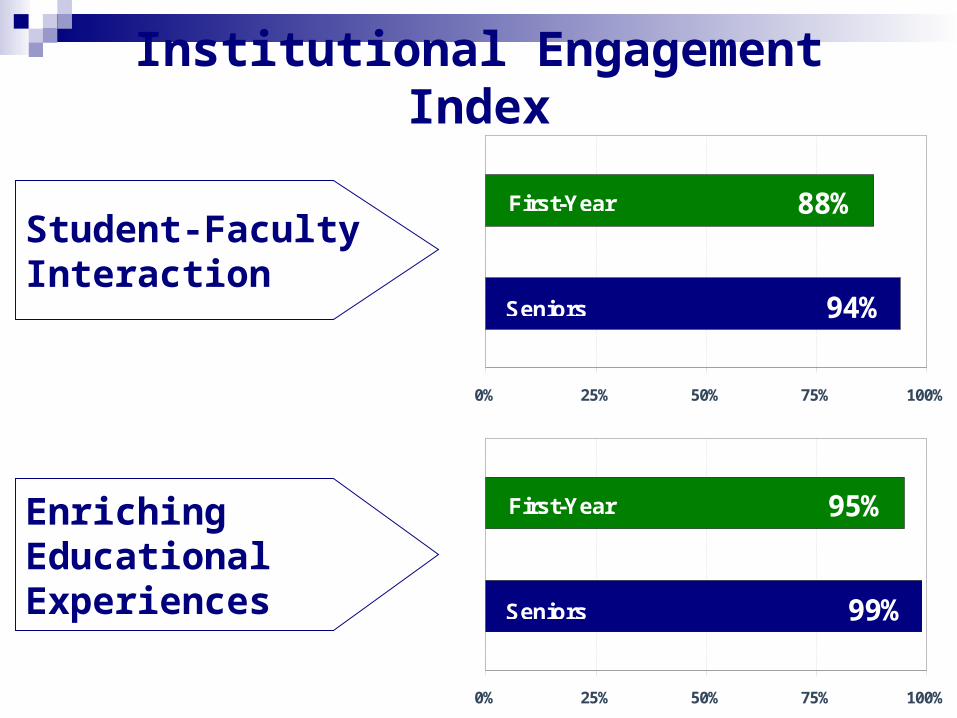
Institutional Engagement Index
Level of Academic Challenge
98%
94%
0% 25% 50% 75% 100%
First-Year
Seniors
99%
99%
0% 25% 50% 75% 100%
First-Year
Seniors
Active & Collaborative Learning
99%
95%
0% 25% 50% 75% 100%
First-Year
Seniors
94%
88%
0% 25% 50% 75% 100%
First-Year
Seniors
Institutional Engagement Index
Student-Faculty Interaction
Enriching Educational Experiences

85%
89%
0% 25% 50% 75% 100%
First-Year
Seniors
Institutional Engagement Index
Supportive Campus Environment
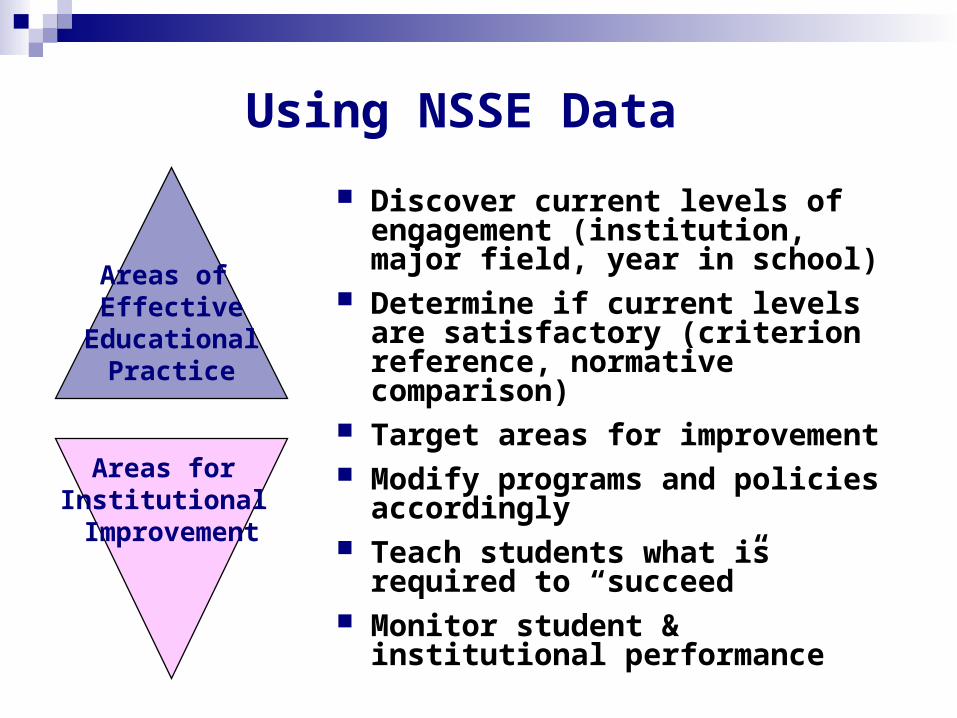
Using NSSE Data Discover current levels of
engagement (institution, major field, year in school)
Determine if current levels are satisfactory (criterion reference, normative comparison)
Target areas for improvement Modify programs and policies
accordingly Teach students what is required to
“succeed” Monitor student & institutional
performance
Areas of Effective
EducationalPractice
Areas for Institutional Improvement

Using NSSE Data - Campus Uses
Gauge status of campus priorities Examine changes in student
engagement between first and senior years
Assess campus progress Provide evidence of accountability Encourage dialogue about good
practice Identify distinctive competencies Improve curricula, instruction,
services

Questions and Discussion