Presentation of a new system to monitor and stabilize mid ...Presentation of a new system to monitor...
25
Presentation of a new system to monitor and stabilize mid infrared spectral data Walloon Agricultural Research Centre, Belgium Clément Grelet, Vincent Baeten, Pierre Dardenne, Juan Antonio Fernandez Garcia, Ouissam Abbas, & Frédéric Dehareng
Transcript of Presentation of a new system to monitor and stabilize mid ...Presentation of a new system to monitor...

Presentation of a new system to monitor and stabilize mid infrared spectral data
Walloon Agricultural Research Centre, Belgium
Clément Grelet, Vincent Baeten, Pierre Dardenne, Juan Antonio Fernandez Garcia, Ouissam Abbas, & Frédéric Dehareng

•Position
of the peaks Qualitative
analysis•Intensity
of the peaks Quantitative
analysis
•Position
of the peaks Qualitative
analysis•Intensity
of the peaks Quantitative
analysis
C=O
Fat, organic acids
C=O, N-H, C-N
Protein
CH
Fat + protein
CH
Fat
C-O
Fat
C-O, OH
Lactose

-
between different brands apparatus-
between different models apparatus of the same brand -
between apparatus of the same model of the same brand
But…
Moreover, even with the same instrument, the spectra could be different for the same milk. It's not stable in time !
-T°/humidity in the lab-Piece replacement-Maintenance operation-Use/wear
Spectra of a same milk could differ:

Milk MIR spectra
Milk component
Fat, Protein, Lactose, SNFCasein
Hewavitharana et al. 1997. Analyst 122:701–704.
Urea
Hansen, P. W. 1998. Milchwissenschaft 53:251–255
Fatty acids Soyeurt et al. 2006 J. Dairy Sci. 89: 3690–3695
Classical slope/bias correction
Refe
renc
e

Milk MIR spectra
Blood component
Phenotype
Milk Indirect
Lactoferrin Soyeurt et al. 2007 J. Dairy Sci. 90: 4443–4450
Major minerals Soyeurt et al. 2009 J. Dairy Sci. 92: 2444–2454
Acetone, β-hydroxybutyrate, and citrate Grelet et al. 2016 J. Dairy Sci. 99 : 4816–4825
Blood BHB and NEFA M. Gelé et al. 2015, ICAR
Coagulation, titrable acidity, pH De Marchi et al. 2009 J. Dairy Sci. 92: 423-432
Body Energy status Mc Parland et al. 2011 J. Dairy Sci. 94: 3651–3661
Methane Dehareng et al. 2012 Animal. 6 : 1694-1701
Spectral Spectral StandardizationStandardization


Project :2011-2015
0 100 200 300 400 500
0 100 200 300 400 500
0 100 200 300 400 500
0 100 200 300 400 500
0 100 200 300 400 500
0 100 200 300 400 500
Develop MIR models predicting cow status
PIECE-WISE DIRECT STANDARDIZATION (PDS)

-
between different brands apparatus-
between different models apparatus of the same brand -
between apparatus of the same model of the same brand
But…
Moreover, even with the same instrument, the spectra could be different for the same milk. It's not stable in time !
-T°/humidity in the lab-Piece replacement-Maintenance operation-Use
Spectra of a same milk could differ:PDS Standardization is a solution to PDS Standardization is a solution to solve these problemssolve these problems
100 machines3 continents13 countries40 labs

Creation of common models, more robust
Use of models on all instruments
Sharing of data/models
Creation of spectral database

Daily Monitoring and Stabilization of spectra
1.
Monitoring of the stability between 2 PDS standardization
2.
If needed, realization of a stabilization procedure

Monitoring of the stability in time
Standardization 2
Standardization 3
Month 1 Month 2
Strong perturbation
biased predictions
Creation of an alert system for the labs
Dailycheck
Standardization 1

Dailycheck
Standardization 1
Just after the standardization: 10 UHT milks constituting the stability reference
Monitoring of the stability in time

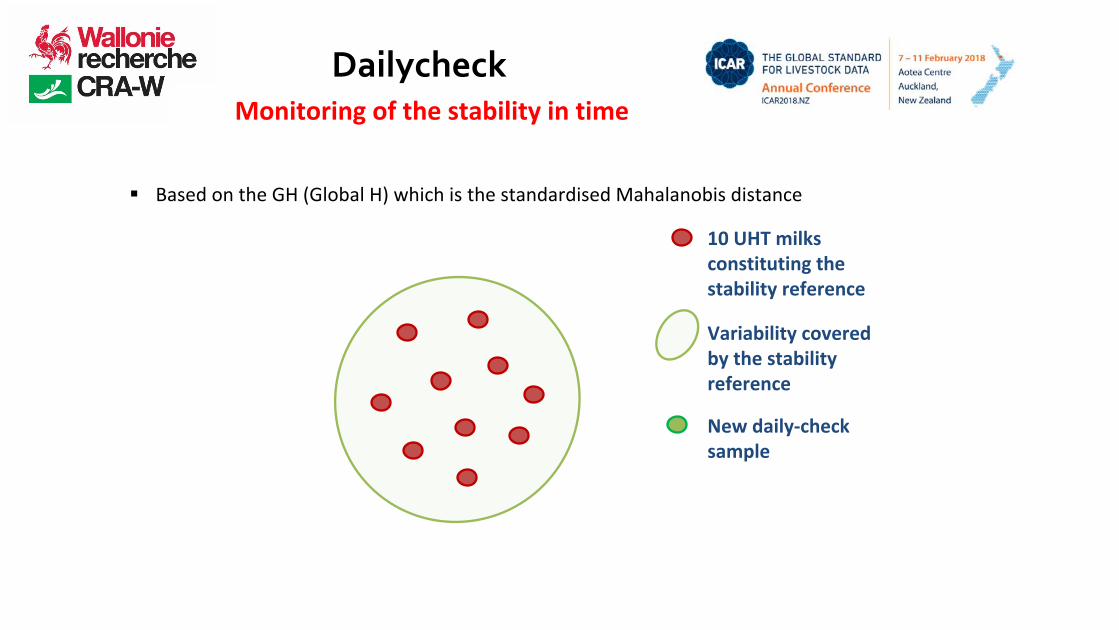
DailycheckMonitoring of the stability in time
Based on the GH (Global H) which is the standardised Mahalanobis
distance
10 UHT milks constituting the stability reference
DailycheckMonitoring of the stability in time
Based on the GH (Global H) which is the standardised Mahalanobis
distance
Variability covered by the stability reference
10 UHT milks constituting the stability reference
New daily-check sample

DailycheckMonitoring of the stability in time
Based on the GH (Global H) which is the standardised Mahalanobis
distance
GH = 2 OK
2 New daily-check sample
10 UHT milks constituting the stability reference
Variability covered by the stability reference

DailycheckMonitoring of the stability in time
Based on the GH (Global H) which is the standardised Mahalanobis
distance
GH = 20
New daily-check sample
10 UHT milks constituting the stability reference
Variability covered by the stability reference

DailycheckMonitoring of the stability in time
Based on the GH (Global H) which is the standardised Mahalanobis
distance
GH = 20 NOT OK
New daily-check sample
10 UHT milks constituting the stability reference
Variability covered by the stability reference

Dailycheck
Standardization 1
Just after the standardization: 10 UHT milks constituting the stability reference
After n samples out: Alert !
Monitoring of the stability in time

DailycheckMonitoring of the stability in time

DailycheckMonitoring of the stability in time

Standardization
Just after the standardization: 10 UHT milks constituting the stability reference
DailycheckMonitoring of the stability in time
Alert System

Standardization
Just after the standardization: 10 UHT milks constituting the stability reference
StandardizationStabilization
DailycheckMonitoring of the stability in time
Alert System

Stabilization
0 50 100 1500
20
40
60
80
100
120
Samples
GH
GH of stabilized daily check
GH validation= 5.8479
CalibrationValidationCoefficients
0 50 100 1500
20
40
60
80
100
120
140
Samples
GH
GH of raw daily check
GH validation= 23.2963
CalibrationValidation
Impact on GH

Stabilization
0 20 40 60 80 100 120 140
3.54
3.56
3.58
3.6
3.62
3.64
3.66
3.68
Samples
Pre
dict
ed f
at (g
/100
ml)
Fat predicted values of raw daily check
SD fat validation= 0.025834
CalibrationValidation
0 50 100 1503.55
3.6
3.65
3.7
Samples
Pre
dict
ed f
at (
g/10
0ml)
Fat predicted values of stabilized daily check
SD fat validation= 0.017181
CalibrationValidationCoefficients
Impact on Fat

Conclusion:
• Routine standardization:Creation of common models, more robustUse of models on all instruments Sharing of data/modelsCreation of spectral database
• Alert detection:Detection of all deviations/perturbations between 2 monthly ring
test based on GH and/or Parameter measurements
• Stabilization:Potential to use models in routine