Presentation of 2008 annual results M6 Group · In Access Prime Time (6pm In Access Prime Time (6pm...
49
1 Presentation of Presentation of Presentation of Presentation of 2008 annual 2008 annual 2008 annual 2008 annual results results results results M6 Group M6 Group M6 Group M6 Group 11 March 2009 11 March 2009 11 March 2009 11 March 2009
Transcript of Presentation of 2008 annual results M6 Group · In Access Prime Time (6pm In Access Prime Time (6pm...
1
Presentation of Presentation of Presentation of Presentation of 2008 annual 2008 annual 2008 annual 2008 annual
resultsresultsresultsresults
M6 GroupM6 GroupM6 GroupM6 Group
11 March 200911 March 200911 March 200911 March 2009
2
� Statements contained in this document, particularly those concerning forecasts on future M6 Group performances, are forward-looking statements that are potentially subject to various risks and uncertainties.
� Any reference to M6 Group past performances should not be interpreted as an indicator of future performances.
� The content of this document must not be considered as an offer document or a solicitation to buy or sell M6 Group shares.
� The financial accounts, information and statements included in this document, especially in the appendices are under review by the auditors and pending the AMF registration.
Presentation of 2008 annual results Presentation of 2008 annual results Presentation of 2008 annual results Presentation of 2008 annual results –––– M6 GroupM6 GroupM6 GroupM6 Group
DisclaimerDisclaimerDisclaimerDisclaimer
3
� Introduction and highlights
�Television • Audiences
• Advertising
�Diversification and audiovisual rights
�Outlook
�Financial statements
�Appendices
Presentation of 2008 annual results Presentation of 2008 annual results Presentation of 2008 annual results Presentation of 2008 annual results –––– M6 GroupM6 GroupM6 GroupM6 Group
ContentsContentsContentsContents
4
Introduction and highlightsIntroduction and highlightsIntroduction and highlightsIntroduction and highlights
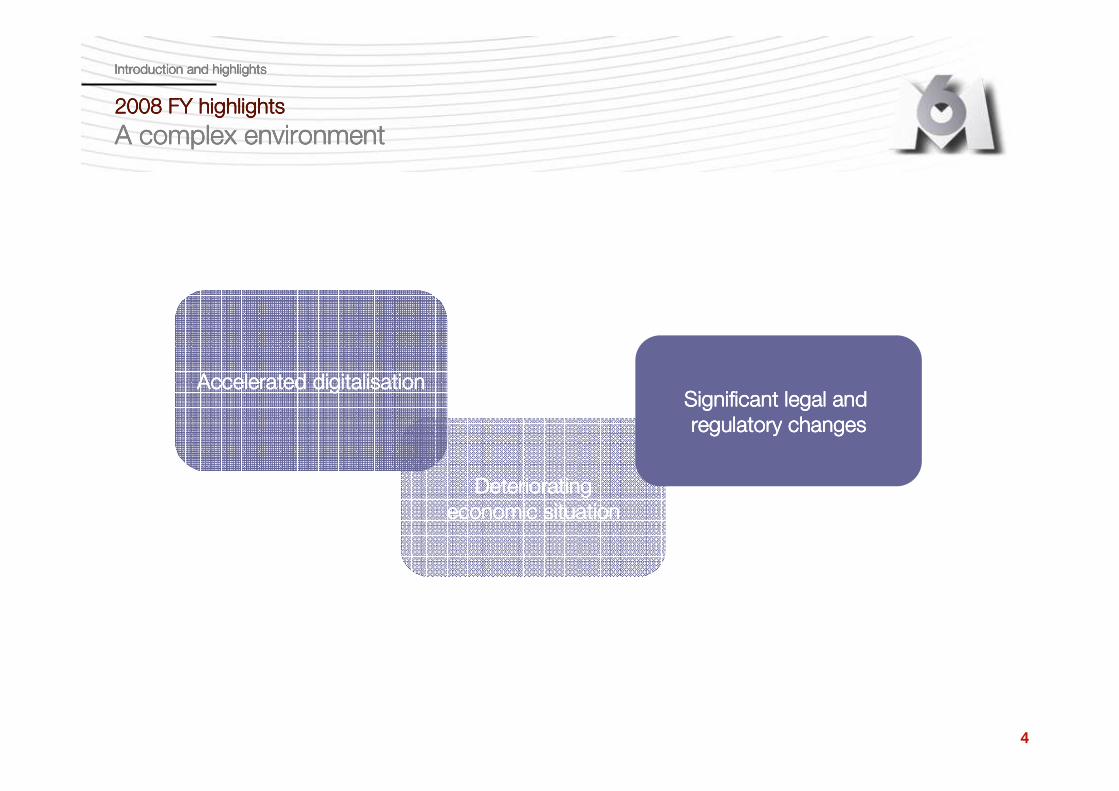
2008 FY highlights 2008 FY highlights 2008 FY highlights 2008 FY highlights
A complex environmentA complex environmentA complex environmentA complex environment
Significant legal and Significant legal and Significant legal and Significant legal and regulatory changesregulatory changesregulatory changesregulatory changes
Accelerated digitalisationAccelerated digitalisationAccelerated digitalisationAccelerated digitalisation
DeterioratingDeterioratingDeterioratingDeterioratingeconomic situationeconomic situationeconomic situationeconomic situation
5
796.7 796.7 796.7 796.7 762.2 762.2 762.2 762.2
407.2 407.2 407.2 407.2
819.2 819.2 819.2 819.2
5,507.65,507.65,507.65,507.6 5,041.95,041.95,041.95,041.9
11.7% 11.7% 11.7% 11.7% 12.6 %12.6 %12.6 %12.6 %
5.8 %5.8 %5.8 %5.8 %
11.1 %11.1 %11.1 %11.1 %
82.5 %82.5 %82.5 %82.5 %
76.3%76.3%76.3%76.3%
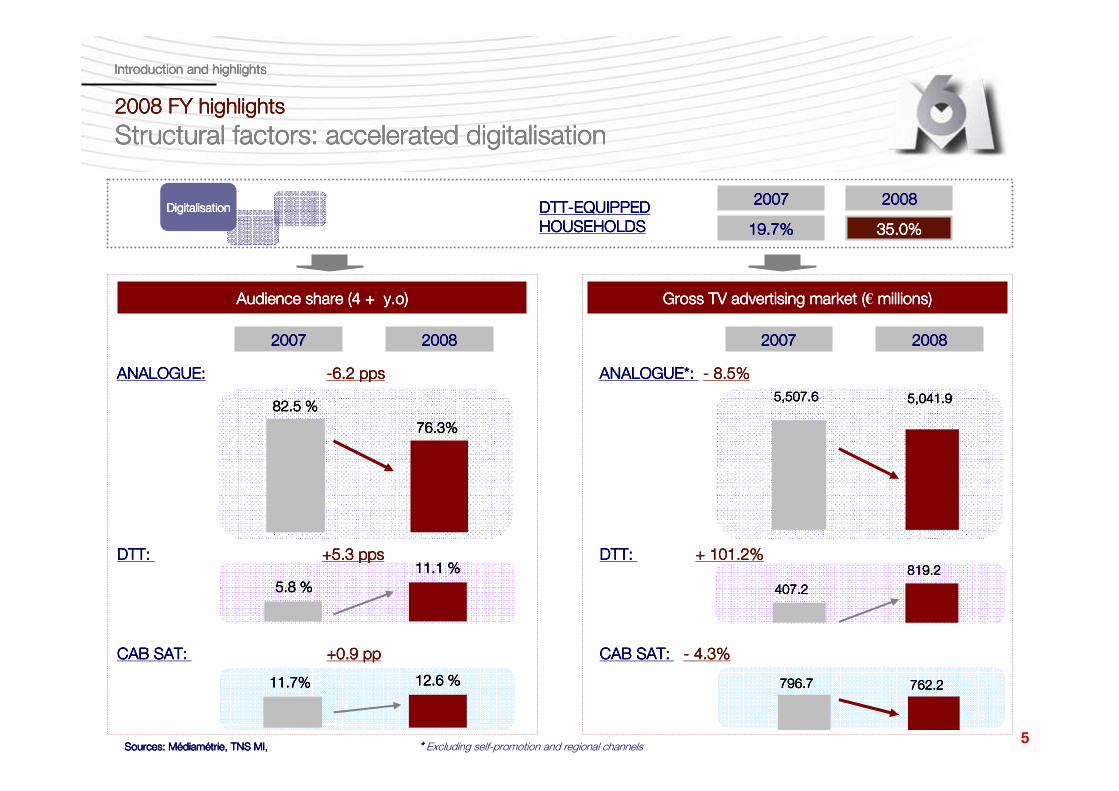
Introduction and highlightsIntroduction and highlightsIntroduction and highlightsIntroduction and highlights
2008 FY highlights2008 FY highlights2008 FY highlights2008 FY highlights
Structural factors: accelerated digitalisationStructural factors: accelerated digitalisationStructural factors: accelerated digitalisationStructural factors: accelerated digitalisation
Audience share (4 + Audience share (4 + Audience share (4 + Audience share (4 + y.oy.oy.oy.o)))) Gross TV advertising market (Gross TV advertising market (Gross TV advertising market (Gross TV advertising market (€ millions)millions)millions)millions)
2007200720072007 2008200820082008
ANALOGUE:ANALOGUE:ANALOGUE:ANALOGUE: ----6.2 pps6.2 pps6.2 pps6.2 pps
2007200720072007 2008200820082008
ANALOGUE*: ANALOGUE*: ANALOGUE*: ANALOGUE*: ---- 8.5%8.5%8.5%8.5%
DTT: DTT: DTT: DTT: + 101.2%+ 101.2%+ 101.2%+ 101.2%
DTTDTTDTTDTT----EQUIPPED EQUIPPED EQUIPPED EQUIPPED HOUSEHOLDSHOUSEHOLDSHOUSEHOLDSHOUSEHOLDS
2007200720072007 2008200820082008
19.7%19.7%19.7%19.7% 35.0%35.0%35.0%35.0%
* * * * Excluding self-promotion and regional channelsSources: MSources: MSources: MSources: Méééédiamdiamdiamdiaméééétrie, TNS MI,trie, TNS MI,trie, TNS MI,trie, TNS MI,
DigitalisationDigitalisationDigitalisationDigitalisation
DTT: DTT: DTT: DTT: +5.3 pps+5.3 pps+5.3 pps+5.3 pps
CAB SAT: CAB SAT: CAB SAT: CAB SAT: +0.9 pp +0.9 pp +0.9 pp +0.9 pp CAB SAT: CAB SAT: CAB SAT: CAB SAT: ---- 4.3%4.3%4.3%4.3%

6
0.9%
3.1%
0.6%
3.0%4.3%
7.5%
5.6%
8.6%9.7%
-2.5%
10.3%
3.1%
6.2%
4.1%
Introduction and highlightsIntroduction and highlightsIntroduction and highlightsIntroduction and highlights
2008 FY highlights2008 FY highlights2008 FY highlights2008 FY highlights
Economic factors: further deterioration in HY2Economic factors: further deterioration in HY2Economic factors: further deterioration in HY2Economic factors: further deterioration in HY2
The multiThe multiThe multiThe multi----media advertising market slowed down over HY2 (gross) media advertising market slowed down over HY2 (gross) media advertising market slowed down over HY2 (gross) media advertising market slowed down over HY2 (gross) –––– 2008 vs 2007 in %2008 vs 2007 in %2008 vs 2007 in %2008 vs 2007 in % Slowdown in household consumption Slowdown in household consumption Slowdown in household consumption Slowdown in household consumption
2007200720072007 2008200820082008
GDP: GDP: GDP: GDP: Q1 08Q1 08Q1 08Q1 08 Q4 08Q4 08Q4 08Q4 08
+ 0.4%+ 0.4%+ 0.4%+ 0.4% ---- 1.2%1.2%1.2%1.2%
Impact on M6 GroupImpact on M6 GroupImpact on M6 GroupImpact on M6 Group’’’’s s s s consumer marketsconsumer marketsconsumer marketsconsumer markets
Over the full 2008 FY, the growth in Over the full 2008 FY, the growth in Over the full 2008 FY, the growth in Over the full 2008 FY, the growth in consumersconsumersconsumersconsumers’’’’ purchases of manufactured purchases of manufactured purchases of manufactured purchases of manufactured
goods slowed down markedly goods slowed down markedly goods slowed down markedly goods slowed down markedly
+ 2.5%+ 2.5%+ 2.5%+ 2.5% + 1.3%+ 1.3%+ 1.3%+ 1.3%
+ 0.7%+ 0.7%+ 0.7%+ 0.7%
Q3 08Q3 08Q3 08Q3 08
+ 0.1%+ 0.1%+ 0.1%+ 0.1%
Q2 08Q2 08Q2 08Q2 08
---- 0.3%0.3%0.3%0.3%
2008200820082008
� DistanceDistanceDistanceDistance----sellingsellingsellingselling
� Material goods: videos, CDs/DVDs, Material goods: videos, CDs/DVDs, Material goods: videos, CDs/DVDs, Material goods: videos, CDs/DVDs, collections,collections,collections,collections,…………....
Sources: Insee, TNS MISources: Insee, TNS MISources: Insee, TNS MISources: Insee, TNS MI
EconomicEconomicEconomicEconomicSituationSituationSituationSituation
20082007
January February March April May June July August Sept. Oct. Nov. Dec.
7
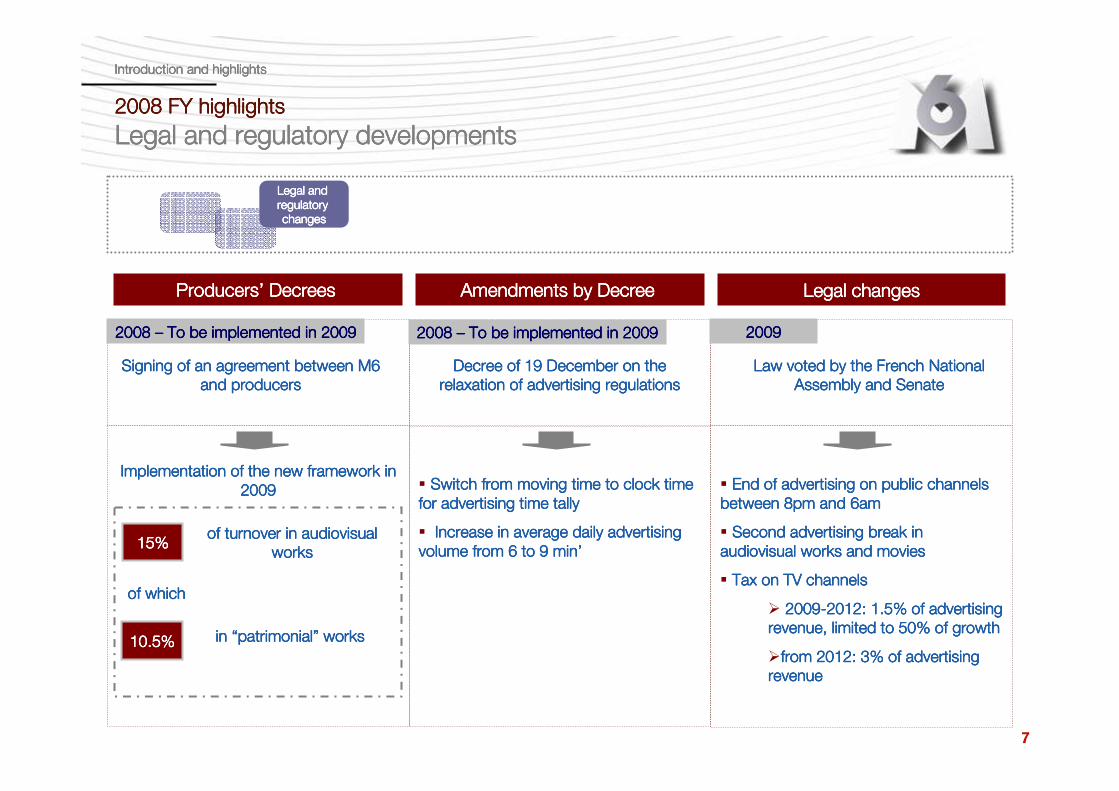
Introduction and highlightsIntroduction and highlightsIntroduction and highlightsIntroduction and highlights
2008 FY highlights2008 FY highlights2008 FY highlights2008 FY highlights
Legal and regulatory developments Legal and regulatory developments Legal and regulatory developments Legal and regulatory developments
ProducersProducersProducersProducers’’’’ Decrees Decrees Decrees Decrees Amendments by Decree Amendments by Decree Amendments by Decree Amendments by Decree Legal changesLegal changesLegal changesLegal changes
Implementation of the new framework in Implementation of the new framework in Implementation of the new framework in Implementation of the new framework in 2009200920092009
10.5%10.5%10.5%10.5% in in in in ““““patrimonialpatrimonialpatrimonialpatrimonial”””” worksworksworksworks
� Switch from moving time to clock time Switch from moving time to clock time Switch from moving time to clock time Switch from moving time to clock time for advertising time tallyfor advertising time tallyfor advertising time tallyfor advertising time tally
� Increase in average daily advertising Increase in average daily advertising Increase in average daily advertising Increase in average daily advertising volume from 6 to 9 minvolume from 6 to 9 minvolume from 6 to 9 minvolume from 6 to 9 min’’’’
2008 2008 2008 2008 –––– To be implemented in 2009To be implemented in 2009To be implemented in 2009To be implemented in 2009
Signing of an agreement between M6 Signing of an agreement between M6 Signing of an agreement between M6 Signing of an agreement between M6 and producersand producersand producersand producers
Decree of 19 December on the Decree of 19 December on the Decree of 19 December on the Decree of 19 December on the relaxation of advertising regulationsrelaxation of advertising regulationsrelaxation of advertising regulationsrelaxation of advertising regulations
2009200920092009
Law voted by the French National Law voted by the French National Law voted by the French National Law voted by the French National Assembly and SenateAssembly and SenateAssembly and SenateAssembly and Senate
15%15%15%15%of turnover in audiovisual of turnover in audiovisual of turnover in audiovisual of turnover in audiovisual
worksworksworksworks
of whichof whichof whichof which
� End of advertising on public channels End of advertising on public channels End of advertising on public channels End of advertising on public channels between 8pm and 6ambetween 8pm and 6ambetween 8pm and 6ambetween 8pm and 6am
� Second advertising break in Second advertising break in Second advertising break in Second advertising break in audiovisual works and moviesaudiovisual works and moviesaudiovisual works and moviesaudiovisual works and movies
� Tax on TV channelsTax on TV channelsTax on TV channelsTax on TV channels
� 2009200920092009----2012: 1.5% of advertising 2012: 1.5% of advertising 2012: 1.5% of advertising 2012: 1.5% of advertising revenue, limited to 50% of growthrevenue, limited to 50% of growthrevenue, limited to 50% of growthrevenue, limited to 50% of growth
�from 2012: 3% of advertising from 2012: 3% of advertising from 2012: 3% of advertising from 2012: 3% of advertising revenue revenue revenue revenue
Legal and Legal and Legal and Legal and regulatory regulatory regulatory regulatory changeschangeschangeschanges
2008 2008 2008 2008 –––– To be implemented in 2009To be implemented in 2009To be implemented in 2009To be implemented in 2009

8
Introduction and highlights
2008 FY highlights 2008 FY highlights 2008 FY highlights 2008 FY highlights
Group performanceGroup performanceGroup performanceGroup performance
OperationsOperationsOperationsOperations GrowthGrowthGrowthGrowth FinancialFinancialFinancialFinancial
� M6 shows the best resiliencebest resiliencebest resiliencebest resilienceto the development of DTT
=> Access Prime-Time success
� W9 recorded the strongest strongest strongest strongest audience growthaudience growthaudience growthaudience growth of all channels
� Market share gains Market share gains Market share gains Market share gains in all advertising segments: +0.8 pp+0.8 pp+0.8 pp+0.8 pp
� The Group’s websites totalled 13 million UVs13 million UVs13 million UVs13 million UVs
� AcquisitionAcquisitionAcquisitionAcquisition of Cyréalis
� StrengthenedStrengthenedStrengthenedStrengthened rights catalogue (Hugo Films)
� Investments in new new new new technologiestechnologiestechnologiestechnologies: HD, digital control room, Catch-up TV
� Multi-media advertising revenue: +1.3%+1.3%+1.3%+1.3%
� Impact of Euro 2008Euro 2008Euro 2008Euro 2008
� Controlled Controlled Controlled Controlled operating expenses
� W9 reported its first profitable its first profitable its first profitable its first profitable financial year financial year financial year financial year
� A sound financial positionsound financial positionsound financial positionsound financial position
� High cash flow High cash flow High cash flow High cash flow generation

9
1,356.41,356.41,356.41,356.4
1,120.31,120.31,120.31,120.3
236.1236.1236.1236.1 168.7168.7168.7168.7
1,354.91,354.91,354.91,354.9
1,160.91,160.91,160.91,160.9
194.0194.0194.0194.0 138.4138.4138.4138.4
Consolidated turnoverConsolidated turnoverConsolidated turnoverConsolidated turnover Operating expensesOperating expensesOperating expensesOperating expenses Group EBITAGroup EBITAGroup EBITAGroup EBITA Net profit Net profit Net profit Net profit –––– Group shareGroup shareGroup shareGroup share
((((€ million)million)million)million)
2007200720072007
2008200820082008
Introduction and highlightsIntroduction and highlightsIntroduction and highlightsIntroduction and highlights
2008 FY highlights2008 FY highlights2008 FY highlights2008 FY highlights
M6 Group key figuresM6 Group key figuresM6 Group key figuresM6 Group key figures
----0.1%0.1%0.1%0.1%
----0.7%0.7%0.7%0.7% Excluding Euro Excluding Euro Excluding Euro Excluding Euro football football football football
+3.6%+3.6%+3.6%+3.6%Including Euro Including Euro Including Euro Including Euro football football football football ((((€ 50 million) 50 million) 50 million) 50 million)
----17.8%17.8%17.8%17.8% ----17.9%17.9%17.9%17.9%

10
+17.6+17.6+17.6+17.6
+12.9+12.9+12.9+12.9
+2.4+2.4+2.4+2.4
----30.130.130.130.1
----12.312.312.312.3
+25.0+25.0+25.0+25.0
----17.017.017.017.0
574.6574.6574.6574.6
565.1565.1565.1565.1
100.0100.0100.0100.0125.0125.0125.0125.0
681.6681.6681.6681.6664.6664.6664.6664.6
Introduction and highlightsIntroduction and highlightsIntroduction and highlightsIntroduction and highlights
M6 Group key figuresM6 Group key figuresM6 Group key figuresM6 Group key figures
Contribution by segment: TurnoverContribution by segment: TurnoverContribution by segment: TurnoverContribution by segment: Turnover
Stable consolidated turnover: Stable consolidated turnover: Stable consolidated turnover: Stable consolidated turnover: € 1,354.9 million (1,354.9 million (1,354.9 million (1,354.9 million (----0.1%)0.1%)0.1%)0.1%)
M6 TV NetworkM6 TV NetworkM6 TV NetworkM6 TV Network Digital channelsDigital channelsDigital channelsDigital channels Diversification and Diversification and Diversification and Diversification and Audiovisual RightsAudiovisual RightsAudiovisual RightsAudiovisual Rights
MultiMultiMultiMulti----media advertising revenue: +1.3% media advertising revenue: +1.3% media advertising revenue: +1.3% media advertising revenue: +1.3%
Consolidated turnover: Consolidated turnover: Consolidated turnover: Consolidated turnover: € 1,354.9 million1,354.9 million1,354.9 million1,354.9 million
---- Group advertising revenue: Group advertising revenue: Group advertising revenue: Group advertising revenue: € 752.9 million752.9 million752.9 million752.9 million
---- Group nonGroup nonGroup nonGroup non----advertising revenue: advertising revenue: advertising revenue: advertising revenue: € 602.0 602.0 602.0 602.0 millionmillionmillionmillion
---- 1.5 1.5 1.5 1.5 millionmillionmillionmillion
+ 9.3 + 9.3 + 9.3 + 9.3 millionmillionmillionmillion
---- 10.8 10.8 10.8 10.8 millionmillionmillionmillion
44.4%44.4%44.4%44.4%55.6%55.6%55.6%55.6%
Advertising / Non advertising revenueAdvertising / Non advertising revenueAdvertising / Non advertising revenueAdvertising / Non advertising revenue
(vs. 54.8% / 45.2% in 2007)(vs. 54.8% / 45.2% in 2007)(vs. 54.8% / 45.2% in 2007)(vs. 54.8% / 45.2% in 2007)
Further growth drivers: digital channels and interactivityFurther growth drivers: digital channels and interactivityFurther growth drivers: digital channels and interactivityFurther growth drivers: digital channels and interactivity
Consolidated turnover: Consolidated turnover: Consolidated turnover: Consolidated turnover:
M6 TV Network: M6 TV Network: M6 TV Network: M6 TV Network: € 664.6 million664.6 million664.6 million664.6 million
Digital Channels: Digital Channels: Digital Channels: Digital Channels: € 125.0 million125.0 million125.0 million125.0 million
Audiovisual Rights: Audiovisual Rights: Audiovisual Rights: Audiovisual Rights: € 90.4 million90.4 million90.4 million90.4 million
Interactions: Interactions: Interactions: Interactions: € 36.3 million36.3 million36.3 million36.3 million
Ventadis: Ventadis: Ventadis: Ventadis: € 273.2 million273.2 million273.2 million273.2 million
Interactivity (Web + Mobile): Interactivity (Web + Mobile): Interactivity (Web + Mobile): Interactivity (Web + Mobile): € 86.7 million86.7 million86.7 million86.7 million
FCGB: FCGB: FCGB: FCGB: € 78.5 million78.5 million78.5 million78.5 million
---- 2.5%2.5%2.5%2.5% + 25.1%+ 25.1%+ 25.1%+ 25.1%
---- 1.7%1.7%1.7%1.7%
((((€ million)million)million)million)

11
45.745.745.745.7 42 .342 .342 .342 .3
0.30.30.30.3
18.918.918.918.9
196.5 196.5 196.5 196.5
137.8137.8137.8137.8
Introduction and highlightsIntroduction and highlightsIntroduction and highlightsIntroduction and highlights
2008 key figures 2008 key figures 2008 key figures 2008 key figures
Contributions by segment: Group profitabilityContributions by segment: Group profitabilityContributions by segment: Group profitabilityContributions by segment: Group profitability
Controlled operating expenses Controlled operating expenses Controlled operating expenses Controlled operating expenses
+ + + + € 40.6 million40.6 million40.6 million40.6 million
Optimised resultsOptimised resultsOptimised resultsOptimised results
M6 TV NetworkM6 TV NetworkM6 TV NetworkM6 TV Network Digital ChannelsDigital ChannelsDigital ChannelsDigital Channels Diversification and Diversification and Diversification and Diversification and Audiovisual RightsAudiovisual RightsAudiovisual RightsAudiovisual Rights
Consolidated profit from operations of Consolidated profit from operations of Consolidated profit from operations of Consolidated profit from operations of € 194 million, adversely affected by the cost of Euro 2008194 million, adversely affected by the cost of Euro 2008194 million, adversely affected by the cost of Euro 2008194 million, adversely affected by the cost of Euro 2008
Euro 2008 Euro 2008 Euro 2008 Euro 2008 (excluding programme replacement cost)(excluding programme replacement cost)(excluding programme replacement cost)(excluding programme replacement cost) + + + + € 50.0 million50.0 million50.0 million50.0 million
M6 programming costs, M6 programming costs, M6 programming costs, M6 programming costs, excluding Euroexcluding Euroexcluding Euroexcluding Euro ---- € 2.1 million2.1 million2.1 million2.1 million
Other operating expenses Other operating expenses Other operating expenses Other operating expenses M6 TV Network and digital channelsM6 TV Network and digital channelsM6 TV Network and digital channelsM6 TV Network and digital channels + + + + € 0.4 million0.4 million0.4 million0.4 million
Other operating expenses, Other operating expenses, Other operating expenses, Other operating expenses, excluding TVexcluding TVexcluding TVexcluding TV ---- € 7.7 million7.7 million7.7 million7.7 million
� All Group operations are All Group operations are All Group operations are All Group operations are profitableprofitableprofitableprofitable
� Revised cost structure and direct expensesRevised cost structure and direct expensesRevised cost structure and direct expensesRevised cost structure and direct expenses for for for for
operations affected by the slowdown in their operations affected by the slowdown in their operations affected by the slowdown in their operations affected by the slowdown in their
benchmark marketsbenchmark marketsbenchmark marketsbenchmark markets
� Profitable Profitable Profitable Profitable acquisitions acquisitions acquisitions acquisitions
� Digital channels: Digital channels: Digital channels: Digital channels: a growth drivera growth drivera growth drivera growth driver
((((€ million)million)million)million)
12
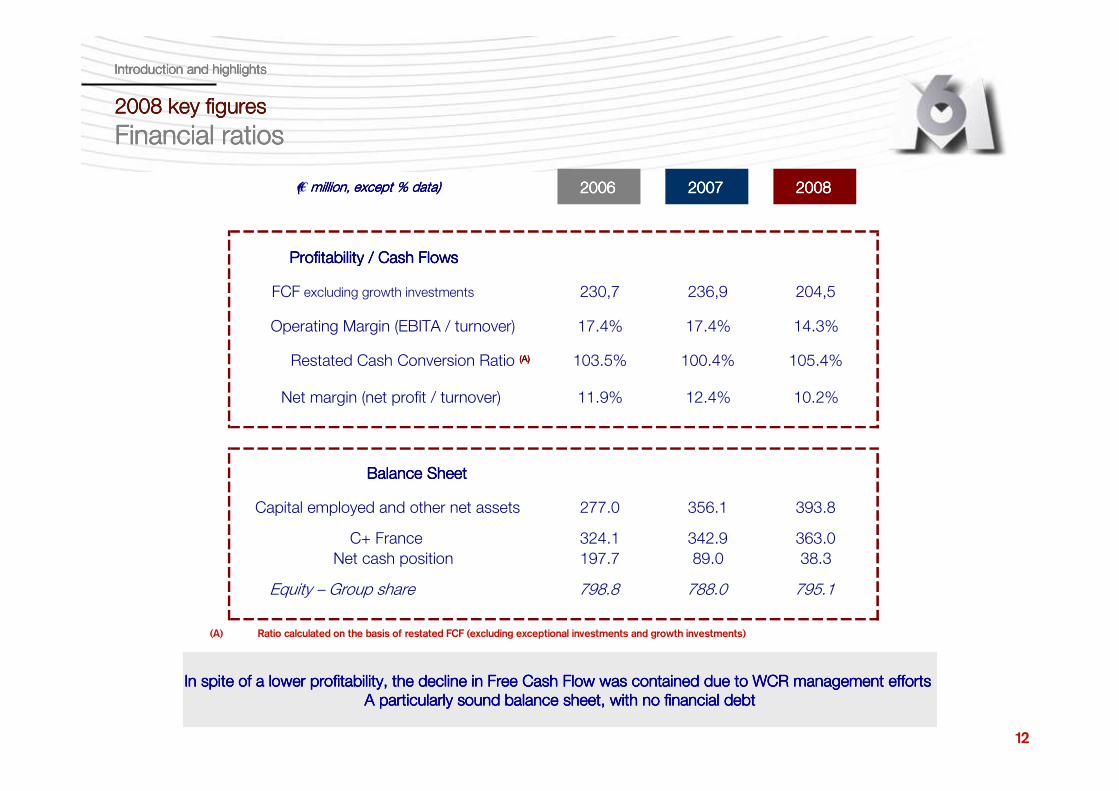
((((€ million, except % data)million, except % data)million, except % data)million, except % data)€ 2006200620062006 2007200720072007 2008200820082008
Profitability / Cash FlowsProfitability / Cash FlowsProfitability / Cash FlowsProfitability / Cash Flows
FCF excluding growth investments 230,7 236,9 204,5
Operating Margin (EBITA / turnover) 17.4% 17.4% 14.3%
Restated Cash Conversion Ratio (A)(A)(A)(A) 103.5% 100.4% 105.4%
Net margin (net profit / turnover) 11.9% 12.4% 10.2%
Balance SheetBalance SheetBalance SheetBalance Sheet
Capital employed and other net assets 277.0 356.1 393.8
C+ France 324.1 342.9 363.0
Net cash position 197.7 89.0 38.3
Equity – Group share 798.8 788.0 795.1
Introduction and highlightsIntroduction and highlightsIntroduction and highlightsIntroduction and highlights
2008 key figures2008 key figures2008 key figures2008 key figures
Financial ratiosFinancial ratiosFinancial ratiosFinancial ratios
(A) Ratio calculated on the basis of restated FCF (excluding exceptional investments and growth investments)
In spite of a lower profitability, the decline in Free Cash FlowIn spite of a lower profitability, the decline in Free Cash FlowIn spite of a lower profitability, the decline in Free Cash FlowIn spite of a lower profitability, the decline in Free Cash Flow was contained due to WCR management efforts was contained due to WCR management efforts was contained due to WCR management efforts was contained due to WCR management efforts A particularly sound balance sheet, with no financial debtA particularly sound balance sheet, with no financial debtA particularly sound balance sheet, with no financial debtA particularly sound balance sheet, with no financial debt
13
� Introduction
�Television • Audiences
• Advertising
�Diversification and audiovisual rights
�Outlook
�Financial statements
�Appendices
Presentation of 2008 annual results Presentation of 2008 annual results Presentation of 2008 annual results Presentation of 2008 annual results –––– M6 GroupM6 GroupM6 GroupM6 Group
ContentsContentsContentsContents

14
AudiencesAudiencesAudiencesAudiencesAudiences

15
11,7%11,7%11,7%11,7%5,8%5,8%5,8%5,8%
82,5%82,5%82,5%82,5%
12,6%12,6%12,6%12,6%11,1%11,1%11,1%11,1%
76,4%76,4%76,4%76,4%
Television Television Television Television ---- RatingsRatingsRatingsRatings
Key figuresKey figuresKey figuresKey figures
4+ year old audience shares 4+ year old audience shares 4+ year old audience shares 4+ year old audience shares
Historical TV channelsHistorical TV channelsHistorical TV channelsHistorical TV channels
ALL T
VALL T
VALL T
VALL T
VM
6 G
ROUP T
V
M6 G
ROUP T
V
M6 G
ROUP T
V
M6 G
ROUP T
V
??? 2008??? 2008??? 2008??? 2008
11,5%11,5%11,5%11,5%
0,9%0,9%0,9%0,9% 0,9%0,9%0,9%0,9%
11,0%11,0%11,0%11,0%
1,8%1,8%1,8%1,8%0,9%0,9%0,9%0,9%
X1.9 + 7.7%- 7.4%
- 4.3% x2
Group channels Group channels Group channels Group channels ****
Source: MSource: MSource: MSource: Méééédiamdiamdiamdiaméééétrietrietrietrie
January January January January –––– December 2007December 2007December 2007December 2007
January January January January –––– December 2008December 2008December 2008December 2008
Free DTT channelsFree DTT channelsFree DTT channelsFree DTT channels
100% Audience 100% Audience 100% Audience 100% Audience shareshareshareshare
50% Audience 50% Audience 50% Audience 50% Audience shareshareshareshare
* 4 + * 4 + * 4 + * 4 + y.o.y.o.y.o.y.o. audience audience audience audience shareshareshareshare MediaCabSatMediaCabSatMediaCabSatMediaCabSat 2007 2007 2007 2007 andandandand MediaCabSatMediaCabSatMediaCabSatMediaCabSat Jan Jan Jan Jan ----JuneJuneJuneJune 2008 2008 2008 2008

16
AudiencesHistorical TV / M6 TV Network audience levelsHistorical TV / M6 TV Network audience levelsHistorical TV / M6 TV Network audience levelsHistorical TV / M6 TV Network audience levels
17
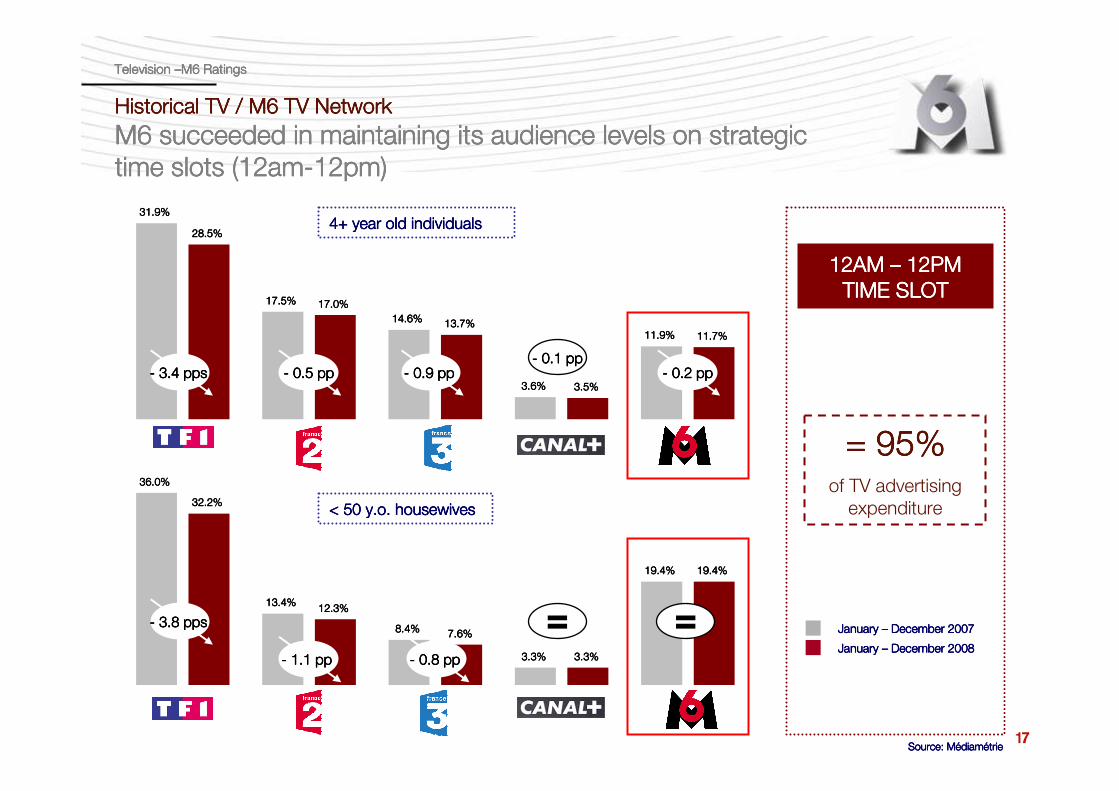
36.0%36.0%36.0%36.0%
13.4%13.4%13.4%13.4%
8.4%8.4%8.4%8.4%
3.3%3.3%3.3%3.3%
19.4%19.4%19.4%19.4%
32.2%32.2%32.2%32.2%
12.3%12.3%12.3%12.3%
7.6%7.6%7.6%7.6%
3.3%3.3%3.3%3.3%
19.4%19.4%19.4%19.4%
Source: MSource: MSource: MSource: Méééédiamdiamdiamdiaméééétrietrietrietrie
= 95%= 95%= 95%= 95%of TV advertising
expenditure
Television Television Television Television ––––M6 RatingsM6 RatingsM6 RatingsM6 Ratings
Historical TV / M6 TV Network Historical TV / M6 TV Network Historical TV / M6 TV Network Historical TV / M6 TV Network
M6 succeeded in maintaining its audience levels on strategic M6 succeeded in maintaining its audience levels on strategic M6 succeeded in maintaining its audience levels on strategic M6 succeeded in maintaining its audience levels on strategic time slots (12amtime slots (12amtime slots (12amtime slots (12am----12pm)12pm)12pm)12pm)
---- 0.1 pp0.1 pp0.1 pp0.1 pp
---- 3.8 3.8 3.8 3.8 ppsppsppspps
---- 1.1 pp 1.1 pp 1.1 pp 1.1 pp ---- 0.8 pp 0.8 pp 0.8 pp 0.8 pp
4+ year old individuals4+ year old individuals4+ year old individuals4+ year old individuals
< 50 y.o. housewives< 50 y.o. housewives< 50 y.o. housewives< 50 y.o. housewives
12AM 12AM 12AM 12AM –––– 12PM 12PM 12PM 12PM TIME SLOTTIME SLOTTIME SLOTTIME SLOT
== January January January January –––– December 2007December 2007December 2007December 2007
January January January January –––– December 2008December 2008December 2008December 2008
31.9%31.9%31.9%31.9%
17.5%17.5%17.5%17.5%
14.6%14.6%14.6%14.6%
3.6%3.6%3.6%3.6%
11.9%11.9%11.9%11.9%
28.5%28.5%28.5%28.5%
17.0%17.0%17.0%17.0%
13.7%13.7%13.7%13.7%
3.5%3.5%3.5%3.5%
11.7%11.7%11.7%11.7%
---- 0.9 pp 0.9 pp 0.9 pp 0.9 pp ---- 0.5 pp0.5 pp0.5 pp0.5 pp---- 3.4 3.4 3.4 3.4 ppsppsppspps ---- 0.2 pp0.2 pp0.2 pp0.2 pp
18
5
7
9
11
13
15
17
19
21
23
25
06h-
12h
18h-
19h40
20h50-
22h40
6am 6am 6am 6am –––– 12pm12pm12pm12pm 12pm 12pm 12pm 12pm –––– 6pm6pm6pm6pm 6pm 6pm 6pm 6pm –––– 7.40pm7.40pm7.40pm7.40pm 7.40pm 7.40pm 7.40pm 7.40pm –––– 8.50pm8.50pm8.50pm8.50pm 10.40pm 10.40pm 10.40pm 10.40pm –––– 12.30am12.30am12.30am12.30am
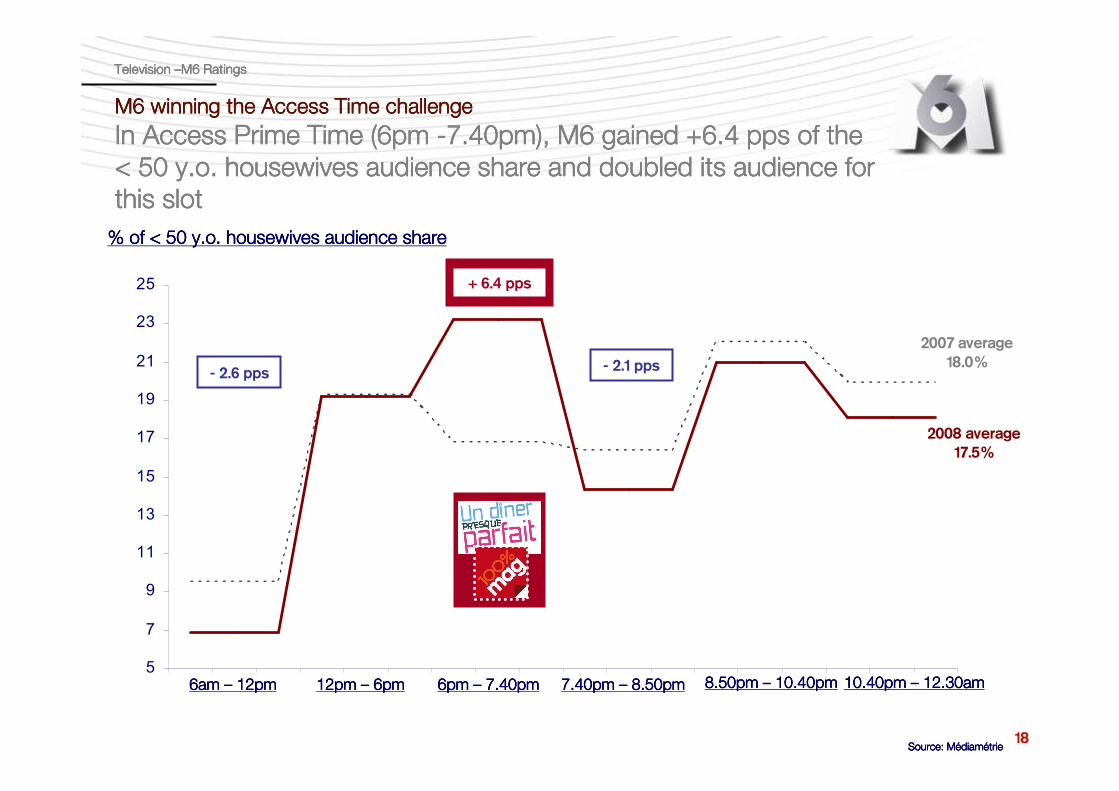
% of < 50 y.o. housewives audience share % of < 50 y.o. housewives audience share % of < 50 y.o. housewives audience share % of < 50 y.o. housewives audience share
2007 average 18.0%
2008 average 17.5%
- 2.6 pps
M6 winning the Access Time challengeM6 winning the Access Time challengeM6 winning the Access Time challengeM6 winning the Access Time challenge
In Access Prime Time (6pm In Access Prime Time (6pm In Access Prime Time (6pm In Access Prime Time (6pm ----7.40pm), M6 gained +6.4 pps of the 7.40pm), M6 gained +6.4 pps of the 7.40pm), M6 gained +6.4 pps of the 7.40pm), M6 gained +6.4 pps of the < 50 y.o. housewives audience share and doubled its audience for< 50 y.o. housewives audience share and doubled its audience for< 50 y.o. housewives audience share and doubled its audience for< 50 y.o. housewives audience share and doubled its audience forthis slotthis slotthis slotthis slot
- 2.1 pps
8.50pm 8.50pm 8.50pm 8.50pm –––– 10.40pm10.40pm10.40pm10.40pm
+ 6.4 pps
Source: MSource: MSource: MSource: Méééédiamdiamdiamdiaméééétrietrietrietrie
Television Television Television Television ––––M6 RatingsM6 RatingsM6 RatingsM6 Ratings

19
14.0
19.6
23.2
27.9
16.4
15.315.815.715.6
13.9
16.0
14.4
12.8
10.6
9.3
6.8
28.2
26.7
28.729.5
28.329.1
28.1
29.7
Jan-Feb 08 Feb 08 Mar 08 Apr 08 May 08 Jun 08 Sep 08 Oct 08 Nov 08 Dec 08 Jan 09 Feb 09
4+
H<50 y.o.
M6, the most M6, the most M6, the most M6, the most watched channel watched channel watched channel watched channel over the over the over the over the ““““DinnerDinnerDinnerDinner”””” slotslotslotslot(since September (since September (since September (since September 2008)2008)2008)2008)
17h5017h5017h5017h50 18h4018h4018h4018h40
=>=>=>=>++++M6 doubled its audience in a M6 doubled its audience in a M6 doubled its audience in a M6 doubled its audience in a year (December 2008 vs. year (December 2008 vs. year (December 2008 vs. year (December 2008 vs. December 2007) over the December 2007) over the December 2007) over the December 2007) over the 5.50pm5.50pm5.50pm5.50pm----7.40pm timeslot. 7.40pm timeslot. 7.40pm timeslot. 7.40pm timeslot.
1.1 million1.1 million1.1 million1.1 million
2.7 million2.7 million2.7 million2.7 million
+ 1.3 million viewers
M6 winning the Access Prime Time challenge M6 winning the Access Prime Time challenge M6 winning the Access Prime Time challenge M6 winning the Access Prime Time challenge
Continuously improving performance since the launchContinuously improving performance since the launchContinuously improving performance since the launchContinuously improving performance since the launch
1.4 million1.4 million1.4 million1.4 million
Source: MSource: MSource: MSource: Méééédiamdiamdiamdiaméééétrietrietrietrie
Television Television Television Television ––––M6 RatingsM6 RatingsM6 RatingsM6 Ratings
20
7
292007 2008
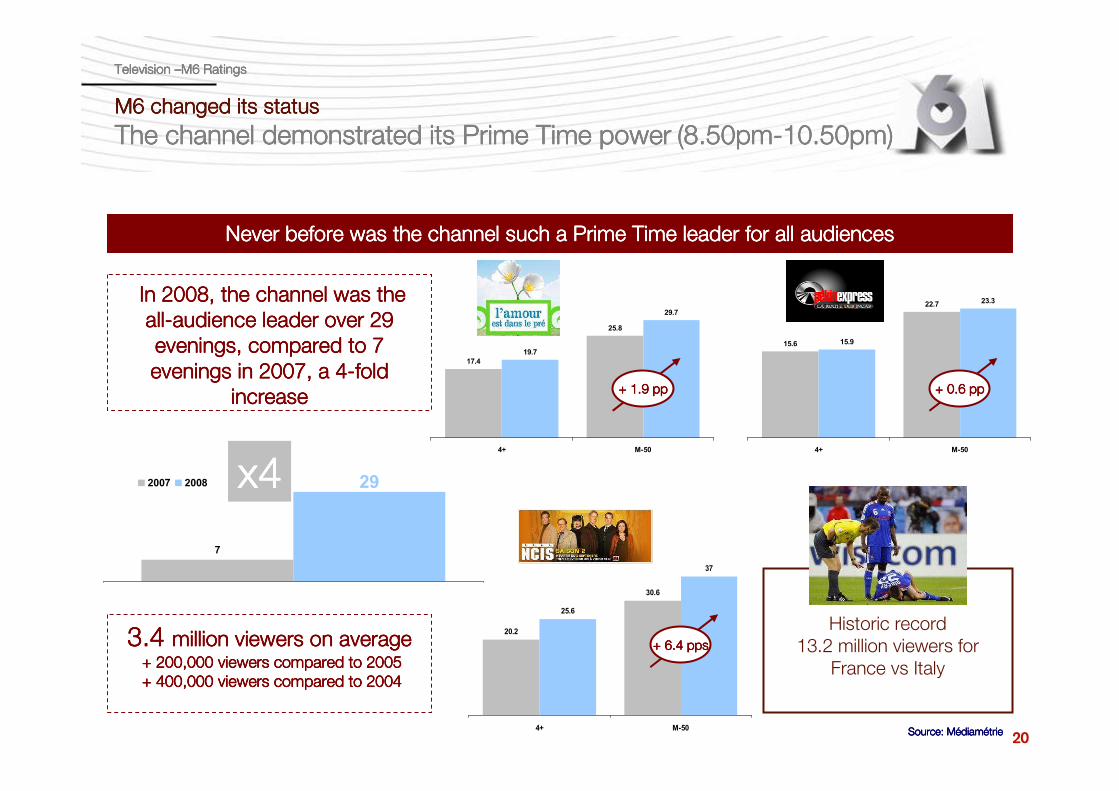
Never before was the channel such a Prime Time leader for all auNever before was the channel such a Prime Time leader for all auNever before was the channel such a Prime Time leader for all auNever before was the channel such a Prime Time leader for all audiencesdiencesdiencesdiences
x4x4x4x4
M6 changed its statusM6 changed its statusM6 changed its statusM6 changed its status
The channel demonstrated its Prime Time powerThe channel demonstrated its Prime Time powerThe channel demonstrated its Prime Time powerThe channel demonstrated its Prime Time power (8.50pm(8.50pm(8.50pm(8.50pm----10.50pm)10.50pm)10.50pm)10.50pm)
In 2008, the channel was the In 2008, the channel was the In 2008, the channel was the In 2008, the channel was the allallallall----audience leader over 29 audience leader over 29 audience leader over 29 audience leader over 29 evenings, compared to 7 evenings, compared to 7 evenings, compared to 7 evenings, compared to 7 evenings in 2007, a 4evenings in 2007, a 4evenings in 2007, a 4evenings in 2007, a 4----fold fold fold fold
increaseincreaseincreaseincrease
3.4 3.4 3.4 3.4 million viewers on averagemillion viewers on averagemillion viewers on averagemillion viewers on average+ 200,000 viewers compared to 2005+ 200,000 viewers compared to 2005+ 200,000 viewers compared to 2005+ 200,000 viewers compared to 2005+ 400,000 viewers compared to 2004+ 400,000 viewers compared to 2004+ 400,000 viewers compared to 2004+ 400,000 viewers compared to 2004
17.4
25.8
19.7
29.7
4+ M-50
15.6
22.7
15.9
23.3
4+ M-50
20.2
30.6
25.6
37
4+ M-50
+ 6.4 pps+ 6.4 pps+ 6.4 pps+ 6.4 pps
+ 1.9 pp+ 1.9 pp+ 1.9 pp+ 1.9 pp + 0.6 pp+ 0.6 pp+ 0.6 pp+ 0.6 pp
Historic record13.2 million viewers for
France vs Italy
Source: MSource: MSource: MSource: Méééédiamdiamdiamdiaméééétrietrietrietrie
Television Television Television Television ––––M6 RatingsM6 RatingsM6 RatingsM6 Ratings

21
AudiencesFree DTT / W9 Channel audience levelsFree DTT / W9 Channel audience levelsFree DTT / W9 Channel audience levelsFree DTT / W9 Channel audience levels
22
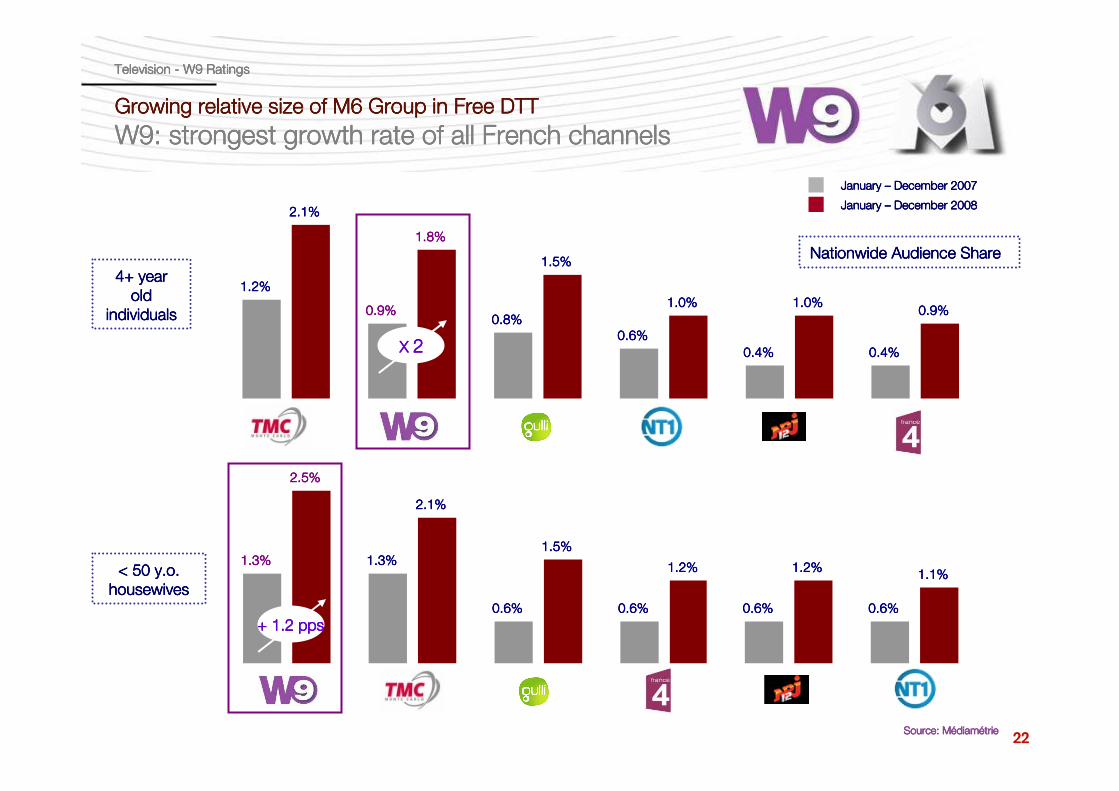
1.3%1.3%1.3%1.3%
0.6%0.6%0.6%0.6% 0.6%0.6%0.6%0.6% 0.6%0.6%0.6%0.6% 0.6%0.6%0.6%0.6%
2.1%2.1%2.1%2.1%
1.5%1.5%1.5%1.5%
1.2%1.2%1.2%1.2% 1.2%1.2%1.2%1.2%1.1%1.1%1.1%1.1%
1.3%1.3%1.3%1.3%
2.5%2.5%2.5%2.5%
1.2%1.2%1.2%1.2%
0.8%0.8%0.8%0.8%0.6%0.6%0.6%0.6%
0.4%0.4%0.4%0.4% 0.4%0.4%0.4%0.4%
2.1%2.1%2.1%2.1%
1.5%1.5%1.5%1.5%
1.0%1.0%1.0%1.0% 1.0%1.0%1.0%1.0%0.9%0.9%0.9%0.9%0.9%0.9%0.9%0.9%
1.8%1.8%1.8%1.8%
Growing relative size of M6 Group in Free DTT Growing relative size of M6 Group in Free DTT Growing relative size of M6 Group in Free DTT Growing relative size of M6 Group in Free DTT
W9: strongest growth rate of all French channelsW9: strongest growth rate of all French channelsW9: strongest growth rate of all French channelsW9: strongest growth rate of all French channels
Television Television Television Television ---- W9 RatingsW9 RatingsW9 RatingsW9 Ratings
4+ year 4+ year 4+ year 4+ year old old old old
individualsindividualsindividualsindividuals
< 50 y.o. < 50 y.o. < 50 y.o. < 50 y.o. housewiveshousewiveshousewiveshousewives
Nationwide Audience Share Nationwide Audience Share Nationwide Audience Share Nationwide Audience Share
Source: MSource: MSource: MSource: Méééédiamdiamdiamdiaméééétrietrietrietrie
January January January January –––– December 2007December 2007December 2007December 2007
January January January January –––– December 2008December 2008December 2008December 2008
+ 1.2 pps+ 1.2 pps+ 1.2 pps+ 1.2 pps
X X X X 2222
23Source: MSource: MSource: MSource: Méééédiamdiamdiamdiaméééétrie / Mtrie / Mtrie / Mtrie / Méééédiamatdiamatdiamatdiamat
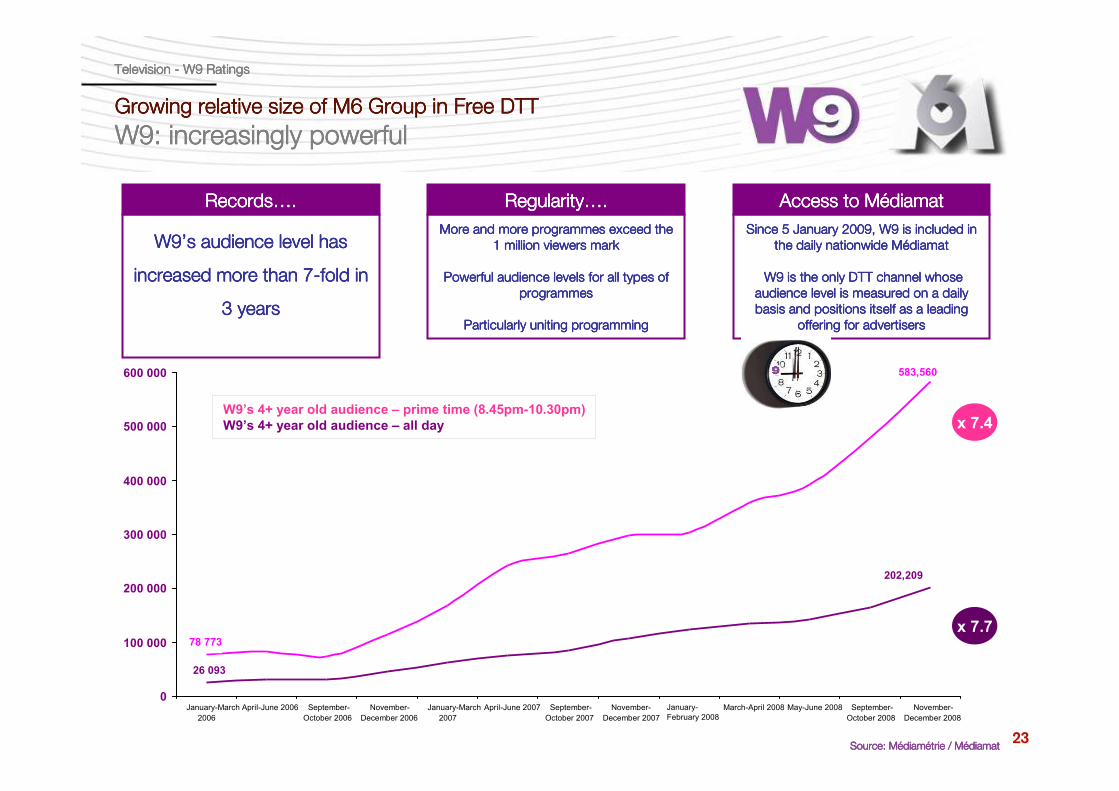
Growing relative size of M6 Group in Free DTT Growing relative size of M6 Group in Free DTT Growing relative size of M6 Group in Free DTT Growing relative size of M6 Group in Free DTT
W9: increasingly powerfulW9: increasingly powerfulW9: increasingly powerfulW9: increasingly powerful
RegularityRegularityRegularityRegularity…………....
More and more programmes exceed the More and more programmes exceed the More and more programmes exceed the More and more programmes exceed the 1 million viewers mark1 million viewers mark1 million viewers mark1 million viewers mark
Powerful audience levels for all types of Powerful audience levels for all types of Powerful audience levels for all types of Powerful audience levels for all types of programmesprogrammesprogrammesprogrammes
Particularly uniting programmingParticularly uniting programmingParticularly uniting programmingParticularly uniting programming
W9W9W9W9’’’’s audience level has s audience level has s audience level has s audience level has
increased more than 7increased more than 7increased more than 7increased more than 7----fold in fold in fold in fold in
3 years3 years3 years3 years
RecordsRecordsRecordsRecords………….... Access to MAccess to MAccess to MAccess to Méééédiamatdiamatdiamatdiamat
Since 5 January 2009, W9 is included in Since 5 January 2009, W9 is included in Since 5 January 2009, W9 is included in Since 5 January 2009, W9 is included in the daily nationwide Mthe daily nationwide Mthe daily nationwide Mthe daily nationwide Méééédiamat diamat diamat diamat
W9 is the only DTT channel whose W9 is the only DTT channel whose W9 is the only DTT channel whose W9 is the only DTT channel whose audience level is measured on a daily audience level is measured on a daily audience level is measured on a daily audience level is measured on a daily basis and positions itself as a leading basis and positions itself as a leading basis and positions itself as a leading basis and positions itself as a leading
offering for advertisersoffering for advertisersoffering for advertisersoffering for advertisers
W9’s 4+ year old audience – prime time (8.45pm-10.30pm)
W9’s 4+ year old audience – all day
x 7.7
x 7.4
26 093
202,209
78 773
583,560
0
100 000
200 000
300 000
400 000
500 000
600 000
January-March
2006
April-June 2006 September-
October 2006
November-
December 2006
January-March
2007
April-June 2007 September-
October 2007
November-
December 2007
January-
February 2008
March-April 2008 May-June 2008 September-
October 2008
November-
December 2008
Television Television Television Television ---- W9 RatingsW9 RatingsW9 RatingsW9 Ratings
24
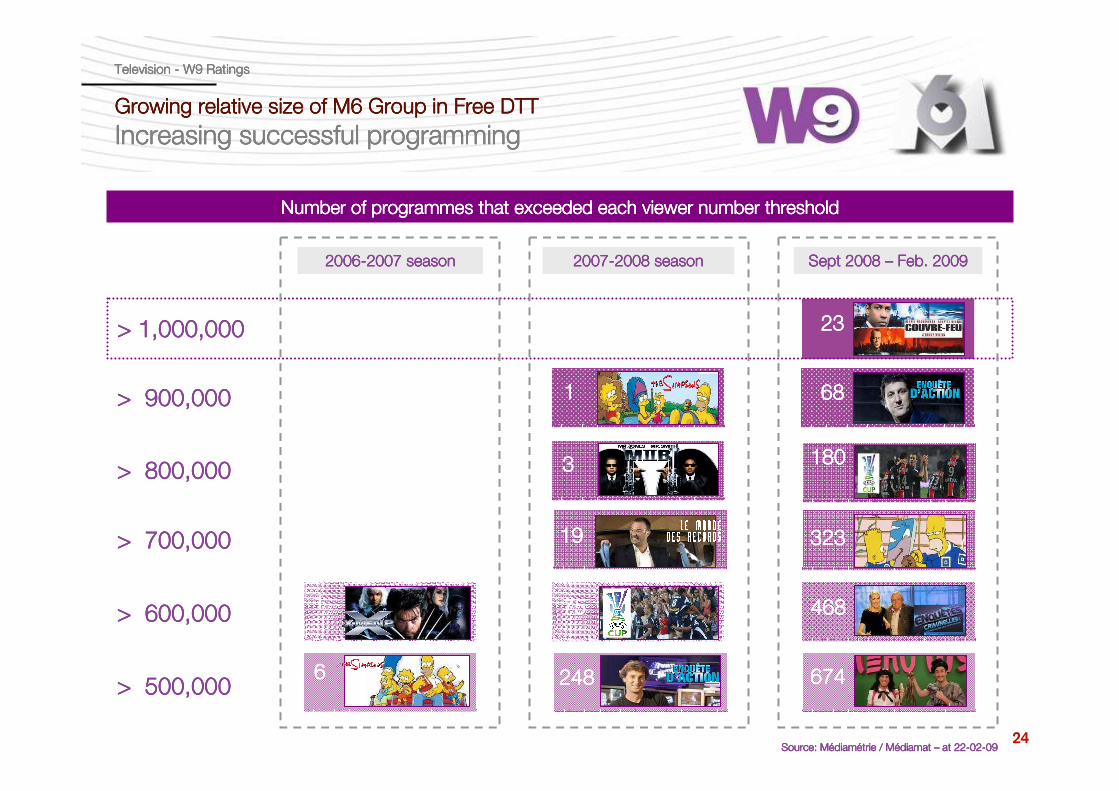
2006200620062006----2007 season2007 season2007 season2007 season 2007200720072007----2008 season2008 season2008 season2008 season Sept 2008 Sept 2008 Sept 2008 Sept 2008 –––– Feb. 2009Feb. 2009Feb. 2009Feb. 2009
> 1,000,000> 1,000,000> 1,000,000> 1,000,000
> 900,000> 900,000> 900,000> 900,000
> 800,000> 800,000> 800,000> 800,000
> 700,000> 700,000> 700,000> 700,000
> 600,000> 600,000> 600,000> 600,000
> 500,000> 500,000> 500,000> 500,000
323323323323
674674674674
1111
6666
3333
19191919
75757575
248248248248
180180180180
68686868
Number of programmes that exceeded each viewer number thresholdNumber of programmes that exceeded each viewer number thresholdNumber of programmes that exceeded each viewer number thresholdNumber of programmes that exceeded each viewer number threshold
1111
23232323
Source: MSource: MSource: MSource: Méééédiamdiamdiamdiaméééétrie / Mtrie / Mtrie / Mtrie / Méééédiamat diamat diamat diamat –––– at 22at 22at 22at 22----02020202----09090909
468468468468
Growing relative size of M6 Group in Free DTT Growing relative size of M6 Group in Free DTT Growing relative size of M6 Group in Free DTT Growing relative size of M6 Group in Free DTT
Increasing successful programming Increasing successful programming Increasing successful programming Increasing successful programming
Television Television Television Television ---- W9 RatingsW9 RatingsW9 RatingsW9 Ratings
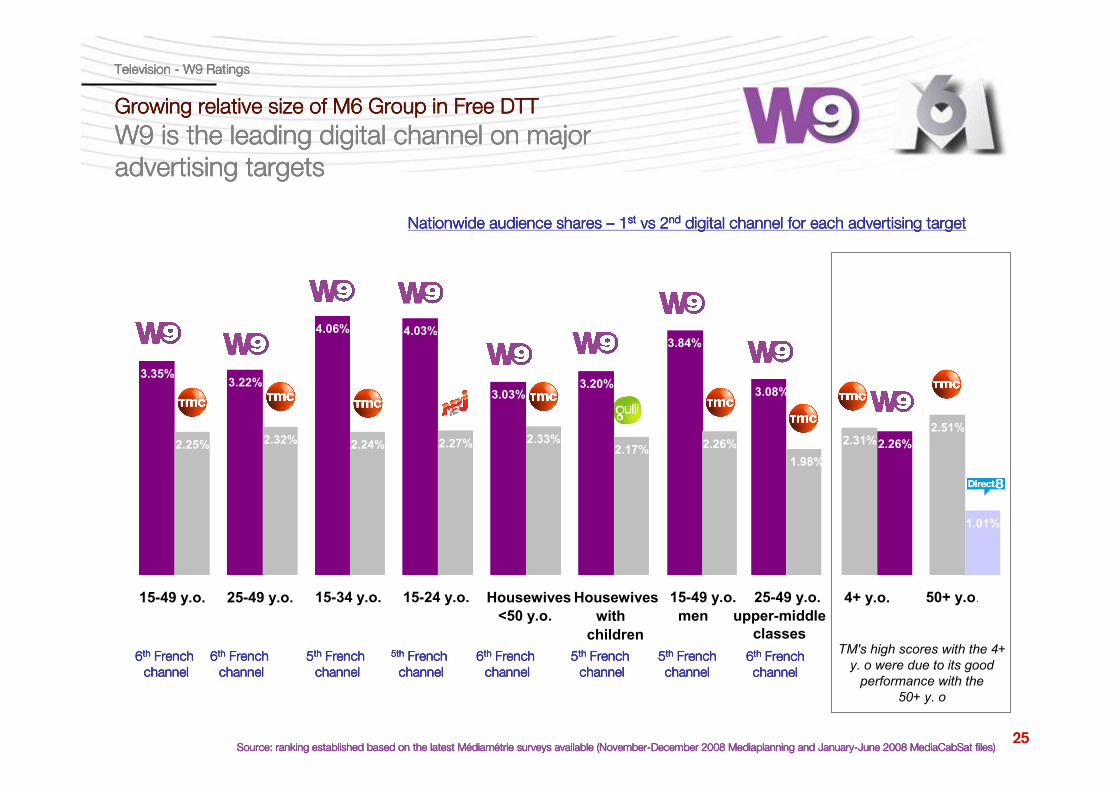
25Source: ranking established based on the latest MSource: ranking established based on the latest MSource: ranking established based on the latest MSource: ranking established based on the latest Méééédiamdiamdiamdiaméééétrie surveys available (Novembertrie surveys available (Novembertrie surveys available (Novembertrie surveys available (November----December 2008 Mediaplanning and JanuaryDecember 2008 Mediaplanning and JanuaryDecember 2008 Mediaplanning and JanuaryDecember 2008 Mediaplanning and January----June 2008 MediaCabSat files)June 2008 MediaCabSat files)June 2008 MediaCabSat files)June 2008 MediaCabSat files)
Nationwide audience shares Nationwide audience shares Nationwide audience shares Nationwide audience shares –––– 1111stststst vs 2vs 2vs 2vs 2ndndndnd digital channel for each advertising targetdigital channel for each advertising targetdigital channel for each advertising targetdigital channel for each advertising target
Growing relative size of M6 Group in Free DTT Growing relative size of M6 Group in Free DTT Growing relative size of M6 Group in Free DTT Growing relative size of M6 Group in Free DTT
W9 is the leading digital channel on major W9 is the leading digital channel on major W9 is the leading digital channel on major W9 is the leading digital channel on major advertising targetsadvertising targetsadvertising targetsadvertising targets
6666thththth French French French French channelchannelchannelchannel
5555thththth French French French French channelchannelchannelchannel
6666thththth French French French French channelchannelchannelchannel
5555thththth French French French French channelchannelchannelchannel
6666thththth French French French French channelchannelchannelchannel
5555thththth French French French French channelchannelchannelchannel
5th5th5th5th French French French French channelchannelchannelchannel
6666thththth French French French French channelchannelchannelchannel
TM's high scores with the 4+
y. o were due to its good
performance with the
50+ y. o
3.35%3.22%
4.06% 4.03%
3.03%3.20%
3.84%
3.08%
2.31%2.51%
2.25% 2.32% 2.24% 2.27% 2.33%2.17% 2.26%
1.98%
2.26%
1.01%
15-49 y.o. 25-49 y.o. 15-34 y.o. 15-24 y.o. Housewives
<50 y.o.
Housewives
with
children
15-49 y.o.
men
25-49 y.o.
upper-middle
classes
4+ y.o. 50+ y.o.
Television Television Television Television ---- W9 RatingsW9 RatingsW9 RatingsW9 Ratings
26
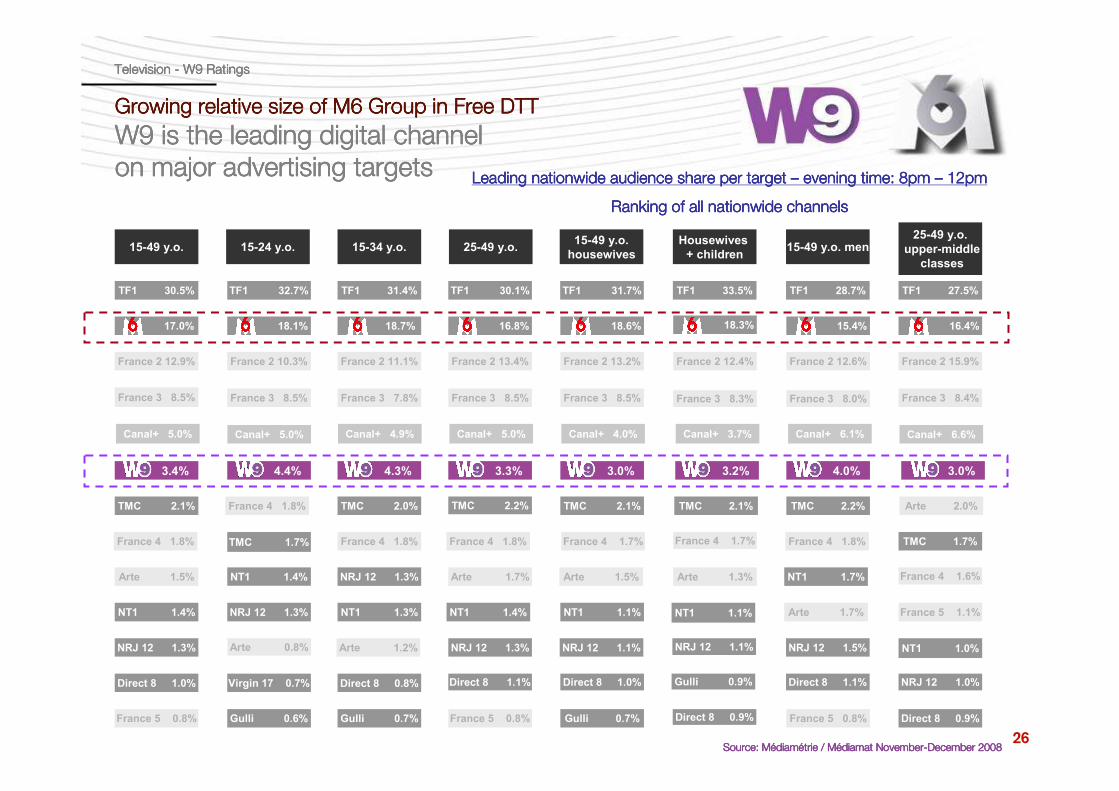
Leading nationwide audience share per target Leading nationwide audience share per target Leading nationwide audience share per target Leading nationwide audience share per target –––– evening time: 8pm evening time: 8pm evening time: 8pm evening time: 8pm –––– 12pm12pm12pm12pm
Ranking of all nationwide channelsRanking of all nationwide channelsRanking of all nationwide channelsRanking of all nationwide channels
15-49 y.o.
France 2 12.9%
France 3 8.5%
TMC 2.1%
Arte 1.5%
France 4 1.8%
NT1 1.4%
NRJ 12 1.3%
Direct 8 1.0%
France 5 0.8%
TF1 30.5%
3.4%
17.0%
Canal+ 5.0%
15-24 y.o.
TF1 32.7%
France 2 10.3%
France 3 8.5%
France 4 1.8%
TMC 1.7%
Arte 0.8%
NRJ 12 1.3%
NT1 1.4%
Virgin 17 0.7%
Gulli 0.6%
18.1%
Canal+ 5.0%
15-34 y.o.
TF1 31.4%
France 2 11.1%
France 3 7.8%
TMC 2.0%
France 4 1.8%
Arte 1.2%
NRJ 12 1.3%
NT1 1.3%
Direct 8 0.8%
Gulli 0.7%
4.3%
18.7%
Canal+ 4.9%
25-49 y.o.
TF1 30.1%
France 2 13.4%
France 3 8.5%
TMC 2.2%
Arte 1.7%
NT1 1.4%
France 4 1.8%
NRJ 12 1.3%
Direct 8 1.1%
France 5 0.8%
3.3%
16.8%
Canal+ 5.0%
15-49 y.o.
housewives
TF1 31.7%
France 2 13.2%
France 3 8.5%
TMC 2.1%
Arte 1.5%
France 4 1.7%
NT1 1.1%
NRJ 12 1.1%
Direct 8 1.0%
Gulli 0.7%
3.0%
18.6%
Canal+ 4.0%
15-49 y.o. men
TF1 28.7%
France 2 12.6%
France 3 8.0%
TMC 2.2%
Arte 1.7%
NT1 1.7%
NRJ 12 1.5%
France 4 1.8%
France 5 0.8%
Direct 8 1.1%
4.0%
15.4%
Canal+ 6.1%
25-49 y.o.
upper-middle
classes
TF1 27.5%
France 2 15.9%
France 3 8.4%
Arte 2.0%
TMC 1.7%
France 4 1.6%
NT1 1.0%
France 5 1.1%
NRJ 12 1.0%
Direct 8 0.9%
3.0%
16.4%
Canal+ 6.6%
18.3%
Housewives
+ children
TF1 33.5%
France 2 12.4%
France 3 8.3%
Arte 1.3%
Gulli 0.9%
NT1 1.1%
NRJ 12 1.1%
Canal+ 3.7%
4.4% 3.2%
France 4 1.7%
Direct 8 0.9%
TMC 2.1%
Source: MSource: MSource: MSource: Méééédiamdiamdiamdiaméééétrie / Mtrie / Mtrie / Mtrie / Méééédiamat Novemberdiamat Novemberdiamat Novemberdiamat November----December 2008 December 2008 December 2008 December 2008
Growing relative size of M6 Group in Free DTT Growing relative size of M6 Group in Free DTT Growing relative size of M6 Group in Free DTT Growing relative size of M6 Group in Free DTT
W9 is the leading digital channel W9 is the leading digital channel W9 is the leading digital channel W9 is the leading digital channel on major advertising targetson major advertising targetson major advertising targetson major advertising targets
Television Television Television Television ---- W9 RatingsW9 RatingsW9 RatingsW9 Ratings

27
AudiencesPay TV audience levelsPay TV audience levelsPay TV audience levelsPay TV audience levels

28
SOIREE SPECIALE COLUCHESOIREE SPECIALE COLUCHESOIREE SPECIALE COLUCHESOIREE SPECIALE COLUCHE
15/10/2008 – 379,000 viewers379,000 viewers379,000 viewers379,000 viewersSource: MSource: MSource: MSource: Méééédiamdiamdiamdiaméééétrie / Mediamat trie / Mediamat trie / Mediamat trie / Mediamat
* Ranking excludes Canal+ spin* Ranking excludes Canal+ spin* Ranking excludes Canal+ spin* Ranking excludes Canal+ spin----off channelsoff channelsoff channelsoff channels
1.0
0.90.9
0.8
Sept.-Dec. 2008 Jan.-Feb. 2009 Sept.-Dec. 2008 Jan.-Feb. 2009
A satisfactory start of 2009, up 0.1 percentage point compared tA satisfactory start of 2009, up 0.1 percentage point compared tA satisfactory start of 2009, up 0.1 percentage point compared tA satisfactory start of 2009, up 0.1 percentage point compared to the first four months of the seasono the first four months of the seasono the first four months of the seasono the first four months of the season
Audience share among subscribers Audience share among subscribers Audience share among subscribers Audience share among subscribers to an extended offeringto an extended offeringto an extended offeringto an extended offeringMonday-Sunday / 3am-3am
4+ y.o.
UMCIs
In 2008,In 2008,In 2008,In 2008,
nearlynearlynearlynearly 80808080 programmesprogrammesprogrammesprogrammes
attracted more than attracted more than attracted more than attracted more than 200,000200,000200,000200,000 viewersviewersviewersviewers
Shows and events still providing guaranteed successShows and events still providing guaranteed successShows and events still providing guaranteed successShows and events still providing guaranteed success
Ranking based on 4+ year old subscribersRanking based on 4+ year old subscribersRanking based on 4+ year old subscribersRanking based on 4+ year old subscribersFrom 31 December 2007 to 28 December 2008
1LAURENT GERRA FLINGUE LA TELELAURENT GERRA FLINGUE LA TELELAURENT GERRA FLINGUE LA TELELAURENT GERRA FLINGUE LA TELE
12/01/2008 – 421,000 viewers421,000 viewers421,000 viewers421,000 viewers
3
2VIVE LA TELE: CLAUDE FRANCOISVIVE LA TELE: CLAUDE FRANCOISVIVE LA TELE: CLAUDE FRANCOISVIVE LA TELE: CLAUDE FRANCOIS
05/03/2008 – 381,000 viewers381,000 viewers381,000 viewers381,000 viewers
The leading pay channel for its target: upper middle class indivThe leading pay channel for its target: upper middle class indivThe leading pay channel for its target: upper middle class indivThe leading pay channel for its target: upper middle class individualsidualsidualsiduals…………
………… and the 2and the 2and the 2and the 2ndndndnd pay channel for the 4+ year olds over the last two months of 20pay channel for the 4+ year olds over the last two months of 20pay channel for the 4+ year olds over the last two months of 20pay channel for the 4+ year olds over the last two months of 2008 * 08 * 08 * 08 *
Paris PremiParis PremiParis PremiParis Premièèèère, the leading pay channel among upper middle re, the leading pay channel among upper middle re, the leading pay channel among upper middle re, the leading pay channel among upper middle class individualsclass individualsclass individualsclass individuals
Television Television Television Television ---- Pay TV audience levelsPay TV audience levelsPay TV audience levelsPay TV audience levels
0.80.80.80.8
0.90.90.90.9 0.90.90.90.9
1.01.01.01.0
29
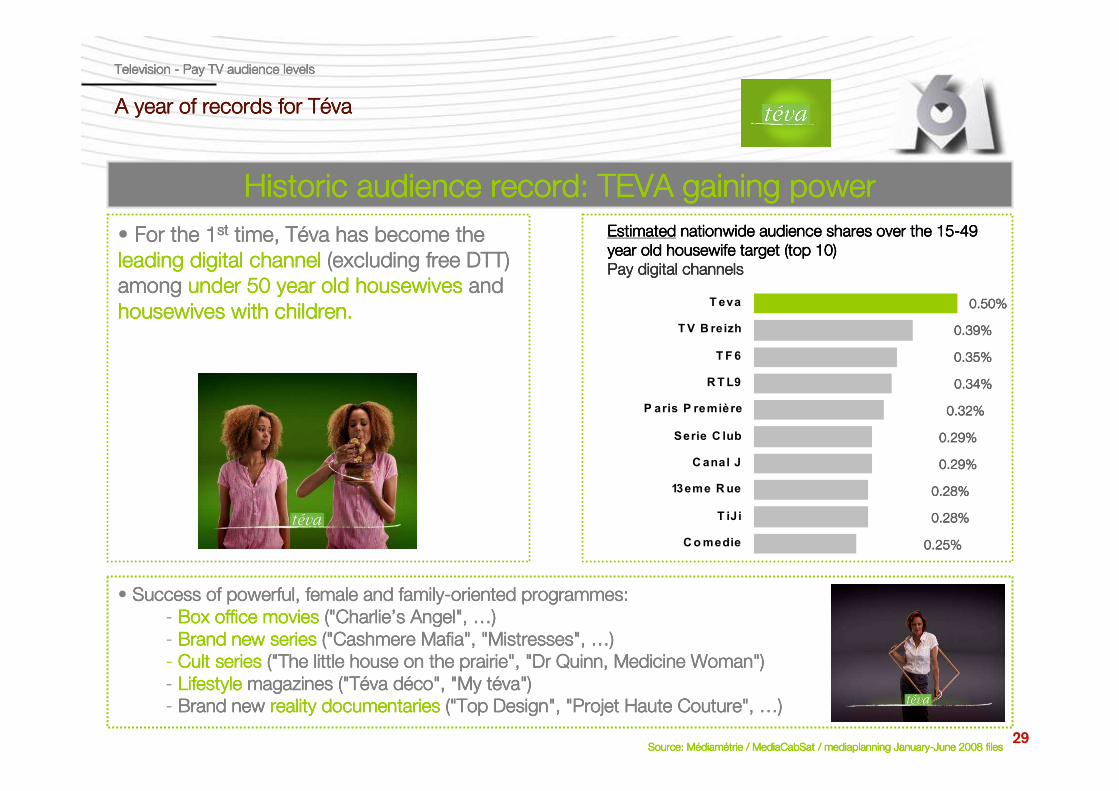
Historic audience record: TEVA gaining powerHistoric audience record: TEVA gaining powerHistoric audience record: TEVA gaining powerHistoric audience record: TEVA gaining power
• For the 1For the 1For the 1For the 1stststst time, Ttime, Ttime, Ttime, Tééééva has become the va has become the va has become the va has become the leading digital channel leading digital channel leading digital channel leading digital channel (excluding free DTT) (excluding free DTT) (excluding free DTT) (excluding free DTT) among among among among under 50 year old housewivesunder 50 year old housewivesunder 50 year old housewivesunder 50 year old housewives and and and and housewives with children.housewives with children.housewives with children.housewives with children.
• Success of powerful, female and familySuccess of powerful, female and familySuccess of powerful, female and familySuccess of powerful, female and family----oriented programmes:oriented programmes:oriented programmes:oriented programmes:- Box office moviesBox office moviesBox office moviesBox office movies ("Charlie("Charlie("Charlie("Charlie’’’’s Angel", s Angel", s Angel", s Angel", …………))))- Brand new seriesBrand new seriesBrand new seriesBrand new series ("Cashmere Mafia", "Mistresses", ("Cashmere Mafia", "Mistresses", ("Cashmere Mafia", "Mistresses", ("Cashmere Mafia", "Mistresses", …………))))- Cult seriesCult seriesCult seriesCult series ("The little house on the prairie", "Dr Quinn, Medicine Woman")("The little house on the prairie", "Dr Quinn, Medicine Woman")("The little house on the prairie", "Dr Quinn, Medicine Woman")("The little house on the prairie", "Dr Quinn, Medicine Woman")- LifestyleLifestyleLifestyleLifestyle magazines ("Tmagazines ("Tmagazines ("Tmagazines ("Tééééva dva dva dva dééééco", "My tco", "My tco", "My tco", "My tééééva")va")va")va")- Brand new Brand new Brand new Brand new reality documentariesreality documentariesreality documentariesreality documentaries ("Top Design", "Projet Haute Couture", ("Top Design", "Projet Haute Couture", ("Top Design", "Projet Haute Couture", ("Top Design", "Projet Haute Couture", …………))))
Comedie
T iJi
13eme Rue
Canal J
Serie C lub
P aris P remière
RTL9
TF6
TV B reizh
T eva
EstimatedEstimatedEstimatedEstimated nationwide audience shares over the 15nationwide audience shares over the 15nationwide audience shares over the 15nationwide audience shares over the 15----49 49 49 49 year old housewife target (top 10) year old housewife target (top 10) year old housewife target (top 10) year old housewife target (top 10) Pay digital channelsPay digital channelsPay digital channelsPay digital channels
Source: MSource: MSource: MSource: Méééédiamdiamdiamdiaméééétrie / MediaCabSat / mediaplanning Januarytrie / MediaCabSat / mediaplanning Januarytrie / MediaCabSat / mediaplanning Januarytrie / MediaCabSat / mediaplanning January----June 2008 filesJune 2008 filesJune 2008 filesJune 2008 files
A year of records for TA year of records for TA year of records for TA year of records for Téééévavavava
Television Television Television Television ---- Pay TV audience levelsPay TV audience levelsPay TV audience levelsPay TV audience levels
0.50%0.50%0.50%0.50%
0.35%0.35%0.35%0.35%
0.34%0.34%0.34%0.34%
0.32%0.32%0.32%0.32%
0.29%0.29%0.29%0.29%
0.29%0.29%0.29%0.29%
0.28%0.28%0.28%0.28%
0.25%0.25%0.25%0.25%
0.39%0.39%0.39%0.39%
0.28%0.28%0.28%0.28%

30
AdvertisingAdvertisingAdvertisingAdvertising
31
93.593.593.593.560.060.060.060.0
1,326.31,326.31,326.31,326.3
92.392.392.392.3124.6124.6124.6124.6
1,296.21,296.21,296.21,296.2
5,507.65,507.65,507.65,507.6
407.2407.2407.2407.2796.7796.7796.7796.7
5,041.95,041.95,041.95,041.9
819.2819.2819.2819.2 762.2762.2762.2762.2
Television Television Television Television ---- AdvertisingAdvertisingAdvertisingAdvertising
DTT Advertising Market DTT Advertising Market DTT Advertising Market DTT Advertising Market
M6 Group Advertising MarketM6 Group Advertising MarketM6 Group Advertising MarketM6 Group Advertising Market
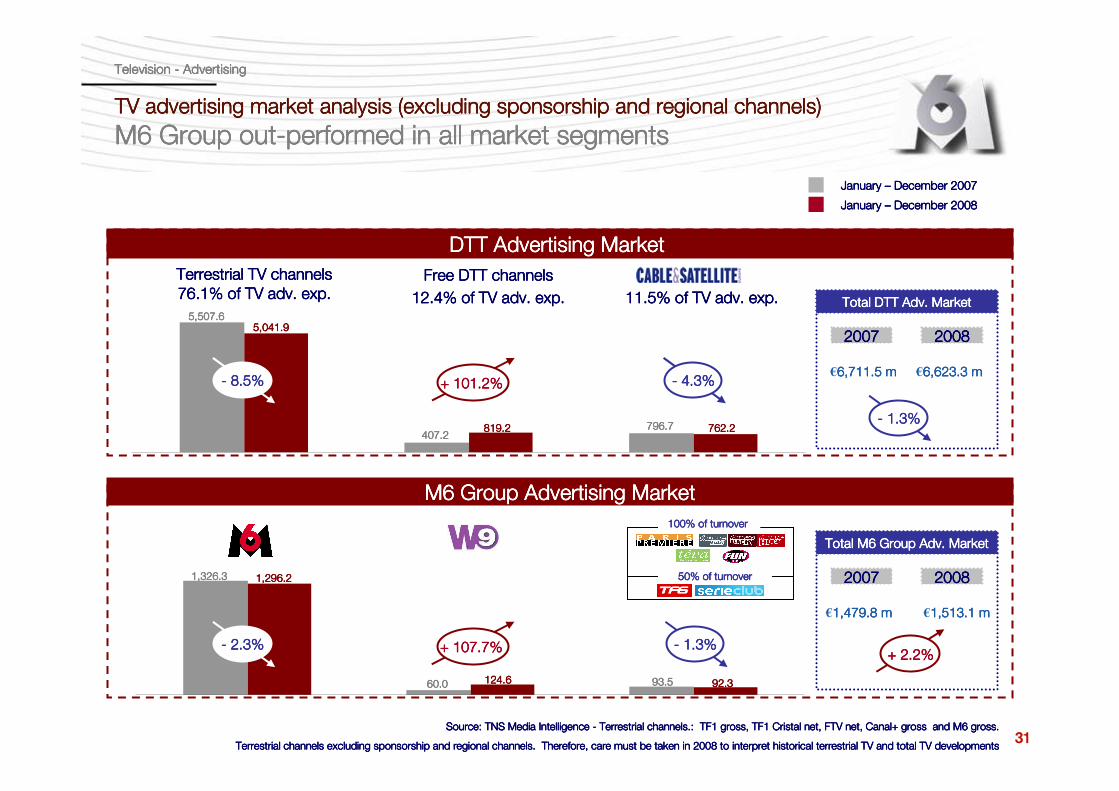
Terrestrial TV channelsTerrestrial TV channelsTerrestrial TV channelsTerrestrial TV channels76.1% of TV adv. exp.76.1% of TV adv. exp.76.1% of TV adv. exp.76.1% of TV adv. exp.
100% of turnover100% of turnover100% of turnover100% of turnover
50% of turnover50% of turnover50% of turnover50% of turnover
---- 8.5%8.5%8.5%8.5% + 101.2% + 101.2% + 101.2% + 101.2% ---- 4.3%4.3%4.3%4.3%
---- 2.3%2.3%2.3%2.3% + 107.7% + 107.7% + 107.7% + 107.7%
Total DTT Adv. MarketTotal DTT Adv. MarketTotal DTT Adv. MarketTotal DTT Adv. Market
2007200720072007 2008200820082008
€6,711.5 m6,711.5 m6,711.5 m6,711.5 m €6,623.3 m6,623.3 m6,623.3 m6,623.3 m
---- 1.3%1.3%1.3%1.3%
Total M6 Group Adv. MarketTotal M6 Group Adv. MarketTotal M6 Group Adv. MarketTotal M6 Group Adv. Market
2007200720072007 2008200820082008
€1,479.8 m1,479.8 m1,479.8 m1,479.8 m €1,513.1 m1,513.1 m1,513.1 m1,513.1 m
+ 2.2%+ 2.2%+ 2.2%+ 2.2%
12.4% of TV adv. exp.12.4% of TV adv. exp.12.4% of TV adv. exp.12.4% of TV adv. exp. 11.5% of TV adv. exp.11.5% of TV adv. exp.11.5% of TV adv. exp.11.5% of TV adv. exp.
TV advertising market analysis (excluding sponsorship and regionTV advertising market analysis (excluding sponsorship and regionTV advertising market analysis (excluding sponsorship and regionTV advertising market analysis (excluding sponsorship and regional channels)al channels)al channels)al channels)
M6 Group outM6 Group outM6 Group outM6 Group out----performed in all market segmentsperformed in all market segmentsperformed in all market segmentsperformed in all market segments
---- 1.3%1.3%1.3%1.3%
Source: TNS Media Intelligence Source: TNS Media Intelligence Source: TNS Media Intelligence Source: TNS Media Intelligence ---- Terrestrial channels.: TF1 gross, TF1 Cristal net, FTV net, CaTerrestrial channels.: TF1 gross, TF1 Cristal net, FTV net, CaTerrestrial channels.: TF1 gross, TF1 Cristal net, FTV net, CaTerrestrial channels.: TF1 gross, TF1 Cristal net, FTV net, Canal+ gross and M6 gross. nal+ gross and M6 gross. nal+ gross and M6 gross. nal+ gross and M6 gross.
Terrestrial channels excluding sponsorship and regional channelsTerrestrial channels excluding sponsorship and regional channelsTerrestrial channels excluding sponsorship and regional channelsTerrestrial channels excluding sponsorship and regional channels.... Therefore, care must be taken in 2008 to interpret historical tTherefore, care must be taken in 2008 to interpret historical tTherefore, care must be taken in 2008 to interpret historical tTherefore, care must be taken in 2008 to interpret historical terrestrial TV and total TV developments errestrial TV and total TV developments errestrial TV and total TV developments errestrial TV and total TV developments
January January January January –––– December 2007December 2007December 2007December 2007
January January January January –––– December 2008December 2008December 2008December 2008
Free DTT channelsFree DTT channelsFree DTT channelsFree DTT channels

32
100% of turnover100% of turnover100% of turnover100% of turnover
50% of turnover50% of turnover50% of turnover50% of turnover
11.7 12.114.7 15.2
24.125.7
TOTAL TV (terrestrial + DTT + CabTOTAL TV (terrestrial + DTT + CabTOTAL TV (terrestrial + DTT + CabTOTAL TV (terrestrial + DTT + Cab----Sat): Sat): Sat): Sat): € 6,623.3 million in 2008 (6,623.3 million in 2008 (6,623.3 million in 2008 (6,623.3 million in 2008 (----1.3% vs 2007)1.3% vs 2007)1.3% vs 2007)1.3% vs 2007)
TV advertising market analysis (excluding sponsorship and regionTV advertising market analysis (excluding sponsorship and regionTV advertising market analysis (excluding sponsorship and regionTV advertising market analysis (excluding sponsorship and regional channels) al channels) al channels) al channels)
M6 Group increased its market share in all segmentsM6 Group increased its market share in all segmentsM6 Group increased its market share in all segmentsM6 Group increased its market share in all segments
DTT CHANNELSDTT CHANNELSDTT CHANNELSDTT CHANNELS€ 819.2 million 819.2 million 819.2 million 819.2 million
+101.2% vs 2007+101.2% vs 2007+101.2% vs 2007+101.2% vs 2007
CAB / SAT CHANNELSCAB / SAT CHANNELSCAB / SAT CHANNELSCAB / SAT CHANNELS€ 762.2 million 762.2 million 762.2 million 762.2 million ----4.3% vs 2007 4.3% vs 2007 4.3% vs 2007 4.3% vs 2007
M6 Group Advertising Market Share of each TV segmentM6 Group Advertising Market Share of each TV segmentM6 Group Advertising Market Share of each TV segmentM6 Group Advertising Market Share of each TV segment
Total M6 Group market shareTotal M6 Group market shareTotal M6 Group market shareTotal M6 Group market share
2007200720072007 2008200820082008
22.0%22.0%22.0%22.0% 22.8%22.8%22.8%22.8%
+ 0.8 pp + 0.8 pp + 0.8 pp + 0.8 pp
Television Television Television Television ---- AdvertisingAdvertisingAdvertisingAdvertising
TERRESTRIAL CHANNELS TERRESTRIAL CHANNELS TERRESTRIAL CHANNELS TERRESTRIAL CHANNELS € 5,041.9 million 5,041.9 million 5,041.9 million 5,041.9 million ----8.5% vs 20078.5% vs 20078.5% vs 20078.5% vs 2007
Source: TNS Media Intelligence Source: TNS Media Intelligence Source: TNS Media Intelligence Source: TNS Media Intelligence ---- Terrestrial channels: TF1 gross, TF1 Cristal net, FTV net, CanTerrestrial channels: TF1 gross, TF1 Cristal net, FTV net, CanTerrestrial channels: TF1 gross, TF1 Cristal net, FTV net, CanTerrestrial channels: TF1 gross, TF1 Cristal net, FTV net, Canal+ gross and M6 gross. al+ gross and M6 gross. al+ gross and M6 gross. al+ gross and M6 gross.
Terrestrial channels excluding sponsorship and regional channelsTerrestrial channels excluding sponsorship and regional channelsTerrestrial channels excluding sponsorship and regional channelsTerrestrial channels excluding sponsorship and regional channels.... Therefore, care must be taken in 2008 to interpret historical teTherefore, care must be taken in 2008 to interpret historical teTherefore, care must be taken in 2008 to interpret historical teTherefore, care must be taken in 2008 to interpret historical terrestrial TV and total TV developmentsrrestrial TV and total TV developmentsrrestrial TV and total TV developmentsrrestrial TV and total TV developments
January January January January –––– December 2007December 2007December 2007December 2007
January January January January –––– December 2008December 2008December 2008December 2008
+ 0.4 pp + 0.4 pp + 0.4 pp + 0.4 pp + 0.5 pp+ 0.5 pp+ 0.5 pp+ 0.5 pp+ 1.6 pp+ 1.6 pp+ 1.6 pp+ 1.6 pp

33
Key figures Key figures Key figures Key figures –––– TelevisionTelevisionTelevisionTelevision
34
Key figures Key figures Key figures Key figures ---- TelevisionTelevisionTelevisionTelevision
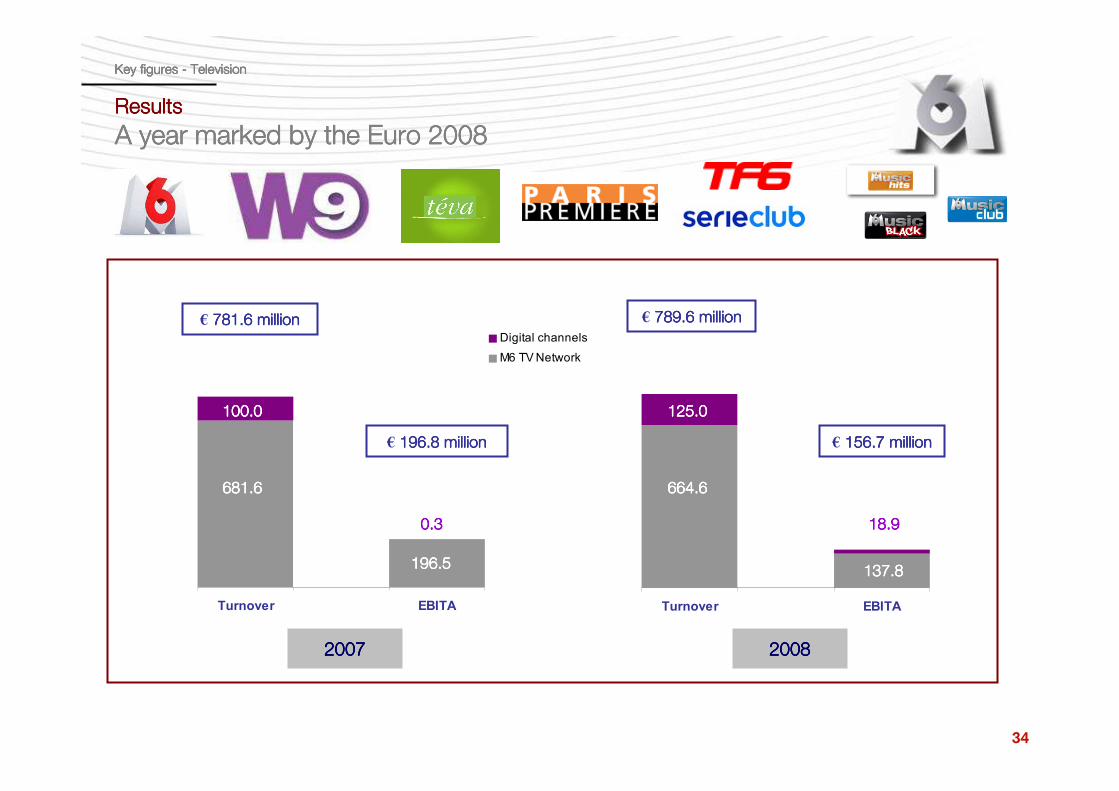
ResultsResultsResultsResults
A year marked by the Euro 2008 A year marked by the Euro 2008 A year marked by the Euro 2008 A year marked by the Euro 2008
Turnover EBITA
Digital channels
M6 TV Network
Turnover EBITA
100.0100.0100.0100.0
681.6681.6681.6681.6
125.0125.0125.0125.0
664.6664.6664.6664.6
196.5196.5196.5196.5 137.8137.8137.8137.8
0.30.30.30.3 18.918.918.918.9
2007200720072007 2008200820082008
€ 781.6 million781.6 million781.6 million781.6 million
€ 196.8 million196.8 million196.8 million196.8 million
€ 789.6 million789.6 million789.6 million789.6 million
€ 156.7 million156.7 million156.7 million156.7 million
35
� Introduction
�Television • Audiences
• Advertising
�Diversification and audiovisual rights
�Outlook
�Financial statements
�Appendices
Presentation of 2008 annual results Presentation of 2008 annual results Presentation of 2008 annual results Presentation of 2008 annual results –––– M6 GroupM6 GroupM6 GroupM6 Group
ContentsContentsContentsContents

36
Diversification and Audiovisual RightsDiversification and Audiovisual RightsDiversification and Audiovisual RightsDiversification and Audiovisual Rights
Key figuresKey figuresKey figuresKey figures
2007200720072007 2008200820082008
42.4% of 42.4% of 42.4% of 42.4% of consolidated consolidated consolidated consolidated
turnoverturnoverturnoverturnover
41.7% of 41.7% of 41.7% of 41.7% of consolidated consolidated consolidated consolidated
turnoverturnoverturnoverturnover
EBITAEBITAEBITAEBITA
€ 45.7 million45.7 million45.7 million45.7 million
EBITAEBITAEBITAEBITA
€ 42.3 million42.3 million42.3 million42.3 million
EBITA as % of EBITA as % of EBITA as % of EBITA as % of turnover: 7.9%turnover: 7.9%turnover: 7.9%turnover: 7.9%
EBITA as % of EBITA as % of EBITA as % of EBITA as % of turnover: 7.5%turnover: 7.5%turnover: 7.5%turnover: 7.5%
€ 574.6 million574.6 million574.6 million574.6 million € 565.1 million565.1 million565.1 million565.1 million
37
Diversifications and Audiovisual RightsDiversifications and Audiovisual RightsDiversifications and Audiovisual RightsDiversifications and Audiovisual Rights
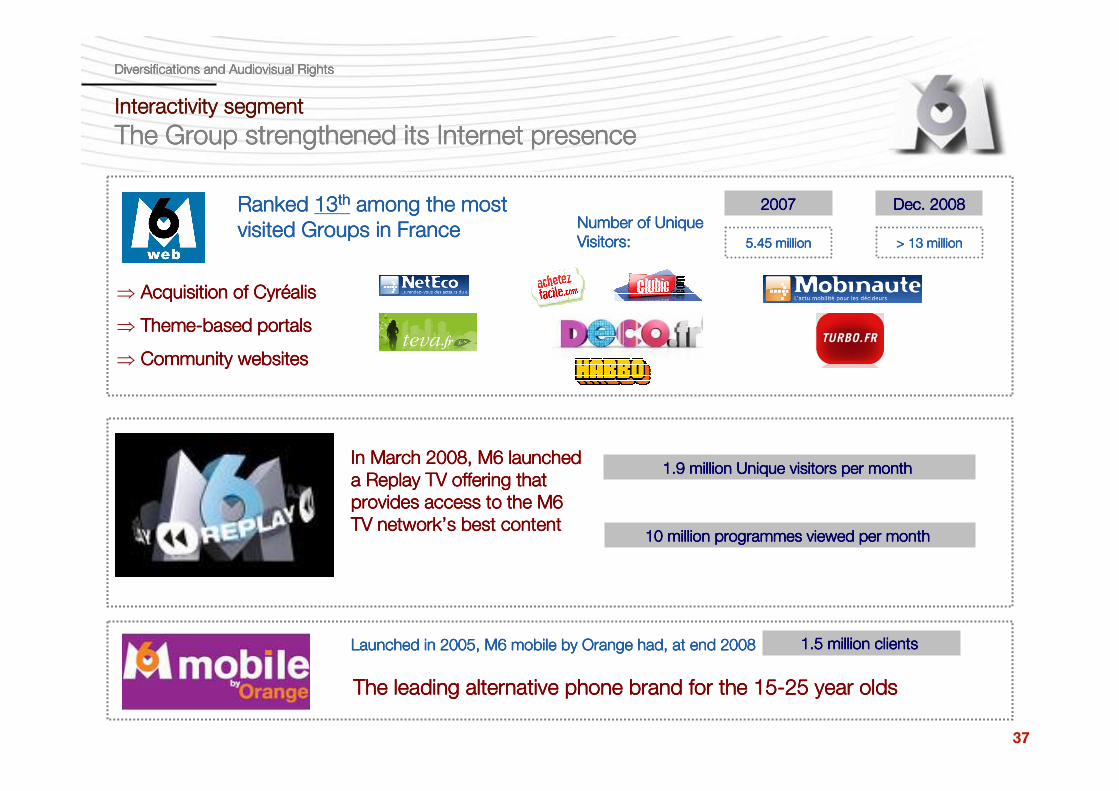
Interactivity segmentInteractivity segmentInteractivity segmentInteractivity segment
The Group strengthened its Internet presenceThe Group strengthened its Internet presenceThe Group strengthened its Internet presenceThe Group strengthened its Internet presence
1.9 million Unique visitors per month 1.9 million Unique visitors per month 1.9 million Unique visitors per month 1.9 million Unique visitors per month
Number of Unique Number of Unique Number of Unique Number of Unique Visitors: Visitors: Visitors: Visitors:
2007200720072007 Dec. 2008Dec. 2008Dec. 2008Dec. 2008
> 13 million> 13 million> 13 million> 13 million
Ranked Ranked Ranked Ranked 13131313thththth among the most among the most among the most among the most visited Groups in Francevisited Groups in Francevisited Groups in Francevisited Groups in France
5.45 million5.45 million5.45 million5.45 million
⇒ Acquisition of CyrAcquisition of CyrAcquisition of CyrAcquisition of Cyrééééalis alis alis alis
⇒ ThemeThemeThemeTheme----based portalsbased portalsbased portalsbased portals
⇒ Community websitesCommunity websitesCommunity websitesCommunity websites
In March 2008, M6 launched In March 2008, M6 launched In March 2008, M6 launched In March 2008, M6 launched a Replay TV offering that a Replay TV offering that a Replay TV offering that a Replay TV offering that provides access to the M6 provides access to the M6 provides access to the M6 provides access to the M6 TV networkTV networkTV networkTV network’’’’s best contents best contents best contents best content
10 million programmes viewed per month 10 million programmes viewed per month 10 million programmes viewed per month 10 million programmes viewed per month
Launched in 2005, M6 mobile by Orange had, at end 2008Launched in 2005, M6 mobile by Orange had, at end 2008Launched in 2005, M6 mobile by Orange had, at end 2008Launched in 2005, M6 mobile by Orange had, at end 2008 1.5 million clients 1.5 million clients 1.5 million clients 1.5 million clients
The leading alternative phone brand for the 15The leading alternative phone brand for the 15The leading alternative phone brand for the 15The leading alternative phone brand for the 15----25 year olds25 year olds25 year olds25 year olds
38
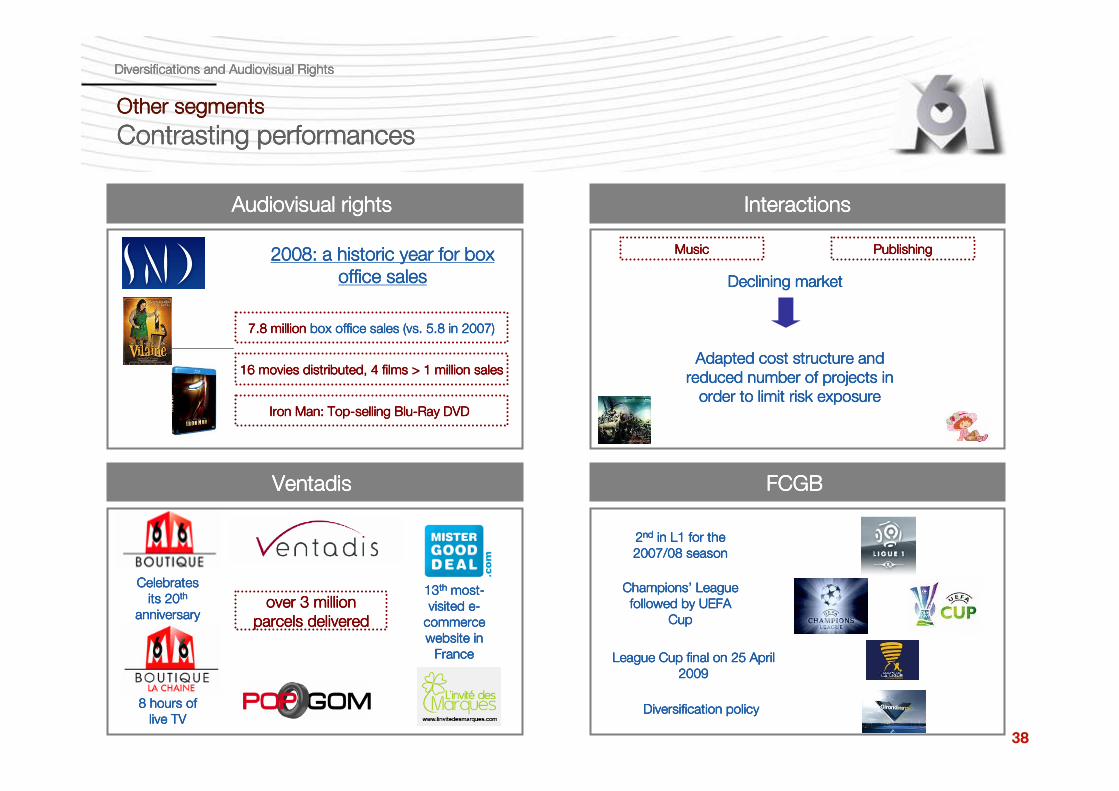
Diversifications and Audiovisual RightsDiversifications and Audiovisual RightsDiversifications and Audiovisual RightsDiversifications and Audiovisual Rights
Audiovisual rights Audiovisual rights Audiovisual rights Audiovisual rights InteractionsInteractionsInteractionsInteractions
FCGB FCGB FCGB FCGB Ventadis Ventadis Ventadis Ventadis
2008: a historic year for box 2008: a historic year for box 2008: a historic year for box 2008: a historic year for box office salesoffice salesoffice salesoffice sales
7.8 million7.8 million7.8 million7.8 million box office sales (vs. 5.8 in 2007)box office sales (vs. 5.8 in 2007)box office sales (vs. 5.8 in 2007)box office sales (vs. 5.8 in 2007)
16 movies distributed, 4 films > 1 million sales16 movies distributed, 4 films > 1 million sales16 movies distributed, 4 films > 1 million sales16 movies distributed, 4 films > 1 million sales
Iron Man: TopIron Man: TopIron Man: TopIron Man: Top----selling Bluselling Bluselling Bluselling Blu----Ray DVD Ray DVD Ray DVD Ray DVD
over 3 million over 3 million over 3 million over 3 million parcels deliveredparcels deliveredparcels deliveredparcels delivered
Celebrates Celebrates Celebrates Celebrates its 20its 20its 20its 20thththth
anniversaryanniversaryanniversaryanniversary
13131313thththth mostmostmostmost----visited evisited evisited evisited e----
commerce commerce commerce commerce website in website in website in website in FranceFranceFranceFrance
8 hours of 8 hours of 8 hours of 8 hours of live TVlive TVlive TVlive TV
MusicMusicMusicMusic PublishingPublishingPublishingPublishing
2222ndndndnd in L1 for the in L1 for the in L1 for the in L1 for the 2007/08 season2007/08 season2007/08 season2007/08 season
ChampionsChampionsChampionsChampions’’’’ League League League League followed by UEFA followed by UEFA followed by UEFA followed by UEFA
CupCupCupCup
League Cup final on 25 April League Cup final on 25 April League Cup final on 25 April League Cup final on 25 April 2009200920092009
Declining marketDeclining marketDeclining marketDeclining market
Adapted cost structure and Adapted cost structure and Adapted cost structure and Adapted cost structure and reduced number of projects in reduced number of projects in reduced number of projects in reduced number of projects in
order to limit risk exposureorder to limit risk exposureorder to limit risk exposureorder to limit risk exposure
Other segments Other segments Other segments Other segments
Contrasting performancesContrasting performancesContrasting performancesContrasting performances
Diversification policyDiversification policyDiversification policyDiversification policy
39
� Introduction
�Television • Audiences
• Advertising
�Diversification and audiovisual rights
�Outlook
�Financial statements
�Appendices
Presentation of 2008 annual results Presentation of 2008 annual results Presentation of 2008 annual results Presentation of 2008 annual results –––– M6 GroupM6 GroupM6 GroupM6 Group
ContentsContentsContentsContents
40
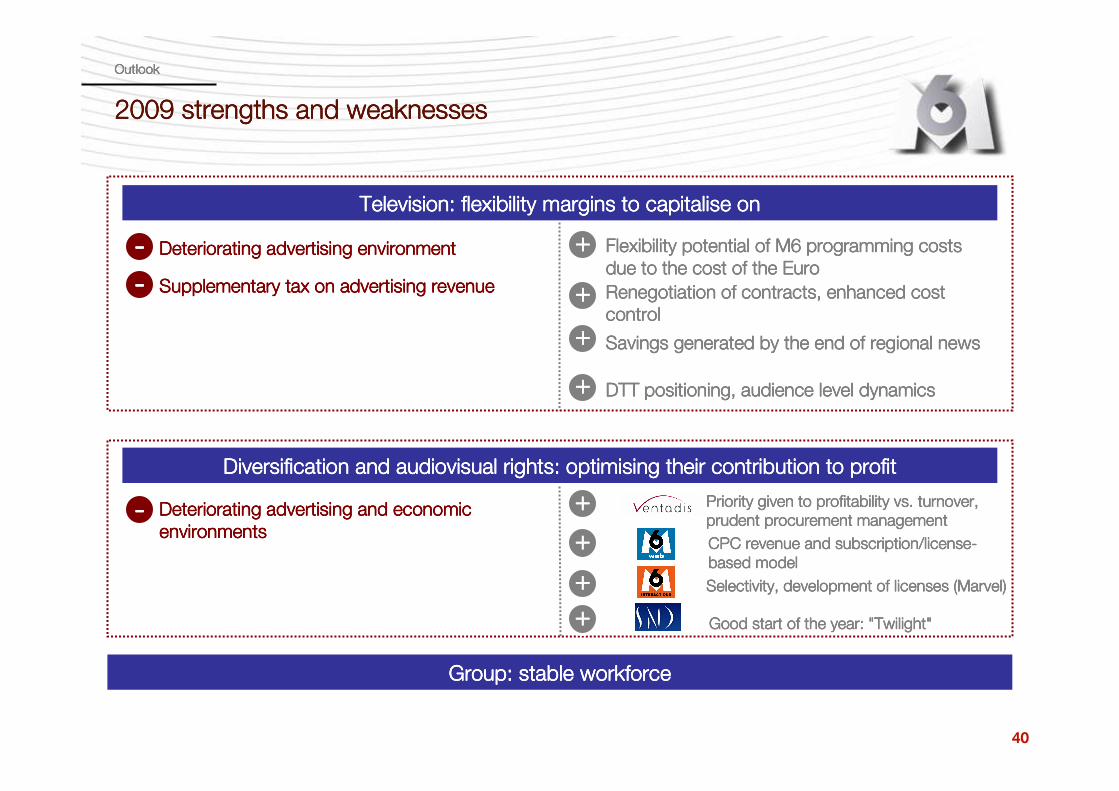
OutlookOutlookOutlookOutlook
2009 strengths and weaknesses2009 strengths and weaknesses2009 strengths and weaknesses2009 strengths and weaknesses
Television: flexibility margins to capitalise onTelevision: flexibility margins to capitalise onTelevision: flexibility margins to capitalise onTelevision: flexibility margins to capitalise on
Deteriorating advertising environmentDeteriorating advertising environmentDeteriorating advertising environmentDeteriorating advertising environment Flexibility potential of M6 programming costs Flexibility potential of M6 programming costs Flexibility potential of M6 programming costs Flexibility potential of M6 programming costs due to the cost of the Eurodue to the cost of the Eurodue to the cost of the Eurodue to the cost of the Euro
---- ++++
Renegotiation of contracts, enhanced cost Renegotiation of contracts, enhanced cost Renegotiation of contracts, enhanced cost Renegotiation of contracts, enhanced cost controlcontrolcontrolcontrol
++++
Savings generated by the end of regional newsSavings generated by the end of regional newsSavings generated by the end of regional newsSavings generated by the end of regional news++++
DTT positioning, audience level dynamicsDTT positioning, audience level dynamicsDTT positioning, audience level dynamicsDTT positioning, audience level dynamics++++
Diversification and audiovisual rights: optimising their contribDiversification and audiovisual rights: optimising their contribDiversification and audiovisual rights: optimising their contribDiversification and audiovisual rights: optimising their contribution to profitution to profitution to profitution to profit
Supplementary tax on advertising revenueSupplementary tax on advertising revenueSupplementary tax on advertising revenueSupplementary tax on advertising revenue----
Group: stable workforceGroup: stable workforceGroup: stable workforceGroup: stable workforce
Deteriorating advertising and economic Deteriorating advertising and economic Deteriorating advertising and economic Deteriorating advertising and economic environmentsenvironmentsenvironmentsenvironments
---- Priority given to profitability vs. turnover, Priority given to profitability vs. turnover, Priority given to profitability vs. turnover, Priority given to profitability vs. turnover, prudent procurement managementprudent procurement managementprudent procurement managementprudent procurement management
CPC revenue and subscription/licenseCPC revenue and subscription/licenseCPC revenue and subscription/licenseCPC revenue and subscription/license----based modelbased modelbased modelbased model
Good start of the year: "Twilight"Good start of the year: "Twilight"Good start of the year: "Twilight"Good start of the year: "Twilight"
Selectivity, development of licenses (Marvel)Selectivity, development of licenses (Marvel)Selectivity, development of licenses (Marvel)Selectivity, development of licenses (Marvel)
++++
++++
++++
++++

41
27.8
18.3
13.4
3.5
10.7
4.3
22.0
26.5
16.6
12.2
3.3
10.9
3.8
26.6janv-fév 08 janv-fév 09
----1.7 pp1.7 pp1.7 pp1.7 pp
+0.2 pp +0.2 pp +0.2 pp +0.2 pp
----1.3 pp1.3 pp1.3 pp1.3 pp
----1.2 pp 1.2 pp 1.2 pp 1.2 pp
Source: MSource: MSource: MSource: Méééédiamdiamdiamdiaméééétrietrietrietrie
----0.2 pp 0.2 pp 0.2 pp 0.2 pp ----0.5 pp 0.5 pp 0.5 pp 0.5 pp +4.6 +4.6 +4.6 +4.6 ppsppsppspps
Audiences Audiences Audiences Audiences JanuaryJanuaryJanuaryJanuary –––– FebruaryFebruaryFebruaryFebruary 2009200920092009
M6, M6, M6, M6, onlyonlyonlyonly historicalhistoricalhistoricalhistorical channelchannelchannelchannel to to to to improveimproveimproveimprove itsitsitsits audience audience audience audience shareshareshareshare
CumulatedCumulatedCumulatedCumulated Audience Audience Audience Audience shareshareshareshare / / / / 4+ year old individuals4+ year old individuals4+ year old individuals4+ year old individuals
OutlookOutlookOutlookOutlook
January January January January –––– February 2008February 2008February 2008February 2008
January January January January –––– February 2009February 2009February 2009February 2009
OthersOthersOthersOthersTVTVTVTV

42
� Introduction
�Television • Audiences
• Advertising
�Diversification and audiovisual rights
�Outlook
�Financial statements
�Appendices
Presentation of 2008 annual results Presentation of 2008 annual results Presentation of 2008 annual results Presentation of 2008 annual results –––– M6 GroupM6 GroupM6 GroupM6 Group
ContentsContentsContentsContents
43
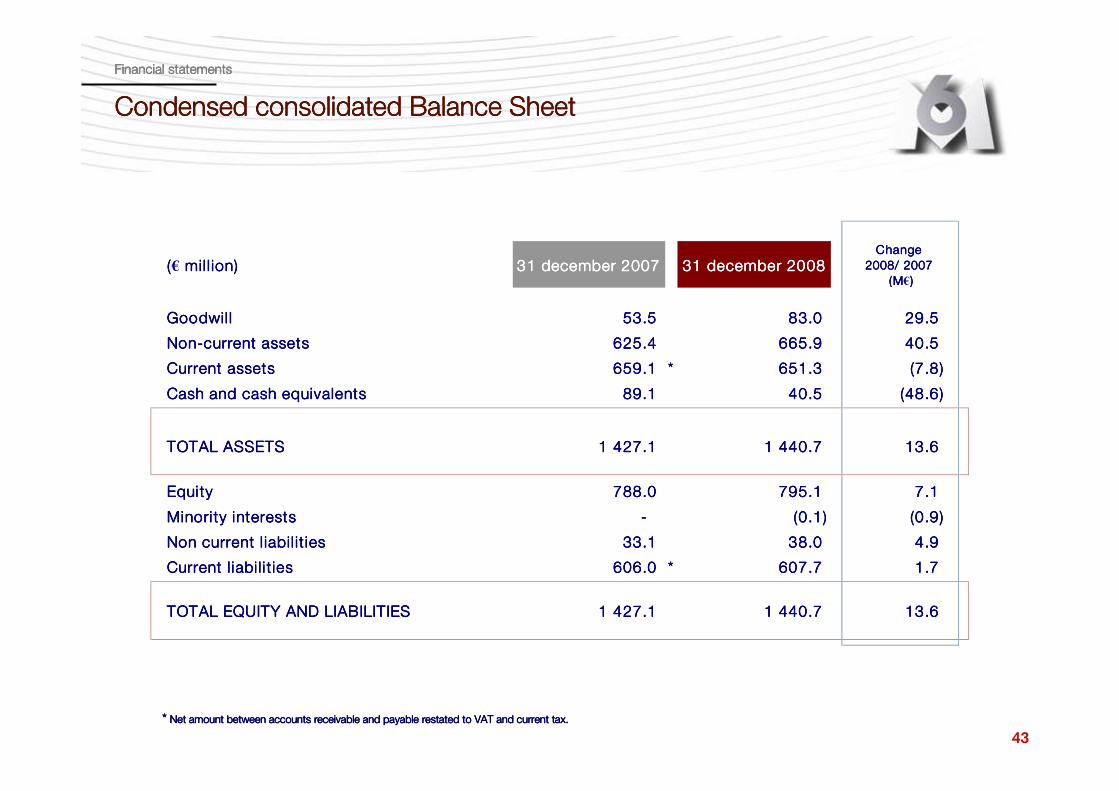
CondensedCondensedCondensedCondensed consolidatedconsolidatedconsolidatedconsolidated Balance Balance Balance Balance SheetSheetSheetSheet
FinancialFinancialFinancialFinancial statementsstatementsstatementsstatements
**** Net amount between accounts receivable and payable restated to VNet amount between accounts receivable and payable restated to VNet amount between accounts receivable and payable restated to VNet amount between accounts receivable and payable restated to VAT and current taxAT and current taxAT and current taxAT and current tax. . . .
((((€ mil l ion) mil l ion) mil l ion) mil l ion) 31 december 200731 december 200731 december 200731 december 2007 31 december 200831 december 200831 december 200831 december 2008Change Change Change Change
2008/ 20072008/ 20072008/ 20072008/ 2007
(M (M (M (M€))))
Goodwil lGoodwil lGoodwil lGoodwil l 53.553.553.553.5 83.083.083.083.0 29.529.529.529.5
Non-current assetsNon-current assetsNon-current assetsNon-current assets 625.4625.4625.4625.4 665.9665.9665.9665.9 40.540.540.540.5
Current assetsCurrent assetsCurrent assetsCurrent assets 659.1659.1659.1659.1 **** 651.3651.3651.3651.3 (7.8)(7.8)(7.8)(7.8)
Cash and cash equivalentsCash and cash equivalentsCash and cash equivalentsCash and cash equivalents 89.189.189.189.1 40.540.540.540.5 (48.6)(48.6)(48.6)(48.6)
TOTAL ASSETSTOTAL ASSETSTOTAL ASSETSTOTAL ASSETS 1 427.11 427.11 427.11 427.1 1 440.71 440.71 440.71 440.7 13.613.613.613.6
EquityEquityEquityEquity 788.0788.0788.0788.0 795.1795.1795.1795.1 7.17.17.17.1
Minority interestsMinority interestsMinority interestsMinority interests ---- (0.1)(0.1)(0.1)(0.1) (0.9)(0.9)(0.9)(0.9)
Non current l iabil it iesNon current l iabil it iesNon current l iabil it iesNon current l iabil it ies 33.133.133.133.1 38.038.038.038.0 4.94.94.94.9
Current l iabi l i t iesCurrent l iabi l i t iesCurrent l iabi l i t iesCurrent l iabi l i t ies 606.0606.0606.0606.0 **** 607.7607.7607.7607.7 1.71.71.71.7
TOTAL EQUITY AND LIABILITIESTOTAL EQUITY AND LIABILITIESTOTAL EQUITY AND LIABILITIESTOTAL EQUITY AND LIABILITIES 1 427.11 427.11 427.11 427.1 1 440.71 440.71 440.71 440.7 13.613.613.613.6

44
CondensedCondensedCondensedCondensed consolidatedconsolidatedconsolidatedconsolidated IncomeIncomeIncomeIncome StatementStatementStatementStatement
FinancialFinancialFinancialFinancial statementsstatementsstatementsstatements
(M(M(M(M€)))) (%)(%)(%)(%)
Turnover from continuing operationsTurnover from continuing operationsTurnover from continuing operationsTurnover from continuing operations 1 356.41 356.41 356.41 356.4 1 354.91 354.91 354.91 354.9 (1.5)(1.5)(1.5)(1.5) -0.1%-0.1%-0.1%-0.1%
EBITA from continuing operationsEBITA from continuing operationsEBITA from continuing operationsEBITA from continuing operations 236.1236.1236.1236.1 194.0194.0194.0194.0 (42.0)(42.0)(42.0)(42.0) -17.8%-17.8%-17.8%-17.8%
Brand amortisation charges & Impairment of non-amortisable
assets
(1.8) (11.6) (9.8)
Capital gains on the disposal of non-current assets 0.1 1.8 1.7
Operating profit (EBIT) from continuing operationsOperating profit (EBIT) from continuing operationsOperating profit (EBIT) from continuing operationsOperating profit (EBIT) from continuing operations 234.3234.3234.3234.3 184.2184.2184.2184.2 (50.1)(50.1)(50.1)(50.1) -21.4%-21.4%-21.4%-21.4%
Net financial income/ (expenses) 4.0 (0.1) (4.1)
Fair value movement of the Canal+ France asset 18.9 20.0 1.1
Share of associates' net profit (0.7) (9.9) (9.2)
Profit before tax from continuing operationsProfit before tax from continuing operationsProfit before tax from continuing operationsProfit before tax from continuing operations 256.6256.6256.6256.6 194.3194.3194.3194.3 (62.3)(62.3)(62.3)(62.3) -24.3%-24.3%-24.3%-24.3%
Income tax on continuing operations (87.9) (55.9) 32.1
Net profit from continuing operationsNet profit from continuing operationsNet profit from continuing operationsNet profit from continuing operations 168.6168.6168.6168.6 138.4138.4138.4138.4 (30.2)(30.2)(30.2)(30.2) -17.9%-17.9%-17.9%-17.9%
Net profit ( loss) from discontinued operationsNet profit ( loss) from discontinued operationsNet profit ( loss) from discontinued operationsNet profit ( loss) from discontinued operations ---- ---- ----
Net profitNet profitNet profitNet profit 168.6168.6168.6168.6 138.4138.4138.4138.4 (30.2)(30.2)(30.2)(30.2) -17.9%-17.9%-17.9%-17.9%
Minority interests 0.1 0.0 (0.1)
Net profit - Group shareNet profit - Group shareNet profit - Group shareNet profit - Group share 168.7168.7168.7168.7 138.4138.4138.4138.4 (30.3)(30.3)(30.3)(30.3) -17.9%-17.9%-17.9%-17.9%
((((€ mil l ion) mil l ion) mil l ion) mil l ion)Change 2008 / 2007Change 2008 / 2007Change 2008 / 2007Change 2008 / 2007
31 december 200731 december 200731 december 200731 december 2007 31 december 200831 december 200831 december 200831 december 2008
45
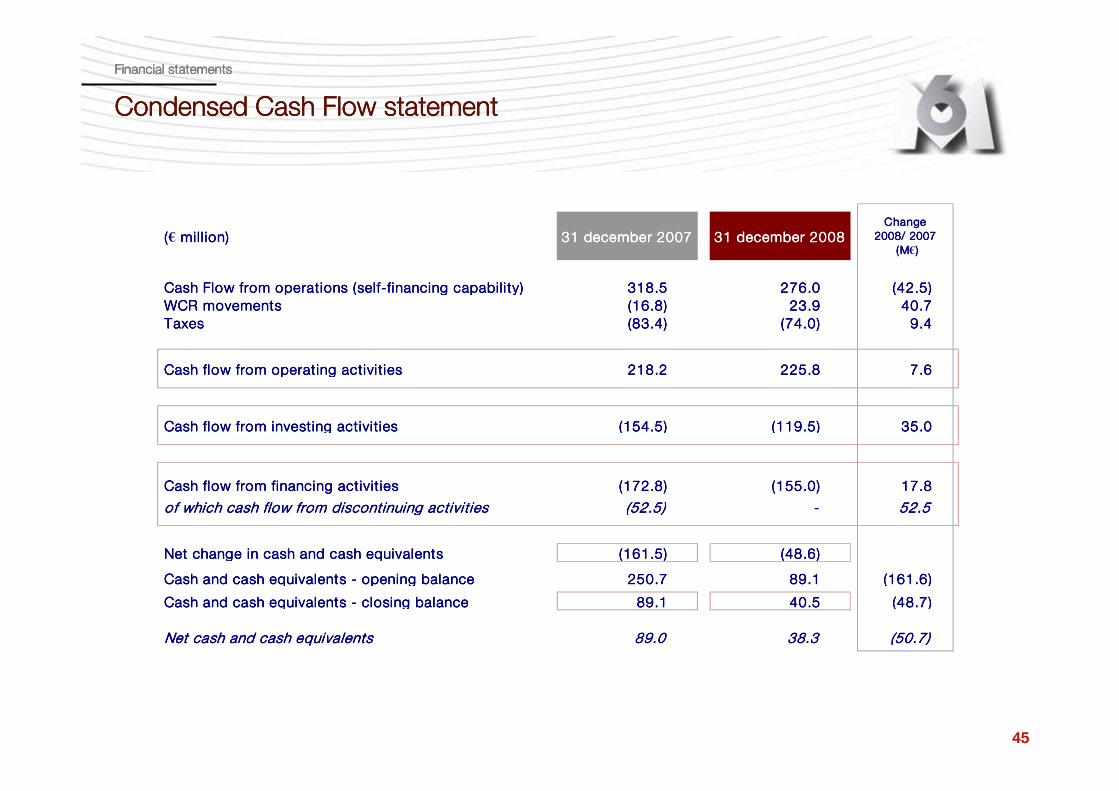
CondensedCondensedCondensedCondensed Cash Cash Cash Cash FlowFlowFlowFlow statementstatementstatementstatement
FinancialFinancialFinancialFinancial statementsstatementsstatementsstatements
((((€ mil l ion) mil l ion) mil l ion) mil l ion) 31 december 200731 december 200731 december 200731 december 2007 31 december 200831 december 200831 december 200831 december 2008Change Change Change Change
2008/ 20072008/ 20072008/ 20072008/ 2007
(M (M (M (M€))))
Cash Flow from operations (self-financing capabil i ty)Cash Flow from operations (self-financing capabil i ty)Cash Flow from operations (self-financing capabil i ty)Cash Flow from operations (self-financing capabil i ty) 318.5 318.5 318.5 318.5 276.0 276.0 276.0 276.0 (42.5) (42.5) (42.5) (42.5)
WCR movementsWCR movementsWCR movementsWCR movements (16.8) (16.8) (16.8) (16.8) 23.9 23.9 23.9 23.9 40.7 40.7 40.7 40.7
TaxesTaxesTaxesTaxes (83.4) (83.4) (83.4) (83.4) (74.0) (74.0) (74.0) (74.0) 9.4 9.4 9.4 9.4
Cash flow from operating activitiesCash flow from operating activitiesCash flow from operating activitiesCash flow from operating activities 218.2 218.2 218.2 218.2 225.8 225.8 225.8 225.8 7.6 7.6 7.6 7.6
Cash flow from investing activitiesCash flow from investing activitiesCash flow from investing activitiesCash flow from investing activities (154.5) (154.5) (154.5) (154.5) (119.5) (119.5) (119.5) (119.5) 35.0 35.0 35.0 35.0
Cash flow from financing activit iesCash flow from financing activit iesCash flow from financing activit iesCash flow from financing activit ies (172.8) (172.8) (172.8) (172.8) (155.0) (155.0) (155.0) (155.0) 17.8 17.8 17.8 17.8
of which cash flow from discontinuing activitiesof which cash flow from discontinuing activitiesof which cash flow from discontinuing activitiesof which cash flow from discontinuing activities (52.5) (52.5) (52.5) (52.5) - - - - 52.5 52.5 52.5 52.5
Net change in cash and cash equivalentsNet change in cash and cash equivalentsNet change in cash and cash equivalentsNet change in cash and cash equivalents (161.5) (161.5) (161.5) (161.5) (48.6) (48.6) (48.6) (48.6)
Cash and cash equivalents - opening balanceCash and cash equivalents - opening balanceCash and cash equivalents - opening balanceCash and cash equivalents - opening balance 250.7 250.7 250.7 250.7 89.1 89.1 89.1 89.1 (161.6) (161.6) (161.6) (161.6)
Cash and cash equivalents - closing balanceCash and cash equivalents - closing balanceCash and cash equivalents - closing balanceCash and cash equivalents - closing balance 89.1 89.1 89.1 89.1 40.5 40.5 40.5 40.5 (48.7) (48.7) (48.7) (48.7)
Net cash and cash equivalentsNet cash and cash equivalentsNet cash and cash equivalentsNet cash and cash equivalents 89.0 89.0 89.0 89.0 38.3 38.3 38.3 38.3 (50.7) (50.7) (50.7) (50.7)

46
� Introduction
�Television • Audiences
• Advertising
�Diversification and audiovisual rights
�Outlook
�Financial statements
�Appendices
Presentation of 2008 annual results Presentation of 2008 annual results Presentation of 2008 annual results Presentation of 2008 annual results –––– M6 GroupM6 GroupM6 GroupM6 Group
ContentsContentsContentsContents
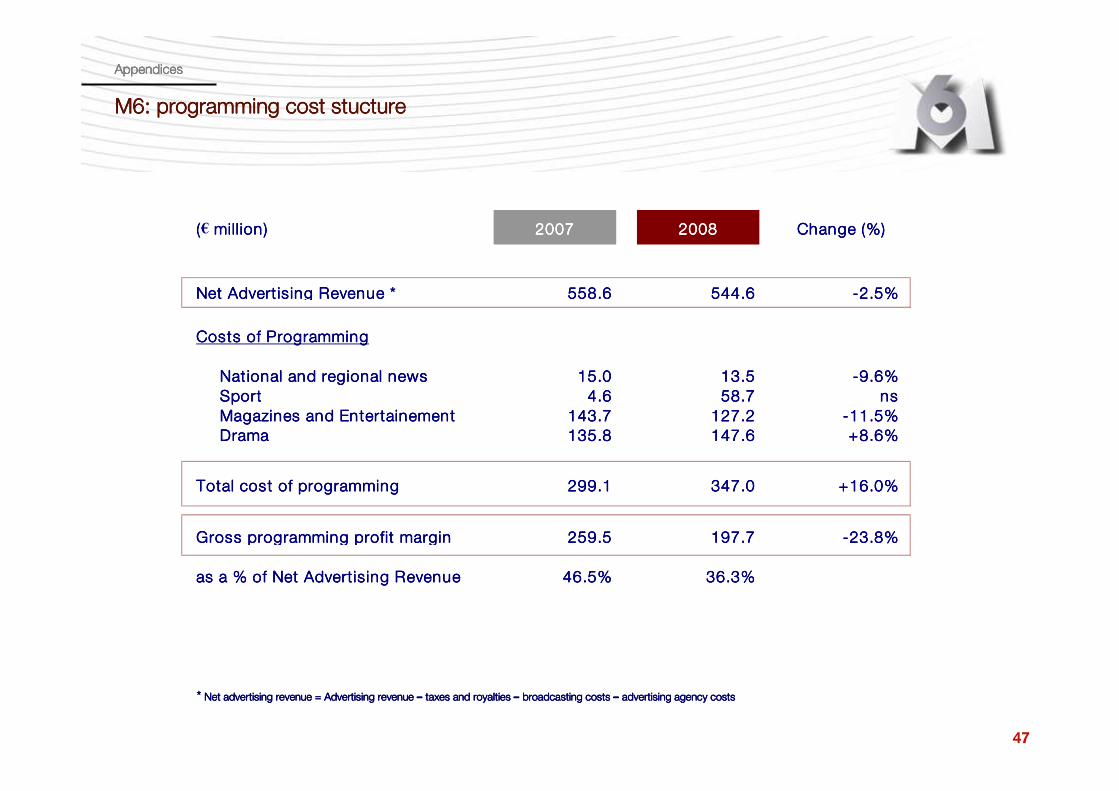
47
**** Net Net Net Net advertisingadvertisingadvertisingadvertising revenue = revenue = revenue = revenue = AdvertisingAdvertisingAdvertisingAdvertising revenue revenue revenue revenue –––– taxes taxes taxes taxes andandandand royalties royalties royalties royalties –––– broadcastingbroadcastingbroadcastingbroadcasting costscostscostscosts –––– advertisingadvertisingadvertisingadvertising agencyagencyagencyagency costscostscostscosts
M6: M6: M6: M6: programmingprogrammingprogrammingprogramming costcostcostcost stucturestucturestucturestucture
AppendicesAppendicesAppendicesAppendices
((((€ mill ion) mill ion) mill ion) mill ion) 2007200720072007 2008200820082008 Change (%)Change (%)Change (%)Change (%)
Net Advert is ing Revenue *Net Advert is ing Revenue *Net Advert is ing Revenue *Net Advert is ing Revenue * 558.6558.6558.6558.6 544.6544.6544.6544.6 -2.5%-2.5%-2.5%-2.5%
Costs of ProgrammingCosts of ProgrammingCosts of ProgrammingCosts of Programming
National and regional newsNational and regional newsNational and regional newsNational and regional news 15.015.015.015.0 13.513.513.513.5 -9.6%-9.6%-9.6%-9.6%SportSportSportSport 4.64.64.64.6 58.758.758.758.7 nsnsnsnsMagazines and EntertainementMagazines and EntertainementMagazines and EntertainementMagazines and Entertainement 143.7143.7143.7143.7 127.2127.2127.2127.2 -11.5%-11.5%-11.5%-11.5%DramaDramaDramaDrama 135.8135.8135.8135.8 147.6147.6147.6147.6 +8.6%+8.6%+8.6%+8.6%
Total cost of programmingTotal cost of programmingTotal cost of programmingTotal cost of programming 299.1299.1299.1299.1 347.0347.0347.0347.0 +16.0%+16.0%+16.0%+16.0%
Gross programming profit marginGross programming profit marginGross programming profit marginGross programming profit margin 259.5259.5259.5259.5 197.7197.7197.7197.7 -23.8%-23.8%-23.8%-23.8%
as a % of Net Advertis ing Revenueas a % of Net Advertis ing Revenueas a % of Net Advertis ing Revenueas a % of Net Advertis ing Revenue 46.5%46.5%46.5%46.5% 36.3%36.3%36.3%36.3%

48
AnalyticalAnalyticalAnalyticalAnalytical M6 TV network contributionM6 TV network contributionM6 TV network contributionM6 TV network contribution
Appendices
((((€M)M)M)M) (%)(%)(%)(%)
Turnover - external advertising revenues 658.0 675.9 (17.9) -2.6%
Turnover - intra-Group advertising revenues 10.5 12.2 (1.7) -13.7%
Total advertising agency + royalties + broadcasting costs (123.9) (129.5) 5.6 -4.3%
Net broadcasting revenueNet broadcasting revenueNet broadcasting revenueNet broadcasting revenue 544.6544.6544.6544.6 558.6558.6558.6558.6 (14.0)(14.0)(14.0)(14.0) -2.5%-2.5%-2.5%-2.5%
Programming costsProgramming costsProgramming costsProgramming costs (347.0)(347.0)(347.0)(347.0) (299.1)(299.1)(299.1)(299.1) (47.9)(47.9)(47.9)(47.9) 16.0%16.0%16.0%16.0%
Gross profit on programmingGross profit on programmingGross profit on programmingGross profit on programming 197.7197.7197.7197.7 259.5259.5259.5259.5 (61.9)(61.9)(61.9)(61.9) -23.8%-23.8%-23.8%-23.8%
(%)(%)(%)(%) 36.3%36.3%36.3%36.3% 46.5%46.5%46.5%46.5%
Net other operating revenue / (expenses) (68.0) (69.7) 1.8 -2.5%
Ex-segment commissions net advertising agency costs not allocated to M6 9.7 7.6 2.1 27.3%
M6 Free-to-Air other subsidiaries EBITA (1.7) (0.9) (0.7) n.s
M6 Free-to-Air EBITAM6 Free-to-Air EBITAM6 Free-to-Air EBITAM6 Free-to-Air EBITA 137.8137.8137.8137.8 196.5196.5196.5196.5 (58.7)(58.7)(58.7)(58.7) -29.9%-29.9%-29.9%-29.9%
€ million million million million 31/12/200831/12/200831/12/200831/12/2008 31/12/200731/12/200731/12/200731/12/20072008 / 2007 change2008 / 2007 change2008 / 2007 change2008 / 2007 change
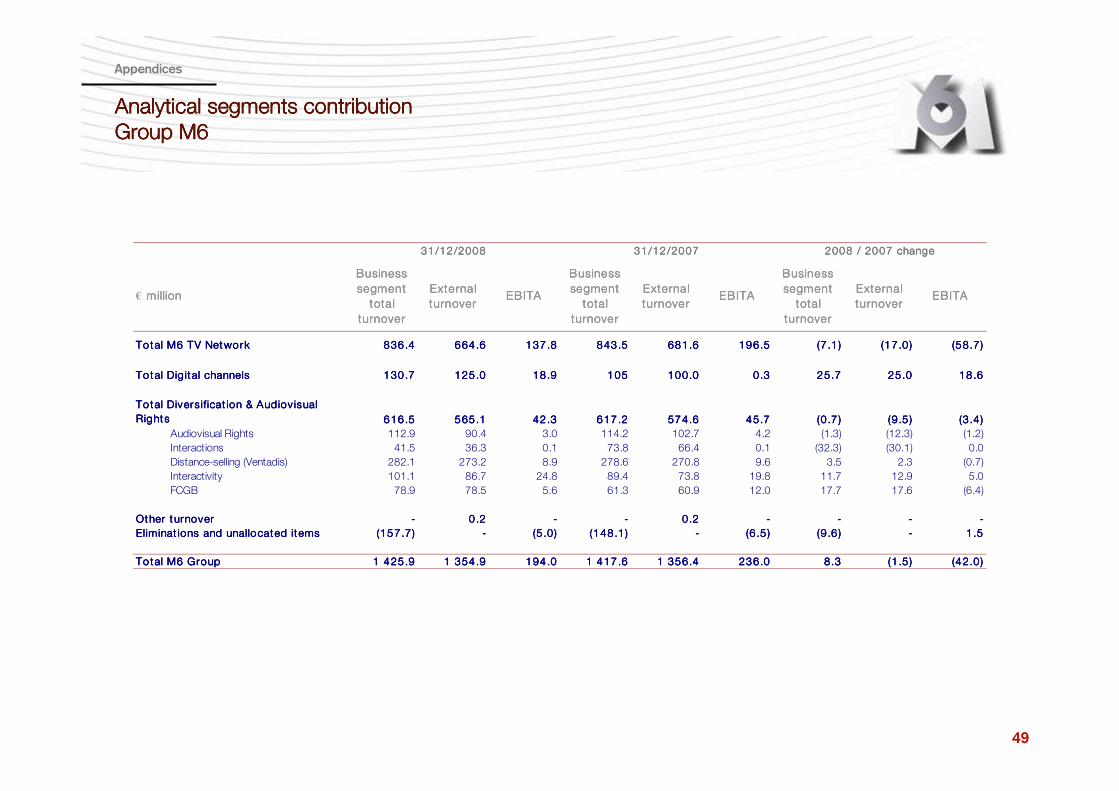
49
AnalyticalAnalyticalAnalyticalAnalytical segments contributionsegments contributionsegments contributionsegments contributionGroup M6Group M6Group M6Group M6
Appendices
€ million million million million
Business Business Business Business
segment segment segment segment
tota l tota l tota l tota l
turnoverturnoverturnoverturnover
Externa l Externa l Externa l Externa l
turnoverturnoverturnoverturnoverEBITAEBITAEBITAEBITA
Business Business Business Business
segment segment segment segment
total total total total
turnoverturnoverturnoverturnover
Externa l Externa l Externa l Externa l
turnoverturnoverturnoverturnoverEBITAEBITAEBITAEBITA
Business Business Business Business
segment segment segment segment
total total total total
turnoverturnoverturnoverturnover
External External External External
turnoverturnoverturnoverturnoverEBITAEBITAEBITAEBITA
Total M6 TV NetworkTotal M6 TV NetworkTotal M6 TV NetworkTotal M6 TV Network 836.4836.4836.4836.4 664.6664.6664.6664.6 137.8137.8137.8137.8 843.5843.5843.5843.5 681.6681.6681.6681.6 196.5196.5196.5196.5 (7.1 )(7.1 )(7.1 )(7.1 ) (17.0 )(17.0 )(17.0 )(17.0 ) (58.7)(58.7)(58.7)(58.7)
Total Dig ital channelsTotal Dig ital channelsTotal Dig ital channelsTotal Dig ital channels 130.7130.7130.7130.7 125.0125.0125.0125.0 18.918.918.918.9 105105105105 100.0100.0100.0100.0 0.30.30.30.3 25.725.725.725.7 25.025.025.025.0 18.618.618.618.6
616.5616.5616.5616.5 565.1565.1565.1565.1 42.342.342.342.3 617.2617.2617.2617.2 574.6574.6574.6574.6 45.745.745.745.7 (0.7 )(0.7 )(0.7 )(0.7 ) (9.5 )(9.5 )(9.5 )(9.5 ) (3.4)(3.4)(3.4)(3.4)
Audiovisual Rights 112.9 90.4 3.0 114.2 102.7 4.2 (1.3) (12.3) (1.2)
Interactions 41.5 36.3 0.1 73.8 66.4 0.1 (32.3) (30.1) 0.0
Distance-selling (Ventadis) 282.1 273.2 8.9 278.6 270.8 9.6 3.5 2.3 (0.7)
Interactivity 101.1 86.7 24.8 89.4 73.8 19.8 11.7 12.9 5.0
FCGB 78.9 78.5 5.6 61.3 60.9 12.0 17.7 17.6 (6.4)
Other turnoverOther turnoverOther turnoverOther turnover ---- 0 .20.20.20.2 ---- ---- 0.20.20.20.2 ---- ---- ---- ----
Eliminat ions and unallocated it emsEliminat ions and unallocated it emsEliminat ions and unallocated it emsEliminat ions and unallocated it ems (157.7)(157.7)(157.7)(157.7) ---- (5 .0)(5 .0)(5 .0)(5 .0) (148.1)(148.1)(148.1)(148.1) ---- (6 .5 )(6 .5 )(6 .5 )(6 .5 ) (9.6 )(9.6 )(9.6 )(9.6 ) ---- 1 .51.51.51.5
Total M6 GroupTotal M6 GroupTotal M6 GroupTotal M6 Group 1 425.91 425.91 425.91 425.9 1 354.91 354.91 354.91 354.9 194.0194.0194.0194.0 1 417.61 417.61 417.61 417.6 1 356.41 356.41 356.41 356.4 236.0236.0236.0236.0 8.38.38.38.3 (1.5 )(1.5 )(1.5 )(1.5 ) (42.0)(42.0)(42.0)(42.0)
31/12/200831/12/200831/12/200831/12/2008 31/12/200731/12/200731/12/200731/12/2007 2008 / 2007 change2008 / 2007 change2008 / 2007 change2008 / 2007 change
Total Divers if icat ion & Audiov isual Total Divers if icat ion & Audiov isual Total Divers if icat ion & Audiov isual Total Divers if icat ion & Audiov isual
RightsRightsRightsRights