
Presentation North American Natural Gas Production … ihs.com IHS Production ... Production Outlook...
28
© 2015 IHS Presentation ihs.com IHS Production Outlook by Major Basin, and Facilities Options, Edward Kelly, IHS Inc. North American Natural Gas February 2015 ENERGY Ed Kelly, Managing Director, + 1 713 209 4524, [email protected]
-
Upload
phunghuong -
Category
Documents
-
view
223 -
download
1
Transcript of Presentation North American Natural Gas Production … ihs.com IHS Production ... Production Outlook...
© 2015 IHS
Presentation
ihs.com
IHS
Production Outlook by Major Basin, and Facilities Options, Edward Kelly, IHS Inc.
North American Natural Gas
February 2015
ENERGY
Ed Kelly, Managing Director, + 1 713 209 4524, [email protected]
Contents
© 2015 IHS
OUTLINE
THE RESOURCE BASE AND COST STRUCTUREThe Marcellus/Utica, and All Else
A PLAY BY PLAY TOUR of GAS PRODUCTION POTENTIALMarcellusUticaHaynesville
COMMENTS
© 2015 IHS
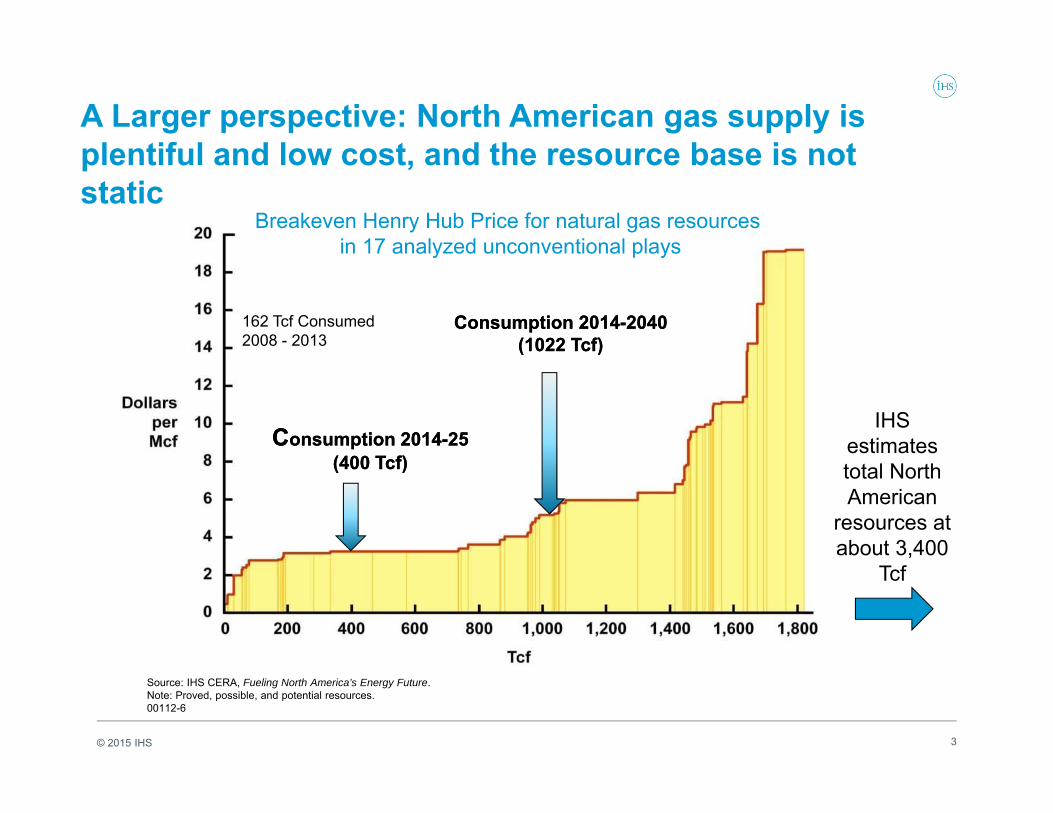
A Larger perspective: North American gas supply is plentiful and low cost, and the resource base is not static
3
Source: IHS CERA, Fueling North America’s Energy Future.Note: Proved, possible, and potential resources.00112-6
Consumption 2014-2040(1022 Tcf)
Consumption 2014-2040(1022 Tcf)
Breakeven Henry Hub Price for natural gas resources in 17 analyzed unconventional plays
IHS estimates total North American
resources at about 3,400
Tcf
Consumption 2014-25(400 Tcf)
Consumption 2014-25(400 Tcf)
162 Tcf Consumed 2008 - 2013
© 2015 IHS 4
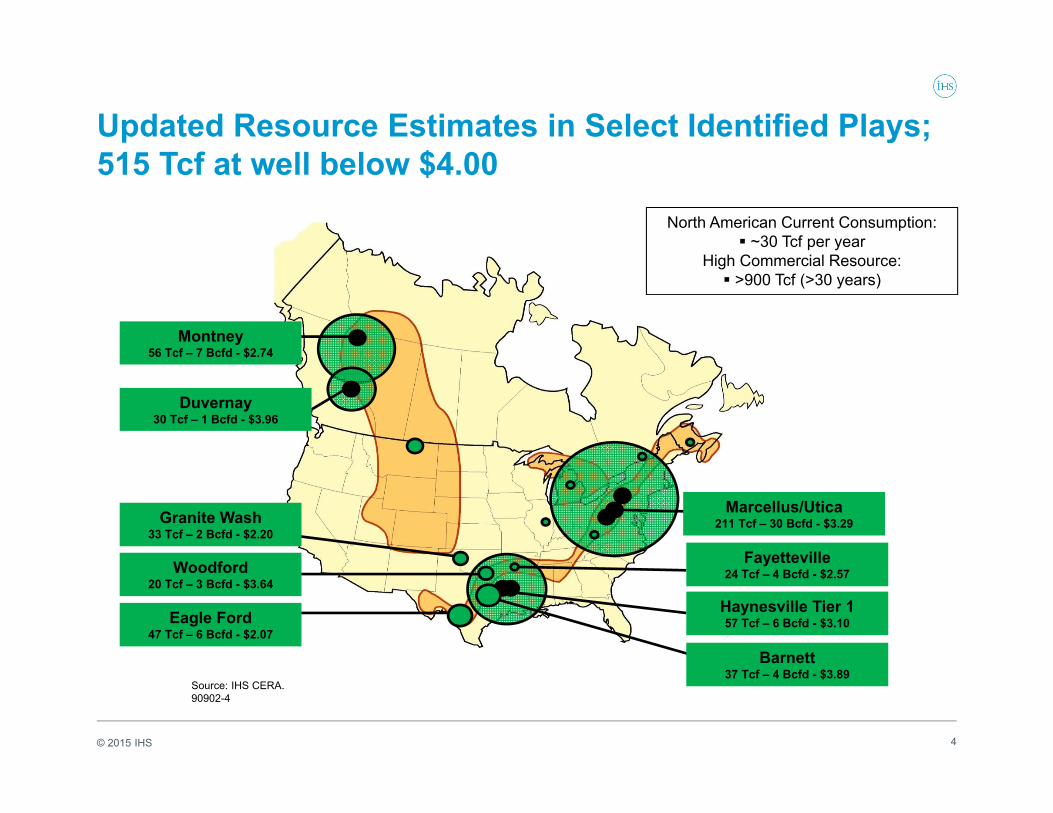
Updated Resource Estimates in Select Identified Plays; 515 Tcf at well below $4.00
Source: IHS CERA.90902-4
Haynesville Tier 157 Tcf – 6 Bcfd - $3.10
Woodford20 Tcf – 3 Bcfd - $3.64
Duvernay30 Tcf – 1 Bcfd - $3.96
Montney56 Tcf – 7 Bcfd - $2.74
Marcellus/Utica211 Tcf – 30 Bcfd - $3.29
Fayetteville24 Tcf – 4 Bcfd - $2.57
Barnett37 Tcf – 4 Bcfd - $3.89
North American Current Consumption: ~30 Tcf per year
High Commercial Resource: >900 Tcf (>30 years)
Eagle Ford47 Tcf – 6 Bcfd - $2.07
Granite Wash33 Tcf – 2 Bcfd - $2.20
© 2015 IHS
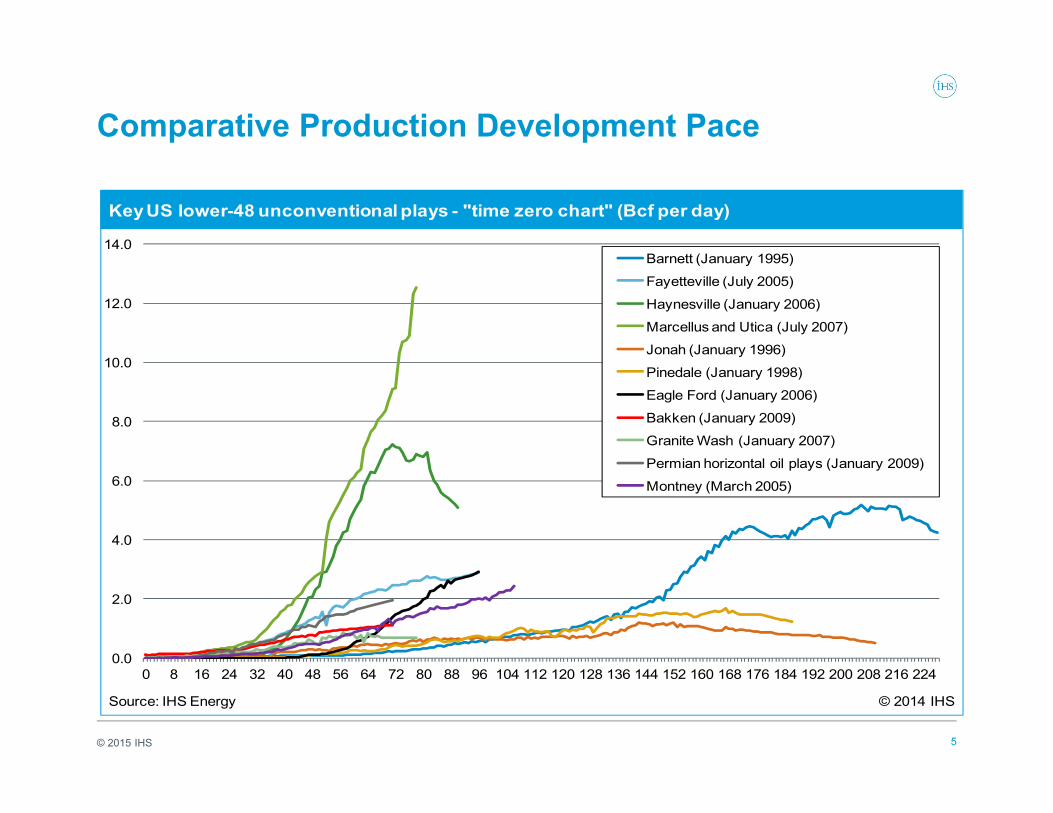
Comparative Production Development Pace
5
0.0
2.0
4.0
6.0
8.0
10.0
12.0
14.0
0 8 16 24 32 40 48 56 64 72 80 88 96 104 112 120 128 136 144 152 160 168 176 184 192 200 208 216 224
Barnett (January 1995)Fayetteville (July 2005)
Haynesville (January 2006)Marcellus and Utica (July 2007)Jonah (January 1996)Pinedale (January 1998)Eagle Ford (January 2006)Bakken (January 2009)Granite Wash (January 2007)Permian horizontal oil plays (January 2009)
Montney (March 2005)
Key US lower-48 unconventional plays - "time zero chart" (Bcf per day)
Source: IHS Energy © 2014 IHS
© 2015 IHS
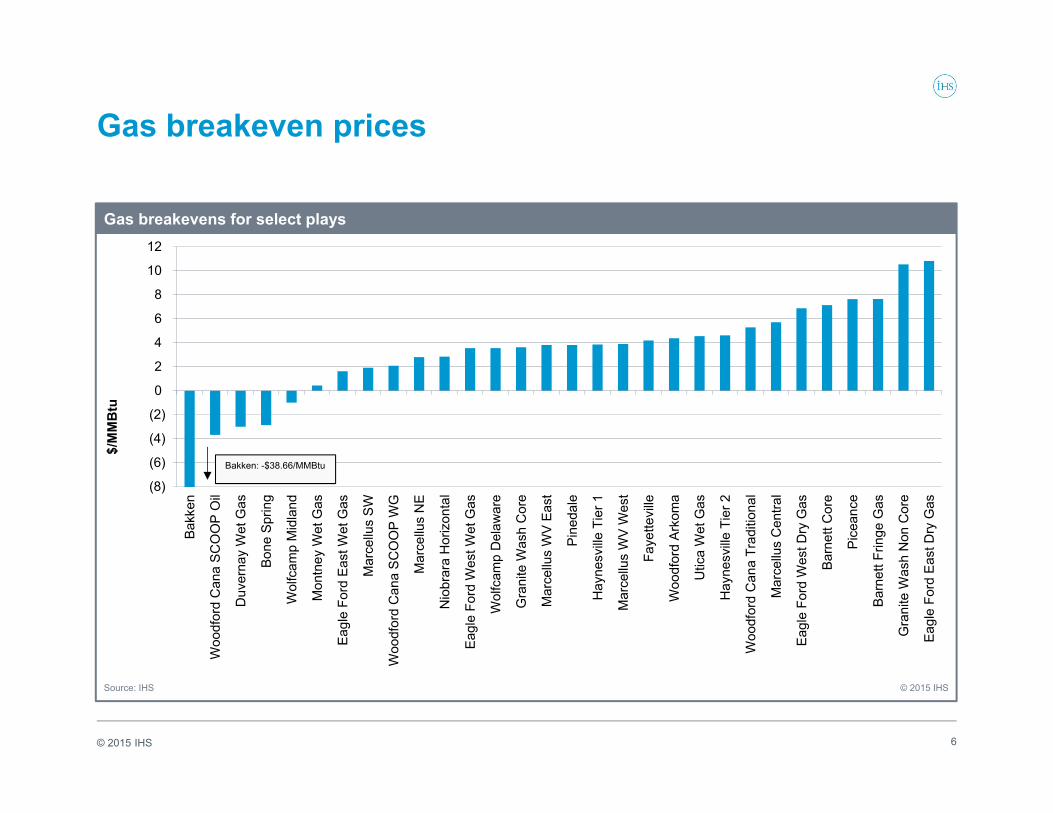
Gas breakeven prices
6
(8)
(6)
(4)
(2)
0
2
4
6
8
10
12
Bakk
en
Woo
dfor
d C
ana
SCO
OP
Oil
Duv
erna
y W
et G
as
Bone
Spr
ing
Wol
fcam
p M
idla
nd
Mon
tney
Wet
Gas
Eagl
e Fo
rd E
ast W
et G
as
Mar
cellu
s SW
Woo
dfor
d C
ana
SCO
OP
WG
Mar
cellu
s N
E
Nio
brar
a H
oriz
onta
l
Eagl
e Fo
rd W
est W
et G
as
Wol
fcam
p D
elaw
are
Gra
nite
Was
h C
ore
Mar
cellu
s W
V Ea
st
Pine
dale
Hay
nesv
ille T
ier 1
Mar
cellu
s W
V W
est
Faye
ttevi
lle
Woo
dfor
d Ar
kom
a
Utic
a W
et G
as
Hay
nesv
ille T
ier 2
Woo
dfor
d C
ana
Trad
ition
al
Mar
cellu
s C
entra
l
Eagl
e Fo
rd W
est D
ry G
as
Barn
ett C
ore
Pice
ance
Barn
ett F
ringe
Gas
Gra
nite
Was
h N
on C
ore
Eagl
e Fo
rd E
ast D
ry G
as
Gas breakevens for select plays
Source: IHS © 2015 IHS
$/M
MB
tu
Bakken: -$38.66/MMBtu
© 2015 IHS
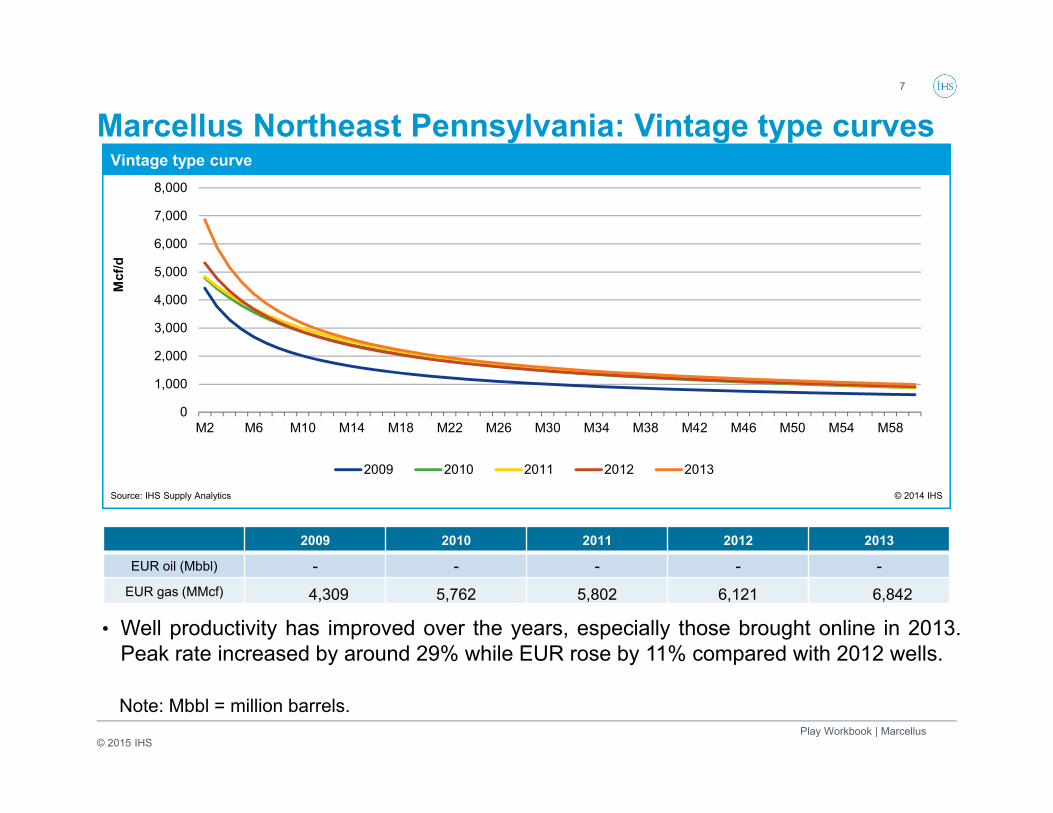
Marcellus Northeast Pennsylvania: Vintage type curves7
• Well productivity has improved over the years, especially those brought online in 2013.Peak rate increased by around 29% while EUR rose by 11% compared with 2012 wells.
2009 2010 2011 2012 2013
EUR oil (Mbbl) - - - - -EUR gas (MMcf) 4,309 5,762 5,802 6,121 6,842
0
1,000
2,000
3,000
4,000
5,000
6,000
7,000
8,000
M2 M6 M10 M14 M18 M22 M26 M30 M34 M38 M42 M46 M50 M54 M58
2009 2010 2011 2012 2013
Vintage type curve
Source: IHS Supply Analytics © 2014 IHS
Mcf
/d
Note: Mbbl = million barrels.Play Workbook | Marcellus
© 2015 IHS
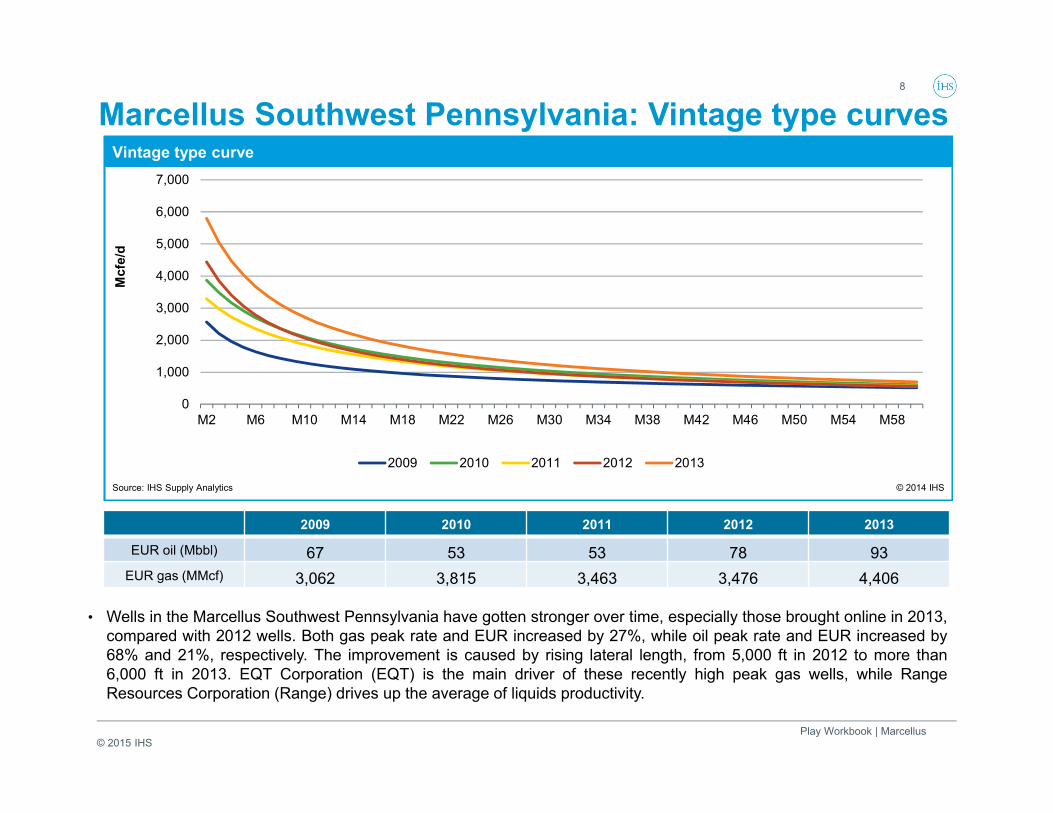
Marcellus Southwest Pennsylvania: Vintage type curves8
• Wells in the Marcellus Southwest Pennsylvania have gotten stronger over time, especially those brought online in 2013,compared with 2012 wells. Both gas peak rate and EUR increased by 27%, while oil peak rate and EUR increased by68% and 21%, respectively. The improvement is caused by rising lateral length, from 5,000 ft in 2012 to more than6,000 ft in 2013. EQT Corporation (EQT) is the main driver of these recently high peak gas wells, while RangeResources Corporation (Range) drives up the average of liquids productivity.
2009 2010 2011 2012 2013
EUR oil (Mbbl) 67 53 53 78 93EUR gas (MMcf) 3,062 3,815 3,463 3,476 4,406
0
1,000
2,000
3,000
4,000
5,000
6,000
7,000
M2 M6 M10 M14 M18 M22 M26 M30 M34 M38 M42 M46 M50 M54 M58
2009 2010 2011 2012 2013
Vintage type curve
Source: IHS Supply Analytics © 2014 IHS
Mcf
e/d
Play Workbook | Marcellus
© 2015 IHS
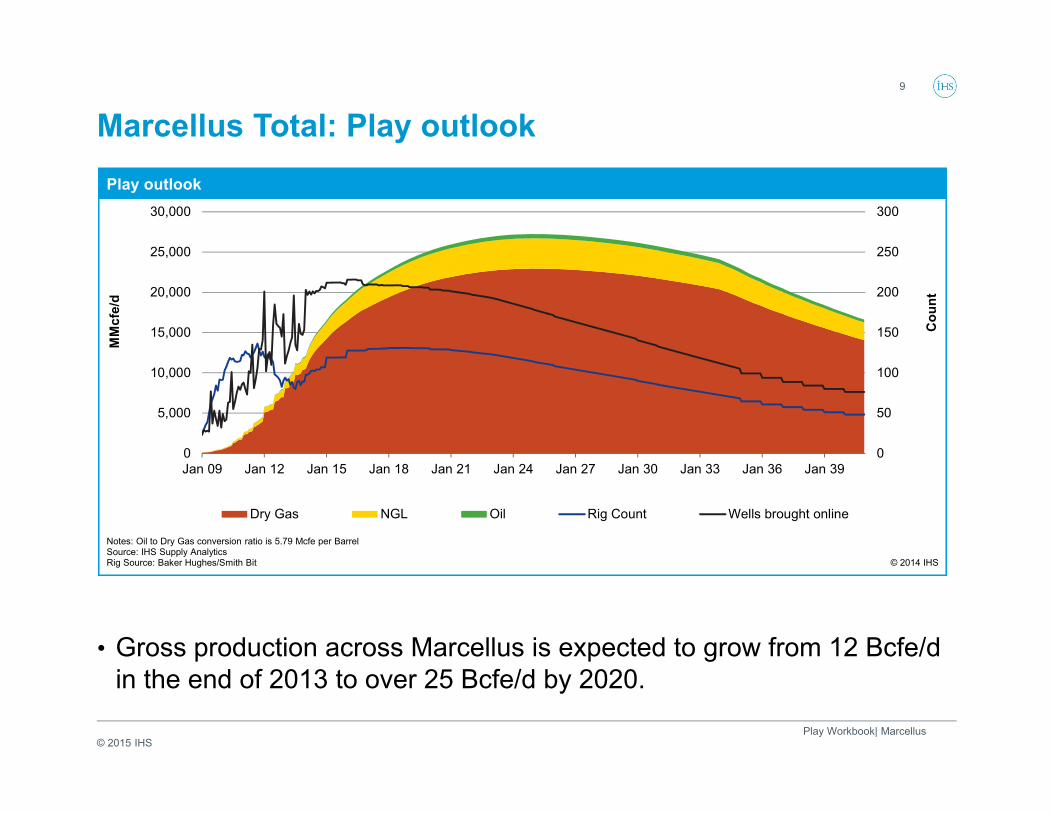
Marcellus Total: Play outlook9
• Gross production across Marcellus is expected to grow from 12 Bcfe/d in the end of 2013 to over 25 Bcfe/d by 2020.
Play Workbook| Marcellus
0
50
100
150
200
250
300
0
5,000
10,000
15,000
20,000
25,000
30,000
Jan 09 Jan 12 Jan 15 Jan 18 Jan 21 Jan 24 Jan 27 Jan 30 Jan 33 Jan 36 Jan 39
Dry Gas NGL Oil Rig Count Wells brought online
Play outlook
Notes: Oil to Dry Gas conversion ratio is 5.79 Mcfe per BarrelSource: IHS Supply AnalyticsRig Source: Baker Hughes/Smith Bit © 2014 IHS
MM
cfe/
d
Cou
nt
© 2015 IHS 10
Play Workbook | Utica
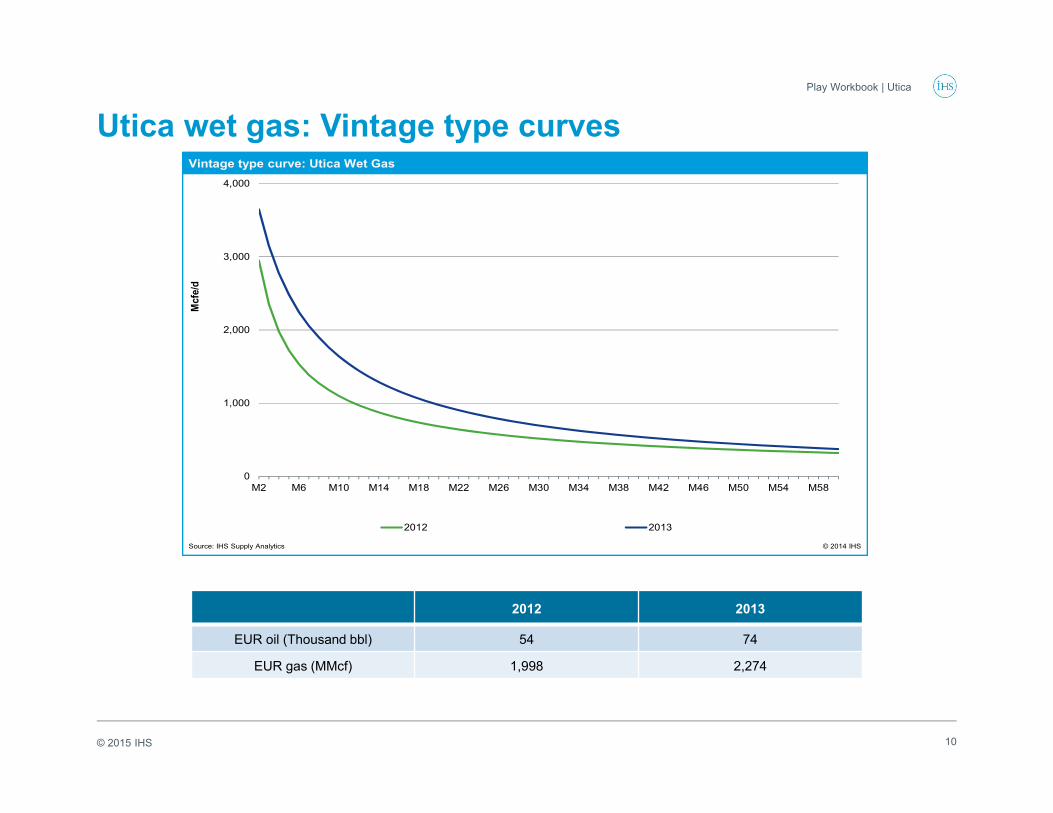
Utica wet gas: Vintage type curves
2012 2013
EUR oil (Thousand bbl) 54 74
EUR gas (MMcf) 1,998 2,274
0
1,000
2,000
3,000
4,000
M2 M6 M10 M14 M18 M22 M26 M30 M34 M38 M42 M46 M50 M54 M58
2012 2013
Vintage type curve: Utica Wet Gas
Source: IHS Supply Analytics © 2014 IHS
Mcf
e/d
© 2015 IHS 11
Play Workbook | Utica
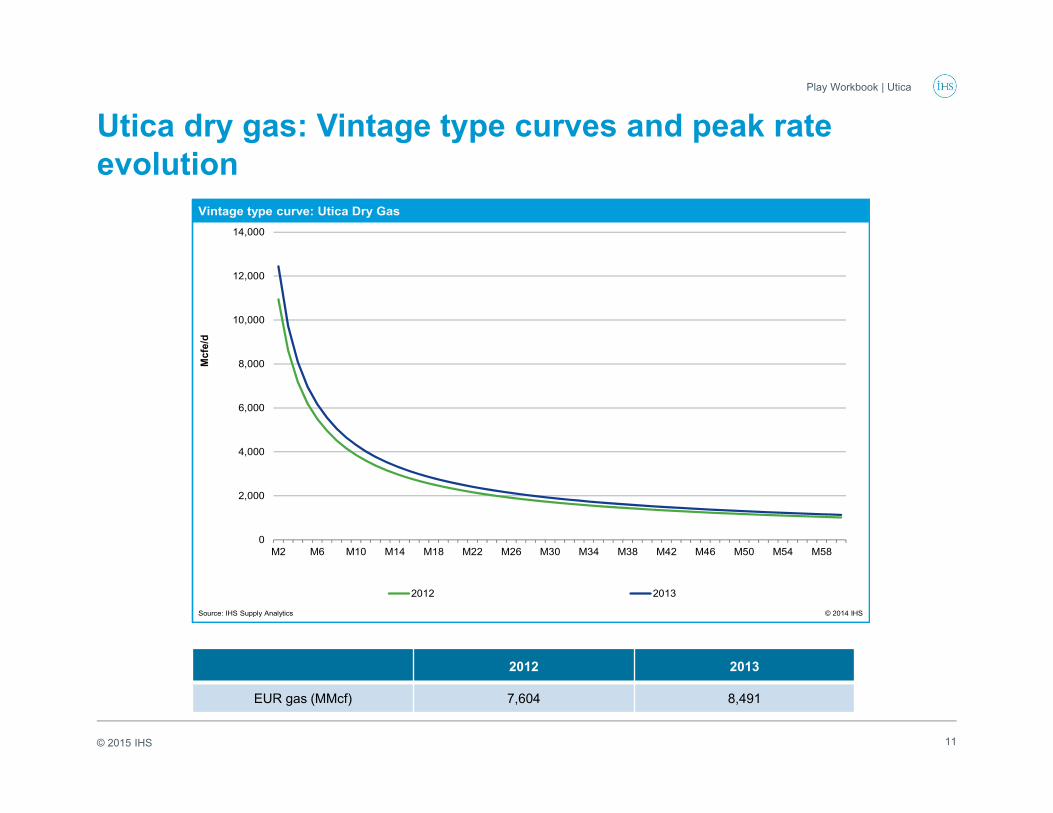
Utica dry gas: Vintage type curves and peak rate evolution
2012 2013
EUR gas (MMcf) 7,604 8,491
0
2,000
4,000
6,000
8,000
10,000
12,000
14,000
M2 M6 M10 M14 M18 M22 M26 M30 M34 M38 M42 M46 M50 M54 M58
2012 2013
Vintage type curve: Utica Dry Gas
Source: IHS Supply Analytics © 2014 IHS
Mcf
e/d
© 2015 IHS 12
Play Workbook | Utica
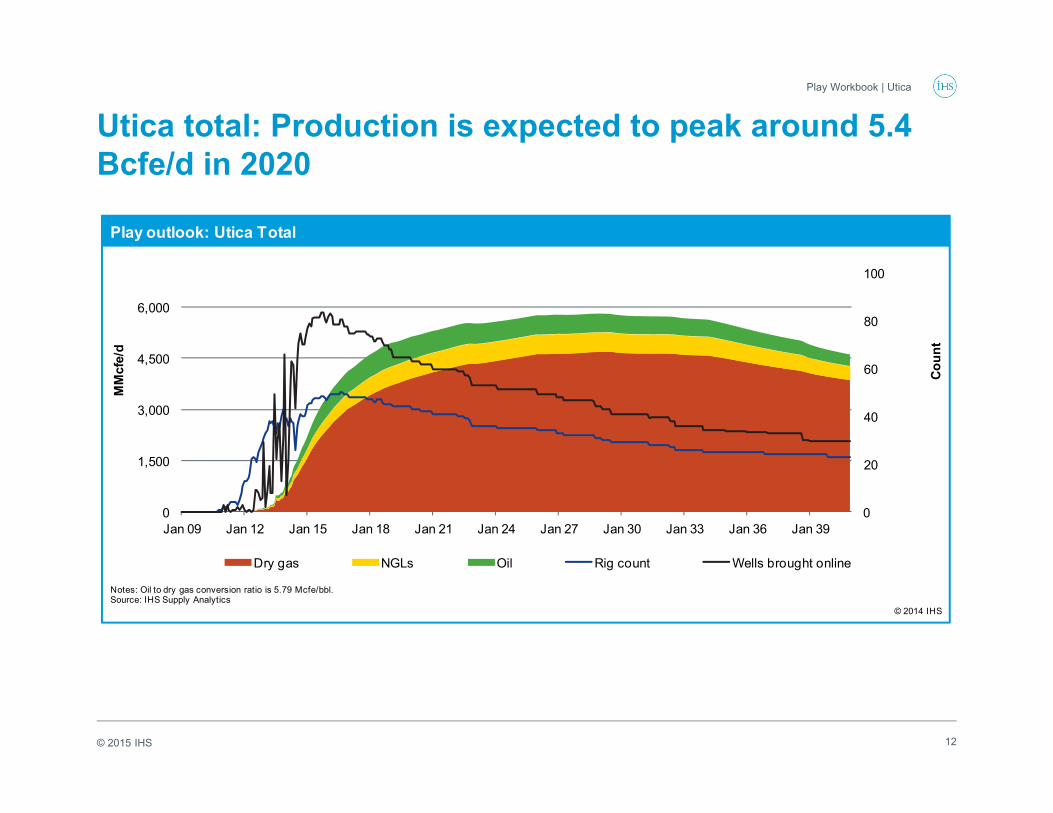
Utica total: Production is expected to peak around 5.4 Bcfe/d in 2020
0
20
40
60
80
100
0
1,500
3,000
4,500
6,000
Jan 09 Jan 12 Jan 15 Jan 18 Jan 21 Jan 24 Jan 27 Jan 30 Jan 33 Jan 36 Jan 39
Dry gas NGLs Oil Rig count Wells brought online
Play outlook: Utica Total
Notes: Oil to dry gas conversion ratio is 5.79 Mcfe/bbl.Source: IHS Supply Analytics
© 2014 IHS
MM
cfe/
d
Coun
t
© 2015 IHS
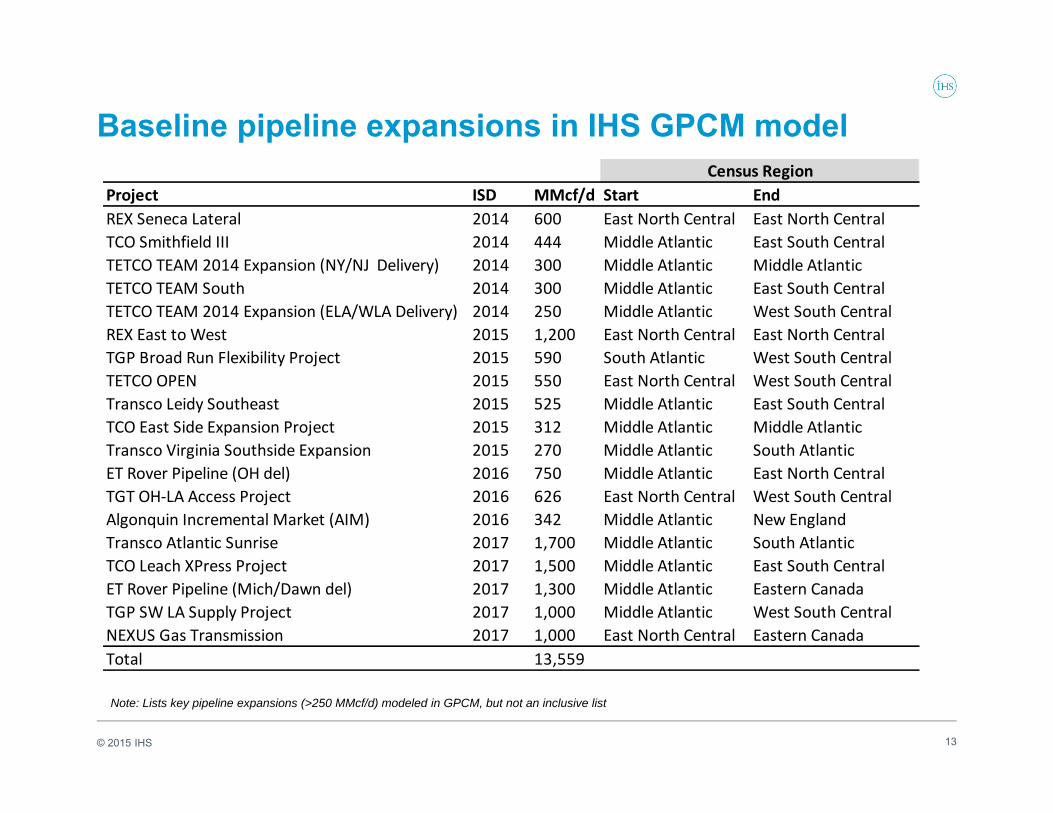
Baseline pipeline expansions in IHS GPCM model
13
Note: Lists key pipeline expansions (>250 MMcf/d) modeled in GPCM, but not an inclusive list
Census RegionProject ISD MMcf/d Start EndREX Seneca Lateral 2014 600 East North Central East North CentralTCO Smithfield III 2014 444 Middle Atlantic East South CentralTETCO TEAM 2014 Expansion (NY/NJ Delivery) 2014 300 Middle Atlantic Middle AtlanticTETCO TEAM South 2014 300 Middle Atlantic East South CentralTETCO TEAM 2014 Expansion (ELA/WLA Delivery) 2014 250 Middle Atlantic West South CentralREX East to West 2015 1,200 East North Central East North CentralTGP Broad Run Flexibility Project 2015 590 South Atlantic West South CentralTETCO OPEN 2015 550 East North Central West South CentralTransco Leidy Southeast 2015 525 Middle Atlantic East South CentralTCO East Side Expansion Project 2015 312 Middle Atlantic Middle AtlanticTransco Virginia Southside Expansion 2015 270 Middle Atlantic South AtlanticET Rover Pipeline (OH del) 2016 750 Middle Atlantic East North CentralTGT OH‐LA Access Project 2016 626 East North Central West South CentralAlgonquin Incremental Market (AIM) 2016 342 Middle Atlantic New EnglandTransco Atlantic Sunrise 2017 1,700 Middle Atlantic South AtlanticTCO Leach XPress Project 2017 1,500 Middle Atlantic East South CentralET Rover Pipeline (Mich/Dawn del) 2017 1,300 Middle Atlantic Eastern CanadaTGP SW LA Supply Project 2017 1,000 Middle Atlantic West South CentralNEXUS Gas Transmission 2017 1,000 East North Central Eastern CanadaTotal 13,559
© 2015 IHS
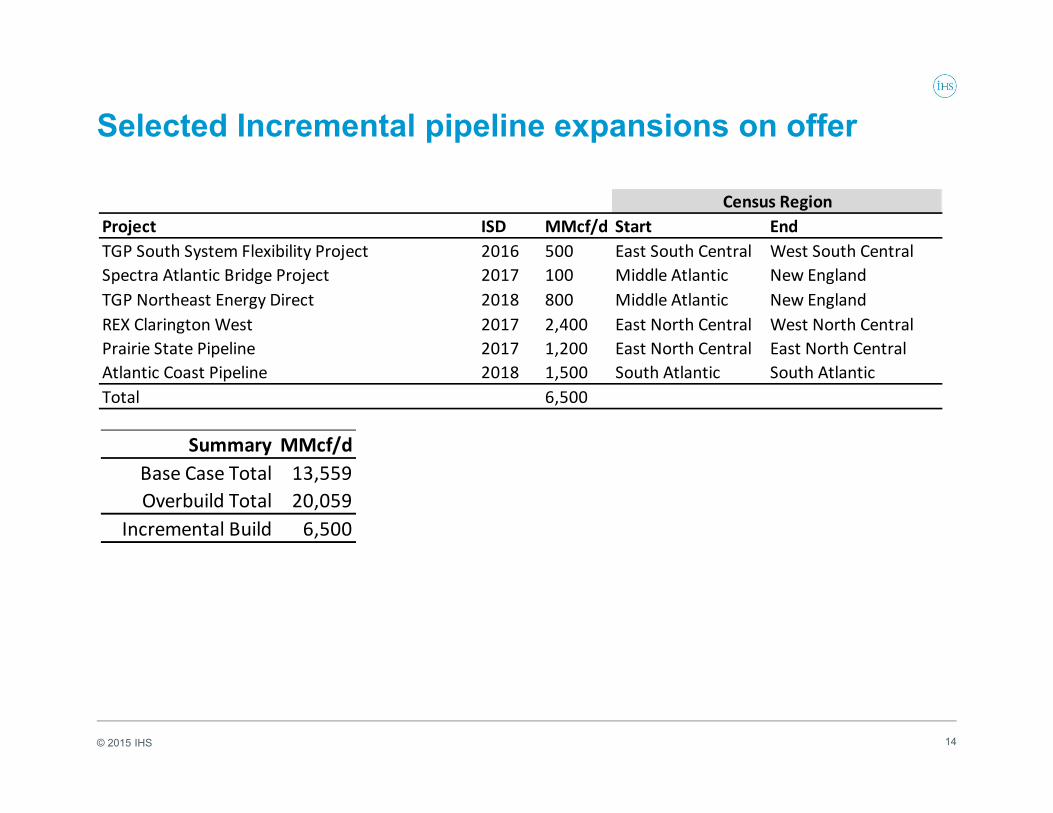
Selected Incremental pipeline expansions on offer
14
Census RegionProject ISD MMcf/d Start EndTGP South System Flexibility Project 2016 500 East South Central West South CentralSpectra Atlantic Bridge Project 2017 100 Middle Atlantic New EnglandTGP Northeast Energy Direct 2018 800 Middle Atlantic New EnglandREX Clarington West 2017 2,400 East North Central West North CentralPrairie State Pipeline 2017 1,200 East North Central East North CentralAtlantic Coast Pipeline 2018 1,500 South Atlantic South AtlanticTotal 6,500
Summary MMcf/dBase Case Total 13,559Overbuild Total 20,059
Incremental Build 6,500

© 2015 IHS
Vintage type well decline curves
15
2009 2010 2011 2012 2013 2014
Max rate: Gas (Mcf/d) 10,353 9,846 9,123 8,758 9,468 10,247
EUR gas (MMcf) 4,920 5,857 6,016 5,735 6,504 6,642Source: IHS © 2015 IHS
Haynesville / February 2015
• Selected operators initiated a practice of choking back wells in 2010, which resulted in lower starting rates but shallower initial declines.
Note: EUR = estimated ultimate recovery.
0
2,000
4,000
6,000
8,000
10,000
12,000
M2 M5 M8 M11 M14 M17 M20 M23 M26 M29 M32 M35 M38 M41 M44 M47 M50 M53 M56 M59
2009 2010 2011 2012 2013 2014
Vintage type curves: Haynesville Tier 1
Notes: 2014 curves made with data till May 2014.Source: IHS © 2015 IHS
Mcf
/d
© 2015 IHS
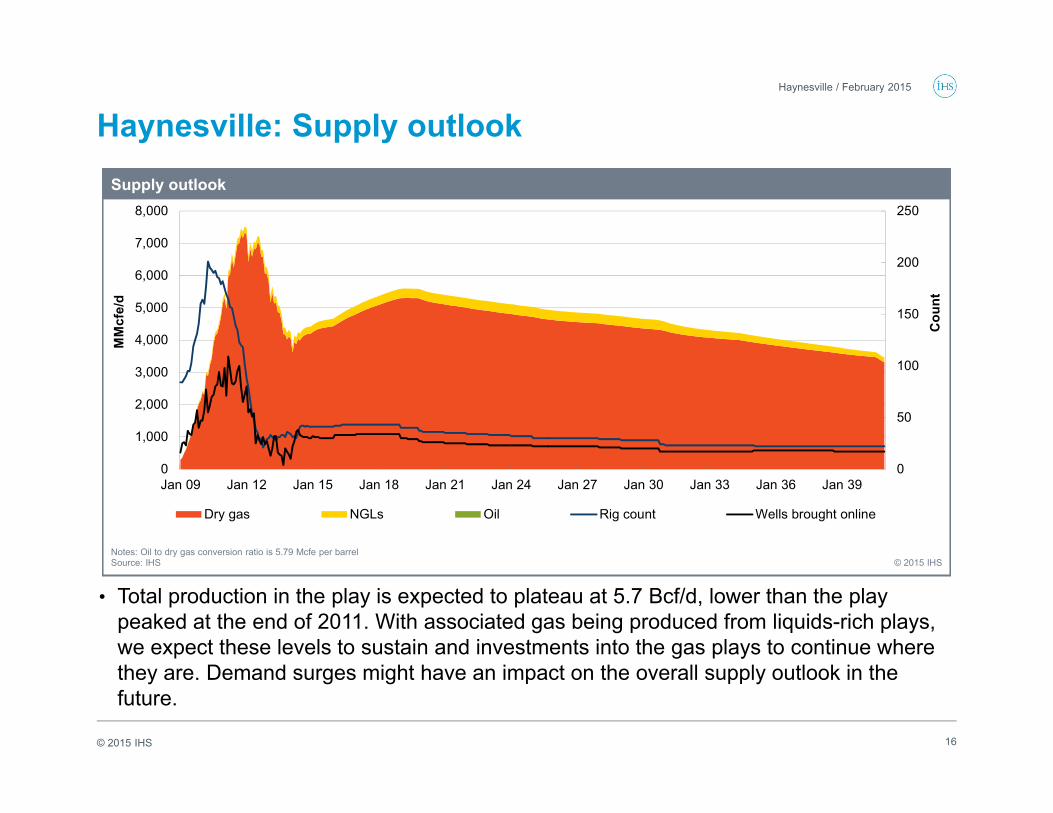
Haynesville: Supply outlook
• Total production in the play is expected to plateau at 5.7 Bcf/d, lower than the play peaked at the end of 2011. With associated gas being produced from liquids-rich plays, we expect these levels to sustain and investments into the gas plays to continue where they are. Demand surges might have an impact on the overall supply outlook in the future.
16
Haynesville / February 2015
0
50
100
150
200
250
0
1,000
2,000
3,000
4,000
5,000
6,000
7,000
8,000
Jan 09 Jan 12 Jan 15 Jan 18 Jan 21 Jan 24 Jan 27 Jan 30 Jan 33 Jan 36 Jan 39
Dry gas NGLs Oil Rig count Wells brought online
Supply outlook
Notes: Oil to dry gas conversion ratio is 5.79 Mcfe per barrelSource: IHS © 2015 IHS
MM
cfe/
d
Cou
nt
© 2015 IHS
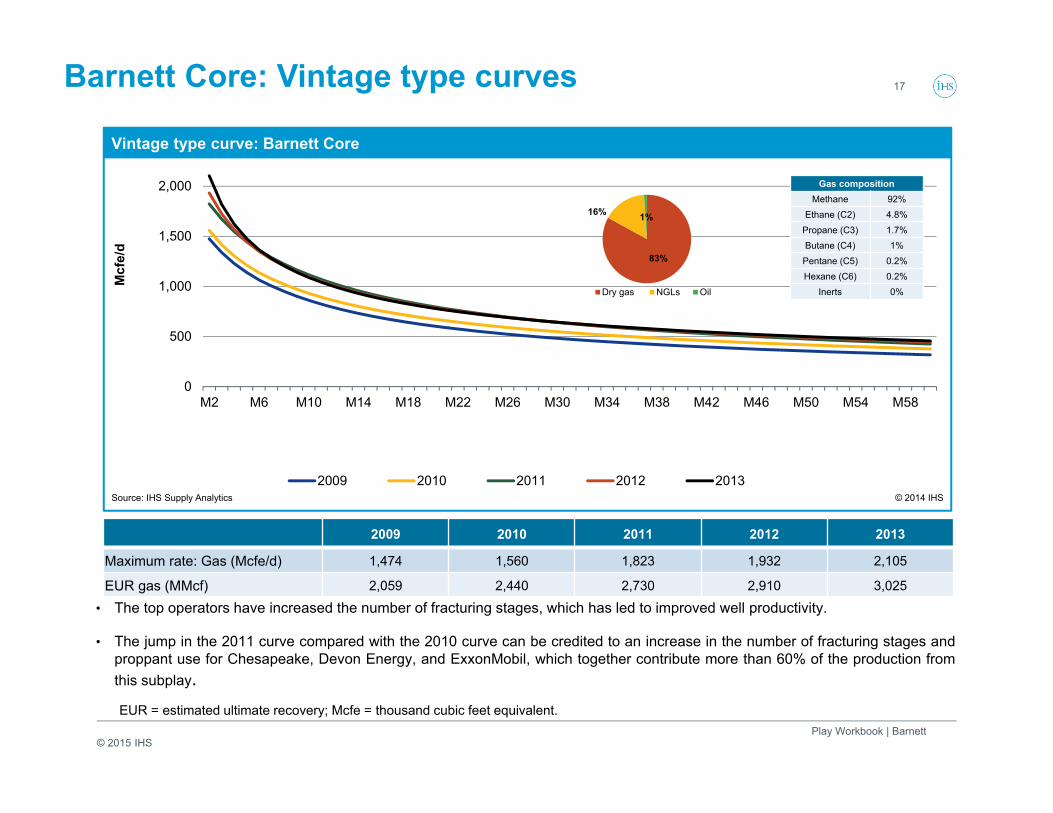
Barnett Core: Vintage type curves 17
Play Workbook | Barnett
2009 2010 2011 2012 2013
Maximum rate: Gas (Mcfe/d) 1,474 1,560 1,823 1,932 2,105
EUR gas (MMcf) 2,059 2,440 2,730 2,910 3,025• The top operators have increased the number of fracturing stages, which has led to improved well productivity.
• The jump in the 2011 curve compared with the 2010 curve can be credited to an increase in the number of fracturing stages andproppant use for Chesapeake, Devon Energy, and ExxonMobil, which together contribute more than 60% of the production fromthis subplay.
0
500
1,000
1,500
2,000
2,500
M2 M6 M10 M14 M18 M22 M26 M30 M34 M38 M42 M46 M50 M54 M58
2009 2010 2011 2012 2013
Vintage type curve: Barnett Core
Source: IHS Supply Analytics © 2014 IHS
Mcf
e/d
Gas compositionMethane 92%
Ethane (C2) 4.8%Propane (C3) 1.7%Butane (C4) 1%Pentane (C5) 0.2%Hexane (C6) 0.2%
Inerts 0%
EUR = estimated ultimate recovery; Mcfe = thousand cubic feet equivalent.
83%
16% 1%
Dry gas NGLs Oil
© 2015 IHS
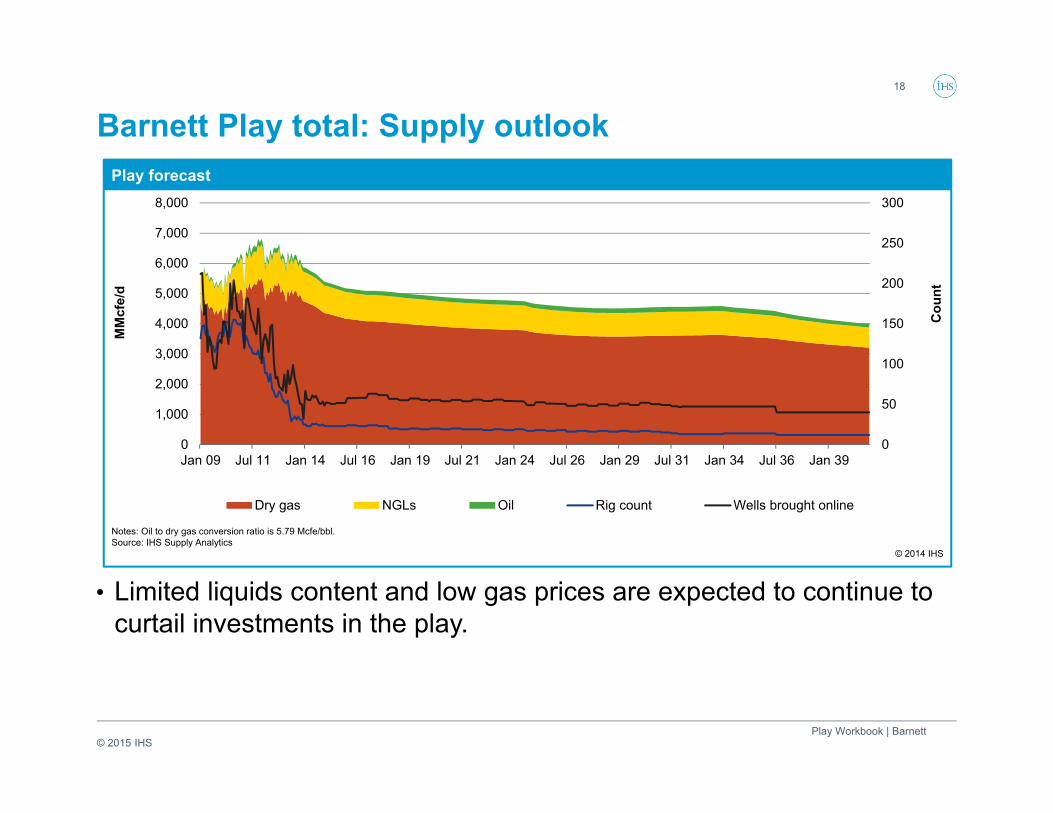
Barnett Play total: Supply outlook18
Play Workbook | Barnett
0
50
100
150
200
250
300
0
1,000
2,000
3,000
4,000
5,000
6,000
7,000
8,000
Jan 09 Jul 11 Jan 14 Jul 16 Jan 19 Jul 21 Jan 24 Jul 26 Jan 29 Jul 31 Jan 34 Jul 36 Jan 39
Dry gas NGLs Oil Rig count Wells brought online
Play forecast
Notes: Oil to dry gas conversion ratio is 5.79 Mcfe/bbl.Source: IHS Supply Analytics
© 2014 IHS
MM
cfe/
d
Cou
nt
• Limited liquids content and low gas prices are expected to continue to curtail investments in the play.
© 2015 IHS
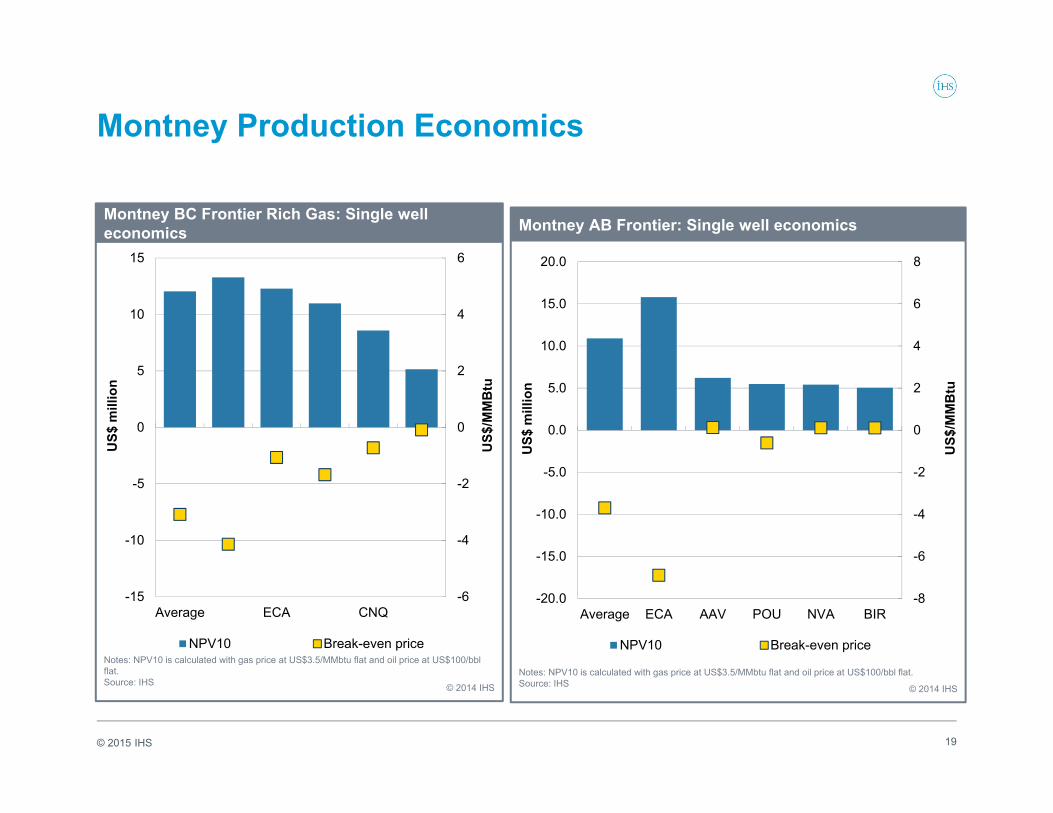
Montney Production Economics
19
-6
-4
-2
0
2
4
6
-15
-10
-5
0
5
10
15
Average ECA CNQ
NPV10 Break-even price
Montney BC Frontier Rich Gas: Single well economics
Notes: NPV10 is calculated with gas price at US$3.5/MMbtu flat and oil price at US$100/bbl flat.Source: IHS © 2014 IHS
US$
mill
ion
US$
/MM
Btu
-8
-6
-4
-2
0
2
4
6
8
-20.0
-15.0
-10.0
-5.0
0.0
5.0
10.0
15.0
20.0
Average ECA AAV POU NVA BIR
NPV10 Break-even price
Montney AB Frontier: Single well economics
Notes: NPV10 is calculated with gas price at US$3.5/MMbtu flat and oil price at US$100/bbl flat.Source: IHS © 2014 IHS
US$
mill
ion
US$
/MM
Btu
© 2015 IHS
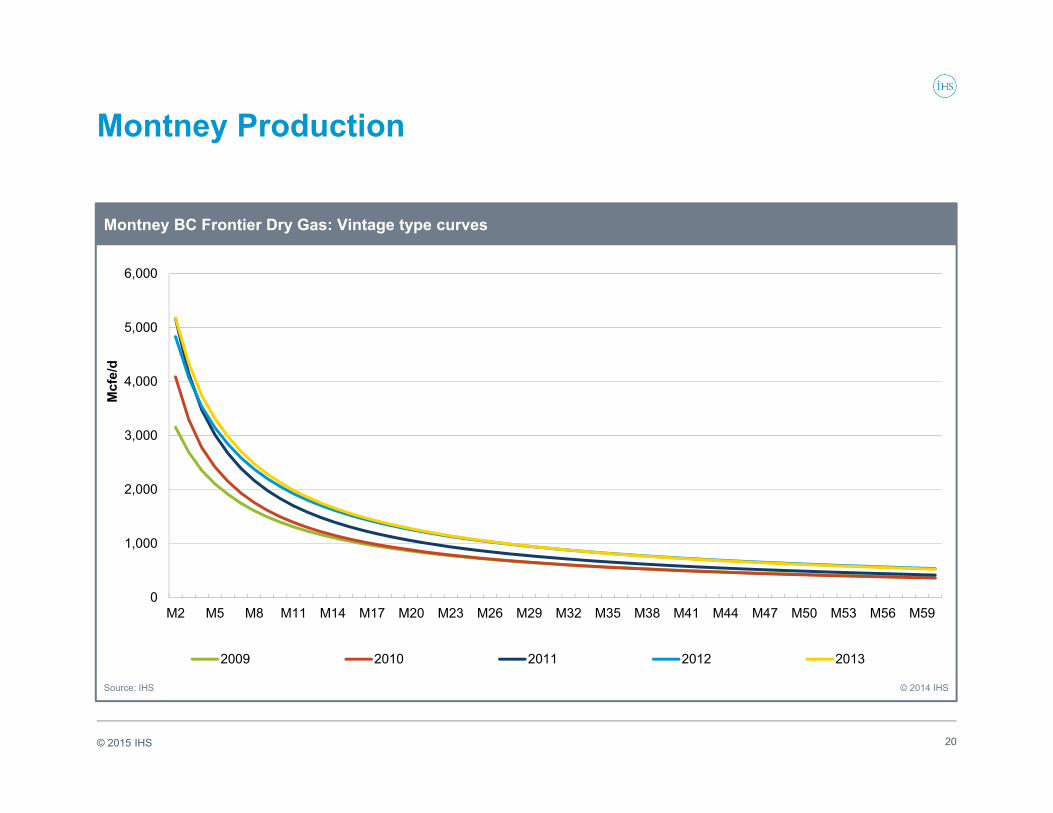
Montney Production
20
0
1,000
2,000
3,000
4,000
5,000
6,000
M2 M5 M8 M11 M14 M17 M20 M23 M26 M29 M32 M35 M38 M41 M44 M47 M50 M53 M56 M59
2009 2010 2011 2012 2013
Montney BC Frontier Dry Gas: Vintage type curves
Source: IHS © 2014 IHS
Mcf
e/d
© 2015 IHS
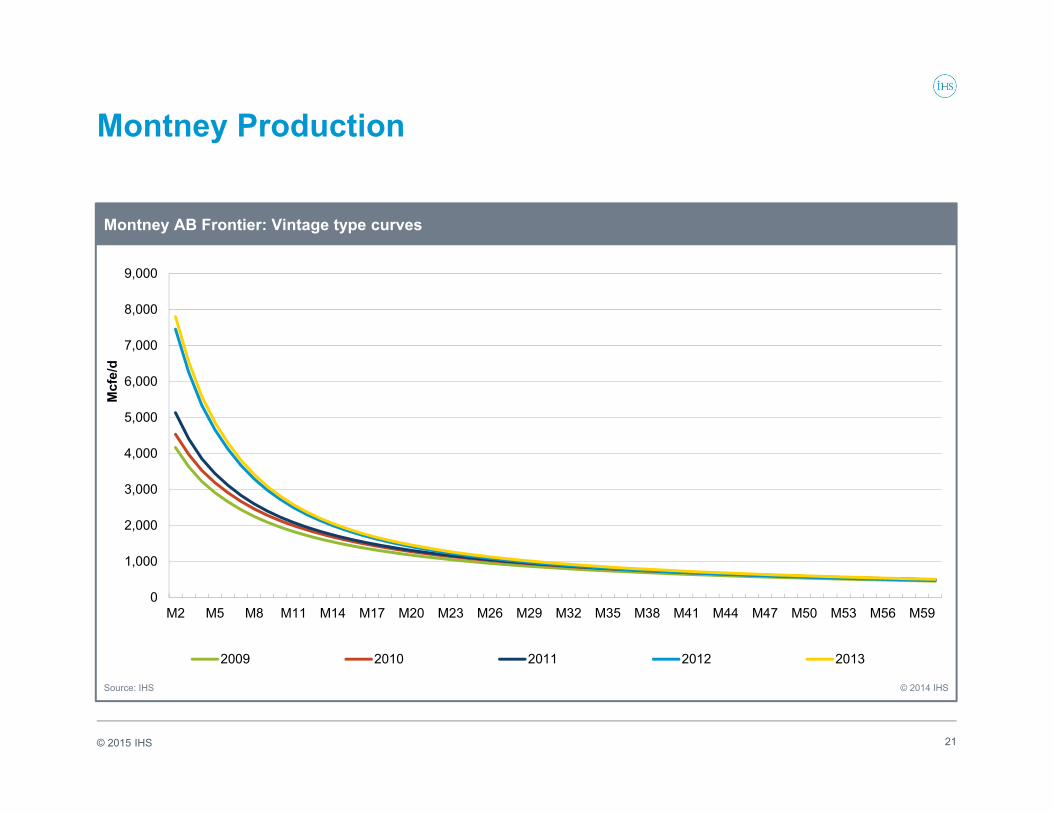
Montney Production
21
0
1,000
2,000
3,000
4,000
5,000
6,000
7,000
8,000
9,000
M2 M5 M8 M11 M14 M17 M20 M23 M26 M29 M32 M35 M38 M41 M44 M47 M50 M53 M56 M59
2009 2010 2011 2012 2013
Montney AB Frontier: Vintage type curves
Source: IHS © 2014 IHS
Mcf
e/d
© 2015 IHS
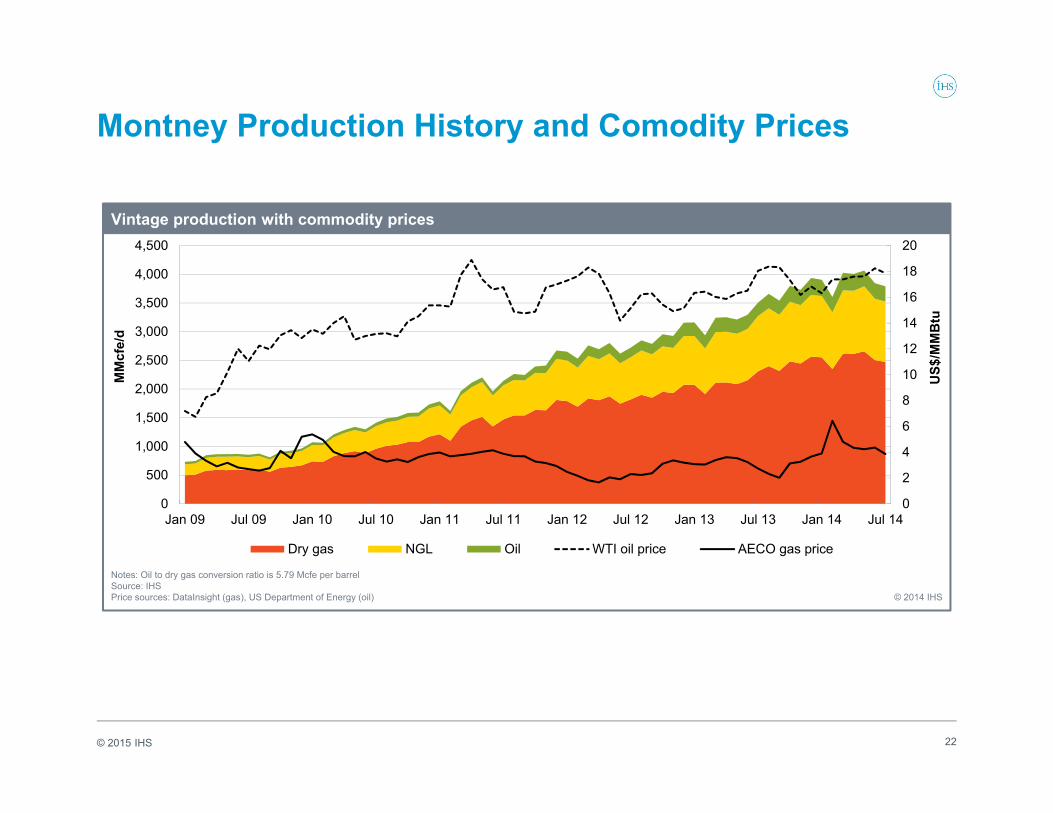
Montney Production History and Comodity Prices
22
0
2
4
6
8
10
12
14
16
18
20
0
500
1,000
1,500
2,000
2,500
3,000
3,500
4,000
4,500
Jan 09 Jul 09 Jan 10 Jul 10 Jan 11 Jul 11 Jan 12 Jul 12 Jan 13 Jul 13 Jan 14 Jul 14
Dry gas NGL Oil WTI oil price AECO gas price
Vintage production with commodity prices
Notes: Oil to dry gas conversion ratio is 5.79 Mcfe per barrelSource: IHSPrice sources: DataInsight (gas), US Department of Energy (oil) © 2014 IHS
MM
cfe/
d
US$
/MM
Btu
© 2015 IHS
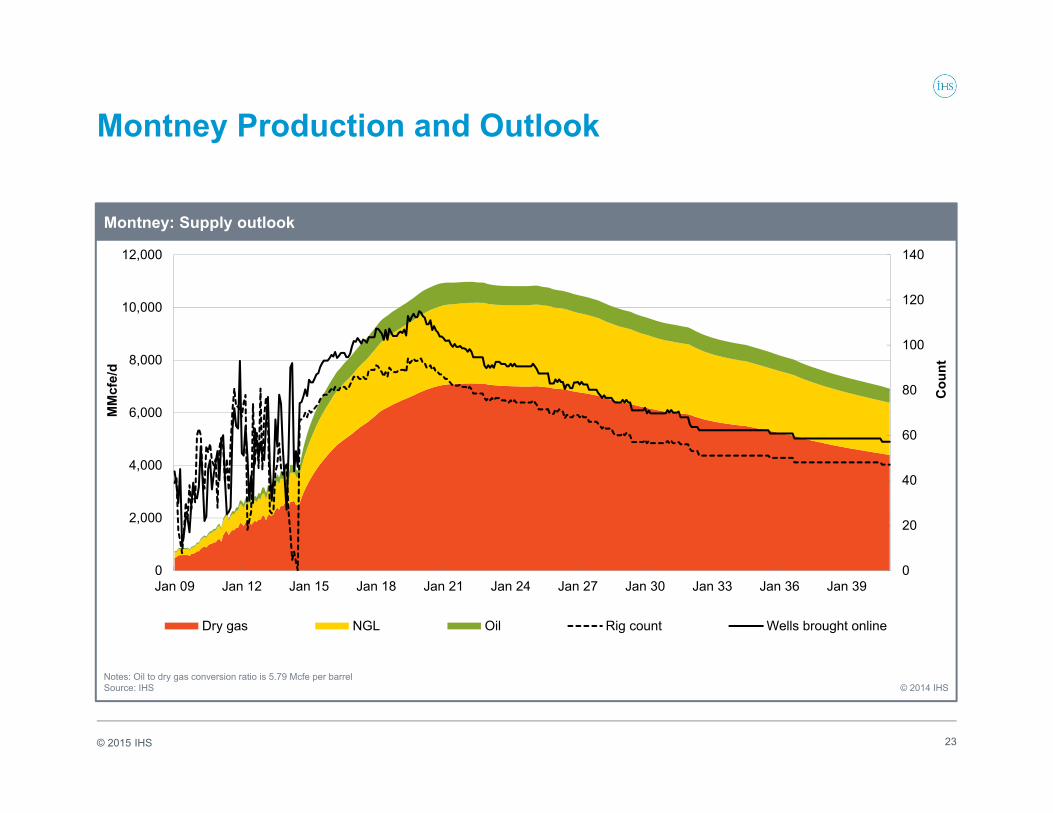
Montney Production and Outlook
23
0
20
40
60
80
100
120
140
0
2,000
4,000
6,000
8,000
10,000
12,000
Jan 09 Jan 12 Jan 15 Jan 18 Jan 21 Jan 24 Jan 27 Jan 30 Jan 33 Jan 36 Jan 39
Dry gas NGL Oil Rig count Wells brought online
Montney: Supply outlook
Notes: Oil to dry gas conversion ratio is 5.79 Mcfe per barrelSource: IHS © 2014 IHS
MM
cfe/
d
Cou
nt
© 2015 IHS
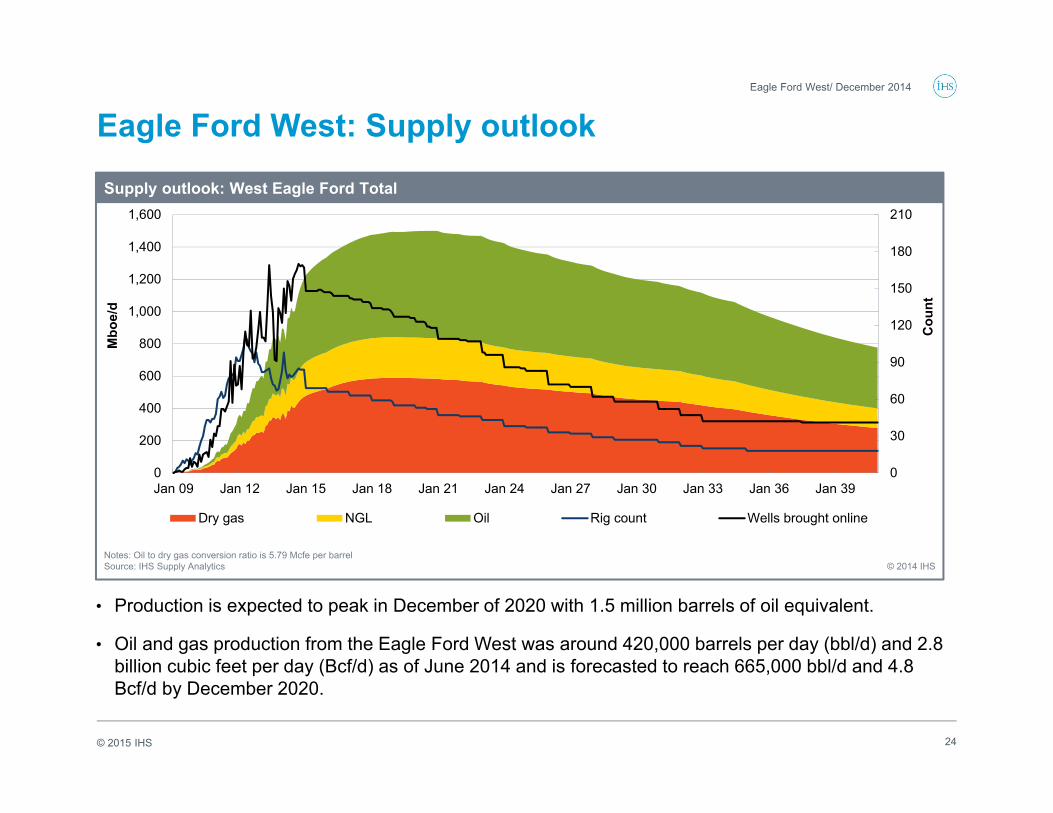
Eagle Ford West: Supply outlook
• Production is expected to peak in December of 2020 with 1.5 million barrels of oil equivalent.
• Oil and gas production from the Eagle Ford West was around 420,000 barrels per day (bbl/d) and 2.8 billion cubic feet per day (Bcf/d) as of June 2014 and is forecasted to reach 665,000 bbl/d and 4.8 Bcf/d by December 2020.
24
Eagle Ford West/ December 2014
0
30
60
90
120
150
180
210
0
200
400
600
800
1,000
1,200
1,400
1,600
Jan 09 Jan 12 Jan 15 Jan 18 Jan 21 Jan 24 Jan 27 Jan 30 Jan 33 Jan 36 Jan 39
Dry gas NGL Oil Rig count Wells brought online
Supply outlook: West Eagle Ford Total
Notes: Oil to dry gas conversion ratio is 5.79 Mcfe per barrelSource: IHS Supply Analytics © 2014 IHS
Mbo
e/d
Cou
nt
© 2015 IHS
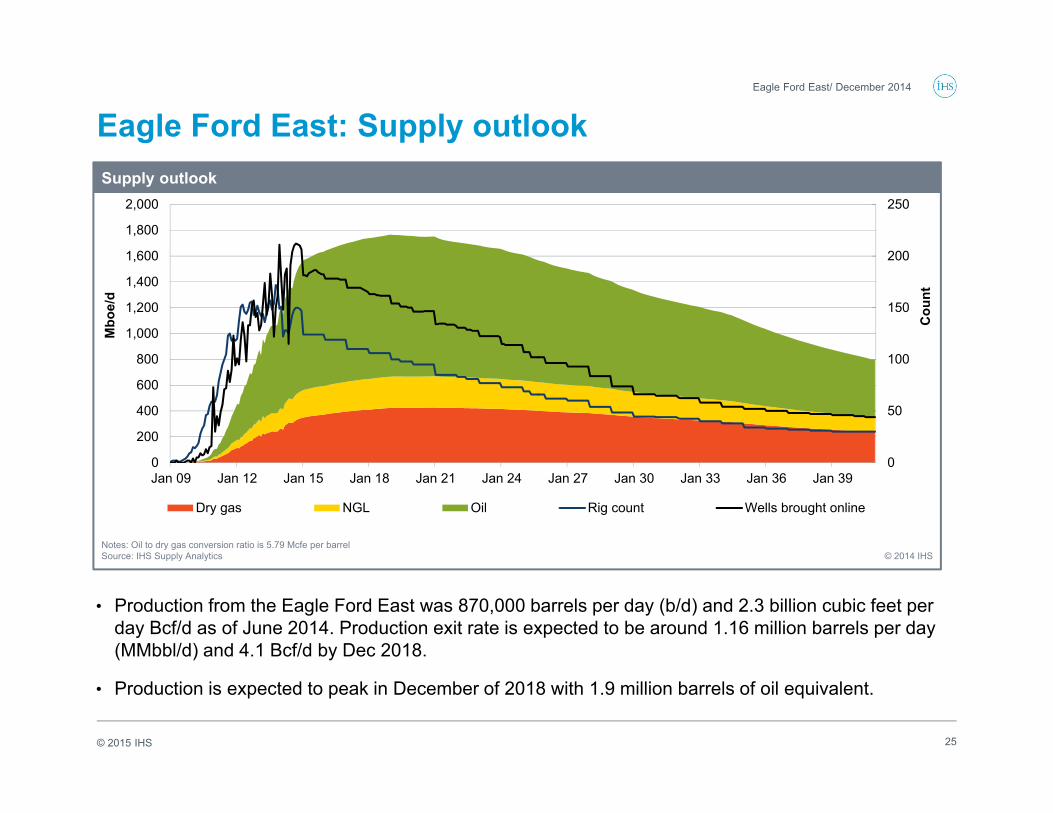
Eagle Ford East: Supply outlook
• Production from the Eagle Ford East was 870,000 barrels per day (b/d) and 2.3 billion cubic feet per day Bcf/d as of June 2014. Production exit rate is expected to be around 1.16 million barrels per day (MMbbl/d) and 4.1 Bcf/d by Dec 2018.
• Production is expected to peak in December of 2018 with 1.9 million barrels of oil equivalent.
25
Eagle Ford East/ December 2014
0
50
100
150
200
250
0
200
400
600
800
1,000
1,200
1,400
1,600
1,800
2,000
Jan 09 Jan 12 Jan 15 Jan 18 Jan 21 Jan 24 Jan 27 Jan 30 Jan 33 Jan 36 Jan 39
Dry gas NGL Oil Rig count Wells brought online
Supply outlook
Notes: Oil to dry gas conversion ratio is 5.79 Mcfe per barrelSource: IHS Supply Analytics © 2014 IHS
Mbo
e/d
Cou
nt
© 2015 IHS
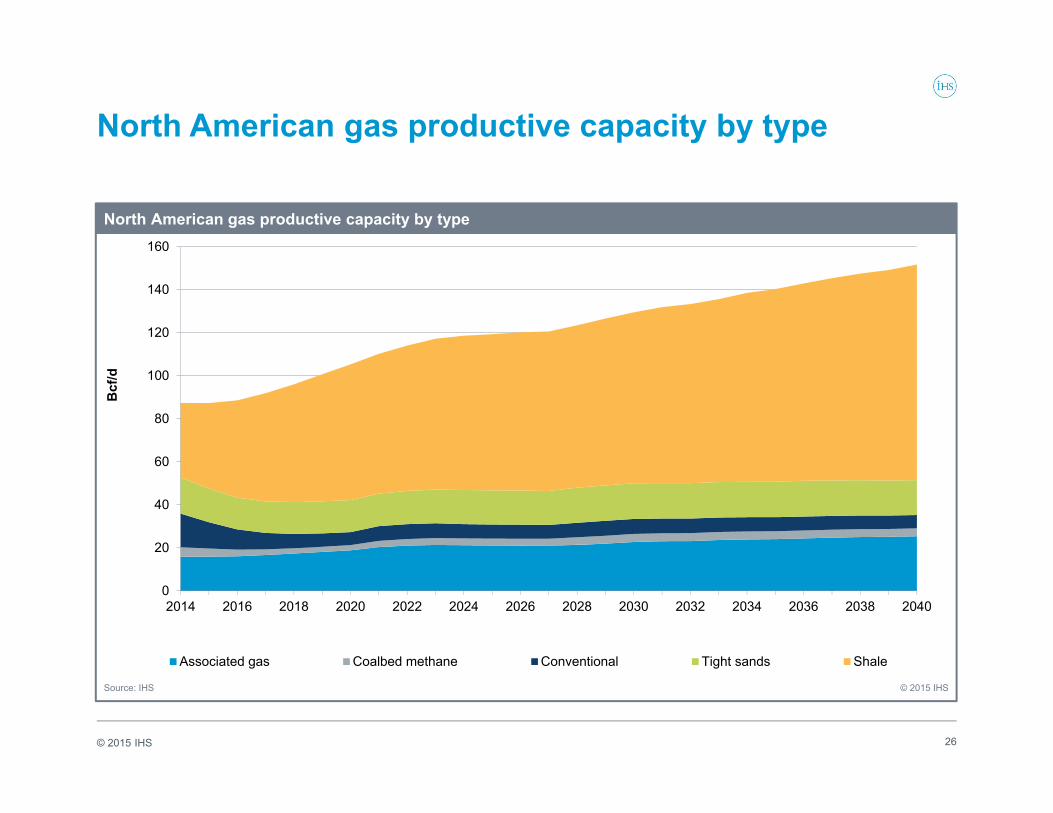
North American gas productive capacity by type
26
0
20
40
60
80
100
120
140
160
2014 2016 2018 2020 2022 2024 2026 2028 2030 2032 2034 2036 2038 2040
Associated gas Coalbed methane Conventional Tight sands Shale
North American gas productive capacity by type
Source: IHS © 2015 IHS
Bcf
/d

© 2015 IHS
North American Gas Production Outlook (Matching Demand Growth) by Geography
27
-
20.00
40.00
60.00
80.00
100.00
120.00
140.00
160.0020
1420
1520
1620
1720
1820
1920
2020
2120
2220
2320
2420
2520
2620
2720
2820
2920
3020
3120
3220
3320
3420
3520
3620
3720
3820
3920
40
Avg
Bcf
d
West Coast
San Juan
Rockies
Permian
Midcontinent
Gulf of Mexico
Gulf Coast
E US
Other Canada
Montney/Horn River
© 2015 IHS
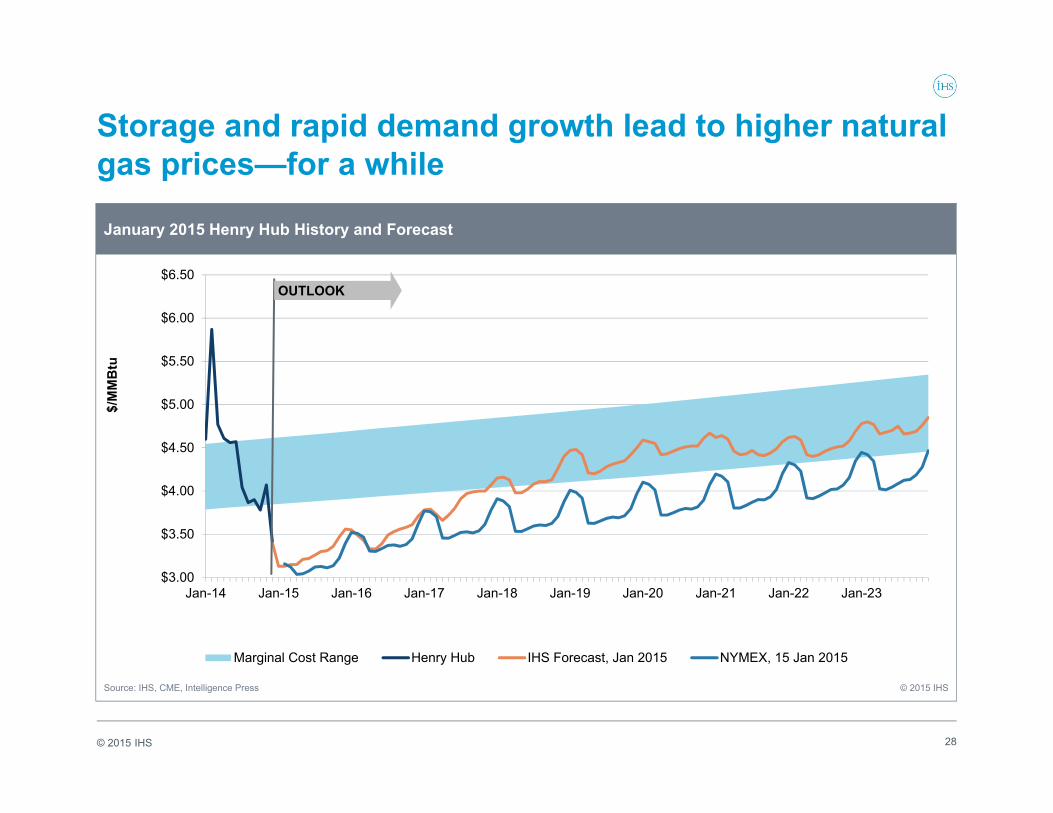
Storage and rapid demand growth lead to higher natural gas prices—for a while
28
$3.00
$3.50
$4.00
$4.50
$5.00
$5.50
$6.00
$6.50
Jan-14 Jan-15 Jan-16 Jan-17 Jan-18 Jan-19 Jan-20 Jan-21 Jan-22 Jan-23
Marginal Cost Range Henry Hub IHS Forecast, Jan 2015 NYMEX, 15 Jan 2015
January 2015 Henry Hub History and Forecast
Source: IHS, CME, Intelligence Press © 2015 IHS
$/M
MB
tu
OUTLOOK