Presentation: Mid Cap Value Strategy
31
J.P. Morgan Mid Cap Value Managed Account 2Q 2021
Transcript of Presentation: Mid Cap Value Strategy

J.P. Morgan Mid Cap Value Managed Account2Q 2021

2
Table of Contents
Capabilities
Mid Cap Value
– Expertise
– Portfolio
– Results
Appendix

3
Capabilities

4
Equities Assets Under ManagementAs of June 30, 2021, J.P. Morgan Asset Management’s Equity teams manage USD 776 billion.
Source: J.P. Morgan Asset Management. Data includes internal Fund of Funds and joint ventures. All figures in USD.
USD 776bn total assets under management
EquitiesEquities
USD 439bn total assets under management
U.S. EquityU.S. Equity
U.S. EquityUSD 439bn
57%
Emerging Markets & Asia Pacific Equity
USD 196bn25%
International Equity GroupUSD 141bn
18%
CoreUSD 100bn
23%
ValueUSD 143bn
32%
StructuredUSD 66bn
15%
GrowthUSD 130bn
30%

5
Expertise

6
An experienced team dedicated to Mid Cap ValueAlso leverages the insights of the J.P. Morgan Equity organization which includes 24 research analysts in the U.S. and over 200 analysts globally
As of June 2021. Years of experience: Industry/Firm
Portfolio Management Team
Jonathan SimonManaging DirectorLead Portfolio Manager
Experience: 41/41
Larry PlayfordManaging DirectorCo-Portfolio Manager
Experience: 28/28
Ryan JonesExecutive DirectorExperience: 15/5
Jeremy MillerExecutive DirectorExperience: 21/5
Investment Specialist Team
John Piccard Executive DirectorExperience: 29/14
Research
Jaime SteinhardtExecutive Director Experience: 11/11
AJ GrewalExecutive DirectorExperience: 22/3
Dennis MorganExecutive DirectorExperience: 27/4
Larry UnreinVice PresidentExperience: 11/11
Jenna SilverVice PresidentExperience: 8/8

7
A team of skilled research analysts with an average of 20 years of experience
Note: Research Analysts Include VP’s and above. As of June 2021. Years of experience: Industry/Firm
David SmallManaging DirectorDirector of U.S. ResearchExperience: 21/16
Robert BowmanManaging DirectorSemis & Technology HardwareExperience: 28/28
Kris EricksonExecutive DirectorMediaExperience: 20/8
Telecom, Media & Technology
Steven WhartonManaging DirectorBanks & Capital MarketsExperience: 26/15
Financials
Brent GdulaExecutive DirectorInsuranceExperience: 13/13
David ChanExecutive DirectorPaymentsExperience: 14/3
Leslie RichManaging DirectorUtilitiesExperience: 28/11
David MaccarroneManaging DirectorEnergy InfrastructureExperience: 26/11
Chris CerasoExecutive DirectorAutos and TransportExperience: 21/8
Industrials
Andrew BrillVice PresidentIndustrial CyclicalsExperience: 18/5
Lerone VincentExecutive Director Basic MaterialsExperience: 23/23
Joanna ShatneyExecutive Director Industrial CyclicalsExperience: 25/7
Nitin BhambhaniManaging DirectorSoftware and SvcsExperience: 28/25
Ryan VineyardManaging DirectorTelecom & CableExperience: 16/9
Lisa S. SadiogluManaging DirectorConsumer CyclicalsExperience: 21/21
Greg FowlkesManaging DirectorRetailExperience: 22/16
Consumer
Laurence McGrathExecutive DirectorHealth Svcs/MedtechExperience: 24/11
Healthcare
Brittany HendersonVice PresidentMedtechExperience: 11/3
Bartjan van HultenExecutive DirectorPharma/BiotechExperience: 25/3
REITs
Jason KoExecutive DirectorREITsExperience: 19/19
Danielle HinesExecutive DirectorAssociate Director of U.S. ResearchExperience: 12/12
Nick TurchettaVice PresidentREITsExperience: 11/1
Aga ZmigrodzkaVice PresidentEnergyExperience: 11/<1
Li BoyntonVice PresidentPharma/BiotechExperience: 7/4
Ryan VineyardManaging DirectorTelecom & CableExperience: 16/9

8
Portfolio

9
Mid Cap Value philosophy
For illustrative purposes only. The manager seeks to achieve the stated objectives. There can be no guarantee the objectives will be met. See Glossary for list of terms and definitions
QUALITY VALUEConsistent
earnings and cash flow
High return on capital
employed
Relatively low cyclicality
Management focused on increasing
intrinsic value per share
P/E
P/B
P/TBV
Free Cash Flow Yield
Enterprise Value/EBITDA
MidCap ValueStrategy
“Our investment philosophy is based on the premise that stock selection, focused onundervalued mid cap companies with durable franchises and strong management,should generate consistent returns with lower levels of volatility over the long term.”
Jonathan SimonLead Portfolio Manager
Larry PlayfordCo-Portfolio Manager

10
Fundamental investment process: Constructing a portfolio of high conviction ideas
For illustrative purposes only. The manager seeks to achieve the stated objectives. There can be no guarantee the objectives will be met.P/E: Price to Earnings. P/B: Price to Book. P/TBV: Price to tangible book value, EBITDA: Earnings before interest, taxes, depreciation, and amortization. See Glossary for list of terms and definitions
Market cap range:
- $3bn to $20bn
Analyst research
Management meetings
Industry conferences
Business Factors– Strong “brand” franchise– High barriers to entry– Low cyclicality of demand
Management Factors– Disciplined use of capital
Financial Factors– Sustainable cash flow– Strong balance sheet– Potential to grow intrinsic value
per share
Bottom up approach
80 – 115 holdings
Portfolio guidelines:– Sectors at 25% or double the
benchmark weight, whichever is greater
– Stocks at max 5% weighting– U.S. Equity
Metrics tailored to each stock:– P/E, P/B, P/TBV– Free cash flow yield– Enterprise
value/EBITDA– Private market value
analysis
FundamentalAnalysis
Valuation Analysis
Portfolio ConstructionIdea Generation
Sell discipline:– Overvaluation by the market– Displacement by a better idea– Company fundamentals have changed

11
Sector positionsJPMorgan Mid Cap Value Portfolio as of June 30, 2021
Source: J.P. Morgan Asset Management, Frank Russell Company, Wilshire Atlas (excludes cash). For illustrative purposes only. 1Reflects relative position to the benchmark Russell Midcap Value Index. The Portfolio is an actively managed. Holdings, sector weights, allocations and leverage, as applicable are subject to change at the discretion of the Investment Manager without notice.
Benchmark Russell Midcap Value Index
Absolute & relative sector weightings (%)Absolute & relative sector weightings (%)
22.7
14.1
11.5 10.8
8.67.6 6.9
5.34.2 4.1 4.1
0
5
10
15
20
25
Financials Industrials ConsumerDiscretionary
RealEstate
InformationTechnology
Utilities HealthCare
Materials CommunicationServices
ConsumerStaples
Energy
Relative wgt (%) 6.6 -2.0 0.6 0.3 -1.1 0.6 -1.9 -2.0 0.0 -0.1 -1.0

12
Top 5 overweights¹ Portfolioweight (%)
Relative position (%)1
Ameriprise Financial 1.81 1.62
Loews 1.54 1.37
Huntington Bancshares 1.65 1.36
Diamondback Energy 1.45 1.33
Carlisle 1.39 1.31
Portfolio positions
1Reflects relative position to the Russell Midcap Value Index.Source: J.P. Morgan Asset Management, Frank Russell Company, Wilshire Atlas (excludes cash). Holdings and allocations are subject to change at the discretion of the Investment Manager without notice.The inclusion of the securities mentioned above is not to be interpreted as recommendations to buy or sell. For illustrative purposes only.
Top 5 underweights¹ Portfolioweight (%)
Relative position (%) 1
Twitter 0.00 -0.68
Marvell Technology 0.00 -0.67
IHS Markit 0.00 -0.59
Alexion Pharmaceuticals 0.00 -0.57
Prudential Financial 0.00 -0.57
Top 10 Holdings Portfolioweight (%)
Ameriprise Financial 1.81
Huntington Bancshares 1.65
Liberty Broadband 1.65
Motorola Solutions 1.61
Fifth Third Bancorp 1.56
Xcel Energy 1.54
Loews 1.54
Laboratory Corporation Of America 1.54
AutoZone 1.53
M&T Bank 1.47
Total 15.89
Benchmark Russell Midcap Value IndexJPMorgan Mid Cap Value Portfolio as of June 30, 2021

13
Portfolio characteristics
Source: J.P. Morgan Asset Management, Frank Russell Company, BARRA, Wilshire Atlas (excludes cash). The above characteristics are shown for illustrative purposes only, and are subject to changewithout notice. Representative the current portfolio holdings. However, it cannot be assumed that these types of investments will be available to or will be selected by the portfolio in the future.1Consensus 12 month forward estimate. 2Consensus 1-5 year forward estimate. 3USD. 4Trailing 12 months. 5Trailing 5 years (Annualized). See Glossary for list of terms and definitions.
Benchmark Russell Midcap Value Index
-0.10
-0.08
-0.05
-0.03
-0.01
0.04
0.05
0.09
0.16
Leverage
Earnings Variation
Currency Sensitivity
Size
Growth
Momentum
Yield
Earnings Yield
Value
Portfolio Portfolio BenchmarkP/E Ratio1 16.4x 16.9xEPS Growth2 15.0% 14.4%Average Market Cap3 $19.6 bn $20.5 bnNumber of Holdings 114 686Active Share 79.7% N/AROE4 12.4% 10.8%ROIC4 7.6% 8.0%Standard Deviation5 18.4% 18.6%Turnover5 15.3% N/ATracking Error5 2.40 N/ABeta5 0.98 1.00
Market capitalizationMarket capitalization
BARRA tilts relative to benchmarkBARRA tilts relative to benchmark
31%
43%
20%
6%
36%42%
19%
4%
> USD 25 Bn USD 10 - 25 Bn USD 5 - 10 Bn < USD 5 Bn
Portfolio Benchmark
JPMorgan Mid Cap Value Portfolio as of June 30, 2021
14
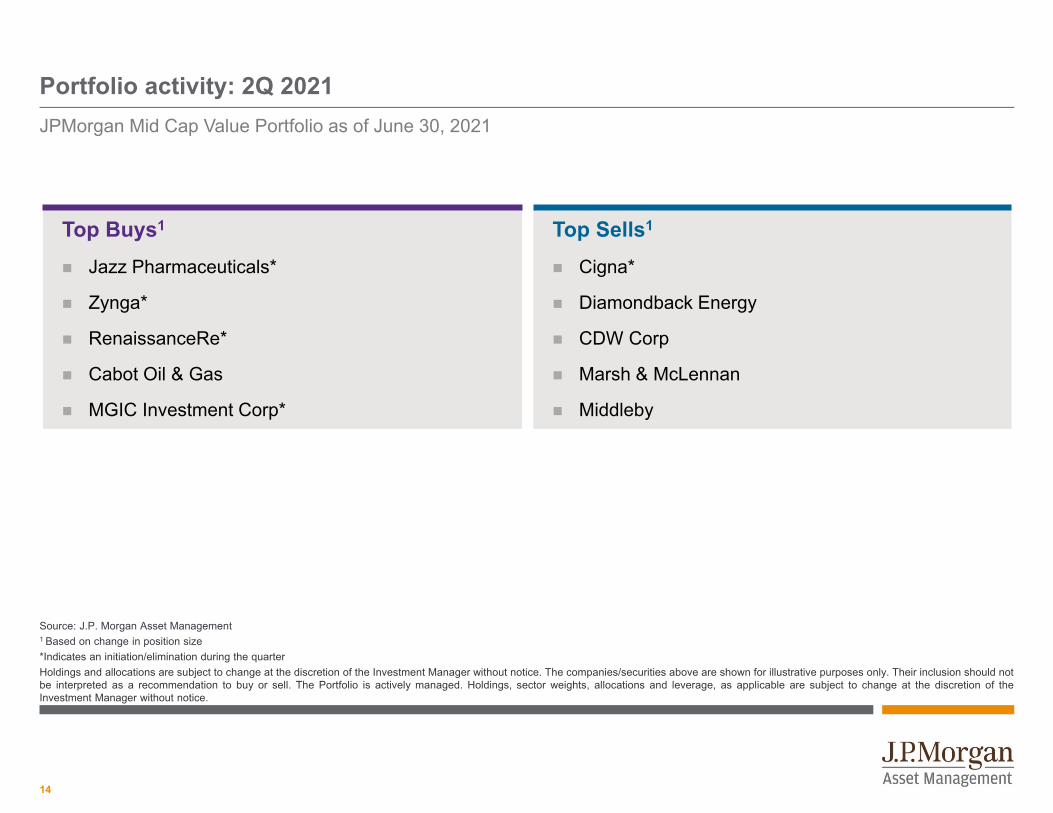
Portfolio activity: 2Q 2021
Source: J.P. Morgan Asset Management1 Based on change in position size*Indicates an initiation/elimination during the quarterHoldings and allocations are subject to change at the discretion of the Investment Manager without notice. The companies/securities above are shown for illustrative purposes only. Their inclusion should notbe interpreted as a recommendation to buy or sell. The Portfolio is actively managed. Holdings, sector weights, allocations and leverage, as applicable are subject to change at the discretion of theInvestment Manager without notice.
Top Buys1
Jazz Pharmaceuticals*
Zynga*
RenaissanceRe*
Cabot Oil & Gas
MGIC Investment Corp*
Top Sells1
Cigna*
Diamondback Energy
CDW Corp
Marsh & McLennan
Middleby
JPMorgan Mid Cap Value Portfolio as of June 30, 2021

15
Results

16
PerformanceJPMorgan Mid Cap Value SMA Composite as of June 30, 2021
Past performance is not a guarantee of comparable future results. Total return assumes the reinvestment of income. Performance results are gross ofinvestment management fees. The deduction of an advisory fee reduces an investor’s return. Actual account performance will vary depending onindividual portfolio security selection and the applicable fee schedule. Fees are described in Part II of the Advisor’s ADV which is available upon request.Please see back page for additional disclosure.Source: J.P. Morgan Asset Management, Frank Russell Company. Note: Rates of return for periods less than one year are not annualized. *Preliminary figures
Annualized performance * (%) 2Q 2021 YTD 2021 1 year 3 years 5 years 10 YearsSince
Inception(11/30/1988)
Mid Cap Value SMA Composite (Gross) 5.50 21.66 51.67 12.13 11.69 12.51 15.14
Mid Cap Value SMA Composite (Net of max. allowable fees – 300bps)* 4.70 19.82 47.12 8.76 8.34 9.13 11.72
Russell Mid Cap Value Index 5.66 19.45 53.06 11.86 11.79 11.75 11.83
Excess return (Gross) -0.16 2.21 -1.39 0.27 -0.10 0.76 3.31
Calendar year performance (%) 2011 2012 2013 2014 2015 2016 2017 2018 2019 2020
Mid Cap Value SMA Composite (Gross) 3.00 20.41 32.47 15.74 -1.50 15.42 14.38 -10.61 26.78 2.48
Mid Cap Value SMA Composite (Net of max. allowable fees – 300bps)* -0.05 17.00 28.80 12.43 -4.44 12.11 11.10 -13.29 22.97 -0.59
Russell Mid Cap Value Index -1.38 18.51 33.46 14.75 -4.78 20.00 13.34 -12.29 27.06 4.96
Excess return (Gross) 4.38 1.90 -0.99 0.99 3.28 -4.58 1.04 1.68 -0.28 -2.48
Market value USD (6/30/2021)
Strategy* USD 22,265 mm
Market value USD (6/30/2021)
Strategy* USD 22,265 mm
Supplemental to Annual Performance Report

17
Performance attribution: 2Q 2021
Past performance is no guarantee of future results. Source: J.P. Morgan Asset Management, Frank Russell Company, Wilshire Atlas (excludes cash). The securities highlighted abovehave been selected based on their significance and are shown for illustrative purposes only. They are not recommendations. The portfolio is an actively managed. Holdings, sector weights, allocations andleverage, as applicable are subject to change at the discretion of the Investment Manager without notice.
Stock attribution
0.7%
0.1%0.2%
0.0% 0.0% 0.1%
0.0% 0.0% -0.1%
-0.3%
-0.7%
0.1% 0.1%
0.0%
0.0% 0.0%
0.0% 0.0% 0.0% 0.0% 0.0%
0.1%
InformationTechnology
Industrials CommunicationServices
RealEstate
ConsumerDiscretionary
Energy Utilities ConsumerStaples
Materials HealthCare
Financials
Stock Selection Sector Selection
Stock selection vs sector selection
Top contributors Ending weight (%)
Stock return (%) Impact (%) Top detractors Ending
weight (%)Stock
return (%) Impact (%)
Diamondback Energy 1.45 28.40 0.42 Discovery Communications 0.00 -22.85 -0.09
NortonLifeLock 1.24 28.60 0.29 Huntington Bancshares 1.65 -8.28 -0.09
Carlisle 1.39 16.60 0.24 Southwest Airlines 0.48 -13.05 -0.08
Discover Financial 1.12 25.01 0.23 Hartford Financial 0.92 -6.72 -0.07
Liberty Broadband 1.65 15.66 0.23 WEC Energy 1.24 -4.29 -0.06
JPMorgan Mid Cap Value Portfolio as of June 30, 2021 AttributionSummary
Stock: 0.05Sector: 0.10
Benchmark Russell Midcap Value Index

18
Performance attribution: YTD 2021
Past performance is no guarantee of future results. Source: J.P. Morgan Asset Management, Frank Russell Company, Wilshire Atlas (excludes cash). The securities highlighted abovehave been selected based on their significance and are shown for illustrative purposes only. They are not recommendations. The portfolio is an actively managed. Holdings, sector weights, allocations andleverage, as applicable are subject to change at the discretion of the Investment Manager without notice.
Stock attribution
0.9% 0.8%
0.5% 0.5%0.3% 0.3% 0.2%
-0.4%
0.0% -0.1%
-0.6%
0.1%
0.0%
0.1% 0.0%0.2%
0.0%
-0.1%
0.5%
0.0% 0.0% -0.1%
InformationTechnology
ConsumerDiscretionary
Industrials RealEstate
CommunicationServices
HealthCare
Energy Financials ConsumerStaples
Utilities Materials
Stock Selection Sector Selection
Stock selection vs sector selection
Top contributors Average weight (%)
Stock return (%) Impact (%) Top detractors Average
weight (%)Stock
return (%) Impact (%)
Diamondback Energy 1.60 96.01 1.20 Ball 0.78 -6.93 -0.07
Discovery Communications 0.64 8.67 0.68 Edison International 0.42 -12.74 -0.07
Fifth Third Bancorp 1.63 40.64 0.59 RenaissanceRe 0.19 -9.59 -0.06
Acuity Brands 1.09 54.74 0.55 MGIC Investment 0.12 -5.65 -0.04
The Gap 0.92 67.98 0.53 Pactiv Evergreen 0.03 -12.02 -0.03
JPMorgan Mid Cap Value Portfolio as of June 30, 2021 AttributionSummary
Stock: 2.48Sector: 0.68
Benchmark Russell Midcap Value Index

19
Executive summaryJ.P. Morgan Mid Cap Value Strategy as of March 31, 2021
Past performance is not a reliable indicator of current and future results.Source: J.P. Morgan Asset Management, eVestment. Strategy inception: 11/30/1988. * The J.P. Morgan Mid Cap Value Strategy is ranked in the eVestment Mid Cap Value category.
The eVestment ranking is a percentile ranking based on the funds/products annualized return (gross of fees). See Appendix II for full percentile ranking information.
Expertise
An experienced team dedicated to value Consistent implementation of the same philosophy and process since the Strategy’s inception in 1988.
Lead PM Jonathan Simon and co PM Larry Playford have worked together for over a decade. They are supported by five dedicated research analysts; through their deep understanding of the investment philosophy and process, they are able to provide company specific insights.
Leveraging fundamental insights of our team of over 20 US Equity career analysts who average 21 years investment experience
PortfolioAn emphasis on quality and consistent absolute returns Our investment philosophy is based on the premise that stock selection, focused on undervalued mid cap companies with durable
franchises and strong management teams, should generate consistent absolute returns with lower levels of volatility over the long term
Mid Cap Value is a low beta approach, focused on conservative, high quality companies
Results
Mid Cap Value has received broad industry recognition for its strong long term absolute and risk adjusted results Generated lower volatility than the market with less exposure to the downside
1st percentile excess returns, information ratio, and Sharpe ratio since inception*
Lead portfolio manager Jonathan Simon has been named to Barron’s list of top 100 portfolio managers on 5 occasions.

20
Appendix

21
Key Takeaways: Mid Cap ValueJ.P. Morgan Mid Cap Value Strategy, trailing 10 years data as of March 31, 2021
Past performance is no guarantee of future results. Percentile rankings relative to the eVestment Mid Cap Value peer group using the Russell Mid Cap Value Index as a benchmark.
Supplemental to standardized performance. The eVestment ranking is a percentile ranking based on the products’ annualized returns (gross of fees) within its applicable PeerUniverse. Ranking is calculated based on total return. Rating, risk, and return values are relative to each eVestment Mid Cap Value Category. See Appendix II for fullpercentile ranking information. Past performance is no guarantee of future results. * Risk is measured by standard deviation – a gauge of the variance of a manager'sreturn over its average or mean. ** Down capture measures performance of the manager relative to the index in down markets. *** Consistency is measured by batting average –calculated by dividing the number of months in which the manager beats or matches the index by the total number of months in the period. MCV: Mid Cap Value.
Strong risk adjusted resultsStrong risk adjusted results0.75
0.61
J.P. Morgan Mid Cap Value eVestment MCV Median
with less volatilitywith less volatility
15.40
16.10
16.98
J.P. Morgan Mid CapValue
Russell Midcap ValueIndex
eVestment MCVMedian
11th percentile Standard Deviation11th percentile Sharpe Ratio
and better potential downside captureand better potential downside capture
90%
101%
J.P. Morgan Mid Cap Value eVestment MCV Median
8th percentile Downside Market Capture
leading to consistent outperformanceleading to consistent outperformance
55%50%
J.P. Morgan Mid Cap Value eVestment MCV Median
16th percentile Batting Average

22
Value is not a tactical trade, but a long term strategic allocation
Decade of VALUE Decade of GROWTH It all evens out!
10 years ended June ‘11 10 years ended June ‘21 20 years ended June ‘21
Total Return
Standard Deviation
Sharpe Ratio
Total Return
Standard Deviation
Sharpe Ratio
Total Return
Standard Deviation
Sharpe Ratio
Russell 1000 Value Index 3.99 16.25 0.20 11.61 14.44 0.79 7.73 15.37 0.46
Russell 1000 Growth Index 2.24 16.61 0.10 17.87 14.45 1.17 9.78 15.66 0.59
Russell Mid Cap Value Index 8.42 18.21 0.43 11.75 16.11 0.74 10.07 17.16 0.57
Russell Mid Cap Growth Index 5.52 20.21 0.27 15.13 16.06 0.92 10.22 18.25 0.55
Difference 2.90 -3.41
Russell 2000 Value Index 7.53 20.31 0.36 10.85 19.29 0.60 9.17 19.77 0.48
Russell 2000 Growth Index 4.63 22.29 0.23 13.52 19.28 0.73 8.99 20.82 0.46
Source: Morningstar Direct, J.P. Morgan Asset Management. Data as of 6/30/2021. Past performance is no guarantee of future results. Please see Glossary for list ofterms and definitions.
THE SWEET SPOT Mid Cap Value offers better returns than Large Cap
Value, but with less volatility than Small Cap Value
Style cycles dominate the short/intermediate term, but not the long run

23
Asset Management & Custody Banks, 5.1%
Consumer Finance, 1.1%
Diversified Finance & Other, 0.9%
Investment Banking & Brokage, 1.3%
Other Insurance, 3.1%P&C Insurance, 3.3%
Regional Banks, 7.9%
Financials Weight: 22.7%
Financials: opportunities to add value in different rate environments
Source: J.P. Morgan Asset Management, Wilshire Atlas (excludes cash). See Glossary for list of terms and definitions
JPMorgan Mid Cap Value Portfolio as of June 30, 2021

24
EnvironmentsJ.P. Morgan Mid Cap Value Strategy
Past performance is no guarantee of future results. Please see Glossary for list of terms and definitions.
Economic growth indicators are decelerating or declining
Less economically sensitive equities outperforming
Declining credit availability for levered balance sheets.
Environments in which the portfolio tends to outperform
Environments in which the portfolio tends to underperform Economic growth indicators are inflecting positively or
accelerating
Economically sensitive and/or cyclical sectors outperforming
Abundant credit availability for levered balance sheets
Example: 2005/2006 vs. 2007/2008
Mid Cap Value lagged in a market driven by global cyclicals; however,investing in quality companies allowed us to hold up much better duringthe downturn.
Example: 2005/2006 vs. 2007/2008
Mid Cap Value lagged in a market driven by global cyclicals; however,investing in quality companies allowed us to hold up much better duringthe downturn.
-2.4% -2.1%
5.0% 6.1%
2005 2006 2007 2008
Excess Return
Markets can be cyclical, but we stick to our to our disciplined investment approach

25
-20
-10
0
10
20
30
40
-50 -30 -10 10 30 50 70
MCV excess return vs. the Russell MCV Index - rolling 1 year periods
Russell MCV Index Return
Russell MCV positive/MCV excess negative
Russell MCV negative/MCV excess positive Russell MCV positive/MCV excess positiveJPM MCV Excess Return
Russell MCV negative/MCV excess negative
It’s not just about whether equities are up, but the magnitude of equity returns
Past performance is not indicative of future results.As of 06/30/2021. Source: J.P. Morgan Asset Management; J.P. Morgan Mid Cap Value Strategy inception: 11/30/1988. See Glossary for list of terms and definitions
26
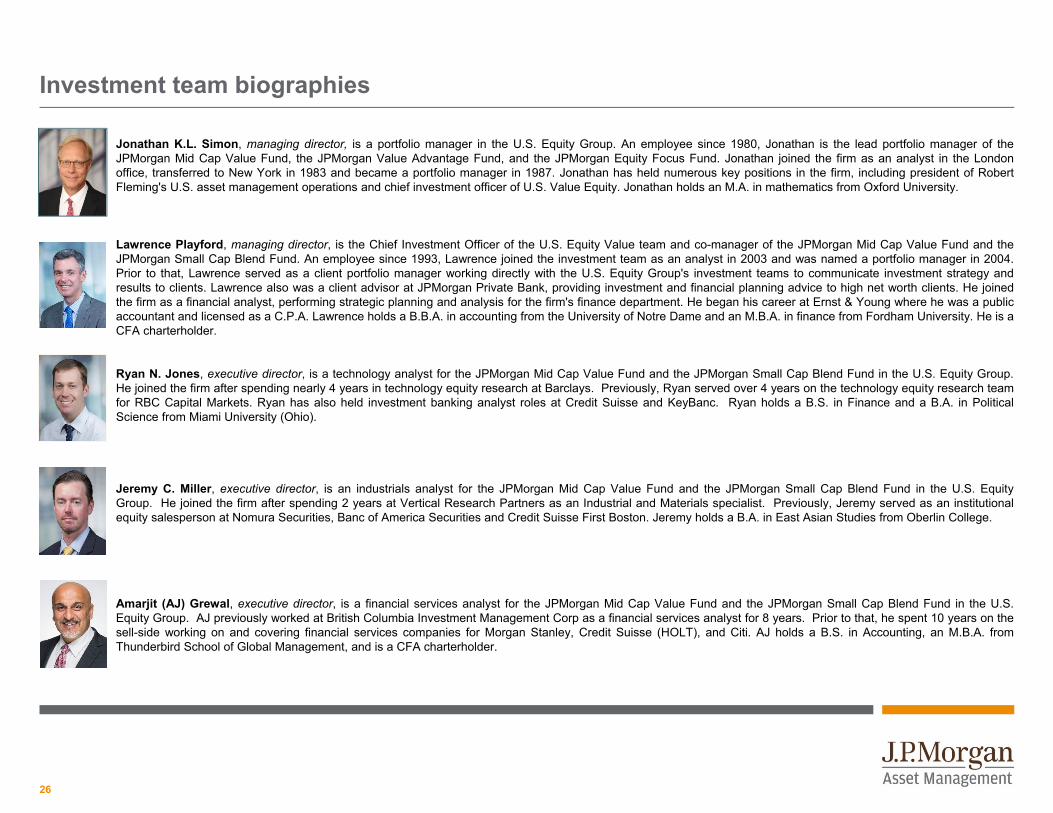
Investment team biographies
Jonathan K.L. Simon, managing director, is a portfolio manager in the U.S. Equity Group. An employee since 1980, Jonathan is the lead portfolio manager of theJPMorgan Mid Cap Value Fund, the JPMorgan Value Advantage Fund, and the JPMorgan Equity Focus Fund. Jonathan joined the firm as an analyst in the Londonoffice, transferred to New York in 1983 and became a portfolio manager in 1987. Jonathan has held numerous key positions in the firm, including president of RobertFleming's U.S. asset management operations and chief investment officer of U.S. Value Equity. Jonathan holds an M.A. in mathematics from Oxford University.
Lawrence Playford, managing director, is the Chief Investment Officer of the U.S. Equity Value team and co-manager of the JPMorgan Mid Cap Value Fund and theJPMorgan Small Cap Blend Fund. An employee since 1993, Lawrence joined the investment team as an analyst in 2003 and was named a portfolio manager in 2004.Prior to that, Lawrence served as a client portfolio manager working directly with the U.S. Equity Group's investment teams to communicate investment strategy andresults to clients. Lawrence also was a client advisor at JPMorgan Private Bank, providing investment and financial planning advice to high net worth clients. He joinedthe firm as a financial analyst, performing strategic planning and analysis for the firm's finance department. He began his career at Ernst & Young where he was a publicaccountant and licensed as a C.P.A. Lawrence holds a B.B.A. in accounting from the University of Notre Dame and an M.B.A. in finance from Fordham University. He is aCFA charterholder.
Ryan N. Jones, executive director, is a technology analyst for the JPMorgan Mid Cap Value Fund and the JPMorgan Small Cap Blend Fund in the U.S. Equity Group.He joined the firm after spending nearly 4 years in technology equity research at Barclays. Previously, Ryan served over 4 years on the technology equity research teamfor RBC Capital Markets. Ryan has also held investment banking analyst roles at Credit Suisse and KeyBanc. Ryan holds a B.S. in Finance and a B.A. in PoliticalScience from Miami University (Ohio).
Jeremy C. Miller, executive director, is an industrials analyst for the JPMorgan Mid Cap Value Fund and the JPMorgan Small Cap Blend Fund in the U.S. EquityGroup. He joined the firm after spending 2 years at Vertical Research Partners as an Industrial and Materials specialist. Previously, Jeremy served as an institutionalequity salesperson at Nomura Securities, Banc of America Securities and Credit Suisse First Boston. Jeremy holds a B.A. in East Asian Studies from Oberlin College.
Amarjit (AJ) Grewal, executive director, is a financial services analyst for the JPMorgan Mid Cap Value Fund and the JPMorgan Small Cap Blend Fund in the U.S.Equity Group. AJ previously worked at British Columbia Investment Management Corp as a financial services analyst for 8 years. Prior to that, he spent 10 years on thesell-side working on and covering financial services companies for Morgan Stanley, Credit Suisse (HOLT), and Citi. AJ holds a B.S. in Accounting, an M.B.A. fromThunderbird School of Global Management, and is a CFA charterholder.

27
Investment team biographies
Dennis K. Morgan, executive director, is a consumer analyst for the JPMorgan Mid Cap Value Fund and the JPMorgan Small Cap Blend Fund in the U.S. Equity Group.Dennis previously worked at Lord Abbett, spending nearly 11 years covering consumer discretionary and staples companies across mid, small and micro-capitalizationranges. Prior to joining Lord Abbett in 2008, Dennis was an equity research analyst at Neuberger Berman from 1999-2008 where he was responsible for covering variousconsumer and media companies across mid and large-capitalization ranges. His prior work experience also included working at Bear Stearns as a research associatecovering the broadcasting industry and as a research analyst for Dreman Value Advisors. Dennis holds a B.S. in Business Administration with a concentration in Financefrom The College of New Jersey, and is CFA charterholder.
Larry Unrein, vice president, is a health care analyst for the JPMorgan Mid Cap Value Fund and the JPMorgan Small Cap Blend Fund in the U.S. Equity Group. Anemployee since 2011, Larry previously covered various sectors including consumer, autos, and transportation. Larry holds a B.S. in both Accounting and Finance fromGeorgetown University.
Jaime H. Steinhardt, executive director, is an investment specialist within the U.S. Equity Group. An employee since 2012, Jaime is the head of the investment specialistteam that is responsible for communicating investment performance, outlook, and strategy positioning to institutional and funds clients for the firm’s U.S. Equity Valueplatform. She holds a B.A. in economics from Georgetown University and holds the Series 7 and 63 licenses. She is a member of both the New York Society of SecurityAnalysts and the CFA Institute, and a CFA charterholder.
John P. Piccard, executive director, is an investment specialist in the U.S. Equity Group. He rejoined the firm after spending 10 years at Lord, Abbett & Co. as a portfoliomanager and research analyst. Previously, John served as a portfolio manager at J.P. Morgan Investment Management. He originally joined the firm as an associate inasset-liability and proprietary portfolio management. John holds a B.A. in economics and philosophy from Fordham University and an M.A. in Economics from New YorkUniversity. He is a CFA charterholder.
Jenna B. Silver, vice president, is an investment specialist in the U.S. Equity Group. An employee since 2013, Jenna is responsible for communicating investmentperformance, outlook, and strategy positioning to institutional and funds clients for the firm’s U.S. Equity Value platform. Jenna previously worked in Asset Management'sProduct Strategy team, focusing on the fixed income landscape, industry trends, product development, and competitive positioning. Jenna holds a B.B.A. in Finance andStrategy from the University of Michigan, Stephen M. Ross School of Business. She also holds the Series 7 and 63 licenses and is a CFA charterholder.

28
Mid Cap Value Managed Account CompositeDecember 31, 2019
29
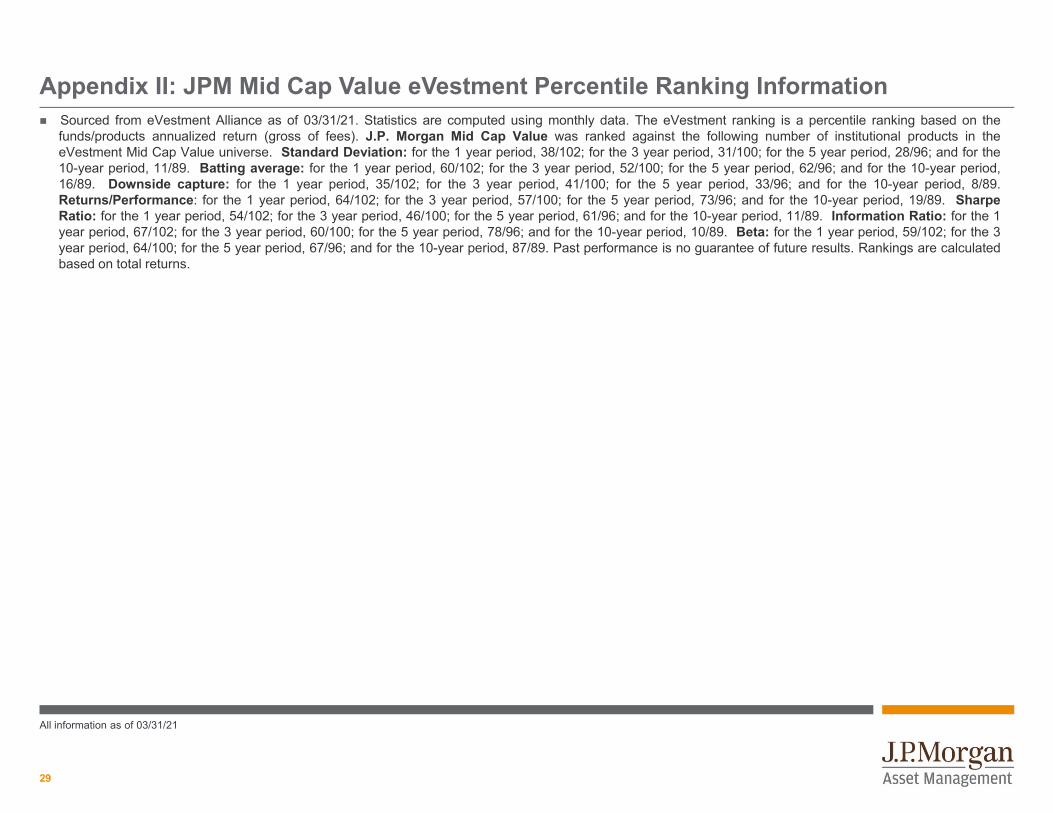
Appendix II: JPM Mid Cap Value eVestment Percentile Ranking Information Sourced from eVestment Alliance as of 03/31/21. Statistics are computed using monthly data. The eVestment ranking is a percentile ranking based on the
funds/products annualized return (gross of fees). J.P. Morgan Mid Cap Value was ranked against the following number of institutional products in theeVestment Mid Cap Value universe. Standard Deviation: for the 1 year period, 38/102; for the 3 year period, 31/100; for the 5 year period, 28/96; and for the10-year period, 11/89. Batting average: for the 1 year period, 60/102; for the 3 year period, 52/100; for the 5 year period, 62/96; and for the 10-year period,16/89. Downside capture: for the 1 year period, 35/102; for the 3 year period, 41/100; for the 5 year period, 33/96; and for the 10-year period, 8/89.Returns/Performance: for the 1 year period, 64/102; for the 3 year period, 57/100; for the 5 year period, 73/96; and for the 10-year period, 19/89. SharpeRatio: for the 1 year period, 54/102; for the 3 year period, 46/100; for the 5 year period, 61/96; and for the 10-year period, 11/89. Information Ratio: for the 1year period, 67/102; for the 3 year period, 60/100; for the 5 year period, 78/96; and for the 10-year period, 10/89. Beta: for the 1 year period, 59/102; for the 3year period, 64/100; for the 5 year period, 67/96; and for the 10-year period, 87/89. Past performance is no guarantee of future results. Rankings are calculatedbased on total returns.
All information as of 03/31/21

30
Glossary of investment termsActive Share - a measure of the percentage of stock holdings in a manager's portfolio that differs from the benchmark index.
Alpha - The amount of return expected from an investment from its inherent value.
Information ratio (IR) – A ratio of portfolio returns above the returns of a benchmark to the volatility of those returns.
Bottom-up investing - an investment approach that focuses on the analysis of individual stocks and de-emphasizes the significance of macroeconomic cycles and market cycles.
Barra Risk Factor Analysis – A multi-factor model, created by Barra Inc., used to measure the overall risk associated with a security relative to market performance. The model incorporates >40 data metrics and measures risk factors via three main components: industry risk, company-specific risk and risks from exposure to investment themes.
Beta - A measurement of volatility where 1 is neutral; above 1 is more volatile; and less than 1 is less volatile.
Down-Market Capture - a statistical measure of an investment manager's overall performance in down-markets.
Earnings Per Share (EPS) - The portion of a company's profit allocated to each outstanding share of common stock. EPS serves as an indicator of a company's profitability.
Excess Return (ER) – portfolio returns achieved above and beyond the return of its benchmark.
Free cash flow yield - a financial solvency ratio that compares the free cash flow per share a company is expected to earn against its market value per share. The ratio is calculated by taking the free cash flow per share divided by the current share price.
Fundamental analysis - attempts to measure a security's intrinsic value by examining related economic and financial factors including the balance sheet, strategic initiatives, microeconomic indicators, and consumer behavior.
Growth investing - Investment strategy that focuses on stocks of companies and stock funds where earnings are growing rapidly and are expected to continue growing.
Large-cap - The market capitalization of the stocks of companies with market values greater than $10 billion.
Mid-cap - The market capitalization of the stocks of companies with market values between $3 to $10 billion.
Performance attribution - a set of techniques that performance analysts use to explain why a portfolio's performance differed from the benchmark.
Price/Earnings (P/E) 12-month forward - price of a stock divided by its projected earnings for the coming year.
Small-cap - The market capitalization of the stocks of companies with market values less than $3 billion.
Tracking Error (TE) - The active risk of the portfolio. It determines the annualized standard deviation of the excess returns between the portfolio and the benchmark.
Turnover Ratio - Percentage of holdings in a mutual fund that are sold in a specified period.
Up-Market Capture – a statistical measure of an investment manager's overall performance in up-markets.
Valuation - An estimate of the value or worth of a company; the price investors assign to an individual stock.
Value investing - A strategy whereby investors purchase equity securities that they believe are selling below estimated true value. The investor can profit by buying these securities then selling them once they appreciate to their real value.
Weighted Average Market Capitalization - Most indexes are constructed by weighting the market capitalization of each stock on the index. In such an index, larger companies account for a greater portion of the index. An example is the S&P 500 Index.

31
J.P. Morgan Asset ManagementNOT FDIC INSURED | NO BANK GUARANTEE | MAY LOSE VALUE This is a general communication being provided for informational purposes only. It is educational in nature and not designed to be a recommendation for any specific investment product, strategy, plan feature or other purpose. Any examples used are generic, hypothetical and for illustration purposes only. Prior to making any investment or financial decisions, an investor should seek individualized advice from personal financial, legal, tax and other professionals that take into account all of the particular facts and circumstances of an investor’s own situation.Opinions, estimates, forecasts, and statements of financial market trends that are based on current market conditions constitute our judgment and are subject to change without notice. We believe the information provided here is reliable. These views and strategies described may not be suitable for all investors. References to specific securities, asset classes and financial markets are for illustrative purposes only and are not intended to be, and should not be interpreted as, recommendations. Past performance is no guarantee of future results.RISK SUMMARY: The price of equity securities may rise or fall because of changes in the broad market or changes in a company’s financial condition, sometimes rapidly or unpredictably. These price movements may result from factors affecting individual companies, sectors or industries selected for the portfolio or the securities market as a whole, such as changes in economic or political conditions. Equity securities are subject to “stock market risk” meaning that stock prices in general (or in particular, the prices of the types of securities in which a portfolio invests) may decline over short or extended periods of time. When the value of a portfolio’s securities goes down, an investment in a fund decreases in value. There is no guarantee that the use of long and short positions will succeed in limiting the Fund's exposure to domestic stock market movements, capitalization, sector-swings or other risk factors. Investment in a portfolio involved in long and short selling may have higher portfolio turnover rates. This will likely result in additional tax consequences. Short selling involves certain risks, including additional costs associated with covering short positions and a possibility of unlimited loss on certain short sale positions.
There can be no assurance that the professionals currently employed by JPMAM will continue to be employed by JPMAM or that the past performance or success of any such professional serves as an indicator of such professional’s future performance or success.
Any securities/portfolio holdings mentioned throughout the presentation are shown for illustrative purposes only and should not be interpreted as recommendations to buy or sell. A full list of firm recommendations for the past year are available upon request.
Past performance does not guarantee future results. Total returns assumes reinvestment of any income. The deduction of an advisory fee reduces an investor’s return. Actual account performance will vary on individual portfolio security selection and the applicable fee schedule. Fees are available upon request.
The following is an example of the effect of compounded advisory fees over a period of time on the value of a client’s portfolio: A portfolio with a beginning value of $100 million, gaining an annual return of 10% per annum would grow to $259 million after 10 years, assuming no fees have been paid out. Conversely, a portfolio with a beginning value of $100 million, gaining an annual return of 10% per annum, but paying a fee of 1% per annum, would only grow to $235 million after 10 years. The annualized returns over the 10 year time period are 10.00% (gross of fees) and 8.91% (net of fees). If the fee in the above example was 0.25% per annum, the portfolio would grow to $253 million after 10 years and return 9.73% net of fees. The fees were calculated on a monthly basis, which shows the maximum effect of compounding.Securities may be sold through J.P. Morgan Institutional Investments Inc., member FINRA. Telephone calls and electronic communications may be monitored and/or recorded. Personal data will be collected, stored and processed by J.P. Morgan Asset Management in accordance with our privacy policies at https://www.jpmorgan.com/privacy
J.P. Morgan Asset Management is the marketing name for the asset management businesses of JPMorgan Chase & Co. and its affiliates worldwide. Those businesses include, but are not limited to, J.P. Morgan Investment Management Inc., Security Capital Research & Management Incorporated, J.P. Morgan Alternative Asset Management, Inc., and J.P. Morgan Asset Management (Canada), Inc.
For U.S. Only: If you are a person with a disability and need additional support in viewing the material, please call us at 1-800-343-1113 for assistance.Copyright 2021 JPMorgan Chase & Co. All rights reserved.
0903c02a8258c6f0