Resistencia de Estruturas CSR Bulk Carrier, Consolidated Effective as of 1 July 2012 Pdf1808
Presentation Meeting of Consolidated Financial Results
for the Six Months Ended September 30, 2016
November 9 , 2016
Note: The following report is an English translation of the Japanese-language original.
Japan Petroleum Exploration Co .,Ltd.
2
Any information contained herein with respect to JAPEX’s plans, forecasts, strategies and other statements that are not historical facts are forward-looking statements about the future performance of JAPEX. Readers should be aware that the actual results and events may be different from these projections because of various factors that could occur in the future.
The provision of this document should not be construed as a solicitation for investment.
Copyright : All information contained herein is protected by copyright, and may not be copied or reproduced without prior consent of JAPEX.
Note: Abbreviations used herein are as follows:1H = First half (1Q-2Q)2H = Second half (3Q-4Q)(a) = Actual results(f) = ForecastsFY = Fiscal Year (FY3/17, for instance, means 12 months ending March 31, 2017)
Any inquiries about the information contained herein or other Investor Relations questions are requested to be directed to:
Investor Relations Group, Media & Investor Relations Dept.Japan Petroleum Exploration Co., Ltd. Tokyo, JAPANTEL: +81-3-6268-7111
Cautionary Statement
3
Contents
Ⅰ. Business Overview President Hideichi Okada
Ⅱ. Consolidated Financial Results for the Six Months Ended September 30, 2016
Managing Executive Officer Michiro Yamashita
Ⅲ. Revised Full Year Forecasts for FY3/17Managing Executive Officer Michiro Yamashita
Ⅰ. Business Overview
President Hideichi Okada
4
5
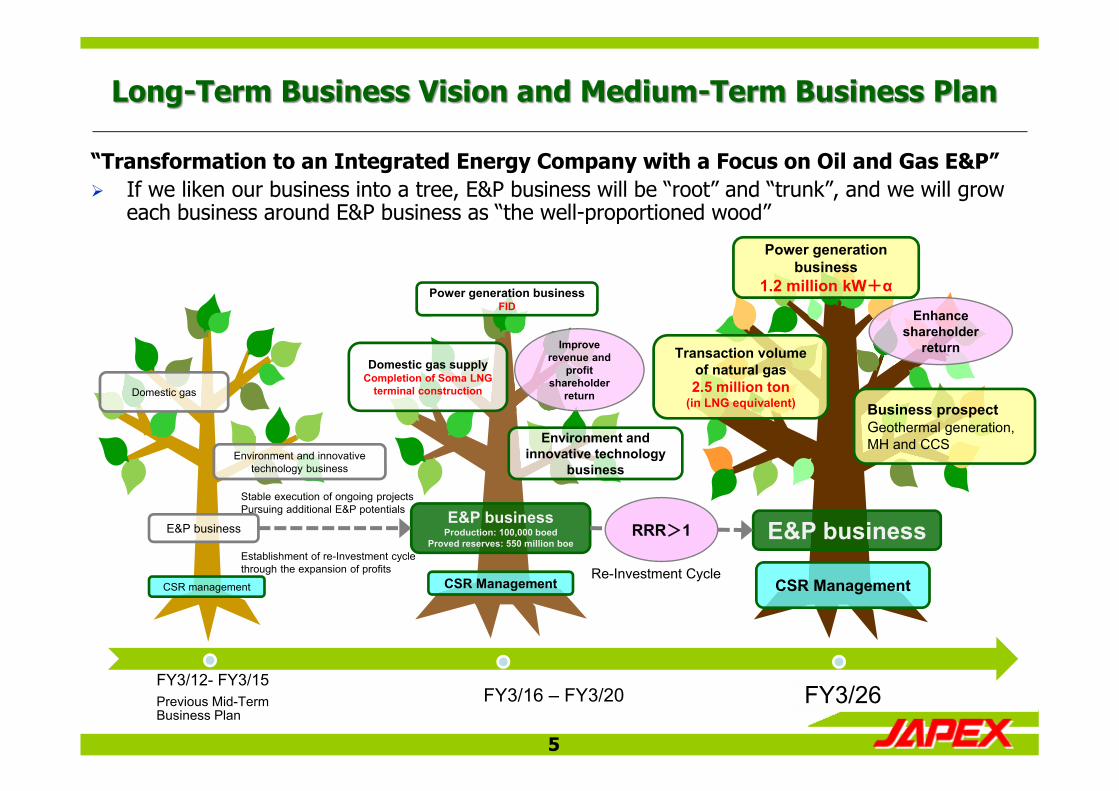
E&P business E&P business
Production: 100,000 boedProved reserves: 550 million boe
Power generation businessFID
Domestic gas supplyCompletion of Soma LNG
terminal construction
Environment and innovative technology
business
E&P business
Business prospect Geothermal generation, MH and CCS
Power generation business
1.2 million kW+α
Transaction volume of natural gas2.5 million ton
(in LNG equivalent)
RRR>1
FY3/12- FY3/15Previous Mid-Term Business Plan
FY3/16 – FY3/20 FY3/26
“Transformation to an Integrated Energy Company with a Focus on Oil and Gas E&P” If we liken our business into a tree, E&P business will be “root” and “trunk”, and we will grow
each business around E&P business as “the well-proportioned wood”
Domestic gas
Environment and innovative technology business
Stable execution of ongoing projectsPursuing additional E&P potentials
Establishment of re-Investment cycle through the expansion of profits
CSR management CSR Management CSR Management
Improve revenue and
profitshareholder
return
Re-Investment Cycle
Enhance shareholder
return
Long-Term Business Vision and Medium-Term Business Plan
6
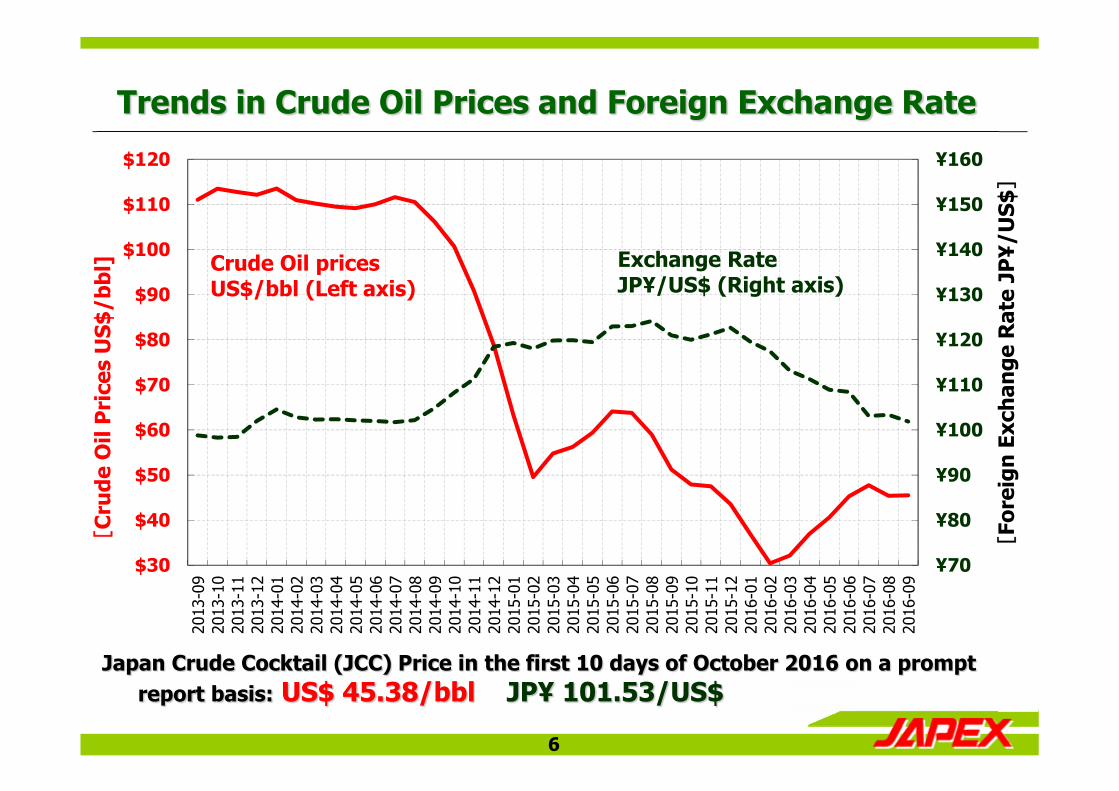
Trends in Crude Oil Prices and Foreign Exchange Rate
¥70
¥80
¥90
¥100
¥110
¥120
¥130
¥140
¥150
¥160
$30
$40
$50
$60
$70
$80
$90
$100
$110
$120
2013
-09
2013
-10
2013
-11
2013
-12
2014
-01
2014
-02
2014
-03
2014
-04
2014
-05
2014
-06
2014
-07
2014
-08
2014
-09
2014
-10
2014
-11
2014
-12
2015
-01
2015
-02
2015
-03
2015
-04
2015
-05
2015
-06
2015
-07
2015
-08
2015
-09
2015
-10
2015
-11
2015
-12
2016
-01
2016
-02
2016
-03
2016
-04
2016
-05
2016
-06
2016
-07
2016
-08
2016
-09
[Fo
reig
n Ex
chan
ge R
ate
JP¥/
US$
]
[C
rude
Oil
Pri
ces
US$
/bbl
] Exchange Rate JP¥/US$ (Right axis)
Crude Oil prices US$/bbl (Left axis)
Japan Crude Cocktail (JCC) Price in the first 10 days of October 2016 on a prompt report basis: US$ 45.38/bbl JP¥ 101.53/US$
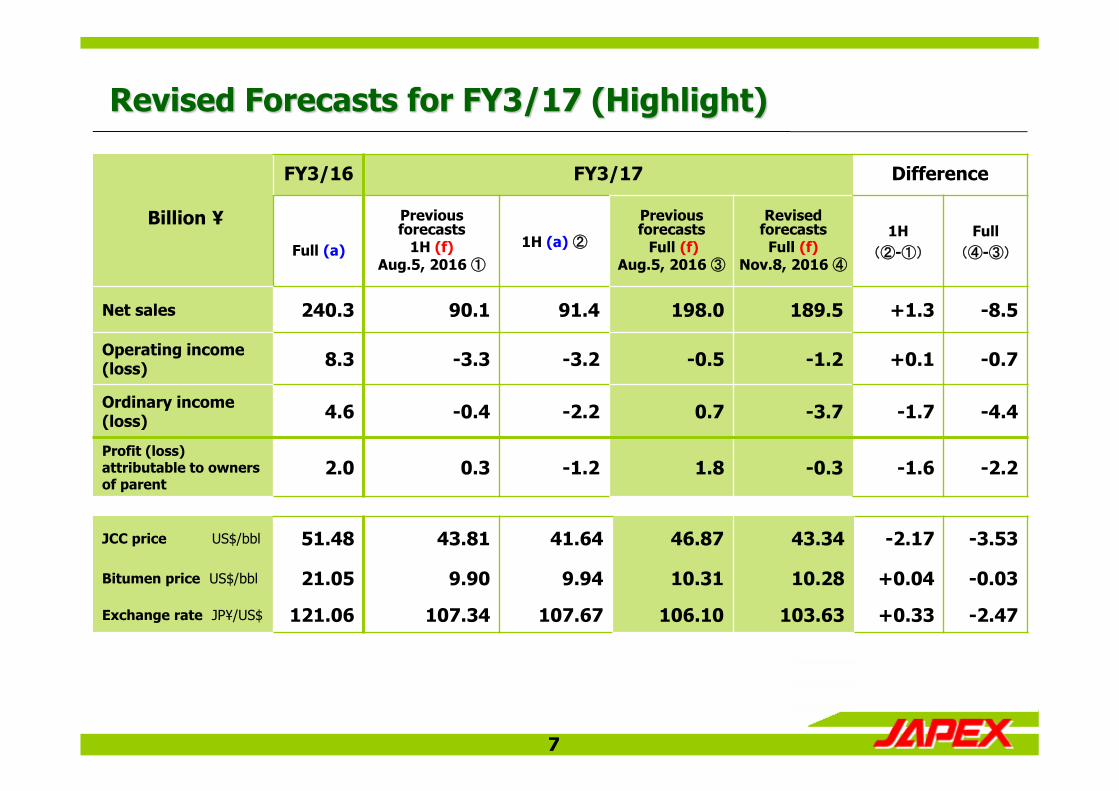
Billion ¥
FY3/16 FY3/17 Difference
Full (a)
Previous forecasts
1H (f)Aug.5, 2016 ①
1H (a) ②
Previous forecasts
Full (f)Aug.5, 2016 ③
Revisedforecasts
Full (f)Nov.8, 2016 ④
1H (②-①)
Full(④-③)
Net sales 240.3 90.1 91.4 198.0 189.5 +1.3 -8.5
Operating income (loss) 8.3 -3.3 -3.2 -0.5 -1.2 +0.1 -0.7
Ordinary income (loss) 4.6 -0.4 -2.2 0.7 -3.7 -1.7 -4.4
Profit (loss) attributable to owners of parent
2.0 0.3 -1.2 1.8 -0.3 -1.6 -2.2
JCC price US$/bbl 51.48 43.81 41.64 46.87 43.34 -2.17 -3.53
Bitumen price US$/bbl 21.05 9.90 9.94 10.31 10.28 +0.04 -0.03
Exchange rate JP¥/US$ 121.06 107.34 107.67 106.10 103.63 +0.33 -2.47
Revised Forecasts for FY3/17 (Highlight)
7
8
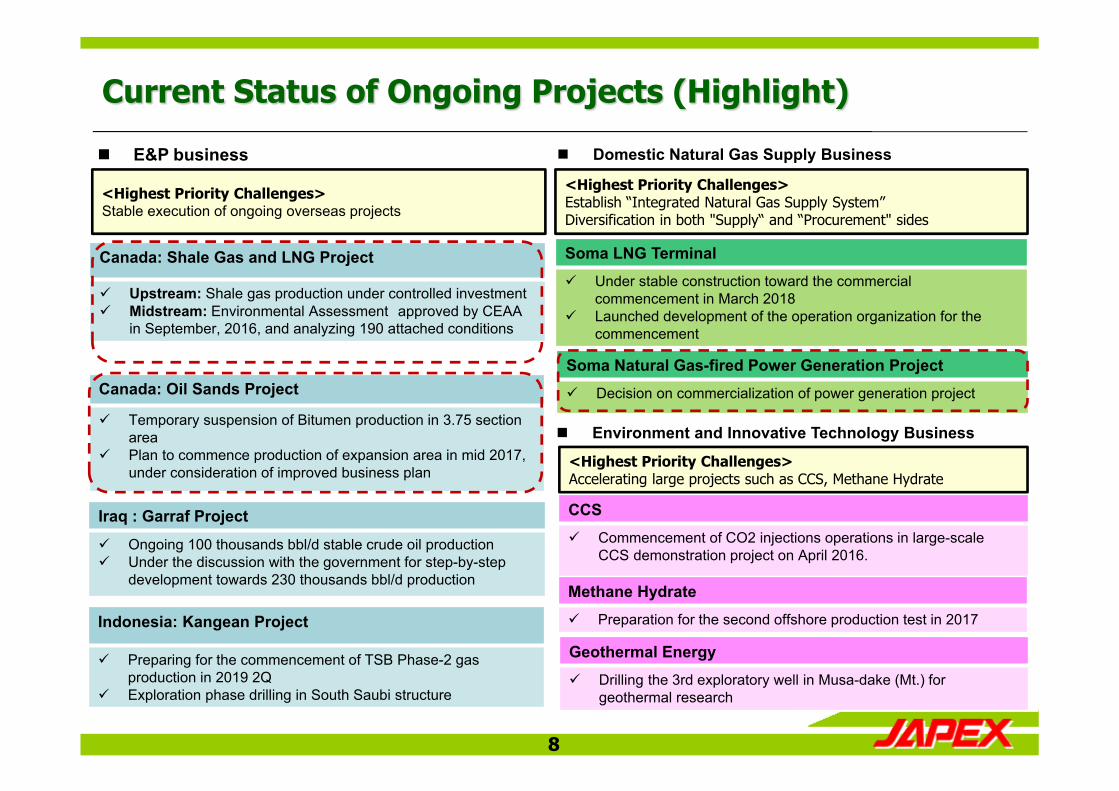
Current Status of Ongoing Projects (Highlight)
E&P business
<Highest Priority Challenges>Stable execution of ongoing overseas projects
Canada: Shale Gas and LNG Project
Upstream: Shale gas production under controlled investment Midstream: Environmental Assessment approved by CEAA
in September, 2016, and analyzing 190 attached conditions
Canada: Oil Sands Project
Temporary suspension of Bitumen production in 3.75 section area
Plan to commence production of expansion area in mid 2017, under consideration of improved business plan
Indonesia: Kangean Project
Preparing for the commencement of TSB Phase-2 gas production in 2019 2Q
Exploration phase drilling in South Saubi structure
Iraq : Garraf Project
Ongoing 100 thousands bbl/d stable crude oil production Under the discussion with the government for step-by-step
development towards 230 thousands bbl/d production
Domestic Natural Gas Supply Business
<Highest Priority Challenges>Establish “Integrated Natural Gas Supply System”Diversification in both "Supply“ and “Procurement" sides
Soma LNG Terminal Under stable construction toward the commercial
commencement in March 2018 Launched development of the operation organization for the
commencement
Soma Natural Gas-fired Power Generation Project Decision on commercialization of power generation project
Environment and Innovative Technology Business
Geothermal Energy Drilling the 3rd exploratory well in Musa-dake (Mt.) for
geothermal research
CCS Commencement of CO2 injections operations in large-scale
CCS demonstration project on April 2016.
Methane Hydrate Preparation for the second offshore production test in 2017
<Highest Priority Challenges>Accelerating large projects such as CCS, Methane Hydrate
9
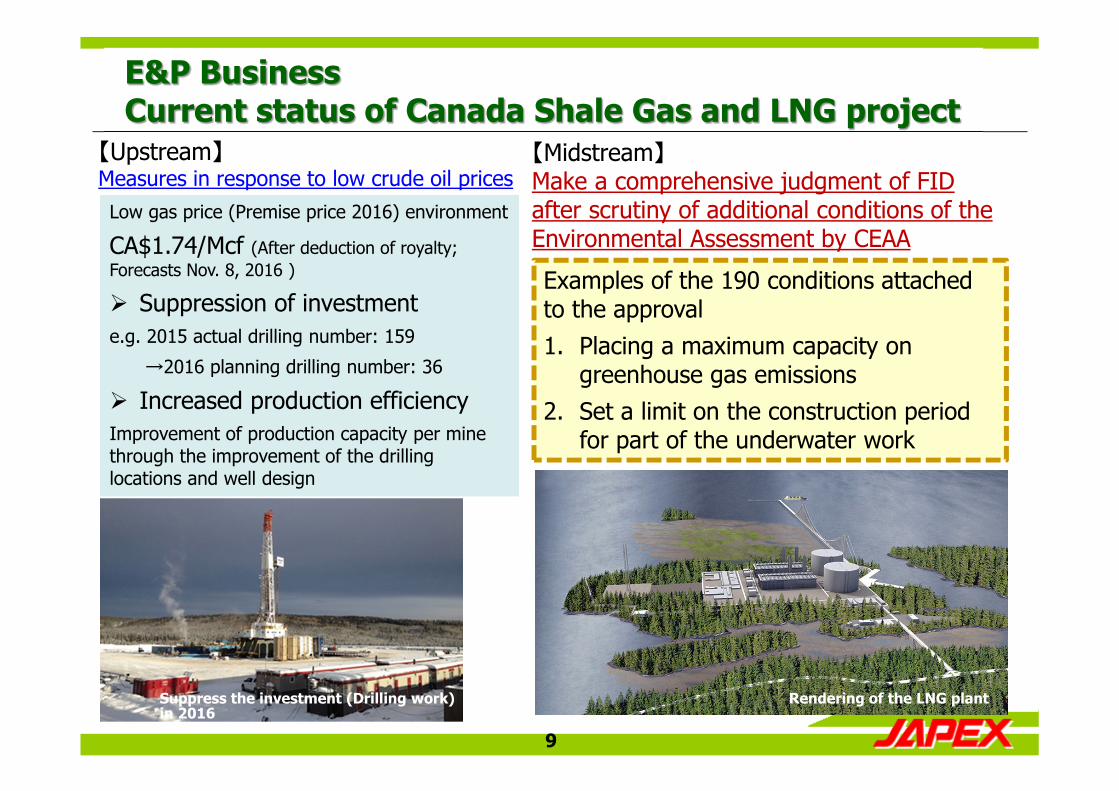
E&P BusinessCurrent status of Canada Shale Gas and LNG project
Low gas price (Premise price 2016) environment
CA$1.74/Mcf (After deduction of royalty; Forecasts Nov. 8, 2016 )
Suppression of investmente.g. 2015 actual drilling number: 159
→2016 planning drilling number: 36
Increased production efficiencyImprovement of production capacity per mine through the improvement of the drilling locations and well design
Examples of the 190 conditions attached to the approval1. Placing a maximum capacity on
greenhouse gas emissions 2. Set a limit on the construction period
for part of the underwater work
【Midstream】Make a comprehensive judgment of FID after scrutiny of additional conditions of the Environmental Assessment by CEAA
【Upstream】Measures in response to low crude oil prices
Rendering of the LNG plantSuppress the investment (Drilling work) in 2016
10
ハンギングストーン拡張開発中央処理施設建設現場
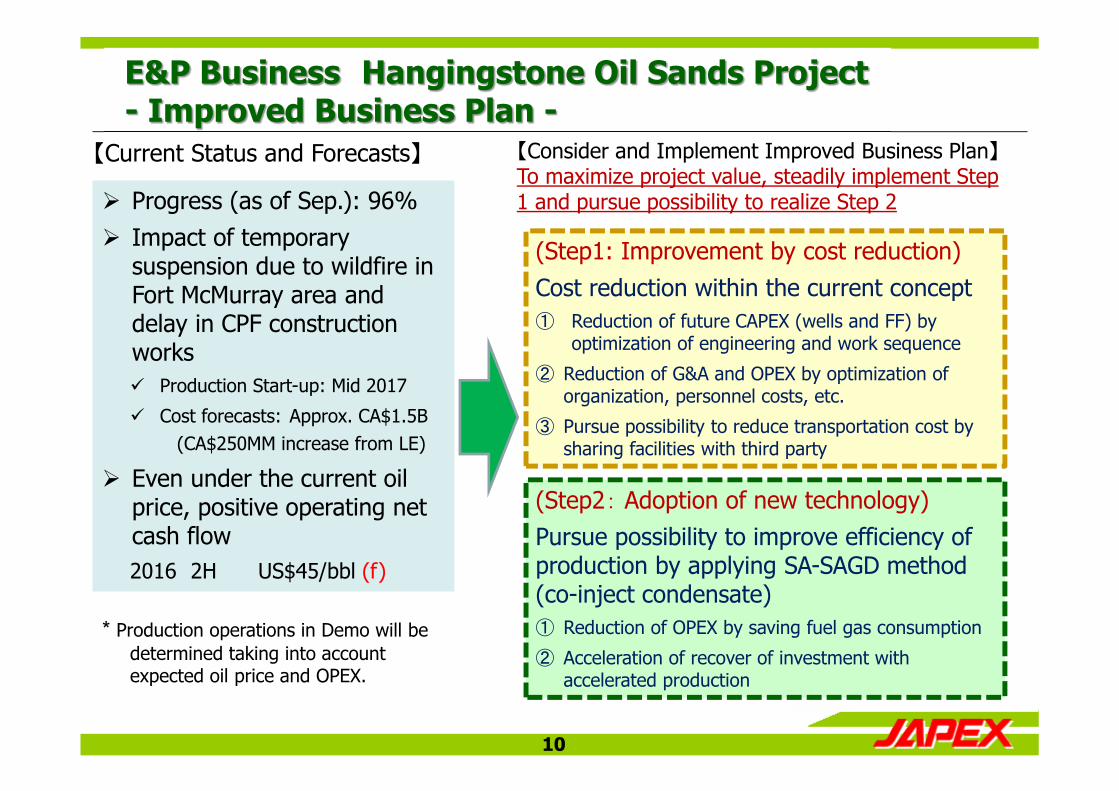
E&P Business Hangingstone Oil Sands Project- Improved Business Plan -
Progress (as of Sep.): 96% Impact of temporary
suspension due to wildfire in Fort McMurray area and delay in CPF construction works Production Start-up: Mid 2017
Cost forecasts: Approx. CA$1.5B(CA$250MM increase from LE)
Even under the current oil price, positive operating net cash flow2016 2H US$45/bbl (f)
(Step1: Improvement by cost reduction)Cost reduction within the current concept① Reduction of future CAPEX (wells and FF) by
optimization of engineering and work sequence
② Reduction of G&A and OPEX by optimization of organization, personnel costs, etc.
③ Pursue possibility to reduce transportation cost by sharing facilities with third party
(Step2: Adoption of new technology)Pursue possibility to improve efficiency of production by applying SA-SAGD method (co-inject condensate) ① Reduction of OPEX by saving fuel gas consumption
② Acceleration of recover of investment with accelerated production
【Consider and Implement Improved Business Plan】To maximize project value, steadily implement Step 1 and pursue possibility to realize Step 2
【Current Status and Forecasts】
* Production operations in Demo will be determined taking into account expected oil price and OPEX.
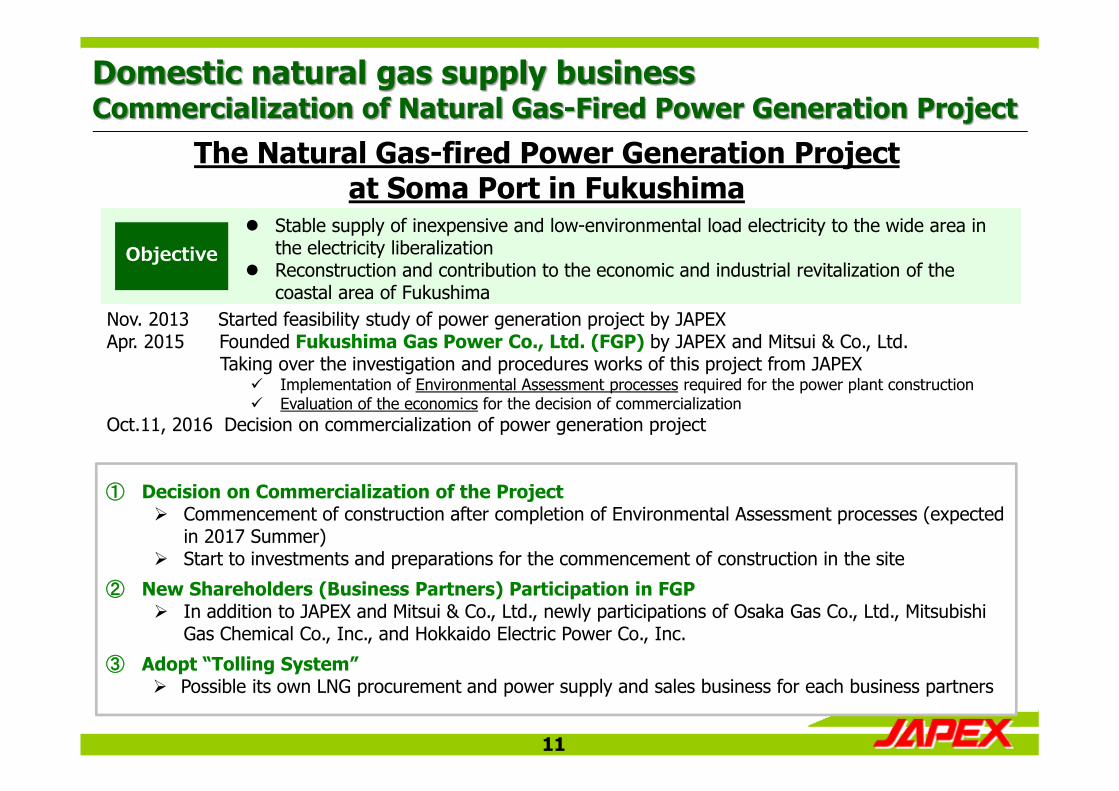
Domestic natural gas supply business Commercialization of Natural Gas-Fired Power Generation Project
Objective
Nov. 2013 Started feasibility study of power generation project by JAPEXApr. 2015 Founded Fukushima Gas Power Co., Ltd. (FGP) by JAPEX and Mitsui & Co., Ltd.
Taking over the investigation and procedures works of this project from JAPEX Implementation of Environmental Assessment processes required for the power plant construction Evaluation of the economics for the decision of commercialization
Oct.11, 2016 Decision on commercialization of power generation project
The Natural Gas-fired Power Generation Project at Soma Port in Fukushima
Stable supply of inexpensive and low-environmental load electricity to the wide area in the electricity liberalization
Reconstruction and contribution to the economic and industrial revitalization of the coastal area of Fukushima
① Decision on Commercialization of the Project Commencement of construction after completion of Environmental Assessment processes (expected
in 2017 Summer) Start to investments and preparations for the commencement of construction in the site
② New Shareholders (Business Partners) Participation in FGP In addition to JAPEX and Mitsui & Co., Ltd., newly participations of Osaka Gas Co., Ltd., Mitsubishi
Gas Chemical Co., Inc., and Hokkaido Electric Power Co., Inc.
③ Adopt “Tolling System” Possible its own LNG procurement and power supply and sales business for each business partners
11
12
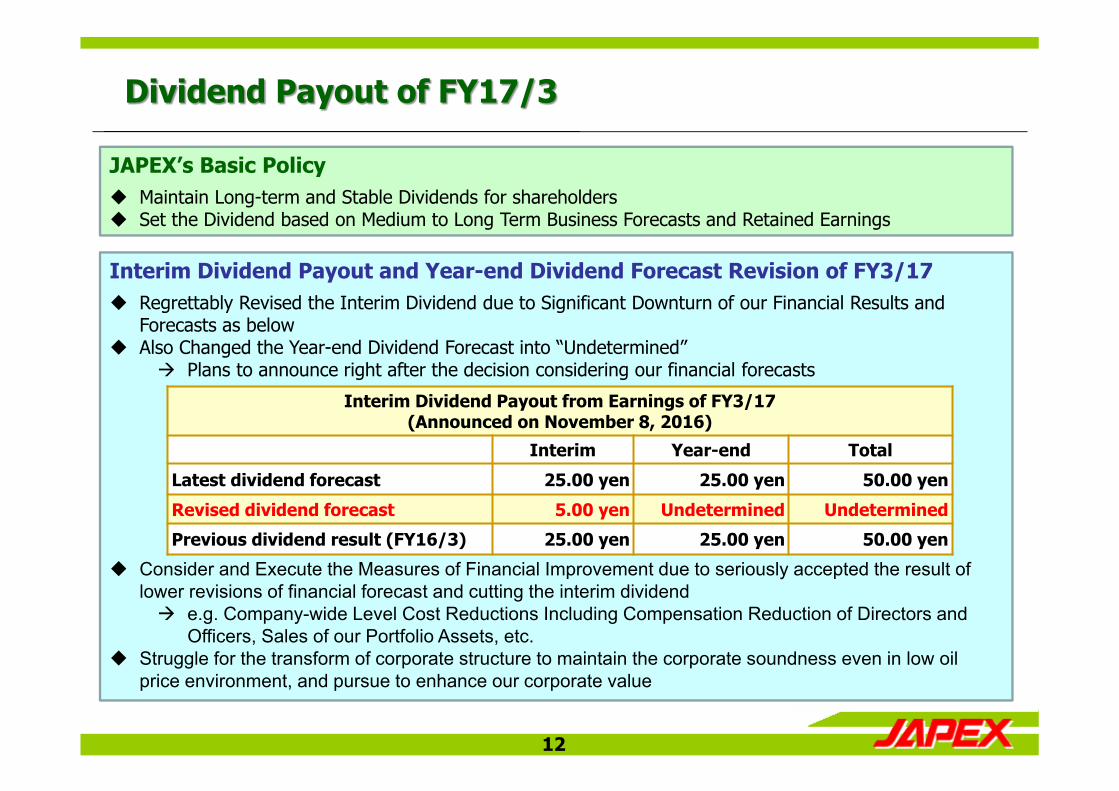
Dividend Payout of FY17/3
JAPEX’s Basic Policy Maintain Long-term and Stable Dividends for shareholders Set the Dividend based on Medium to Long Term Business Forecasts and Retained Earnings
Interim Dividend Payout and Year-end Dividend Forecast Revision of FY3/17 Regrettably Revised the Interim Dividend due to Significant Downturn of our Financial Results and
Forecasts as below Also Changed the Year-end Dividend Forecast into “Undetermined”
Plans to announce right after the decision considering our financial forecasts
Consider and Execute the Measures of Financial Improvement due to seriously accepted the result of lower revisions of financial forecast and cutting the interim dividend e.g. Company-wide Level Cost Reductions Including Compensation Reduction of Directors and
Officers, Sales of our Portfolio Assets, etc. Struggle for the transform of corporate structure to maintain the corporate soundness even in low oil
price environment, and pursue to enhance our corporate value
Interim Dividend Payout from Earnings of FY3/17(Announced on November 8, 2016)
Interim Year-end Total
Latest dividend forecast 25.00 yen 25.00 yen 50.00 yen
Revised dividend forecast 5.00 yen Undetermined Undetermined
Previous dividend result (FY16/3) 25.00 yen 25.00 yen 50.00 yen
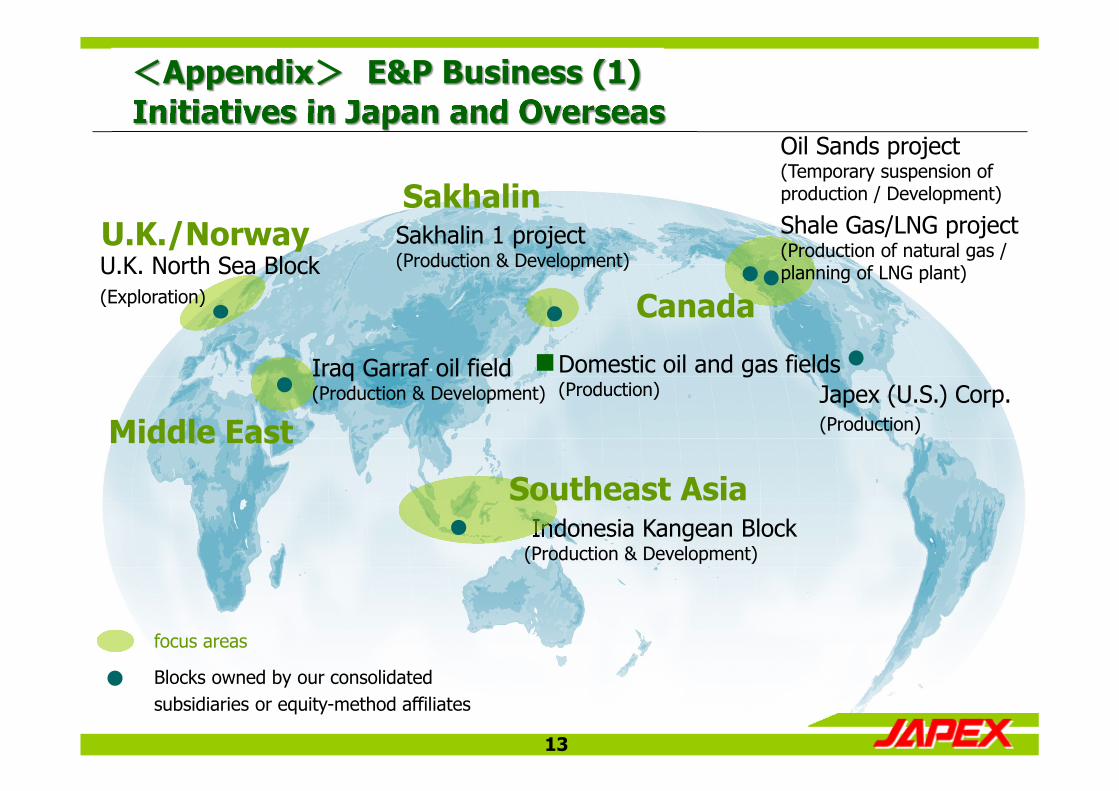
Sakhalin 1 project (Production & Development)
Oil Sands project (Temporary suspension of production / Development)
Shale Gas/LNG project(Production of natural gas / planning of LNG plant)
U.K./Norway
Indonesia Kangean Block (Production & Development)
Iraq Garraf oil field(Production & Development)
focus areas
Blocks owned by our consolidatedsubsidiaries or equity-method affiliates
Canada
Middle East
Sakhalin
Southeast Asia
Japex (U.S.) Corp.(Production)
13
U.K. North Sea Block (Exploration)
Initiatives in Japan and Overseas <Appendix> E&P Business (1)
Domestic oil and gas fields (Production)
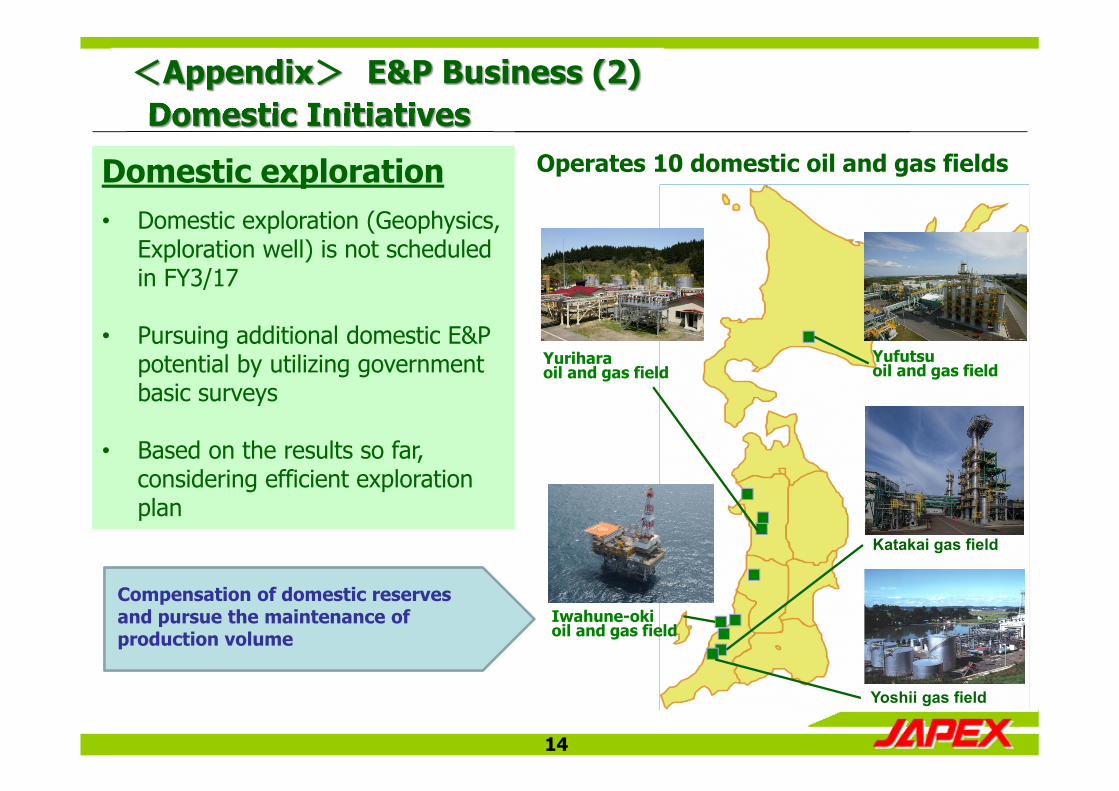
Katakai gas field
Domestic Initiatives
Domestic exploration• Domestic exploration (Geophysics,
Exploration well) is not scheduled in FY3/17
• Pursuing additional domestic E&P potential by utilizing government basic surveys
• Based on the results so far,considering efficient exploration plan
Iwahune-okioil and gas field
Yufutsuoil and gas field
Yuriharaoil and gas field
Operates 10 domestic oil and gas fields
Yoshii gas field
14
<Appendix> E&P Business (2)
Compensation of domestic reserves and pursue the maintenance of production volume
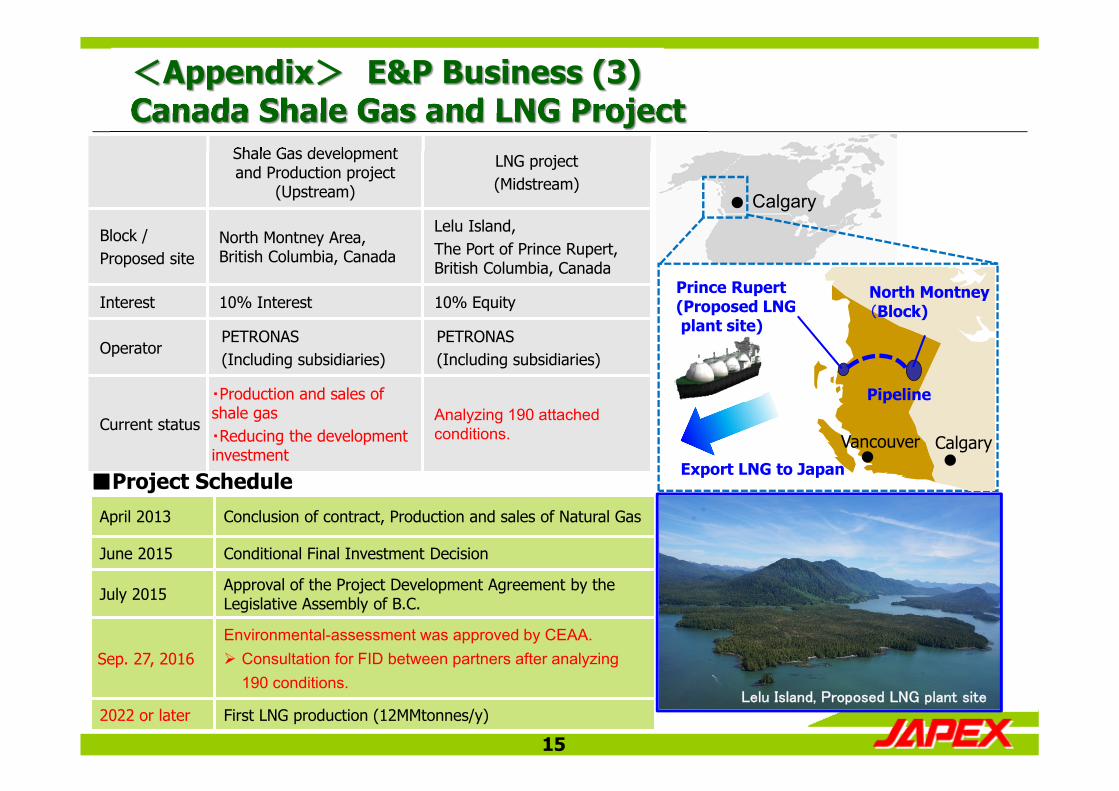
April 2013 Conclusion of contract, Production and sales of Natural Gas
June 2015 Conditional Final Investment Decision
July 2015 Approval of the Project Development Agreement by the Legislative Assembly of B.C.
Sep. 27, 2016Environmental-assessment was approved by CEAA. Consultation for FID between partners after analyzing
190 conditions.
2022 or later First LNG production (12MMtonnes/y)
Shale Gas developmentand Production project
(Upstream)
LNG project(Midstream)
Block /Proposed site
North Montney Area, British Columbia, Canada
Lelu Island, The Port of Prince Rupert, British Columbia, Canada
Interest 10% Interest 10% Equity
OperatorPETRONAS(Including subsidiaries)
PETRONAS(Including subsidiaries)
Current status
・Production and sales of shale gas・Reducing the development investment
Analyzing 190 attached conditions.
15
■Project ScheduleExport LNG to Japan
Prince Rupert (Proposed LNGplant site)
Calgary
Pipeline
Vancouver
North Montney(Block)
Calgary
Canada Shale Gas and LNG Project
Lelu Island, Proposed LNG plant site
<Appendix> E&P Business (3)
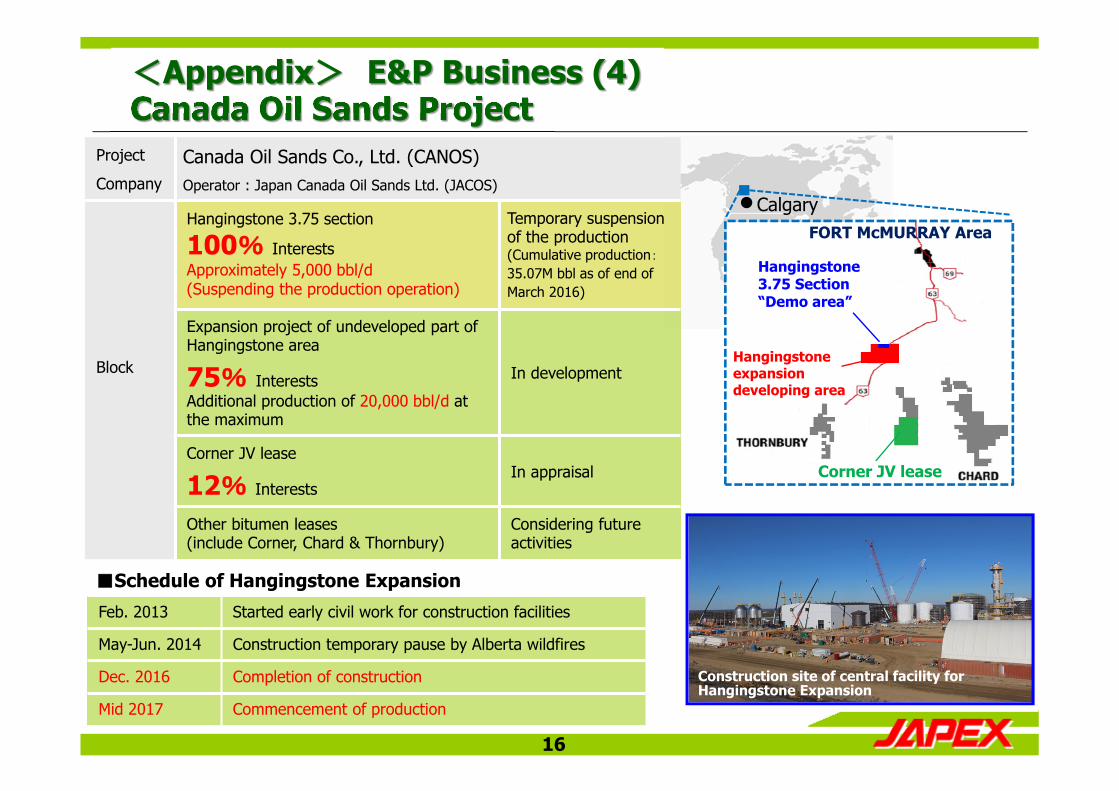
Project
Company
Canada Oil Sands Co., Ltd. (CANOS)Operator : Japan Canada Oil Sands Ltd. (JACOS)
Block
Hangingstone 3.75 section
100% InterestsApproximately 5,000 bbl/d (Suspending the production operation)
Temporary suspension of the production (Cumulative production:
35.07M bbl as of end of March 2016)
Expansion project of undeveloped part of Hangingstone area
75% InterestsAdditional production of 20,000 bbl/d at the maximum
In development
Corner JV lease
12% InterestsIn appraisal
Other bitumen leases(include Corner, Chard & Thornbury)
Considering future activities
Feb. 2013 Started early civil work for construction facilities
May-Jun. 2014 Construction temporary pause by Alberta wildfires
Dec. 2016 Completion of construction
Mid 2017 Commencement of production
16
Hangingstone3.75 Section“Demo area”
FORT McMURRAY Area
Hangingstoneexpansion developing area
Corner JV lease
Calgary
■Schedule of Hangingstone Expansion
Canada Oil Sands Project
Construction site of central facility for Hangingstone Expansion
<Appendix> E&P Business (4)
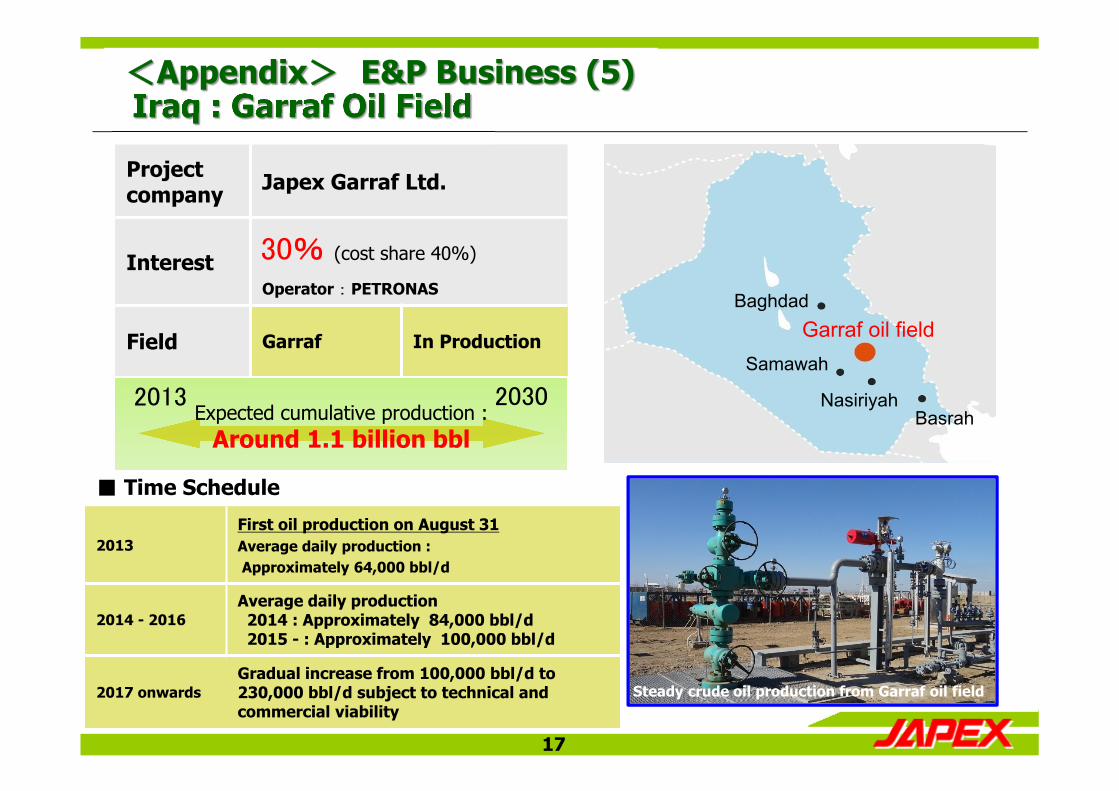
Project company Japex Garraf Ltd.
InterestOperator : PETRONAS
Field Garraf In Production
30% (cost share 40%)
17
Garraf oil fieldBaghdad
Samawah
NasiriyahBasrah
Iraq : Garraf Oil Field
Expected cumulative production :Around 1.1 billion bbl
2013 2030
■ Time Schedule
2013First oil production on August 31 Average daily production :Approximately 64,000 bbl/d
2014 - 2016Average daily production 2014 : Approximately 84,000 bbl/d2015 - : Approximately 100,000 bbl/d
2017 onwardsGradual increase from 100,000 bbl/d to 230,000 bbl/d subject to technical and commercial viability
Garraf oil has been smoothly shipped from BasrahSteady crude oil production from Garraf oil field
<Appendix> E&P Business (5)
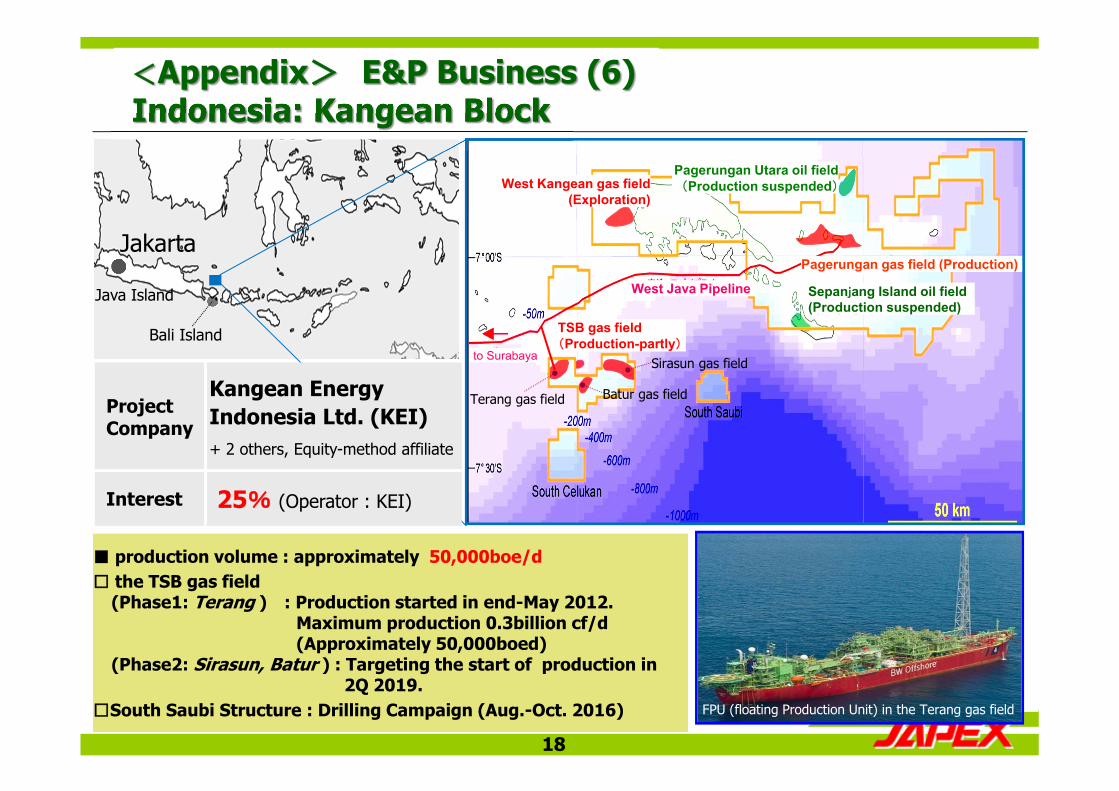
Jakarta
Bali Island
Pagerungan gas field (Production)
Sepanjang Island oil field (Production suspended)
Pagerungan Utara oil field(Production suspended)
Terang gas field
Sirasun gas field
Batur gas field
Java Island
TSB gas field (Production-partly)
18
FPU (floating Production Unit) in the Terang gas field
Indonesia: Kangean Block
West Java Pipeline
to Surabaya
■ production volume : approximately 50,000boe/d□ the TSB gas field
(Phase1: Terang ) : Production started in end-May 2012. Maximum production 0.3billion cf/d(Approximately 50,000boed)
(Phase2: Sirasun, Batur ) : Targeting the start of production in 2Q 2019.
□South Saubi Structure : Drilling Campaign (Aug.-Oct. 2016)
West Kangean gas field (Exploration)
<Appendix> E&P Business (6)
Project Company
Kangean Energy Indonesia Ltd. (KEI)+ 2 others, Equity-method affiliate
Interest 25% (Operator : KEI)
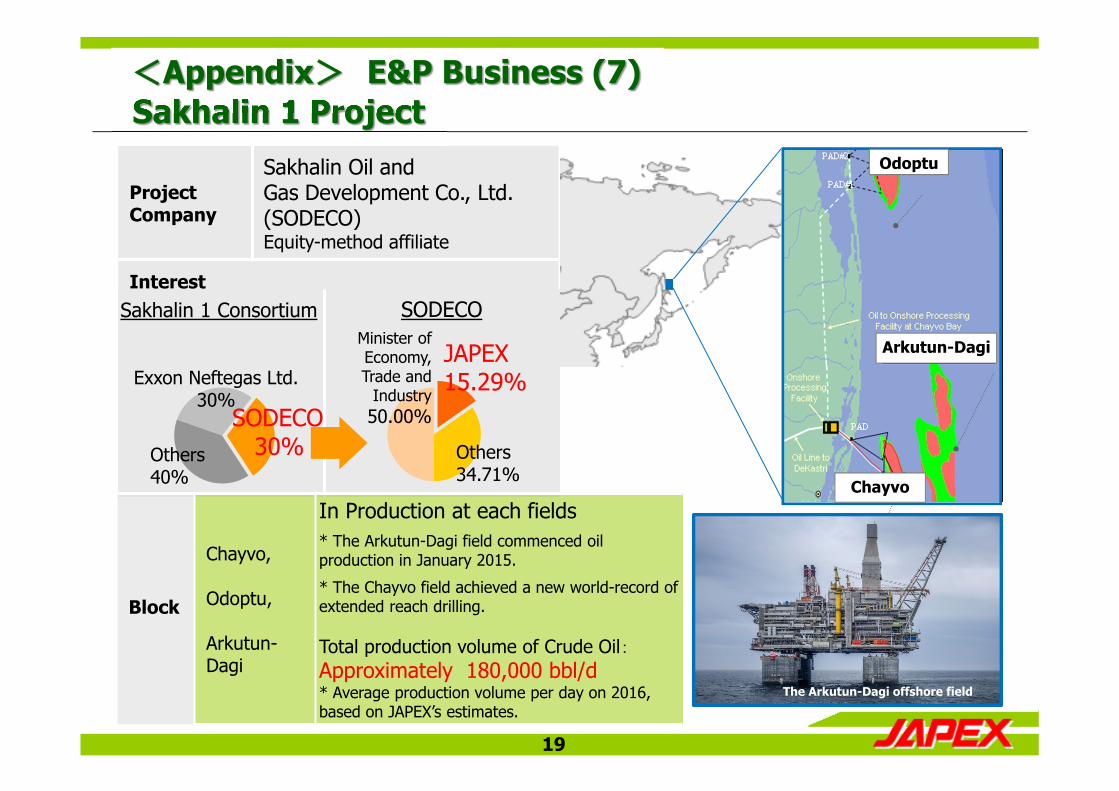
Project Company
Sakhalin Oil andGas Development Co., Ltd. (SODECO)Equity-method affiliate
Interest
Minister ofEconomy,Trade and
Industry 50.00%
Others34.71%
SODECO30%Others
40%
Exxon Neftegas Ltd.30%
Odoptu
Arkutun-Dagi
Chayvo
19
Block
Chayvo,
Odoptu,
Arkutun-Dagi
In Production at each fields* The Arkutun-Dagi field commenced oil production in January 2015.
* The Chayvo field achieved a new world-record of extended reach drilling.
Total production volume of Crude Oil:Approximately 180,000 bbl/d* Average production volume per day on 2016, based on JAPEX’s estimates.
JAPEX15.29%
Sakhalin 1 Consortium SODECO
Sakhalin 1 Project
The Arkutun-Dagi offshore field
<Appendix> E&P Business (7)
20
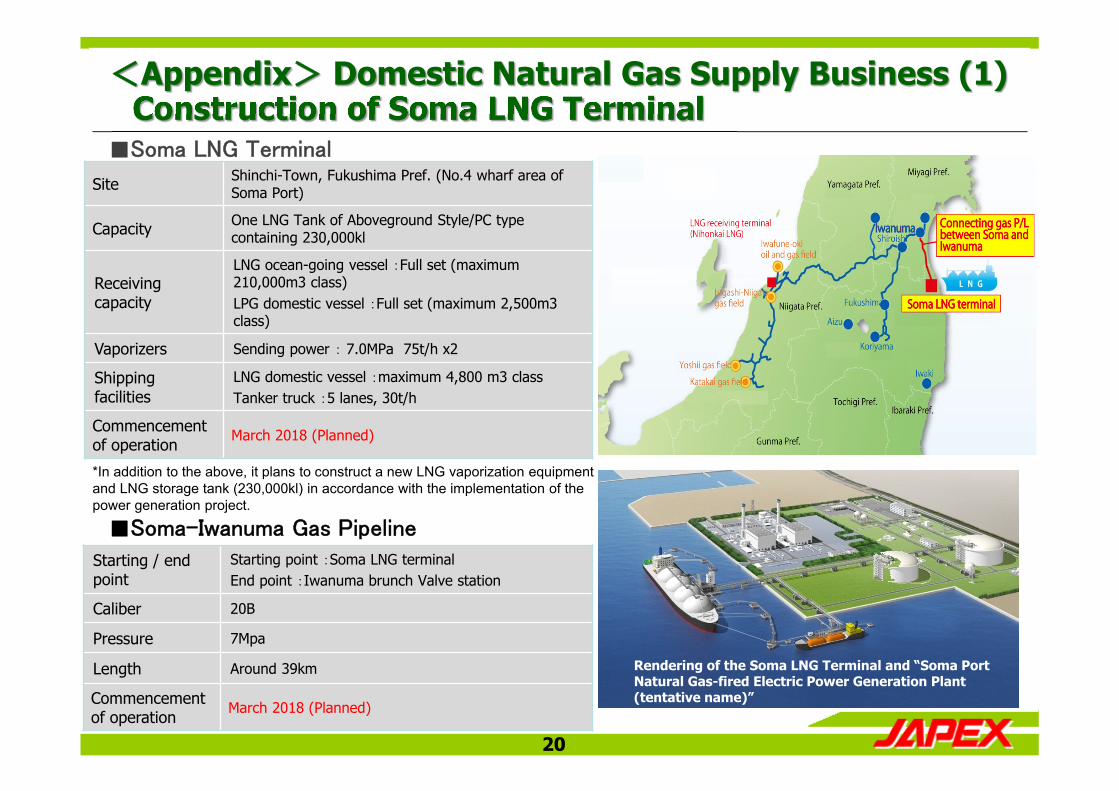
■Soma-Iwanuma Gas Pipeline
Starting / end point
Starting point :Soma LNG terminalEnd point :Iwanuma brunch Valve station
Caliber 20B
Pressure 7Mpa
Length Around 39km
Commencement of operation
March 2018 (Planned)
Site Shinchi-Town, Fukushima Pref. (No.4 wharf area of Soma Port)
Capacity One LNG Tank of Aboveground Style/PC type containing 230,000kl
Receiving capacity
LNG ocean-going vessel :Full set (maximum210,000m3 class)LPG domestic vessel :Full set (maximum 2,500m3class)
Vaporizers Sending power : 7.0MPa 75t/h x2
Shipping facilities
LNG domestic vessel :maximum 4,800 m3 classTanker truck :5 lanes, 30t/h
Commencement of operation
March 2018 (Planned)
Construction of Soma LNG Terminal ■Soma LNG Terminal
<Appendix> Domestic Natural Gas Supply Business (1)
*In addition to the above, it plans to construct a new LNG vaporization equipment and LNG storage tank (230,000kl) in accordance with the implementation of the power generation project.
Rendering of the Soma LNG Terminal and “Soma Port Natural Gas-fired Electric Power Generation Plant (tentative name)”
21
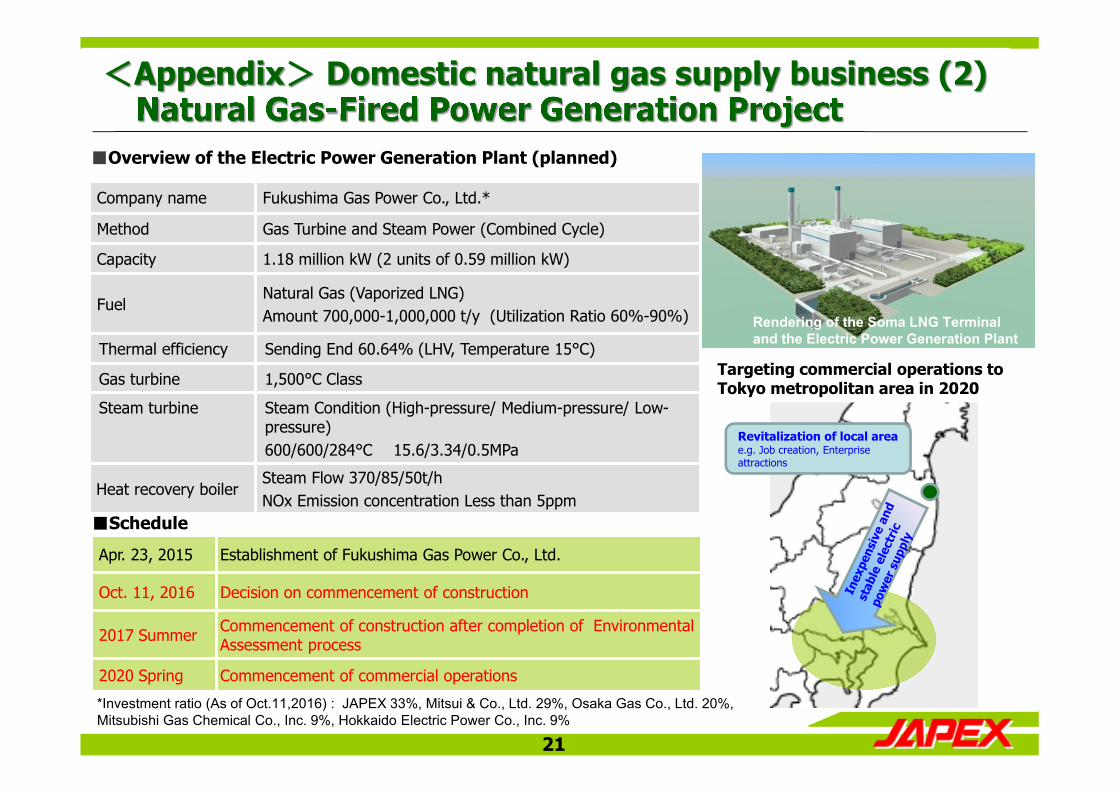
Company name Fukushima Gas Power Co., Ltd.*
Method Gas Turbine and Steam Power (Combined Cycle)
Capacity 1.18 million kW (2 units of 0.59 million kW)
FuelNatural Gas (Vaporized LNG)Amount 700,000-1,000,000 t/y (Utilization Ratio 60%-90%)
Thermal efficiency Sending End 60.64% (LHV, Temperature 15°C)
Gas turbine 1,500°C Class
Steam turbine Steam Condition (High-pressure/ Medium-pressure/ Low-pressure)600/600/284°C 15.6/3.34/0.5MPa
Heat recovery boilerSteam Flow 370/85/50t/h NOx Emission concentration Less than 5ppm
Apr. 23, 2015 Establishment of Fukushima Gas Power Co., Ltd.
Oct. 11, 2016 Decision on commencement of construction
2017 Summer Commencement of construction after completion of Environmental Assessment process
2020 Spring Commencement of commercial operations
Natural Gas-Fired Power Generation Project
Targeting commercial operations to Tokyo metropolitan area in 2020
Revitalization of local areae.g. Job creation, Enterprise attractions
■Overview of the Electric Power Generation Plant (planned)
■Schedule
<Appendix> Domestic natural gas supply business (2)
Rendering of the Soma LNG Terminal and the Electric Power Generation Plant
*Investment ratio (As of Oct.11,2016) : JAPEX 33%, Mitsui & Co., Ltd. 29%, Osaka Gas Co., Ltd. 20%, Mitsubishi Gas Chemical Co., Inc. 9%, Hokkaido Electric Power Co., Inc. 9%
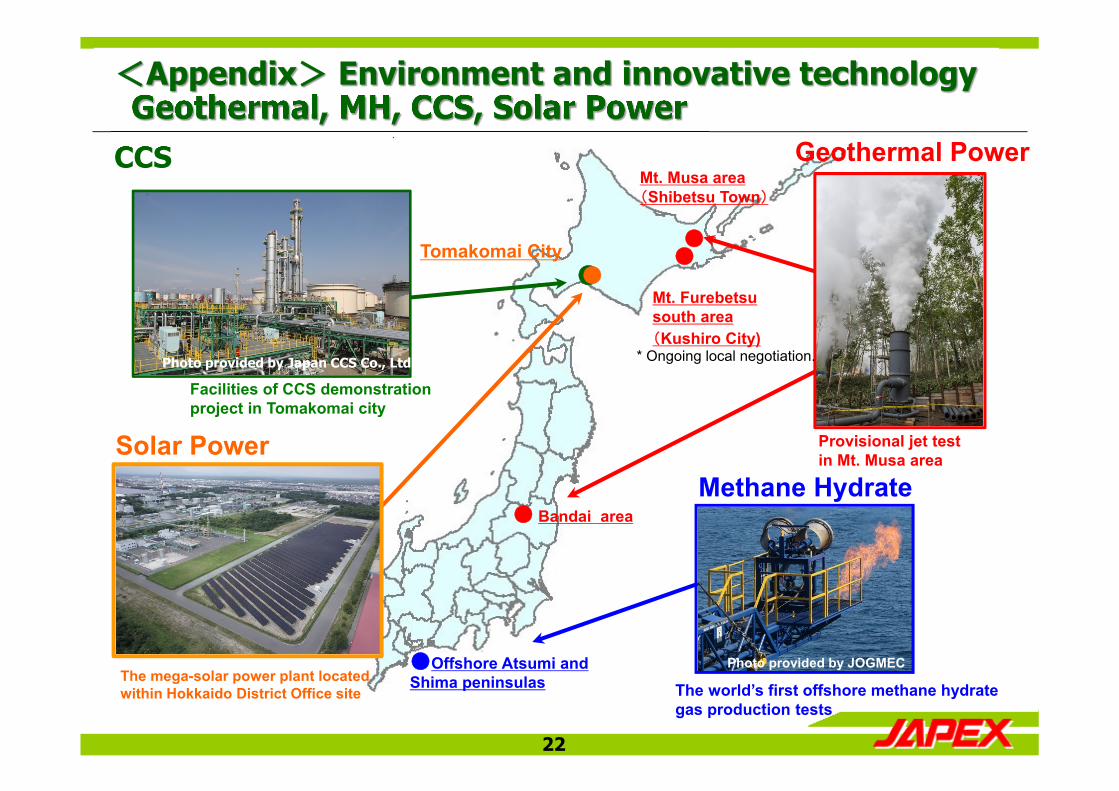
Provisional jet test in Mt. Musa area
22
CCS
●●
Mt. Furebetsusouth area(Kushiro City)
Facilities of CCS demonstration project in Tomakomai city
Geothermal, MH, CCS, Solar Power
Mt. Musa area(Shibetsu Town)
●
Solar Power
The mega-solar power plant located within Hokkaido District Office site
Geothermal Power
●Offshore Atsumi andShima peninsulas
Methane Hydrate
Photo provided by JOGMEC
The world’s first offshore methane hydrate gas production tests
Tomakomai City●
● Bandai area
* Ongoing local negotiation.
<Appendix> Environment and innovative technology
Photo provided by Japan CCS Co., Ltd
Ⅱ. Consolidated Financial Results for the Six Months Ended September 30, 2016
Managing Executive Officer Michiro Yamashita
23
24
Net Sales (left axis)
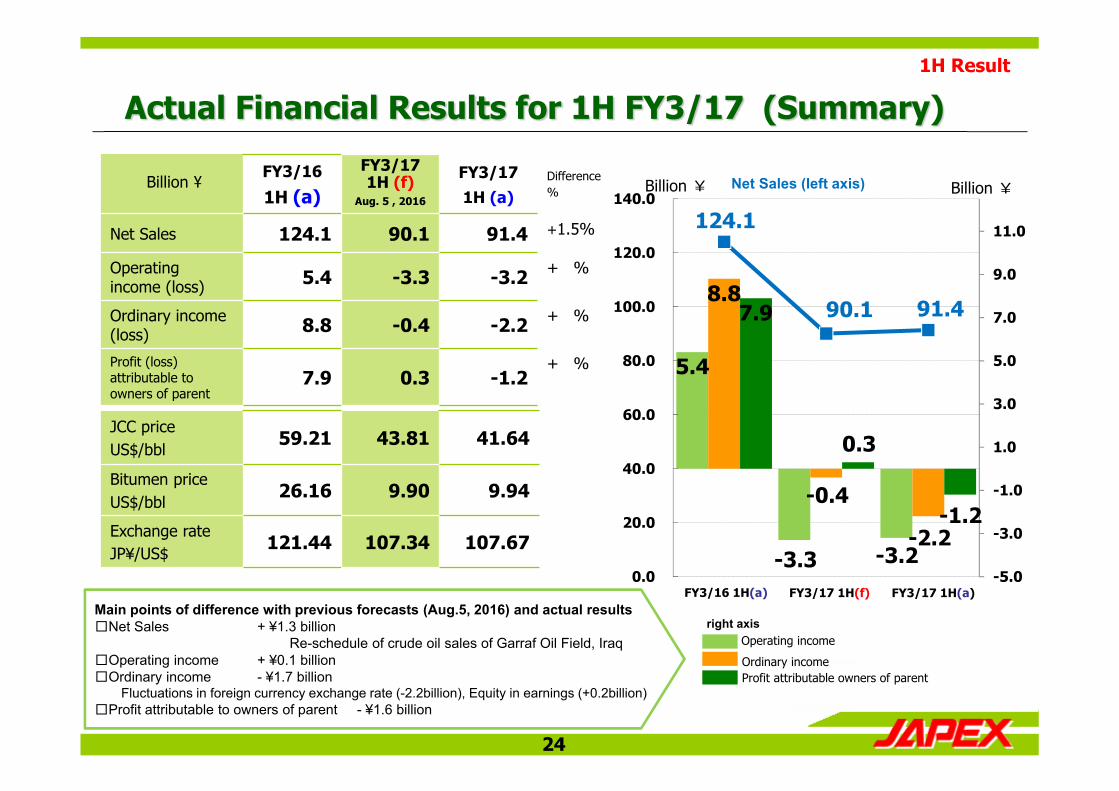
Actual Financial Results for 1H FY3/17 (Summary)
Billion ¥FY3/16
1H (a)
FY3/171H (f)
Aug. 5 , 2016
FY3/171H (a)
Difference%
Net Sales 124.1 90.1 91.4 +1.5%
Operating income (loss) 5.4 -3.3 -3.2 + %
Ordinary income (loss) 8.8 -0.4 -2.2 + %
Profit (loss) attributable to owners of parent
7.9 0.3 -1.2+ %
JCC priceUS$/bbl
59.21 43.81 41.64
Bitumen priceUS$/bbl
26.16 9.90 9.94
Exchange rateJP¥/US$
121.44 107.34 107.67
Billion ¥ Billion ¥
FY3/16 1H(a) FY3/17 1H(f) FY3/17 1H(a)
Operating income
Ordinary income Profit attributable owners of parent
right axisMain points of difference with previous forecasts (Aug.5, 2016) and actual results□Net Sales + ¥1.3 billion
Re-schedule of crude oil sales of Garraf Oil Field, Iraq□Operating income + ¥0.1 billion □Ordinary income - ¥1.7 billion
Fluctuations in foreign currency exchange rate (-2.2billion), Equity in earnings (+0.2billion)□Profit attributable to owners of parent - ¥1.6 billion
1H Result
5.4
-3.3 -3.2
8.8
-0.4
-2.2
7.9
0.3
-1.2
124.1
90.1 91.4
-5.0
-3.0
-1.0
1.0
3.0
5.0
7.0
9.0
11.0
0.0
20.0
40.0
60.0
80.0
100.0
120.0
140.0
25
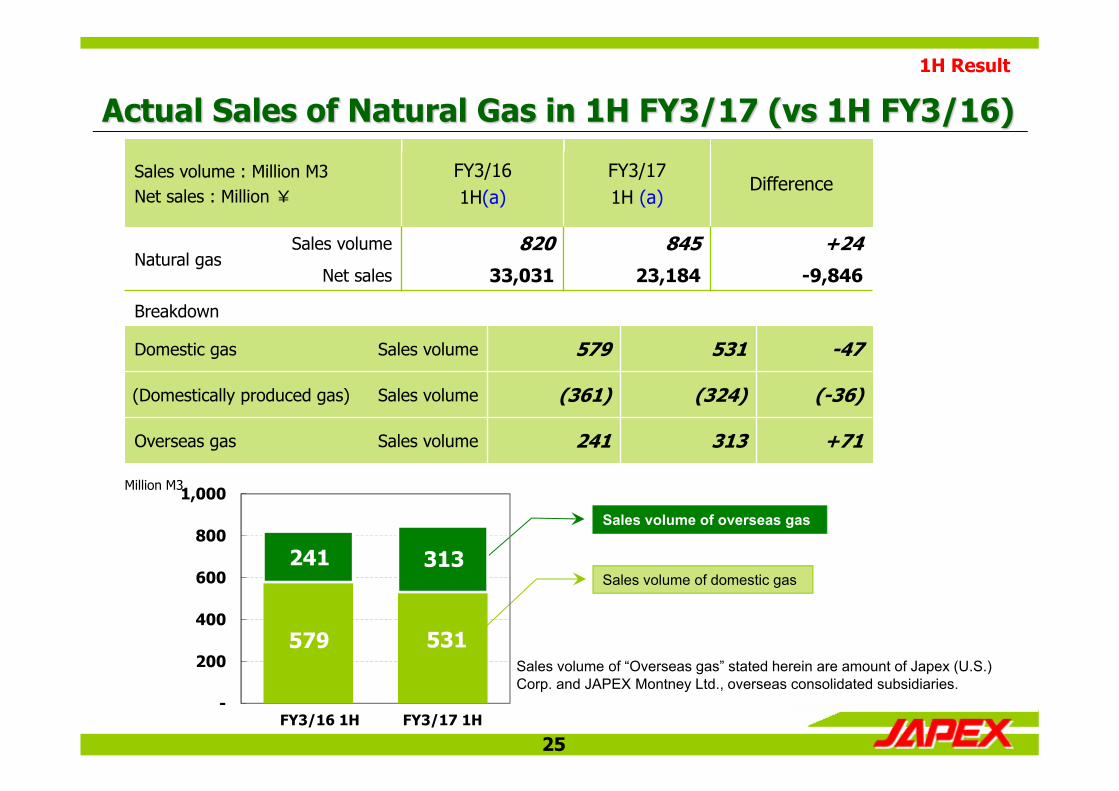
Sales volume : Million M3Net sales : Million ¥
FY3/161H(a)
FY3/171H (a)
Difference
Natural gas Sales volume 820 845 +24
Net sales 33,031 23,184 -9,846
Breakdown
Domestic gas Sales volume 579 531 -47
(Domestically produced gas) Sales volume (361) (324) (-36)
Overseas gas Sales volume 241 313 +71
Actual Sales of Natural Gas in 1H FY3/17 (vs 1H FY3/16)
Million M3
Sales volume of “Overseas gas” stated herein are amount of Japex (U.S.) Corp. and JAPEX Montney Ltd., overseas consolidated subsidiaries.
Sales volume of overseas gas
Sales volume of domestic gas
FY3/16 1H FY3/17 1H
579 531
241 313
-
200
400
600
800
1,000
1H Result
26
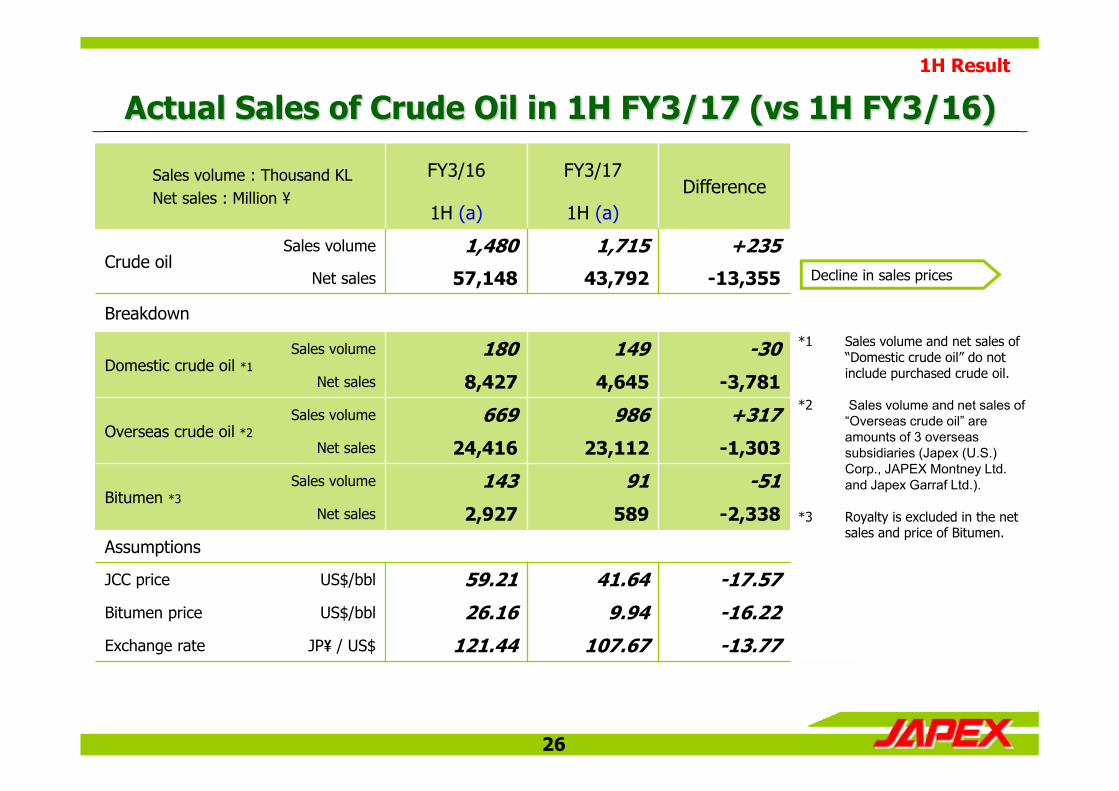
Decline in sales prices
Actual Sales of Crude Oil in 1H FY3/17 (vs 1H FY3/16)
Sales volume : Thousand KLNet sales : Million ¥
FY3/16 FY3/17Difference
1H (a) 1H (a)
Crude oilSales volume 1,480 1,715 +235
Net sales 57,148 43,792 -13,355
Breakdown
Domestic crude oil *1Sales volume 180 149 -30
Net sales 8,427 4,645 -3,781
Overseas crude oil *2Sales volume 669 986 +317
Net sales 24,416 23,112 -1,303
Bitumen *3Sales volume 143 91 -51
Net sales 2,927 589 -2,338
Assumptions
JCC price US$/bbl 59.21 41.64 -17.57
Bitumen price US$/bbl 26.16 9.94 -16.22
Exchange rate JP¥ / US$ 121.44 107.67 -13.77
1H Result
*1 Sales volume and net sales of “Domestic crude oil” do not include purchased crude oil.
*2 Sales volume and net sales of “Overseas crude oil” are amounts of 3 overseas subsidiaries (Japex (U.S.) Corp., JAPEX Montney Ltd. and Japex Garraf Ltd.).
*3 Royalty is excluded in the net sales and price of Bitumen.
27
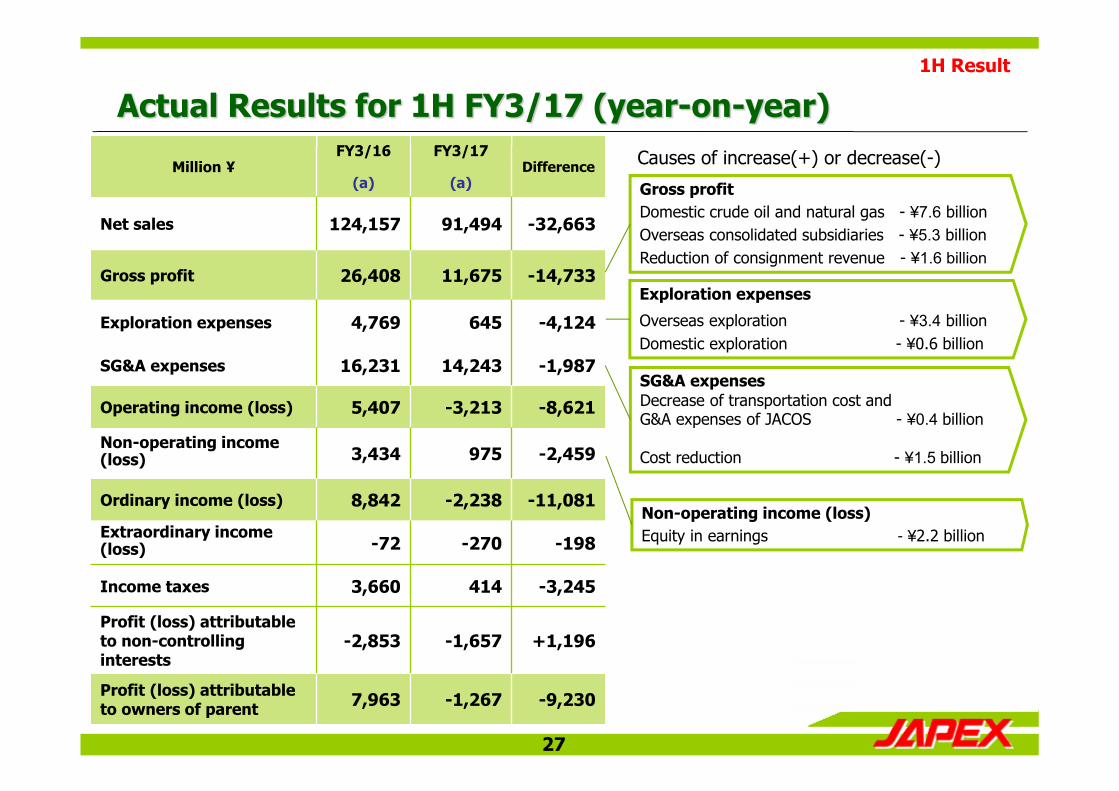
Causes of increase(+) or decrease(-) Million ¥FY3/16 FY3/17
Difference(a) (a)
Net sales 124,157 91,494 -32,663
Gross profit 26,408 11,675 -14,733
Exploration expenses 4,769 645 -4,124
SG&A expenses 16,231 14,243 -1,987
Operating income (loss) 5,407 -3,213 -8,621
Non-operating income(loss) 3,434 975 -2,459
Ordinary income (loss) 8,842 -2,238 -11,081
Extraordinary income(loss) -72 -270 -198
Income taxes 3,660 414 -3,245
Profit (loss) attributable to non-controlling interests
-2,853 -1,657 +1,196
Profit (loss) attributable to owners of parent 7,963 -1,267 -9,230
Gross profitDomestic crude oil and natural gas - ¥7.6 billionOverseas consolidated subsidiaries - ¥5.3 billionReduction of consignment revenue - ¥1.6 billion
Exploration expenses
Overseas exploration - ¥3.4 billionDomestic exploration - ¥0.6 billion
Non-operating income (loss)Equity in earnings - ¥2.2 billion
SG&A expensesDecrease of transportation cost and G&A expenses of JACOS - ¥0.4 billion
Cost reduction - ¥1.5 billion
Actual Results for 1H FY3/17 (year-on-year)1H Result
Ⅲ. Revised Full Year Forecasts for FY3/17
Managing Executive Officer Michiro Yamashita
28
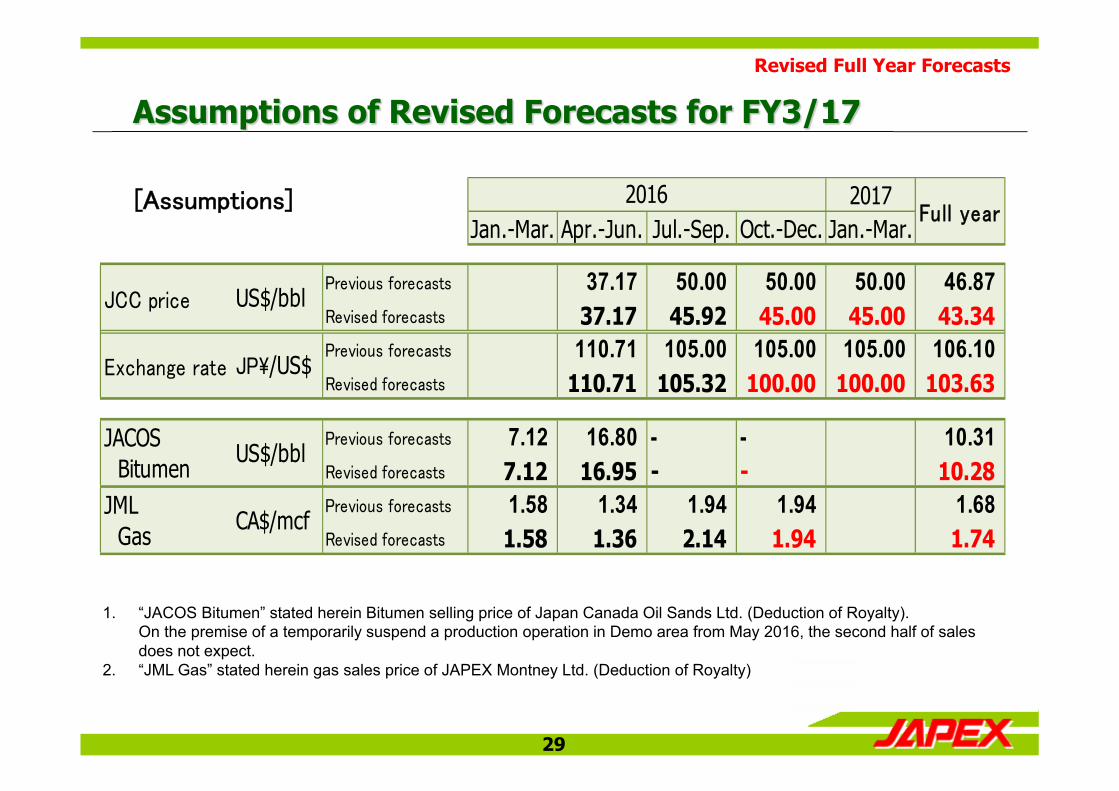
Assumptions of Revised Forecasts for FY3/17
[Assumptions] 2017Jan.-Mar. Apr.-Jun. Jul.-Sep. Oct.-Dec. Jan.-Mar.
Previous forecasts 37.17 50.00 50.00 50.00 46.87 Revised forecasts 37.17 45.92 45.00 45.00 43.34 Previous forecasts 110.71 105.00 105.00 105.00 106.10 Revised forecasts 110.71 105.32 100.00 100.00 103.63
Previous forecasts 7.12 16.80 - - 10.31 Revised forecasts 7.12 16.95 - - 10.28 Previous forecasts 1.58 1.34 1.94 1.94 1.68 Revised forecasts 1.58 1.36 2.14 1.94 1.74
JML Gas
CA$/mcf
Full year2016
JCC price US$/bbl
Exchange rate JP\/US$
JACOS Bitumen
US$/bbl
1. “JACOS Bitumen” stated herein Bitumen selling price of Japan Canada Oil Sands Ltd. (Deduction of Royalty).On the premise of a temporarily suspend a production operation in Demo area from May 2016, the second half of sales does not expect.
2. “JML Gas” stated herein gas sales price of JAPEX Montney Ltd. (Deduction of Royalty)
29
Revised Full Year Forecasts
30
Net Sales (left axis)
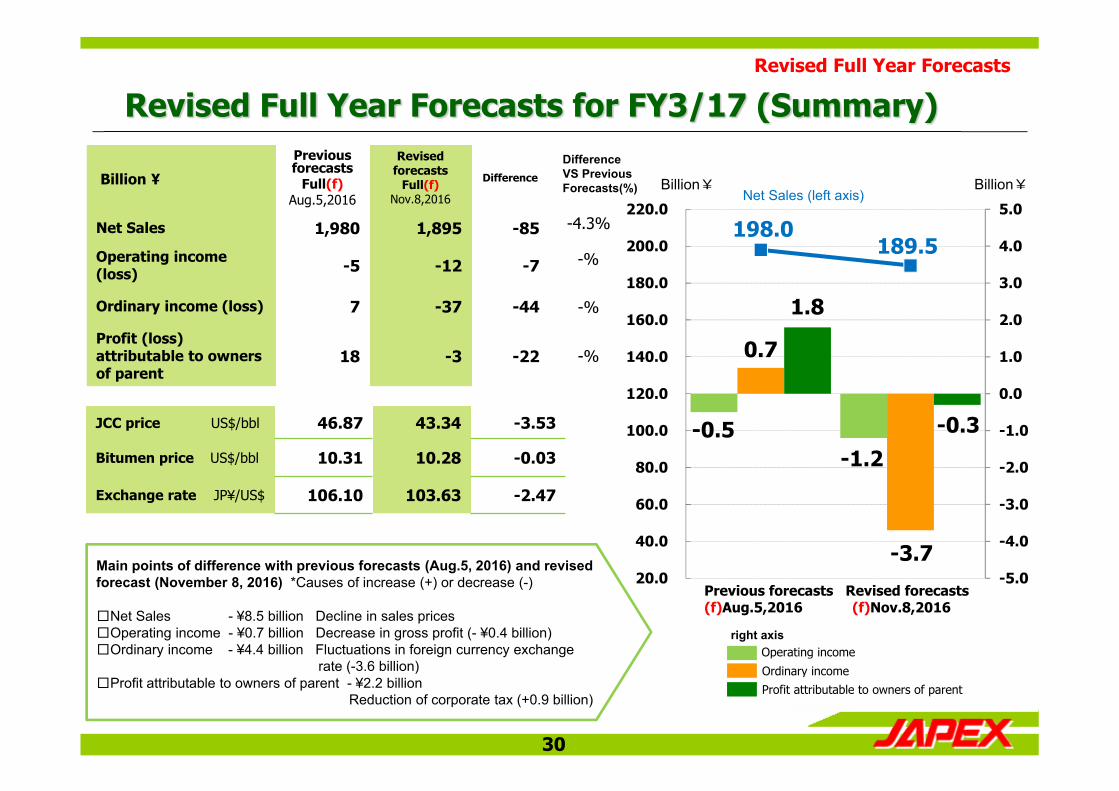
Revised Full Year Forecasts for FY3/17 (Summary)
Billion ¥
Previous forecasts
Full(f)Aug.5,2016
Revisedforecasts
Full(f)Nov.8,2016
Difference
Net Sales 1,980 1,895 -85
Operating income (loss) -5 -12 -7
Ordinary income (loss) 7 -37 -44
Profit (loss) attributable to owners of parent
18 -3 -22
JCC price US$/bbl 46.87 43.34 -3.53
Bitumen price US$/bbl 10.31 10.28 -0.03
Exchange rate JP¥/US$ 106.10 103.63 -2.47
-%
-%
-%
-4.3%
Billion¥ Billion¥
Operating income
Ordinary income Profit attributable to owners of parent
right axis
DifferenceVS Previous Forecasts(%)
Previous forecasts Revised forecasts(f)Aug.5,2016 (f)Nov.8,2016
Main points of difference with previous forecasts (Aug.5, 2016) and revised forecast (November 8, 2016) *Causes of increase (+) or decrease (-)
□Net Sales - ¥8.5 billion Decline in sales prices □Operating income - ¥0.7 billion Decrease in gross profit (- ¥0.4 billion)□Ordinary income - ¥4.4 billion Fluctuations in foreign currency exchange
rate (-3.6 billion)□Profit attributable to owners of parent - ¥2.2 billion
Reduction of corporate tax (+0.9 billion)
-0.5 -1.2
0.7
-3.7
1.8
-0.3
198.0 189.5
-5.0
-4.0
-3.0
-2.0
-1.0
0.0
1.0
2.0
3.0
4.0
5.0
20.0
40.0
60.0
80.0
100.0
120.0
140.0
160.0
180.0
200.0
220.0
Revised Full Year Forecasts
31
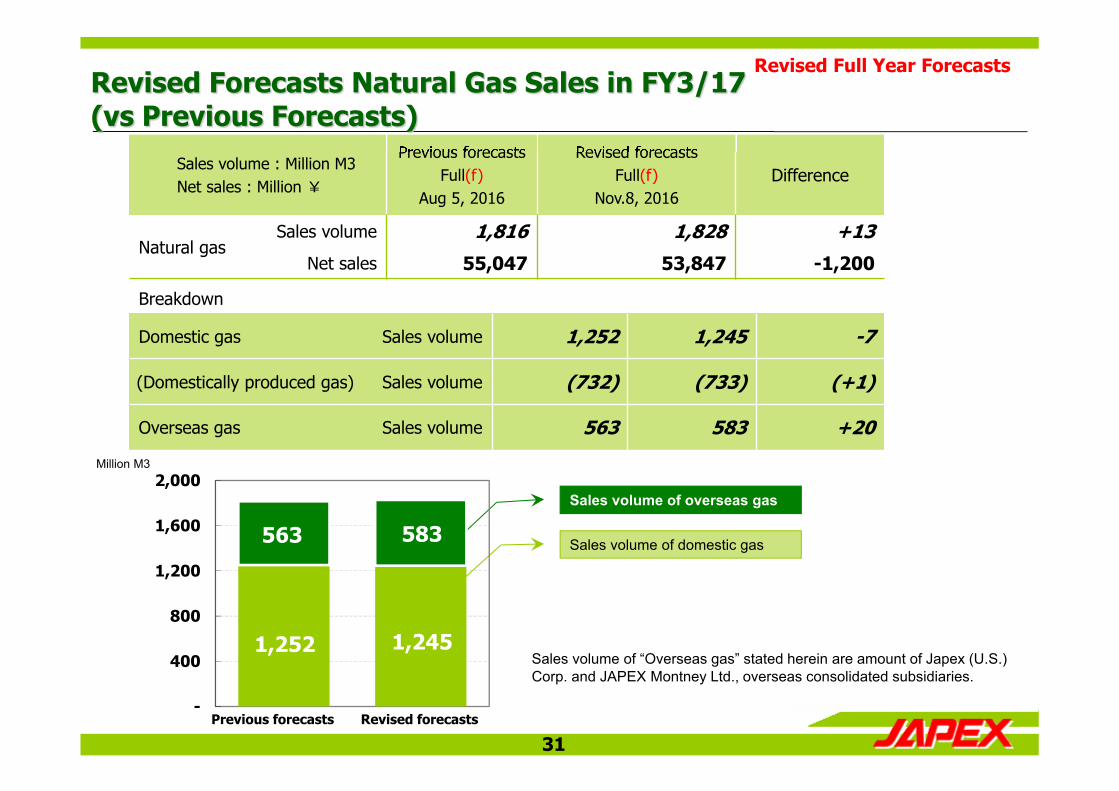
Sales volume : Million M3Net sales : Million ¥
Previous forecastsFull(f)
Aug 5, 2016
Revised forecastsFull(f)
Nov.8, 2016Difference
Natural gasSales volume 1,816 1,828 +13
Net sales 55,047 53,847 -1,200
Breakdown
Domestic gas Sales volume 1,252 1,245 -7
(Domestically produced gas) Sales volume (732) (733) (+1)
Overseas gas Sales volume 563 583 +20
Sales volume of overseas gas
Sales volume of domestic gas
Revised Forecasts Natural Gas Sales in FY3/17 (vs Previous Forecasts)
Million M3
Sales volume of “Overseas gas” stated herein are amount of Japex (U.S.) Corp. and JAPEX Montney Ltd., overseas consolidated subsidiaries.
1,252 1,245
563 583
-
400
800
1,200
1,600
2,000
Previous forecasts Revised forecasts
Revised Full Year Forecasts
32
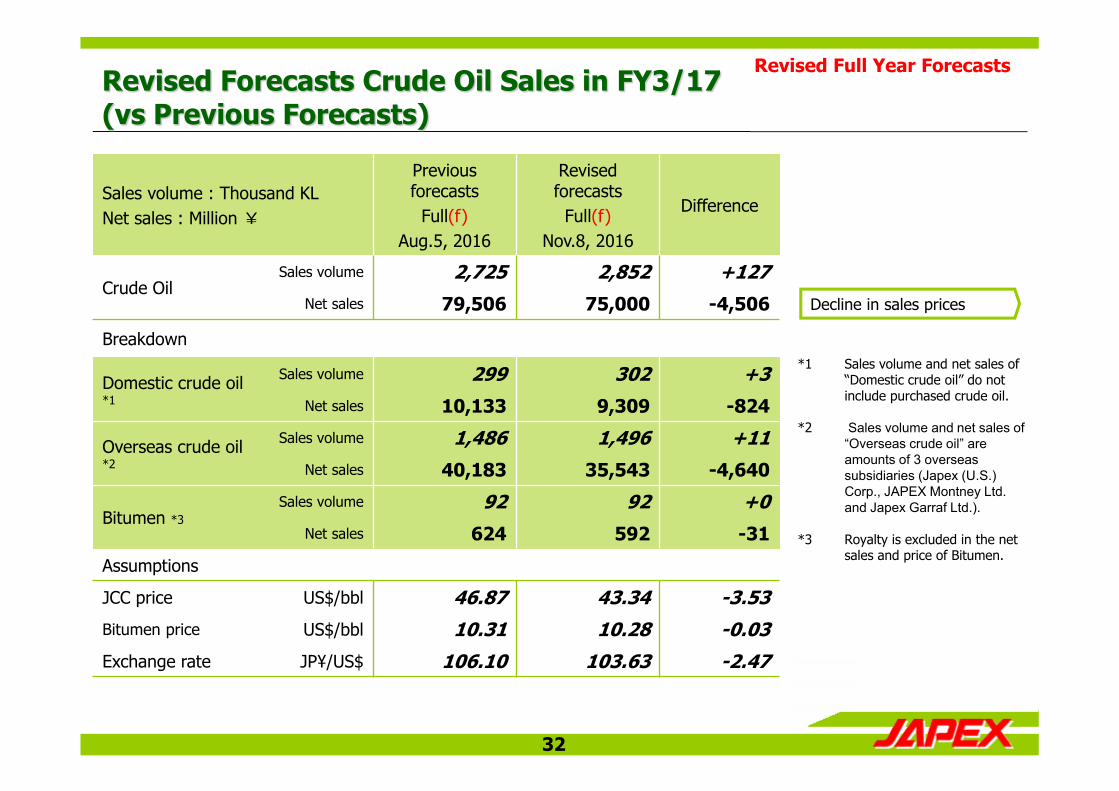
Sales volume : Thousand KLNet sales : Million ¥
Previous forecasts
Full(f)Aug.5, 2016
Revised forecasts
Full(f)Nov.8, 2016
Difference
Crude OilSales volume 2,725 2,852 +127
Net sales 79,506 75,000 -4,506
Breakdown
Domestic crude oil *1
Sales volume 299 302 +3Net sales 10,133 9,309 -824
Overseas crude oil *2
Sales volume 1,486 1,496 +11Net sales 40,183 35,543 -4,640
Bitumen *3Sales volume 92 92 +0
Net sales 624 592 -31
Assumptions
JCC price US$/bbl 46.87 43.34 -3.53Bitumen price US$/bbl 10.31 10.28 -0.03Exchange rate JP¥/US$ 106.10 103.63 -2.47
Decline in sales prices
Revised Forecasts Crude Oil Sales in FY3/17 (vs Previous Forecasts)
*1 Sales volume and net sales of “Domestic crude oil” do not include purchased crude oil.
*2 Sales volume and net sales of “Overseas crude oil” are amounts of 3 overseas subsidiaries (Japex (U.S.) Corp., JAPEX Montney Ltd. and Japex Garraf Ltd.).
*3 Royalty is excluded in the net sales and price of Bitumen.
Revised Full Year Forecasts
33
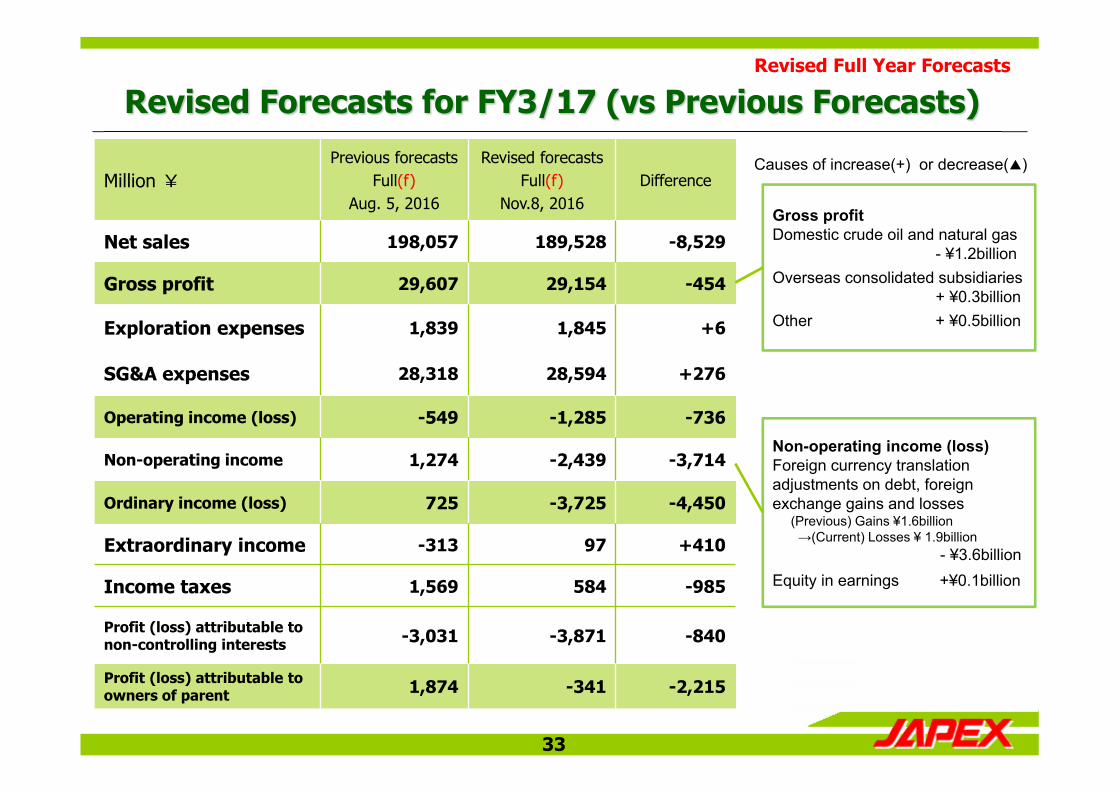
Revised Forecasts for FY3/17 (vs Previous Forecasts)
Causes of increase(+) or decrease(▲)Million ¥
Previous forecastsFull(f)
Aug. 5, 2016
Revised forecastsFull(f)
Nov.8, 2016Difference
Net sales 198,057 189,528 -8,529
Gross profit 29,607 29,154 -454
Exploration expenses 1,839 1,845 +6
SG&A expenses 28,318 28,594 +276
Operating income (loss) -549 -1,285 -736
Non-operating income 1,274 -2,439 -3,714
Ordinary income (loss) 725 -3,725 -4,450
Extraordinary income -313 97 +410
Income taxes 1,569 584 -985
Profit (loss) attributable to non-controlling interests -3,031 -3,871 -840
Profit (loss) attributable to owners of parent 1,874 -341 -2,215
Gross profitDomestic crude oil and natural gas
- ¥1.2billionOverseas consolidated subsidiaries
+ ¥0.3billionOther + ¥0.5billion
Non-operating income (loss)Foreign currency translation adjustments on debt, foreign exchange gains and losses
(Previous) Gains ¥1.6billion→(Current) Losses ¥ 1.9billion
- ¥3.6billionEquity in earnings +¥0.1billion
Revised Full Year Forecasts
34
Sales volume of overseas gas
Sales volume of domestic gas
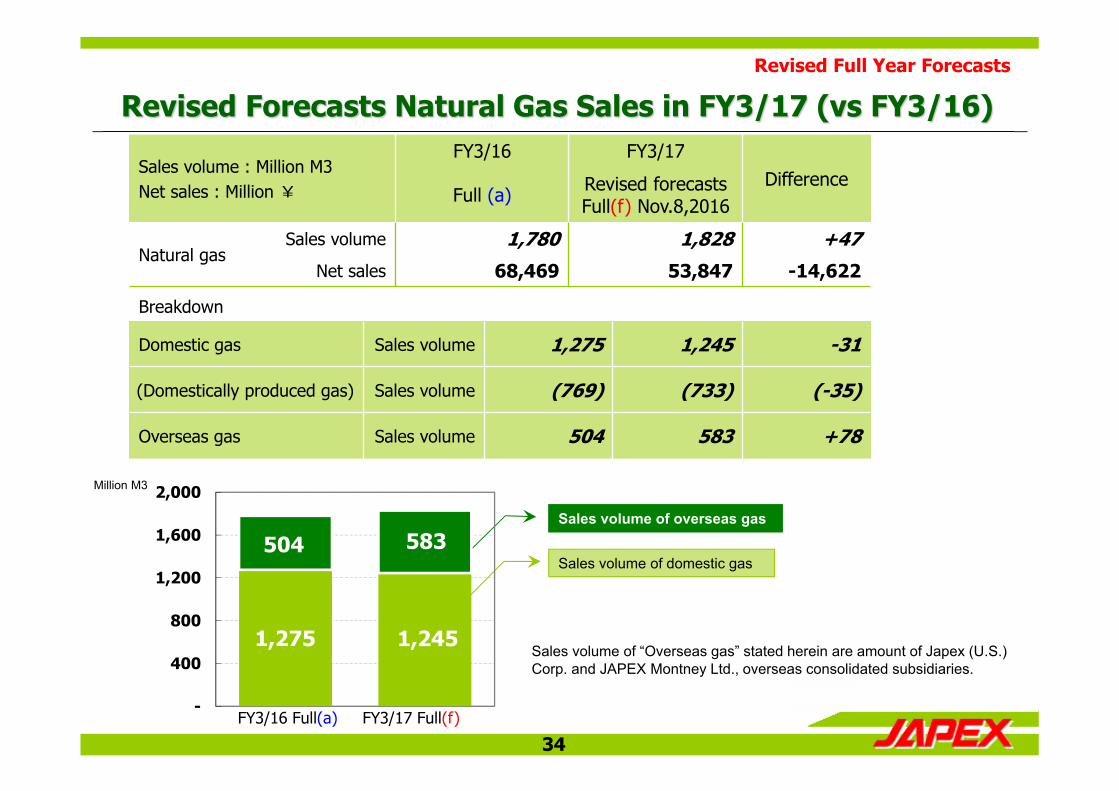
Revised Forecasts Natural Gas Sales in FY3/17 (vs FY3/16)
Million M3
FY3/16 Full(a) FY3/17 Full(f)
Sales volume of “Overseas gas” stated herein are amount of Japex (U.S.) Corp. and JAPEX Montney Ltd., overseas consolidated subsidiaries.
Sales volume : Million M3Net sales : Million ¥
FY3/16 FY3/17Difference
Full (a) Revised forecastsFull(f) Nov.8,2016
Natural gasSales volume 1,780 1,828 +47
Net sales 68,469 53,847 -14,622
Breakdown
Domestic gas Sales volume 1,275 1,245 -31
(Domestically produced gas) Sales volume (769) (733) (-35)
Overseas gas Sales volume 504 583 +78
1,275 1,245
504 583
-
400
800
1,200
1,600
2,000
Revised Full Year Forecasts
35
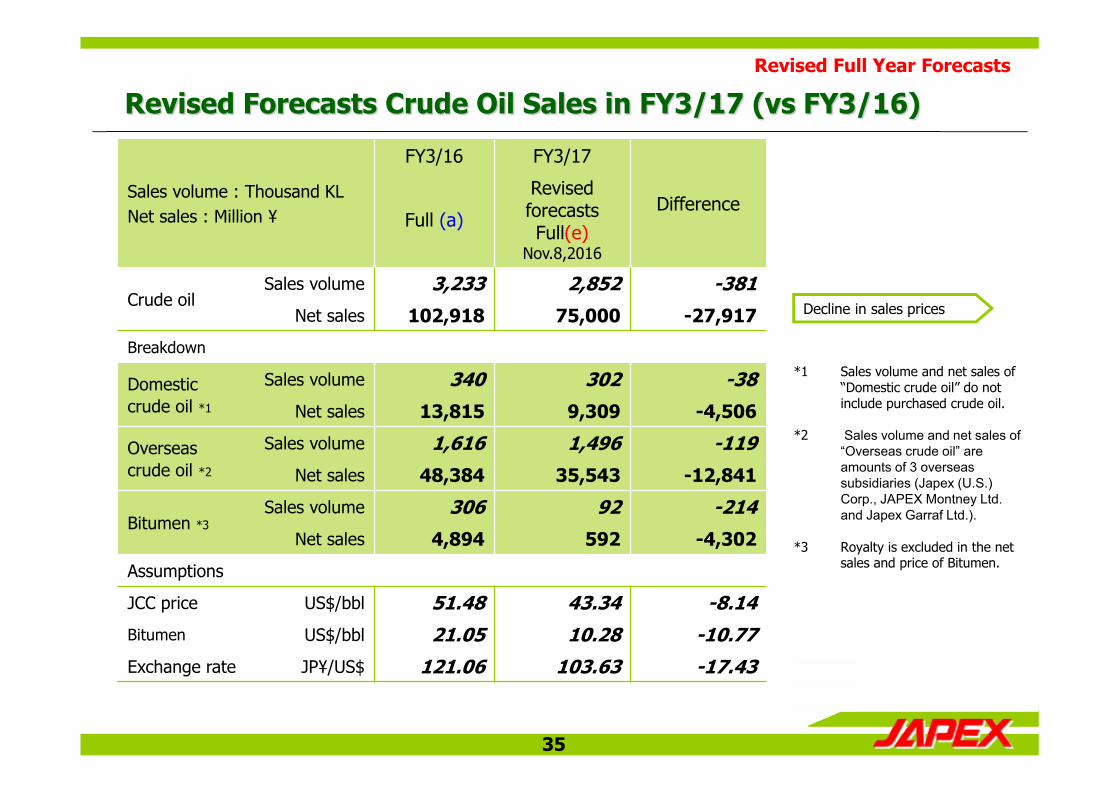
Sales volume : Thousand KLNet sales : Million ¥
FY3/16 FY3/17
DifferenceFull (a)
Revised forecastsFull(e)
Nov.8,2016
Crude oilSales volume 3,233 2,852 -381
Net sales 102,918 75,000 -27,917
Breakdown
Domestic crude oil *1
Sales volume 340 302 -38Net sales 13,815 9,309 -4,506
Overseas crude oil *2
Sales volume 1,616 1,496 -119Net sales 48,384 35,543 -12,841
Bitumen *3Sales volume 306 92 -214
Net sales 4,894 592 -4,302
Assumptions
JCC price US$/bbl 51.48 43.34 -8.14Bitumen US$/bbl 21.05 10.28 -10.77Exchange rate JP¥/US$ 121.06 103.63 -17.43
Revised Forecasts Crude Oil Sales in FY3/17 (vs FY3/16)
Decline in sales prices
*1 Sales volume and net sales of “Domestic crude oil” do not include purchased crude oil.
*2 Sales volume and net sales of “Overseas crude oil” are amounts of 3 overseas subsidiaries (Japex (U.S.) Corp., JAPEX Montney Ltd. and Japex Garraf Ltd.).
*3 Royalty is excluded in the net sales and price of Bitumen.
Revised Full Year Forecasts
36
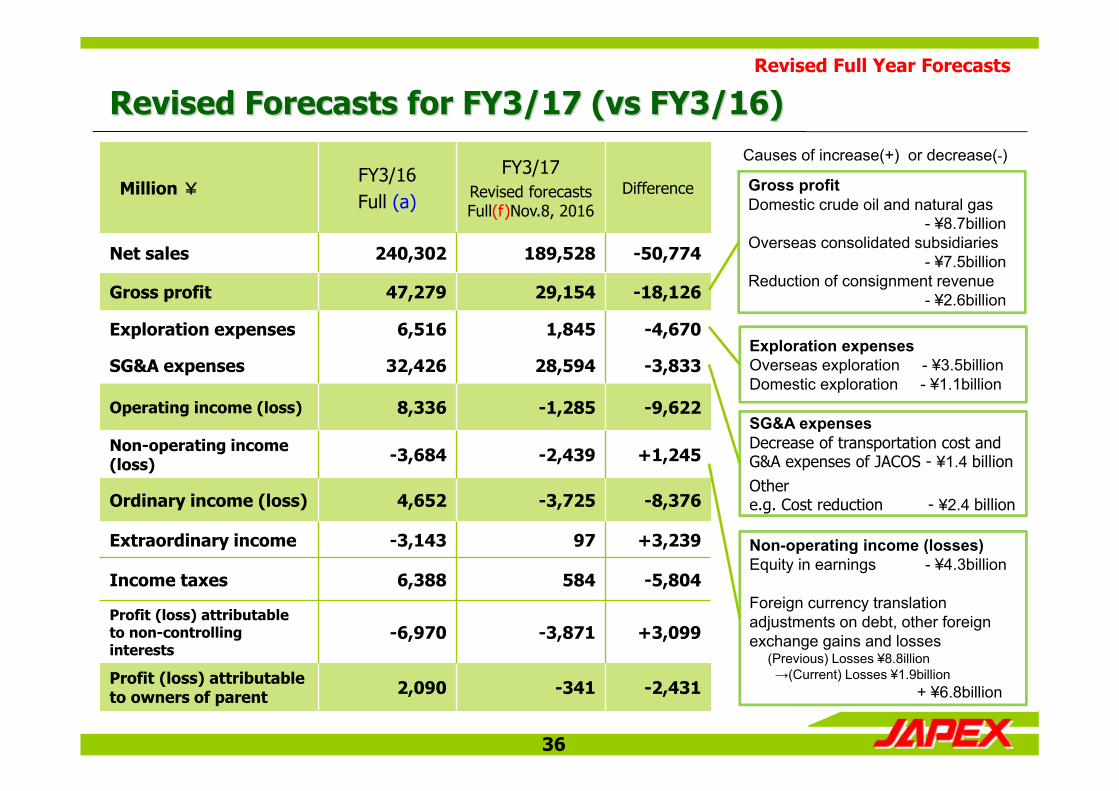
Revised Forecasts for FY3/17 (vs FY3/16)
Million ¥FY3/16Full (a)
FY3/17 Revised forecasts Full(f)Nov.8, 2016
Difference
Net sales 240,302 189,528 -50,774
Gross profit 47,279 29,154 -18,126
Exploration expenses 6,516 1,845 -4,670
SG&A expenses 32,426 28,594 -3,833
Operating income (loss) 8,336 -1,285 -9,622
Non-operating income (loss) -3,684 -2,439 +1,245
Ordinary income (loss) 4,652 -3,725 -8,376
Extraordinary income -3,143 97 +3,239
Income taxes 6,388 584 -5,804
Profit (loss) attributable to non-controlling interests
-6,970 -3,871 +3,099
Profit (loss) attributable to owners of parent 2,090 -341 -2,431
Exploration expensesOverseas exploration - ¥3.5billionDomestic exploration - ¥1.1billion
Gross profitDomestic crude oil and natural gas
- ¥8.7billionOverseas consolidated subsidiaries
- ¥7.5billionReduction of consignment revenue
- ¥2.6billion
Non-operating income (losses)Equity in earnings - ¥4.3billion
Foreign currency translation adjustments on debt, other foreign exchange gains and losses
(Previous) Losses ¥8.8illion→(Current) Losses ¥1.9billion
+ ¥6.8billion
Causes of increase(+) or decrease(-)
SG&A expensesDecrease of transportation cost and G&A expenses of JACOS - ¥1.4 billionOther e.g. Cost reduction - ¥2.4 billion
Revised Full Year Forecasts
37
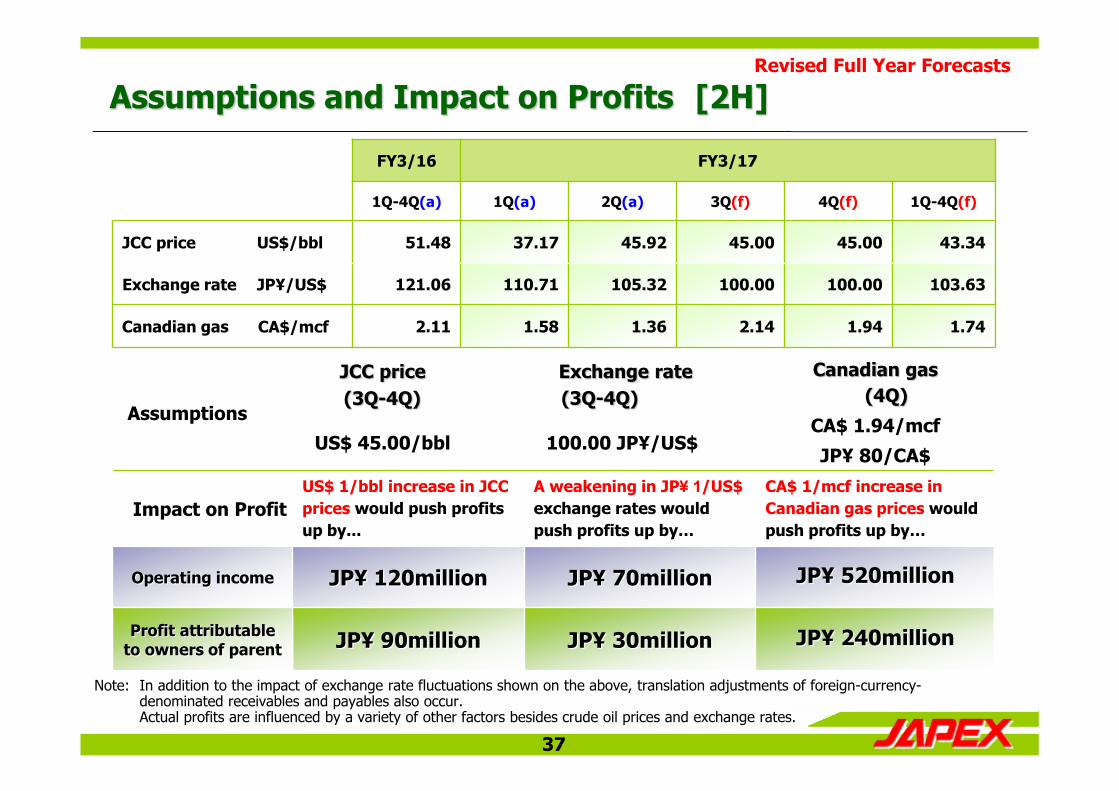
Assumptions
JCC price(3Q-4Q)
Exchange rate(3Q-4Q)
Canadian gas(4Q)
US$ 45.00/bbl 100.00 JP¥/US$CA$ 1.94/mcf
JP¥ 80/CA$
Impact on ProfitUS$ 1/bbl increase in JCC prices would push profits up by...
A weakening in JP¥ 1/US$exchange rates would push profits up by…
CA$ 1/mcf increase inCanadian gas prices would push profits up by…
Operating income JP¥ 120million JP¥ 70million JP¥ 520million
Profit attributable to owners of parent JP¥ 90million JP¥ 30million JP¥ 240million
FY3/16 FY3/17
1Q-4Q(a) 1Q(a) 2Q(a) 3Q(f) 4Q(f) 1Q-4Q(f)
JCC price US$/bbl 51.48 37.17 45.92 45.00 45.00 43.34
Exchange rate JP¥/US$ 121.06 110.71 105.32 100.00 100.00 103.63
Canadian gas CA$/mcf 2.11 1.58 1.36 2.14 1.94 1.74
Assumptions and Impact on Profits [2H]
Note: In addition to the impact of exchange rate fluctuations shown on the above, translation adjustments of foreign-currency-denominated receivables and payables also occur. Actual profits are influenced by a variety of other factors besides crude oil prices and exchange rates.
Revised Full Year Forecasts
38
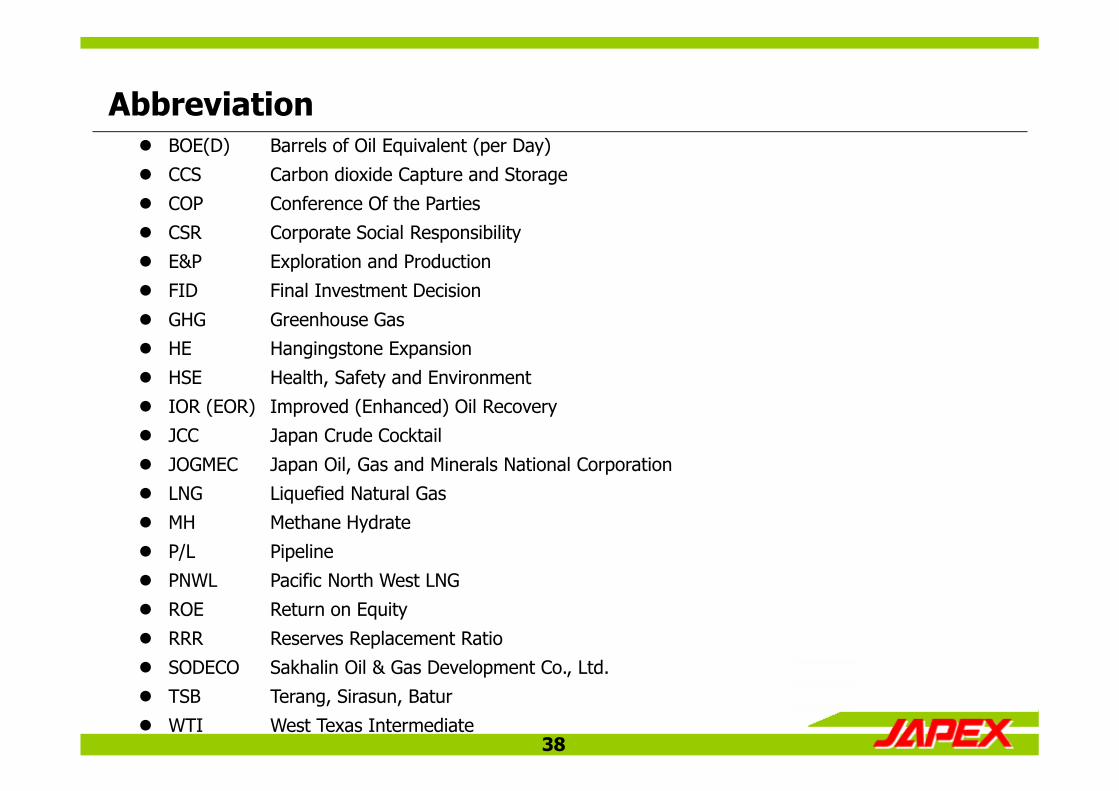
Abbreviation BOE(D) Barrels of Oil Equivalent (per Day) CCS Carbon dioxide Capture and Storage COP Conference Of the Parties CSR Corporate Social Responsibility E&P Exploration and Production FID Final Investment Decision
GHG Greenhouse Gas HE Hangingstone Expansion HSE Health, Safety and Environment IOR (EOR) Improved (Enhanced) Oil Recovery JCC Japan Crude Cocktail JOGMEC Japan Oil, Gas and Minerals National Corporation LNG Liquefied Natural Gas MH Methane Hydrate P/L Pipeline PNWL Pacific North West LNG ROE Return on Equity RRR Reserves Replacement Ratio SODECO Sakhalin Oil & Gas Development Co., Ltd. TSB Terang, Sirasun, Batur WTI West Texas Intermediate