Presentation Mar 2013 FINAL - · PDF fileVodafone, the Vodafone logo, Vodafone Mobile...
22
1 Annual results: Vodacom Group Limited 1 31 March 2013 Disclaimer The following presentation is being made only to, and is only directed at, persons to whom such presentations may lawfully be communicated (‘relevant persons’). Any person who is not a relevant person should not act or rely on this presentation or any of its contents. Information in the following presentation relating to the price at which relevant investments have been bought or sold in the past or the yield on such investments cannot be relied upon as a guide to the future performance of such investments. This presentation does not constitute an offering of securities or otherwise constitute an invitation or inducement to any person to underwrite, subscribe for or otherwise acquire securities in any company within the Group. Promotional material used in this presentation that is based on pricing or service offering may no longer be applicable. This presentation contains certain non-GAAP financial information which has not been reviewed or reported on by the Group’s auditors. The Group’s management believes these measures provide valuable additional information in understanding the performance of the Group or the Group’s businesses because they provide measures used by the Group to assess performance. However, this additional information presented is not uniformly defined by all companies, including those in the Group’s industry. Accordingly, it may not be comparable with similarly titled measures and disclosures by other companies. Additionally, although these measures are important in the management of the business, they should not be viewed in isolation or as replacements for or alternatives to, but rather as complementary to, the comparable GAAP measures. This presentation also contains forward-looking statements which are subject to risks and uncertainties because they relate to future events. These forward-looking statements include, without limitation, statements in relation to the Group’s projected financial results of the 2014-2016 financial years. Some of the factors which may cause actual results to differ from these forward-looking statements are discussed on slide 41 of this presentation. Vodafone, the Vodafone logo, Vodafone Mobile Broadband, Vodafone WebBox, Vodafone WebBook, Vodafone Smart tab, Vodafone 858 Smartphone, Vodafone Passport, Vodafone live!, Power to You, Vodacom, Vodacom M-Pesa, Vodacom Millionaires, Vodacom 4 Less and Vodacom Change the World are trademarks of Vodafone Group Plc (or have applications pending). The trademarks RIM ® , BlackBerry ® , are owned by Research in Motion Limited and are registered in the US and may be pending or registered in other countries. Java ® is a registered trademark of Oracle and/or its affiliates. Microsoft, Windows Mobile and ActiveSync are either registered trademarks or trademarks of Microsoft Corporation in the US and/or other countries. Google, Google Maps and Android are trademarks of Google Inc. Apple, iPhone and iPad are trademarks of Apple Inc., registered in the US and other countries. Other product and company names mentioned herein may be trademarks of their respective owners.
-
Upload
truongthuy -
Category
Documents
-
view
250 -
download
1
Transcript of Presentation Mar 2013 FINAL - · PDF fileVodafone, the Vodafone logo, Vodafone Mobile...

1
Annual results: Vodacom Group Limited1 31 March 2013
Disclaimer
The following presentation is being made only to, and is only directed at, persons to whom such presentations may lawfully be communicated (‘relevant persons’). Any person who is not a relevant person should not act or rely on this presentation or any of its contents.
Information in the following presentation relating to the price at which relevant investments have been bought or sold in the past or the yield on such investments cannot be relied upon as a guide to the future performance of such investments. This presentation does not constitute an offering of securities or otherwise constitute an invitation or inducement to any person to underwrite, subscribe for or otherwise acquire securities in any company within the Group.
Promotional material used in this presentation that is based on pricing or service offering may no longer be applicable.
This presentation contains certain non-GAAP financial information which has not been reviewed or reported on by the Group’s auditors. The Group’s management believes these measures provide valuable additional information in understanding the performance of the Group or the Group’s businesses because they provide measures used by the Group to assess performance. However, this additional information presented is not uniformly defined by all companies, including those in the Group’s industry. Accordingly, it may not be comparable with similarly titled measures and disclosures by other companies. Additionally, although these measures are important in the management of the business, they should not be viewed in isolation or as replacements for or alternatives to, but rather as complementary to, the comparable GAAP measures.
This presentation also contains forward-looking statements which are subject to risks and uncertainties because they relate to future events. These forward-looking statements include, without limitation, statements in relation to the Group’s projected financial results of the 2014-2016 financial years. Some of the factors which may cause actual results to differ from these forward-looking statements are discussed on slide 41 of this presentation.
Vodafone, the Vodafone logo, Vodafone Mobile Broadband, Vodafone WebBox, Vodafone WebBook, Vodafone Smart tab, Vodafone 858 Smartphone, Vodafone Passport, Vodafone live!, Power to You, Vodacom, Vodacom M-Pesa, Vodacom Millionaires, Vodacom 4 Less and Vodacom Change the World are trademarks of Vodafone Group Plc (or have applications pending). The trademarks RIM®, BlackBerry®, are owned by Research in Motion Limited and are registered in the US and may be pending or registered in other countries. Java® is a registered trademark of Oracle and/or its affiliates. Microsoft, Windows Mobile and ActiveSync are either registered trademarks or trademarks of Microsoft Corporation in the US and/or other countries. Google, Google Maps and Android are trademarks of Google Inc. Apple, iPhone and iPad are trademarks of Apple Inc., registered in the US and other countries. Other product and company names mentioned herein may be trademarks of their respective owners.

2
Annual results: Vodacom Group Limited2 31 March 2013
Annual results: Vodacom Group Limited3 31 March 2013
Highlights
Group data revenue
4.5%Group revenue
R69 917 million
22.2%
R9 998 million
Group EBITDA
10.9%
R25 253 million
Headline earnings
11.1%Free cash flow
R12 136 million
23.0%
872 cents per share
Dividends per share
10.6%
785 cents per share
3
Annual results: Vodacom Group Limited4 31 March 2013
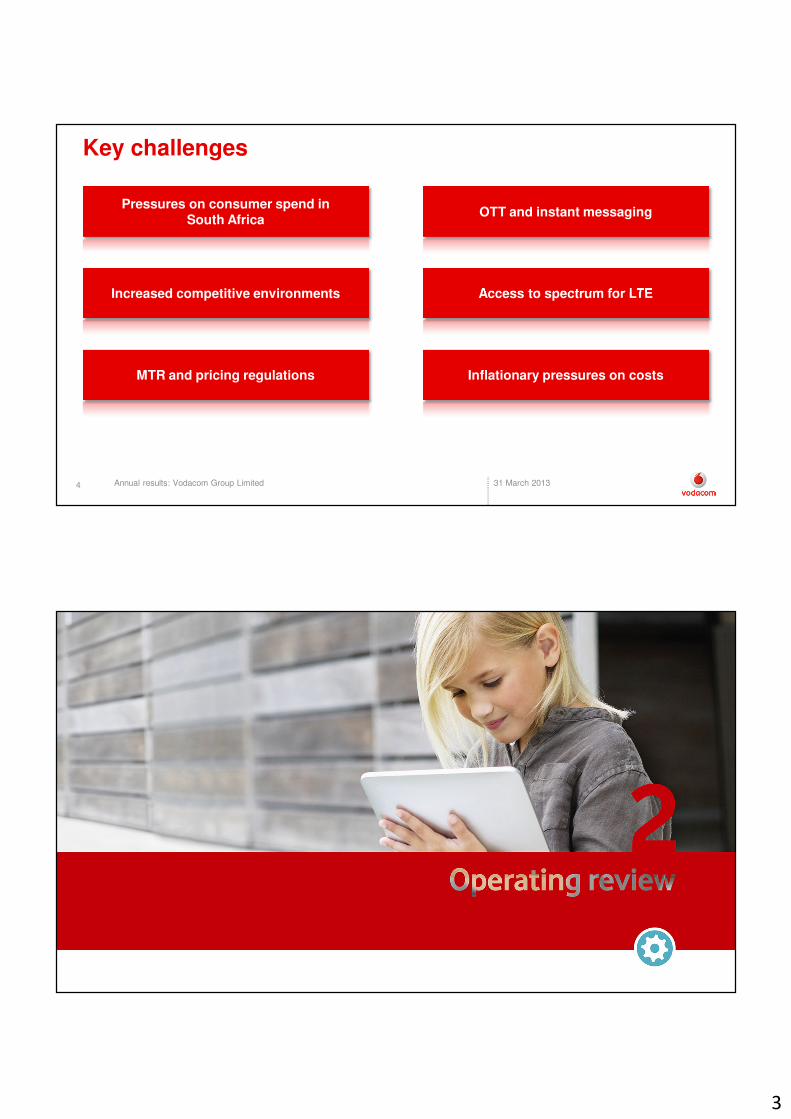
Key challenges
Pressures on consumer spend in South Africa
Increased competitive environments
MTR and pricing regulations
Access to spectrum for LTE
Inflationary pressures on costs
OTT and instant messaging
Annual results: Vodacom Group Limited5 31 March 2013

4
Annual results: Vodacom Group Limited6 31 March 2013
South Africa: Stepping up in a competitive market
• Launch of new contract and prepaid tariffs − Regained revenue market share in H2
• Data revenue growth accelerates
− Up 16.3% for the year (Q4: 20.5%)
• Tight expense control lifts EBITDA margin by 0.9ppt to 38.2%
• R6 967 million capital expenditure, 11.9% of revenue
Key indicators 2013 % change
Service revenue (Rm) 48 234 (0.4)
Revenue (Rm) 58 607 2.9
EBITDA (Rm) 22 408 5.4
Active customers (m) 30.3 4.9
Active data customers (m) 14.4 18.1
Smartphones (m) 6.0 26.0
Annual results: Vodacom Group Limited7 31 March 2013
International: Strong growth and margin improvement
• Excellent commercial execution underpins strong revenue growth
• Data adoption increasing with 4.1 million active data customers
− Data revenue up 106.9%
• Scale boosts EBITDA margin by 9ppt
• Substantial network expansion to capture growth
− Capex up 70.5% to R2 864 million
Key indicators 2013 % change
Service revenue (Rm) 11 258 11.0 (22.3*)
Revenue (Rm) 11 583 11.1 (21.1*)
EBITDA (Rm) 2 739 87.5 (67.8*)
Active customers (m) 21.3 12.9
Active data customers (m) 4.1 40.9
Outgoing voice traffic (bn) 14.4 50.6
* Represents normalised growth excluding foreign exchange gains/losses and at a constant currency from on-going operations
35.5 21.4 30.7
Tanzania DRC Mozambique
Underlying service revenue growth (%)

5
Annual results: Vodacom Group Limited8 31 March 2013
Tanzania: Success driven by innovation
• Strengthened management team
• Market share gains underpinned by increased regional distribution
• Leading the market with M-Pesa offering and features
• Innovative pricing plans and customer value management
• Increased network sites by 41%
Key indicators 2013 % change
Revenue (TZS billion) 751 33.9
EBITDA (TZS billion) 289 68.7
EBITDA margin (%) 37.4 7.8ppt
Capex intensity (%) 30.0 10.5ppt
Customers (m) 9.5 (2.1)
ARPU (US $) 4.2 23.5
Annual results: Vodacom Group Limited9 31 March 2013
6
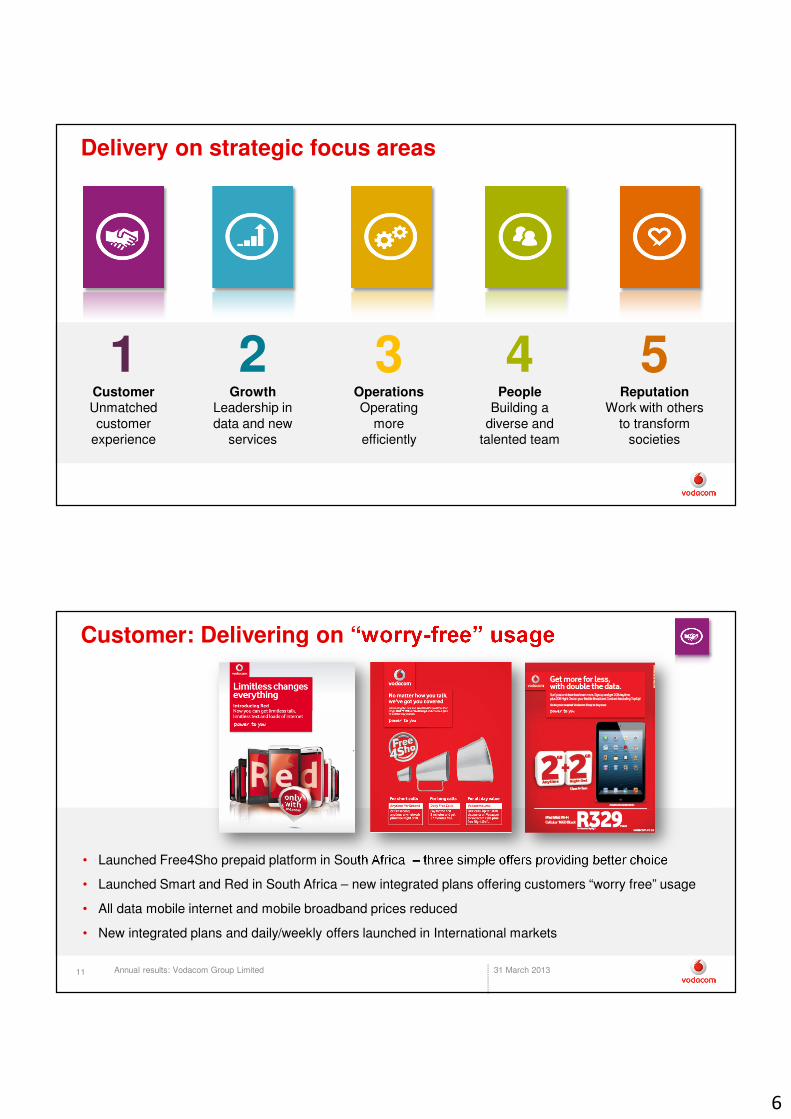
Delivery on strategic focus areas
1CustomerUnmatched customer
experience
2Growth
Leadership in data and new
services
3OperationsOperating
more efficiently
4People
Building a diverse and
talented team
5Reputation
Work with others to transform
societies
Annual results: Vodacom Group Limited11 31 March 2013
Customer: Delivering on “worry-free” usage
• Launched Free4Sho prepaid platform in South Africa – three simple offers providing better choice
• Launched Smart and Red in South Africa – new integrated plans offering customers “worry free” usage
• All data mobile internet and mobile broadband prices reduced
• New integrated plans and daily/weekly offers launched in International markets

7
Annual results: Vodacom Group Limited12 31 March 2013
Customer: Network experience as a key differentiator
• Capital investment of R9 456 million, 13.5% of revenue
• 1 752 3G and 1 406 2G sites added across the Group
• Single RAN being deployed in all our operations, expected to complete all in 2014/2015
• First to launch LTE in South Africa, 601 sites operational
Fastest speeds in South Africa SA 3G sites on 43.2Mbps SA self-provided transmission
2 636 4 374 6 073
28.0
46.5
64.6
2011 2012 2013
Sites % of sites
502 3 387 5 236
5.3
36.0
55.7
2011 2012 2013
Sites % of sites
7.9 4.86.0 3.64.7 2.9
iOS downloadspeed (3 month)
Android downloadspeed (3 month)
Vodacom SA Operator A Operator B
Mbps
Annual results: Vodacom Group Limited13 31 March 2013
Customer: Evolving to smarter service
• Smart crews in retail stores to ensure perfect start up on smartphones
• New retail store format being rolled out – 25% of stores to be completed this year in South Africa
• Launched new Vodacom self-help App – 2 000 downloads a day
• Leveraging online and social media channels for service
• Improved first-time call resolution in South Africa, 25% less calls to customer care

8
Annual results: Vodacom Group Limited14 31 March 2013
11 258
10 143
7 957
2013
2012
2011
2 864
1 679
1 208
2013
2012
2011
Growth: Increasing contribution from International
• Mobile penetration in our current footprint below 40%
• Strong GDP growth prospects
• Growing demand for data and mobile money services
• Accelerated investment to capture growth potential
• Actively looking for more expansion opportunities
70.6%
International capital expenditure (Rm)
17.3%* of Group service revenue
International service revenue (Rm)
22.3%*
R11bn
Annual results: Vodacom Group Limited15 31 March 2013
9 998
8 179
6 433
2013
2012
2011
Growth: Accelerating take-up of mobile data services
• 3G now available in all markets and LTE in South Africa
− 3G coverage at 85% in SA
• Driving smartphone and tablet penetration
− Supported by increased financing provided by Vodacom
• Growing active data customers and data bundle penetration
− 22.5% growth in Group active data customers, 35.8% penetration
• More affordable data plans
22.2%
Group data revenue (Rm)
16.8%of Group service revenue
R10bn
9
Annual results: Vodacom Group Limited16 31 March 2013
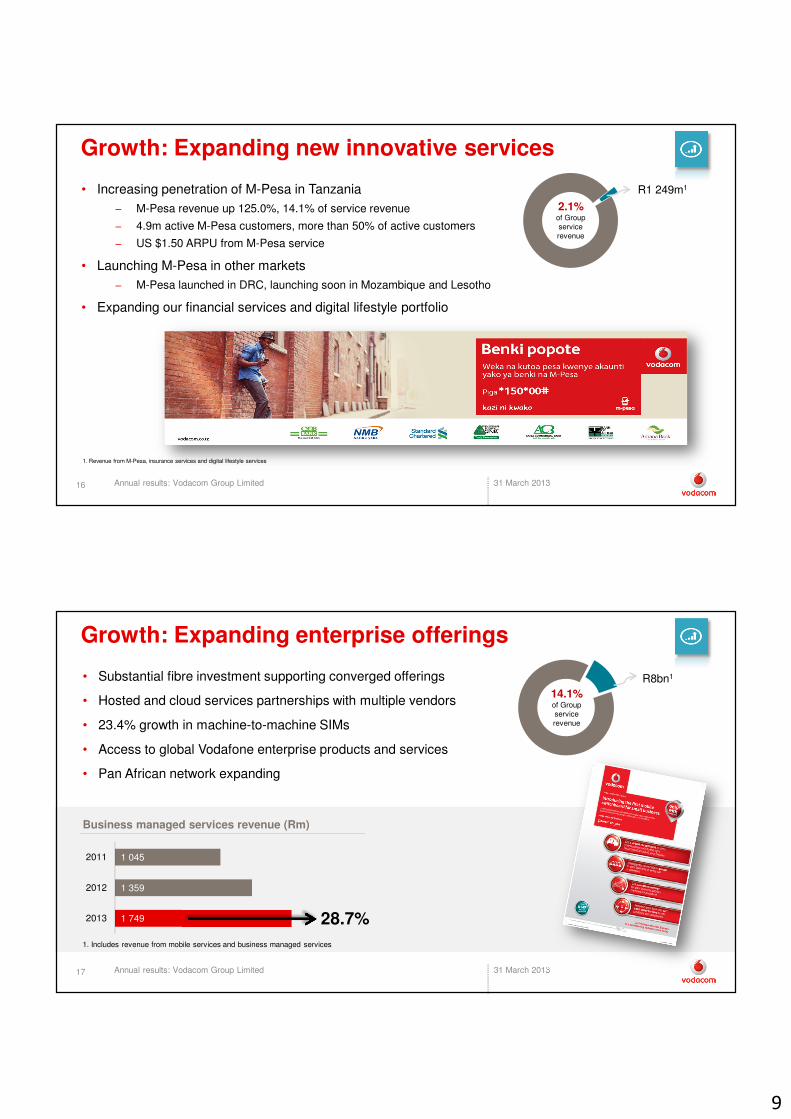
Growth: Expanding new innovative services
• Increasing penetration of M-Pesa in Tanzania
− M-Pesa revenue up 125.0%, 14.1% of service revenue
− 4.9m active M-Pesa customers, more than 50% of active customers
− US $1.50 ARPU from M-Pesa service
• Launching M-Pesa in other markets
− M-Pesa launched in DRC, launching soon in Mozambique and Lesotho
• Expanding our financial services and digital lifestyle portfolio
2.1% of Group service revenue
R1 249m1
1. Revenue from M-Pesa, insurance services and digital lifestyle services
Annual results: Vodacom Group Limited17 31 March 2013
1 749
1 359
1 045
2013
2012
2011
Growth: Expanding enterprise offerings
• Substantial fibre investment supporting converged offerings
• Hosted and cloud services partnerships with multiple vendors
• 23.4% growth in machine-to-machine SIMs
• Access to global Vodafone enterprise products and services
• Pan African network expanding
28.7%
Business managed services revenue (Rm)
14.1% of Group service revenue
R8bn1
1. Includes revenue from mobile services and business managed services
10
Annual results: Vodacom Group Limited18 31 March 2013
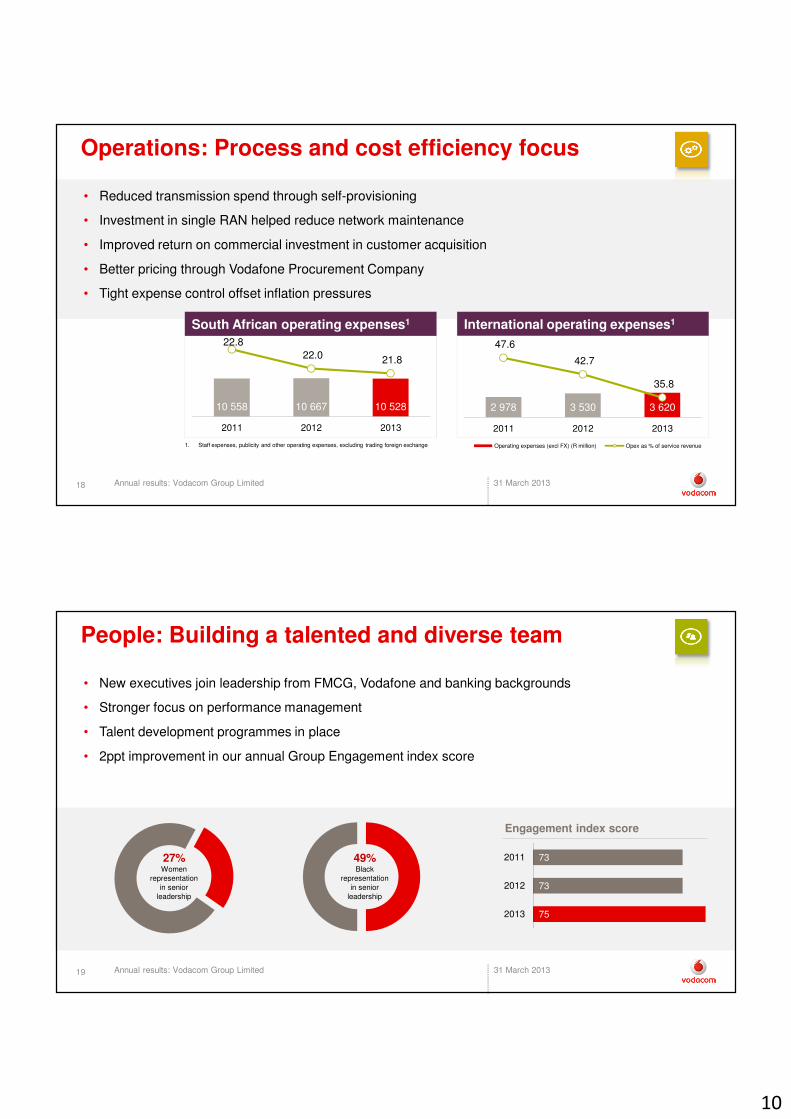
Operations: Process and cost efficiency focus
• Reduced transmission spend through self-provisioning
• Investment in single RAN helped reduce network maintenance
• Improved return on commercial investment in customer acquisition
• Better pricing through Vodafone Procurement Company
• Tight expense control offset inflation pressures
South African operating expenses1
10 558 10 667 10 528
22.8
22.0 21.8
2011 2012 2013
International operating expenses1
2 978 3 530 3 620
47.6
42.7
35.8
2011 2012 2013
Operating expenses (excl FX) (R million) Opex as % of service revenue1. Staff expenses, publicity and other operating expenses, excluding trading foreign exchange
Annual results: Vodacom Group Limited19 31 March 2013
People: Building a talented and diverse team
27% Women
representation in senior
leadership
49% Black
representation in senior
leadership
• New executives join leadership from FMCG, Vodafone and banking backgrounds
• Stronger focus on performance management
• Talent development programmes in place
• 2ppt improvement in our annual Group Engagement index score
75
73
73
2013
2012
2011
Engagement index score

11
Annual results: Vodacom Group Limited20 31 March 2013
Reputation: Work with others to transform societies
In all markets
• Connecting educators and learners
• Facilitating improved access to healthcare
• Reducing our carbon footprint
• Partnering with stakeholders on key projects
Score in annual Reputation Survey 2013 2012
South Africa 7.54 7.36
Tanzania 8.14 7.63
DRC 8.02 7.09
Mozambique 8.16 8.33
Lesotho 7.43 7.87
Annual results: Vodacom Group Limited21 31 March 2013

12
Annual results: Vodacom Group Limited22 31 March 2013
Group income statementR million 2013 2012 % change % change*
Service revenue 59 336 58 245 1.9 2.9
Revenue 69 917 66 929 4.5 5.3
EBITDA 25 253 22 763 10.9 10.3
Depreciation and amortisation (6 364) (5 882) 8.2
Impairment losses (14) (199) (93.0)
Operating profit 18 897 16 617 13.7 12.4
Profit on sale of subsidiary 224 -
Net finance charges (687) (684) 0.3
Profit before tax 18 434 15 933 15.7
Taxation (5 210) (5 730) (9.1)
Net profit 13 224 10 203 29.6
Attributable to:
Equity shareholders 12 990 10 156 27.9
Non-controlling interests 234 47 > 200.0
HEPS (cents) 872 709 23.0
Weighted average shares in issue (million) 1 463 1 463 -
* Represents normalised growth excluding foreign exchange gains/losses and at a constant currency from on-going operations
Annual results: Vodacom Group Limited23 31 March 2013
56 596 58 264
581 5
1 749
281
(948)
FY 2012service revenue*
Mobileinterconnect*
Mobile voice* Mobilemessaging*
Mobile data* Other servicerevenue*
FY 2013service revenue*
Service revenue growth boosted by data
Group service revenue normalised growth by category
R million
2.9%*

13
Annual results: Vodacom Group Limited24 31 March 2013
Quarterly service revenue growth trends
International service revenue growthSouth African revenue growth
1.80.7
(1.7) (2.2)
4.6 3.5 1.3 1.3
Q1 Q2 Q3 Q4Reported growth Underlying growth
Underlying growth adjusts for MTRs, leap year impact and deferred revenue (International MNOs only)
46.8 27.4
(4.1)(12.9)
36.0 32.1 23.3 17.6
Q1 Q2 Q3 Q4
Reported growth Underlying growth
• Further MTR cut on 1 March 2013
• Q4 leap year/Easter impact of ±R140m
• 69% cut in MTR in Tanzania in Q4
• Q4 deferred revenue adjustment of R209 million (Q3: R37 million)
• Q4 leap year impact of ±R20 million
Annual results: Vodacom Group Limited25 31 March 2013
Delivered on cost saving programmes
R million Group % change* South Africa % change* International % change*
Staff expenses 4 349 (0.5) 3 062 (0.8) 1 034 1.2
Publicity expenses 1 960 5.6 1 438 6.6 513 3.1
Other operating expenses 7 948 (2.1) 6 249 (3.2) 2 129 3.0
Operating expenses 14 257 (0.6) 10 749 (1.3) 3 676 2.5
• Lower Group operating expenses – reduced as percentage of service revenue from 24.4%* to 24.0%*
• South African operating expenses reduced
− Lower network running costs
− Reduced call centre and logistic unit costs
• International operating expenses well contained below revenue growth
− Procurement synergies and scale benefits

14
Annual results: Vodacom Group Limited26 31 March 2013
Group EBITDA margin expanded 2.1ppts to 36.1%
Group EBITDA
22 763 23 046 25 253
2831 679
1 223
58
(194) (559)
FY 2012EBITDA
Trading andtranslation FX
FY 2012EBITDA
Trading FX MTR impact South AfricaEBITDA
excl MTR
InternationalEBITDA
excl MTR
Corporate andeliminations
EBITDA
FY 2013EBITDA
R million
1. Restated to FY 2013 foreign exchange rates and excluding trading foreign exchange2. Excluding trading foreign exchange and at a constant currency
1
2 2 2
10.3%*
Annual results: Vodacom Group Limited27 31 March 2013
Net debt supports zaAA+ national long-term credit rating
R million 2013 2012
Net finance costs (810) (639)
Remeasurement of loans (30) (51)
Gain/(loss) on remeasurement 40 (14)
Gain on derivatives1 113 20
Net finance charges (687) (684)
Average cost of debt (%) 7.0 7.3
Group net finance charges Group net debt
R million 2013 2012
Bank and cash balances 6 528 3 781
Bank overdrafts (340) (409)
Borrowings and derivative financial instruments
(14 195) (11 039)
Net debt (8 007) (7 667)
Net debt/EBITDA (times) 0.3 0.3
Average debt (12 114) (10 786)
1. Mainly revaluation of foreign currency exchange contracts

15
Annual results: Vodacom Group Limited28 31 March 2013
Taxation expense favourably impacted by change in STC
Group tax
4 659 5 730 5 210
36.9 36.0
28.3
FY 2011 FY 2012 FY 2013
Taxation Effective tax rate
R million/%
R million 2013 Rate (%)
Normal tax 5 162 28.0
Non-deductible interest 97 0.5
Withholding tax 133 0.7
Other disallowed expenditure 143 0.8
Tax losses utilised in the year (216) (1.2)
Deferred tax recognised (183) (1.0)
Other 75 0.5
Total tax expense/effective tax rate 5 210 28.3
Group tax reconciliation
Annual results: Vodacom Group Limited29 31 March 2013
709
694
(15)
HEPS
Impairmentlosses
and other
EPS
Headline earnings per share
FY 2012 headline earnings per share
872
887
15
HEPS
Profit on disposal ofsubsidiary and
other
EPS
Cents per share
FY 2013 headline earnings per share
Cents per share
23.0%
27.8%

16
Annual results: Vodacom Group Limited30 31 March 2013
Group statement of financial position
R million 2013 2012 Movement
Assets
Property, plant and equipment 27 741 24 367 3 374
Intangible assets 5 332 5 123 209
Other non-current assets 1 361 1 188 173
Current assets 21 157 17 552 3 605
Total assets 55 591 48 230 7 361
Equity and liabilities
Total equity 21 216 18 930 2 286
Borrowings 14 171 11 016 3 155
Other liabilities 20 204 18 284 1 920
Total equity and liabilities 55 591 48 230 7 361
Net asset value 21 216 18 930 2 286
Annual results: Vodacom Group Limited31 31 March 2013
24 367 27 741
7 645
1 146(5 169) (248)
FY 2012net book
value
Netadditions
Depreciation Foreignexchange
Other FY 2013net book
value
5 123 5 332
1 233
10566
(1 195)
FY 2012net book
value
Netadditions
Amortisation Foreignexchange
Other FY 2013net book
value
Group PPE and intangible assets
Property, plant and equipment Intangible assets
R million R million

1
Annual results: Vodacom Group Limited32 31 March 2013
Free cash flow
Group free cash flow
25 253 25 320 18 158 12 136
1 094(1 027)
(7 162)
(667) (32)
(5 323)
FY 2013EBITDA
Devicefinancing
working capitalinvestment
Normalworking capital
& other
Cashgenerated
fromoperations
Cash capitalexpenditure
Operatingfree cash
flow
Net financecosts paid
Net dividendsreceived &
dividends paidto minority
shareholders
Tax paid FY 2013free cash
flow
7.2%
3.3%10.9%
11.1%
R million
1. Cash capital expenditure comprises the purchase of property, plant and equipment and intangible assets, other than license and spectrum payments, net of cash flow from disposals
1
Annual results: Vodacom Group Limited33 31 March 2013
Track record of delivering shareholder returns
• 10.6% growth in total dividend for the year to 785 cents per share
• Payout ratio of 90% of HEPS supported by strong cash flow generation
• Dividend policy unchanged – “at least 90% of headline earnings per share”
Dividend per share
180 180260
355280
280
450430
FY 2010 FY 2011 FY 2012 FY 2013
Interim dividend Final dividend
Cents per share
*
710
23% TSR CAGR
since listing(Bloomberg)
520
460
785
18
Annual results: Vodacom Group Limited34 31 March 2013
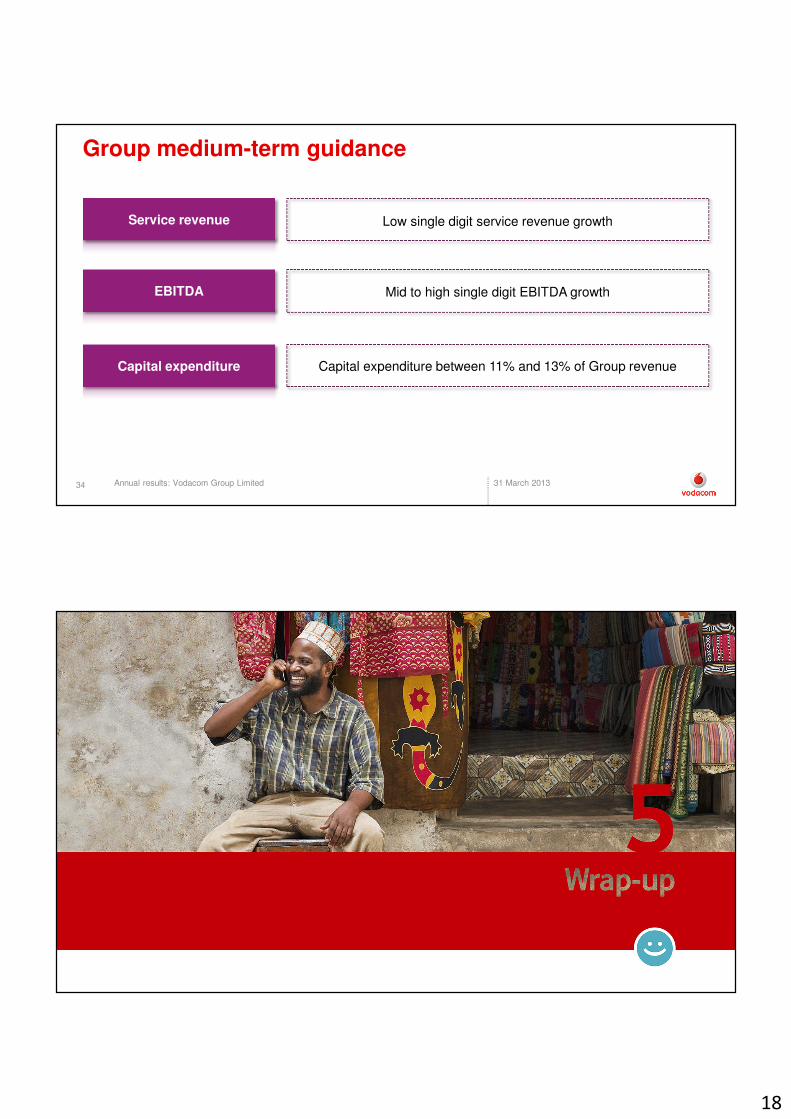
Group medium-term guidance
Service revenue
EBITDA
Capital expenditure
Low single digit service revenue growth
Mid to high single digit EBITDA growth
Capital expenditure between 11% and 13% of Group revenue
Annual results: Vodacom Group Limited35 31 March 2013

19
Annual results: Vodacom Group Limited36 31 March 2013
Key priorities
Customer Growth Operations People Reputation
• Pricing transformation
• Best service in retail and Online
• Best network experience
• NPS leadership
• Increase smartphones
• OneNet launch for SMMEs
• M-Pesa launches in all countries
• Pursue expansion opportunities
• Cost programmes to deliver flat opex
• Customer facing system investment
• Invest to save
• Improved returns on commercial spend
• Continued investment in talent programmes
• Deliver on diversity targets
• Acquire talent in new growth areas
• Deliver on targeted school rollout plan
• Connect health providers to mHealth platform
• Align broadband rollout plans with governments
Annual results: Vodacom Group Limited37 31 March 2013
20
Annual results: Vodacom Group Limited38 31 March 2013
Annual results: Vodacom Group Limited39 31 March 2013
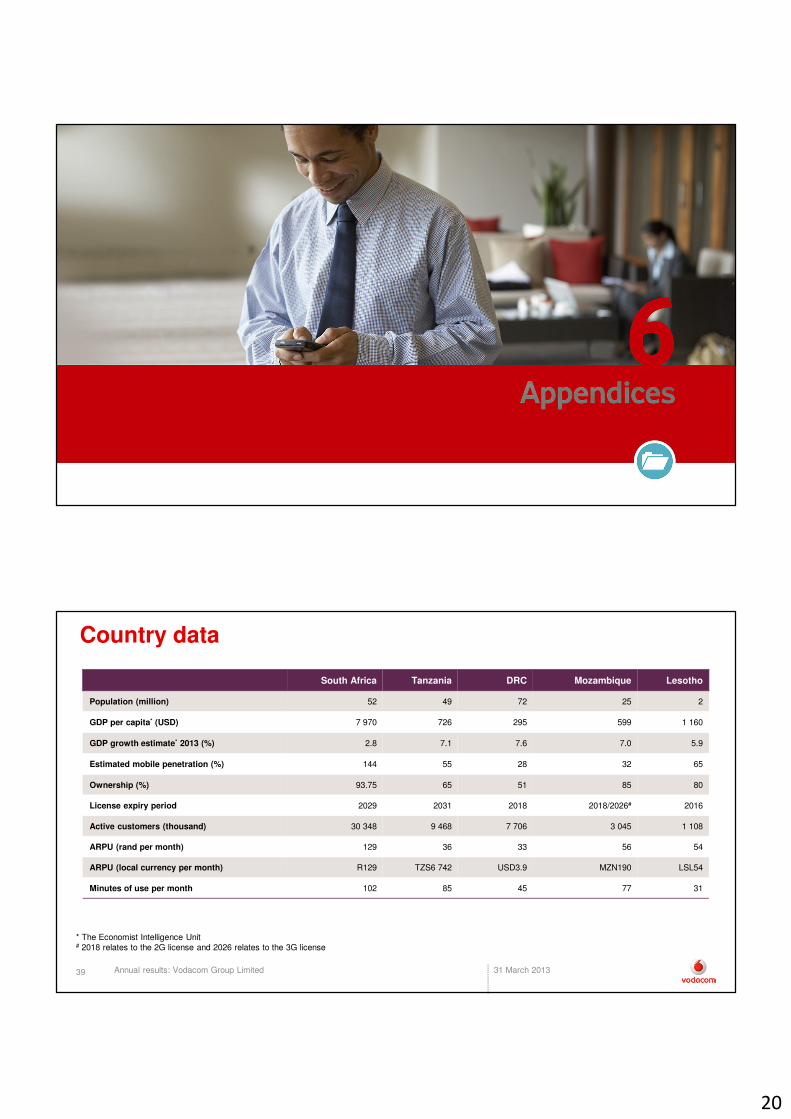
Country data
South Africa Tanzania DRC Mozambique Lesotho
Population (million) 52 49 72 25 2
GDP per capita* (USD) 7 970 726 295 599 1 160
GDP growth estimate* 2013 (%) 2.8 7.1 7.6 7.0 5.9
Estimated mobile penetration (%) 144 55 28 32 65
Ownership (%) 93.75 65 51 85 80
License expiry period 2029 2031 2018 2018/2026# 2016
Active customers (thousand) 30 348 9 468 7 706 3 045 1 108
ARPU (rand per month) 129 36 33 56 54
ARPU (local currency per month) R129 TZS6 742 USD3.9 MZN190 LSL54
Minutes of use per month 102 85 45 77 31
* The Economist Intelligence Unit# 2018 relates to the 2G license and 2026 relates to the 3G license

21
Annual results: Vodacom Group Limited40 31 March 2013
4
Impact of foreign exchange
FY 2013 Reported Normalised*
South Africa 5.4 5.7
International 87.5 67.8
Group 10.9 10.3
Average exchange rates
FY 2013 FY 2012 % change
USD/ZAR 8.51 7.45 14.2
ZAR/MZN 3.42 3.78 (9.5)
ZAR/TZS 187.30 216.73 (13.6)
EUR/ZAR 10.97 10.24 7.1
Revenue
EBITDA
FY 2013 Reported Normalised*
South Africa 2.9 2.9
International 11.1 21.1
Group 4.5 5.3
YoY % growth
YoY % growth
Annual results: Vodacom Group Limited41 31 March 2013
Active customers Active customers are based on the total number of mobile customers using any service during the three months. This includes customers paying a monthly fee that entitles them to use the service even if they do not actually use the service and those customers who are active whilst roaming.
Active data customers Number of unique customers who have generated revenue related to any data activities in relation to mobile data revenue (this excludes SMS and MMS messaging users) in the reported month. A user is defined as being active if they are paying for a contractual monthly fee for this service or have used the service during the reported period.
ARPU Total ARPU is calculated by dividing the average monthly service revenue by the average monthly active customers during the period.
Contribution margin Revenue less direct expenses as a percentage of revenue.
EBITDA Earnings before interest, taxation, depreciation, amortisation, impairment losses, profit/loss on disposal of investments and on disposal of property, plant and equipment, investment properties and intangible assets.
Free cash flow Cash generated from operations less additions to property, plant and equipment and intangible assets, proceeds on disposal of property, plant and equipment and intangible assets, tax paid, net finance charges paid and net dividends received/paid to minority shareholders.
HEPS Headline earnings per share.
International International comprises the segment information relating to the non-South African-based cellular networks in Tanzania, the Democratic Republic of Congo, Mozambiqueand Lesotho as well as the operations of Vodacom International Limited, Vodacom Business Africa and Gateway Carrier Services.
MOU Minutes of use per month is calculated by dividing the average monthly minutes (traffic) during the period by the average monthly active customers during the period.
Normalised (*) Represents normalised growth excluding foreign exchange gains/losses and at a constant currency from on-going operations.
Operating free cash flow Cash generated from operations less additions to property, plant and equipment and intangible assets and proceeds on disposal of property, plant and equipment and intangible assets.
RAN Radio access network.
South Africa Vodacom (Pty) Limited, a private limited liability company duly incorporated in accordance with the laws of South Africa and its subsidiaries, joint ventures and SPV’s.
TSR Total shareholder returns consist of the aggregate share price appreciation and dividend yield.
Traffic Traffic comprises total traffic registered on Vodacom’s mobile network, including bundled minutes, promotional minutes and outgoing international roaming calls, but excluding national roaming calls, incoming international roaming calls and calls to free services.
Definitions

22
Annual results: Vodacom Group Limited42 31 March 2013
Forward-looking statements
This presentation which sets out the annual results for Vodacom Group Limited for the year ended 31 March 2013 contains 'forward-looking statements‘, which have not been reviewed or reported on by the Group’s auditors, with respect to the Group’s financial condition, results of operations and businesses and certain of the Group’s plans and objectives. In particular, such forward-looking statements include statements relating to: the Group’s future performance; future capital expenditures, acquisitions, divestitures, expenses, revenues, financial conditions, dividend policy, and future prospects; business and management strategies relating to the expansion and growth of the Group; the effects of regulation of the Group’s businesses by governments in the countries in which it operates; the Group’s expectations as to the launch and roll out dates for products, services or technologies; expectations regarding the operating environment and market conditions; growth in customers and usage; and the rate of dividend growth by the Group.
Forward-looking statements are sometimes, but not always, identified by their use of a date in the future or such words as 'will', 'anticipates', 'aims', 'could', 'may', 'should', 'expects', 'believes', 'intends', 'plans' or 'targets'. By their nature, forward-looking statements are inherently predictive, speculative and involve risk and uncertainty because they relate to events and depend on circumstances that will occur in the future, involve known and unknown risks, uncertainties and other facts or factors which may cause the actual results, performance or achievements of the Group, or its industry to be materially different from any results, performance or achievement expressed or implied by such forward-looking statements. Forward-looking statements are not guarantees of future performance and are based on assumptions regarding the Group’s present and future business strategies and the environments in which it operates now and in the future.
Annual results: Vodacom Group Limited43 31 March 2013
Annual results for the year ended 31 March 2013
@vodacom
facebook.com/vodacom
www.vodacom.com
+27 11 653 5055


![Vodafone Mobile Broadband ReadMe · PDF fileVodafone Mobile Broadband ReadMe ... ZTE devices ... [151] LTE network does not yet support the APN event. _. Therefore customers using](https://static.fdocuments.us/doc/165x107/5a7312ca7f8b9ab6538e3201/vodafone-mobile-broadband-readme-vodafone-mobile-broadband-readme-zte.jpg)