Presentation for NAPTP Annual MLP Investor Conference May 2013 Jamie Buskill, Chief Financial and...
27
Presentation for NAPTP Annual MLP Investor Conference May 2013 Jamie Buskill, Chief Financial and Administrative Officer 1
-
Upload
alisha-greer -
Category
Documents
-
view
214 -
download
1
Transcript of Presentation for NAPTP Annual MLP Investor Conference May 2013 Jamie Buskill, Chief Financial and...

Presentation forNAPTP Annual MLP Investor Conference
May 2013Jamie Buskill, Chief Financial and Administrative Officer
1

2
Important InformationForward-looking statements disclosureStatements made at this conference or in the materials distributed in conjunction with this conference that contain "forward-looking statements" include, but are not limited to, statements using the words “believe”, “expect”, “plan”, “intend”, “anticipate”, “estimate”, “project”, “should” and similar expressions, as well as other statements concerning our future plans, objectives, and expected performance, including statements with respect to the completion, cost, timing and financial performance of growth projects. Such statements are inherently subject to a variety of risks and uncertainties that could cause actual results to differ materially from those projected.
Forward-looking statements speak only as of the date they are made, and the company expressly disclaims any obligation or undertaking to release publicly any updates or revisions to any forward-looking statement contained herein or made at this conference to reflect any change in our expectations with regard thereto or any change in events, conditions or circumstances on which any such statement is based.
For information about important Risk Factors that could cause our actual results to differ from those expressed in the forward-looking statements contained in this presentation or discussed at this conference please see “Available Information and Risk Factors,” below. Given the Risk Factors referred to below, investors and analysts should not place undue reliance on forward-looking statements.
Available Information and Risk Factors
We file annual, quarterly and current reports and other information with the Securities and Exchange Commission, or “SEC”. Our SEC filings are available to the public over the internet at our website, www.bwpmlp.com, and at the SEC’s website www.sec.gov.
Our filings with the SEC contain important information which anyone considering the purchase of our limited partnership units should read.
Our business faces many risks. We have described in our SEC filings some of the more material risks we face. There may be additional risks that we do not yet know or that we do not currently perceive to be material that may also impact our business. Each of the risks and uncertainties described in our SEC filings could lead to events or circumstances that may have a material adverse effect on our business, financial condition, results of operations or cash flows, including our ability to make distributions to our unitholders.
Our limited partnership units are listed on the New York Stock Exchange under the trading symbol “BWP”. 2

BWP Investment Highlights
3
• Transport, store, gather and process natural gas and liquids• Assets well positioned to serve growing markets and access key
producing areas
Strategic and Diversified
Midstream MLP
• Investment-grade ratings at Boardwalk Pipelines, LP and major subsidiaries (BBB/Baa2/BBB)
• Majority of revenues from fixed-fee contracts
Financial Profile
• Management team with > 25 years average energy experience• Well-capitalized and supportive majority owner: Loews
Corporation
Corporate Structure
• Executing growth and diversification strategy• Improving financial metrics
Focus on Long-Term Value to Investors

4
BWP Asset Overview
Texas Gas Transmission
Texas Gas storage facilities
Gulf South Pipeline
Gulf South storage facilities
Gulf Crossing Pipeline
Petal Gas Storage
Petal Gas Storage pipeline facilities
Boardwalk Louisiana Midstream Hubs
Boardwalk Storage Company
South Texas Gathering Systems
Flag City Gas Processing Plant
Marcellus Gathering Pipeline
In 2012, we transported approximately 6.9 Bcf/d of natural gas, or approximately 12% of the nation’s average daily consumption
Boardwalk Operational Highlights: Pipelines: ~ 14,200 miles of
natural gas and ~240 miles of liquids
Storage capacity (aggregate): ~ 201 Bcf of natural gas and 18 MMbbls of liquids

Strategy for Maximizing Long-Term Value to Investors
5
Offer greater array of services to producer customers: South Texas Eagle Ford Gathering & Processing Project
Add projects to serve new and existing end users, such as Southeast Market Expansion Project Attach new supply sources and focus on liquids-rich plays Continue to build on existing and develop new relationships Continue to leverage BWP’s existing footprint
Grow Organically
Acquired Petal Gas Storage (Petal) in December 2011, enhancing flexibility and reliability of service and enabled the $300 million Southeast Market Expansion Project
Acquired Boardwalk Louisiana Midstream in October 2012, diversifying BWP into NGLs with strategic assets
Continue to evaluate strategic acquisitions, primarily to support further diversification in the midstream business
Grow through Diversification and Strategic Acquisitions
Maintained quarterly distribution at $0.5325 for the last four quarters In 2012: raised $866 million in equity, refinanced $825 million in debt at lower rates, reduced
administrative and general expenses Continue to target low 4x for Debt-to-EBITDA ratio
Improve Financial Metrics
Last 24 months: Invested ~$270 million in organic growth projects Next 24 months: Plan to invest ~$415 million
Last 24 months: Invested more than $1.2 billion in strategic acquisitions

6
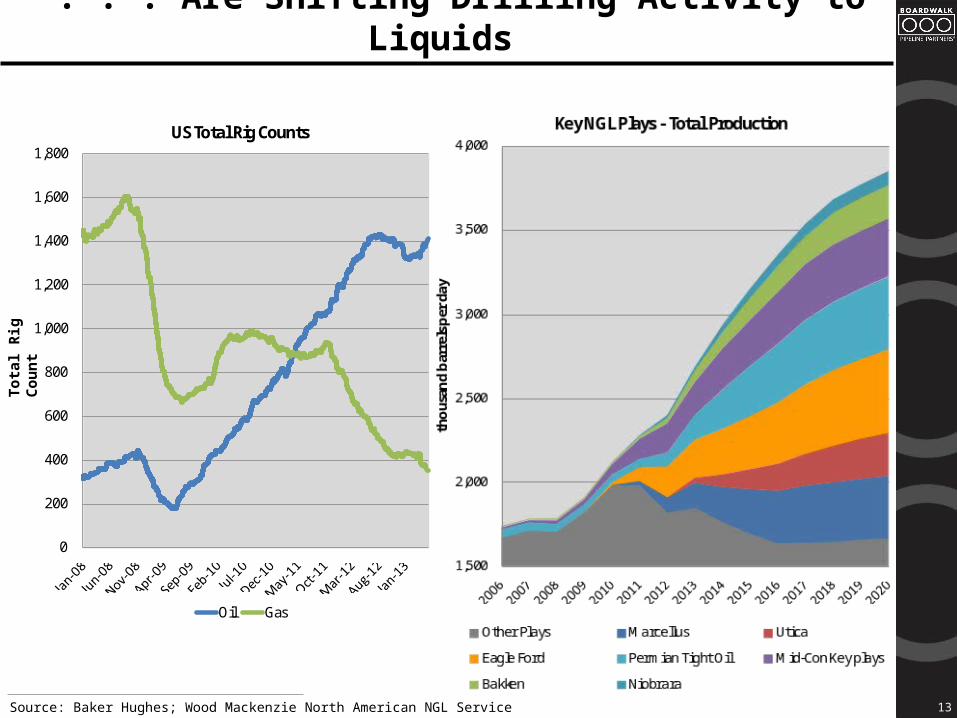
Growth in Natural Gas Supply from Shale Plays . . .
Source: Wood Mackenzie - North America Natural Gas Long-Term View (Spring, 2013)
20122006
LEGENDAverage Daily
Production
1 Bcf/d0 Bcf/d
5 Bcf/d2 Bcf/d
2 Bcf/d0 Bcf/d
3 Bcf/d0 Bcf/d
7 Bcf/d0 Bcf/d
7 Bcf/d0 Bcf/d
Dry Natural Gas Proved Reserves (Tcf)
Shale’s Share of Reserves

. . . Has Condensed Basis Spreads . . .
7
CENTERPOINT EAST
FLORIDA GAS ZONE 3
COLUMBIA GASAPPALACHIA
20122006
LEGENDAverage Annual
Spread
$0.03$0.23
HOUSTON SHIPCHANNEL
CARTHAGE HUB TRANSCOSTATION 85
KOSCICOLUMBIA GULFMAINLINE
WAHA
$(0.06)$(0.75)
$(0.04)$(0.36)
$(0.07)$(0.42)
$(0.04)$0.01
$(0.02)$0.06
$0.18$0.27
$0.01$0.19
$2.75$6.74
$(0.09)$(0.73)
Source: Platts Gas Daily, Boardwalk Internal Analysis

. . . and Lowered Prices that Are Driving Demand Growth
8Source: Wood Mackenzie - North America Natural Gas Long-Term View (Spring, 2013)
North CentralMiddle Atlantic
+1 Bcf/d+2 Bcf/d+3 Bcf/d
+4 Bcf/d
+4 Bcf/d+7 Bcf/d
South Central South Atlantic
+1 Bcf/d+3 Bcf/d
10 Yr Growth15 Yr Growth
LNG exports in the Gulf Coast region are forecasted to be 5.3 Bcf/d in 10 yearsBar Chart Key:
10 Year Incremental growth (Bcf/d)R/C/O = Residential/Commercial/OtherAll incremental demand is Bcf/d
Total demand growth from 2012 is forecasted to be approximately 10 Bcf/d in 10 years and 19 Bcf/d in 15 years,
with the greatest demand growth in the regions that we serve.
(Bcf/d)
(Bcf/d)
(Bcf/d)
(Bcf/d)
(0.5)
0.0
0.5
1.0
1.5
2.0
2.5
3.0
3.5
Power Industrial R/C/O
0.0
0.5
1.0
1.5
2.0
2.5
3.0
3.5
Power Industrial R/C/O
0.0
0.5
1.0
1.5
2.0
2.5
3.0
3.5
Power Industrial R/C/O
(0.5)0.0 0.5 1.0 1.5 2.0 2.5 3.0 3.5
Power Industrial R/C/O

9
Forecasted Demand Growth for Power Plants and Industrial Markets
Forecasted power generation and industrial demand growth in regions that we serve:
10 year growth = 4.5 Bcf/d15 year growth = 10.4 Bcf/d
Baton RougeNew Orleans
LakeCharles
East Side
Houston Ship
Channel
Source: Wood Mackenzie - North America Natural Gas Long-Term View (Spring, 2013)
Gas fired power plants connected to BWPCoal fired power plants – 40 years and older, within 20 miles of BWPMajor industrial corridors – BWP connected to approximately 165 industrial locations
Legend

Southeast Market Expansion Project
10
Perryville Exchange
Gulf South Pipeline
Petal Gas Storage
Petal Gas Storage pipeline facilities
Perryville Exchange
Southeast Market Expansion Project
Legend
MS
AL
AR
LATX
Carthage
Overview: Expansion project of ~550 MMcf/d; fully contracted with 10-year firm agreements, primarily with electric generation and
industrial customers Total capex of ~$300 million: install compression on Gulf South near interconnect with Petal Gas Storage (Petal) pipeline
facilities and at proposed new interconnect with Petal, as well as construct a new 70-mile pipeline in southeastern MS and AL Proposed in-service date of Q4-2014, subject to FERC approval Increases Boardwalk’s ability to transport natural gas supplies to growing areas of demand in the southeast region of the
United States, including industrial and power generation markets in MS, AL and FL Utilizes capacity from expiring contracts on Gulf South’s existing 42” pipeline that originates in East Texas and extends
eastward through Perryville, LA, including the Perryville Exchange, to an interconnect with Petal in Jasper County, MS Made possible by Petal acquisition
AL
MS

11
Other Projects to Serve Growing Natural Gas Demand
Combined $50 million Capex for Pipeline Connections to New Power Plants: 100,000 Dth/d, 7-year firm transportation commitment to serve a power
plant in the Baton Rouge/River Corridor area – expected in-service Q4-2013
125,000 Dth/d, 20-year firm commitment to serve a power plant in North Texas – expected in-service date of mid-2014
Pipeline projects to serve new power plants
Expansion of Petal salt-dome cavern
Legend
Expansion of Petal Salt-Dome Cavern: $23 million Capex Approx. 5 Bcf of additional working gas capacity Potential for five additional caverns, two of which are
currently permitted by FERC

12
Trends in NGL and Natural Gas Prices . . .
$0
$10
$20
$30
$40
$50
$60
$70
$80
$90
$100
2000 2001 2002 2003 2004 2005 2006 2007 2008 2009 2010 2011 2012
Natural Gas WTI Ethane Propane Butane Iso Butane Nat Gasoline
(in $/barrel equiv.)
Source: Market Data
0
200
400
600
800
1,000
1,200
1,400
1,600
1,800 US Total Rig Counts
Oil Gas
13
. . . Are Shifting Drilling Activity to Liquids
Source: Baker Hughes; Wood Mackenzie North American NGL Service
Tota
l Rig
Cou
nt
14
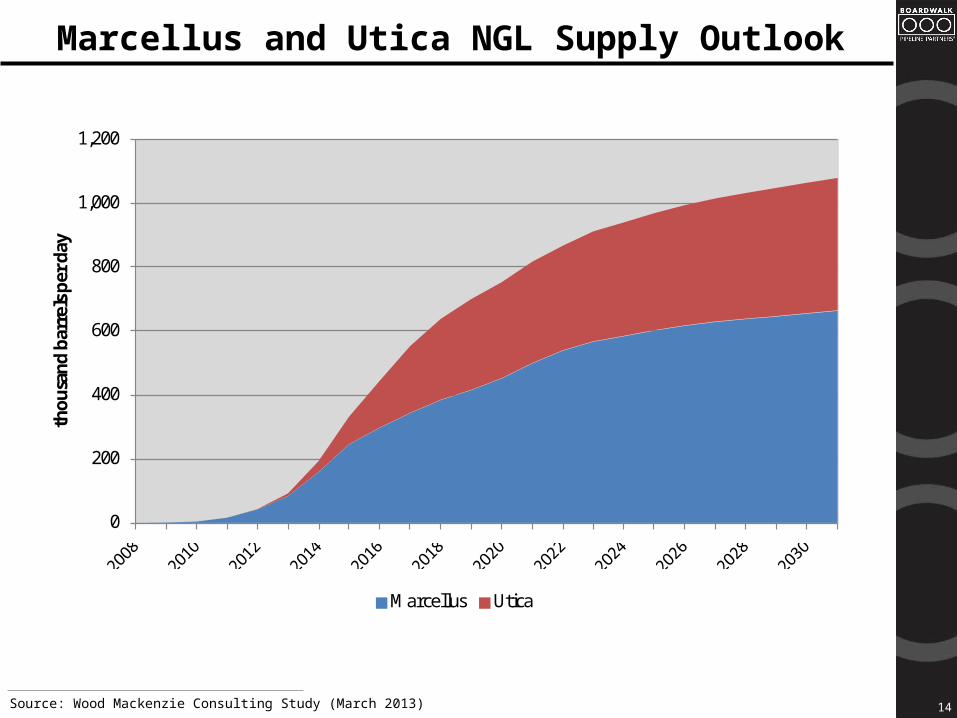
Marcellus and Utica NGL Supply Outlook
Source: Wood Mackenzie Consulting Study (March 2013)
0
200
400
600
800
1,000
1,200
thou
sand
bar
rels
per
day
Marcellus Utica

Ethane Demand: Largest Market is LA/TX Gulf Coast
15
Gulf Coast is 80% of North American Market
Source: En*Vantage, Hodson, Industry Contacts

Louisiana: Short Ethane and Getting Shorter
16
In 2012 Gulf Coast ethylene industry had the capability to crack 968 MBPD
If high-probability projects are completed, ethane cracking capability of the US ethylene industry would increase to 1.752 MM BPD* in 2017
Gulf Coast ethylene industry would have the capability to crack 1.635 MM BPD of ethane
South Louisiana Current Ethane Shortfall of ~150 MBPD is Supplied from
Mont Belvieu
South Louisiana Forecasted Ethane Shortfall is estimated to be over 350
MBPD by 2017
Corpus to Pt. Comfort Area
74 MBPD/149 MBPD
233 MBPD/352 MBPD
234 MBPD/473 MBPD
Sweeny/Chocolate Bayou Area
Mt. Belvieu
East Texas
16 MBPD/26 MBPD
165 MBPD/205 MBPD
Houston Area
92 MBPD/201 MBPD
171 MBPD/255 MBPD
2012/2017 Forecast
Lake Charles
Miss. River AreaGolden Triangle
Source: En*Vantage*Includes Midwest forecast of 91 MBPDMBPD = thousand barrels per day; MM BPD = million barrels per day

17
Proposed Bluegrass Pipeline: Project Overview
Utica and Marcellus
NGLs
Petchem complex, storage, exports
Segment 1Construct a new NGL
pipeline from producing areas in
OH, WV and PA to an interconnect with
Texas Gas near Hardinsburg, KY
Segment 2Convert a portion of Texas Gas Transmission from
Hardinsburg, KY to Eunice, LA (“TGT Loop Line”) from natural gas service to NGL service
Segment 3Construct a new large-scale fractionation plant and expand NGL storage facilities in LA; construct a new
pipeline connecting these facilities to the converted TGT Loop Line
Proposed Boardwalk and Williams Joint Venture
• Transport of up to 400,000 barrels per day capacity of mixed NGLs
• Expect strategic combination to drive expedited late 2015 in-service and competitive tariffs

18
Proposed Bluegrass Pipeline: Project Highlights
Expanding Footprint & Scale
Repurposing Existing Asset
Strong Partner
Cost & TimeAdvantage
• Further diversification within the midstream energy sector
• Leverages our recently acquired liquids infrastructure that provides a critical footprint for Bluegrass’ downstream fractionation and storage portion
• Project allows us to repurpose a portion of our Texas Gas Transmission system
• Allows us to maintain the quality of service that we provide our firm natural gas transportation customers
• Williams has a significant presence and experience as a gatherer and processor in the Marcellus and Utica shale basins
• Williams also has presence in the petrochemical industry in Louisiana
• Less costly than alternatives that would involve all new construction
• Potential to be placed into service in late 2015
Project Status
• Announced with Williams on March 6 we are pursuing joint development of NGL pipeline, the Bluegrass Pipeline
• Conducting cost assessments, due diligence, etc.
• Negotiating JV and related agreements with Williams
• Conditions for project to be approved include completing JV agreements, securing customer contracts and obtaining regulatory and board approvals
Project Rationale

19
South Texas Gathering and Processing Assets
Overview: Gas processing: 150 MMcf/d Flag City cryogenic gas processing plant Gas gathering: approx. 400 miles of pipeline with capacity of 300 MMcf/d
Gulf South Pipeline
South Texas Gathering Systems
Flag City Processing Plant
Compressor Station
Receipt/Delivery Points
Legend
Plant Capacity150 MMcf/d
Gathering Pipeline Capacity300 MMcf/d

Boardwalk Louisiana Midstream: Acquired in October 2012
20
Acquisition provided diversification into NGLs with strategically-located and high-quality assets
Sulphur and Choctaw Hubs serve attractive and rapidly-growing petrochemical industry: Approx. 53 million barrels of salt dome
storage capacity Extensive brine supply infrastructure More than 240 miles of pipeline assets,
including the most extensive ethylene distribution system in Louisiana
LakeCharles
LafayetteNew Orleans
Sulphur
Choctaw AreaFacilities
Choctaw AreaFacilities
Sulphur Area Facilities
Ethylene PipelinePropylene PipelineNatural Gas PipelineBrine PipelineE/P Pipeline
PL Midstream Hubs
Baton Rouge
LakeCharles
LafayetteNew Orleans
Sulphur
Choctaw AreaFacilities
Choctaw AreaFacilities
Choctaw AreaFacilities
Choctaw AreaFacilities
Sulphur Area Facilities
Ethylene PipelinePropylene PipelineNatural Gas PipelineBrine PipelineE/P Pipeline
PL Midstream Hubs
Ethylene PipelinePropylene PipelineNatural Gas PipelineBrine PipelineE/P Pipeline
PL Midstream Hubs
Baton Rouge
Sulphur AreaFacilities
Choctaw AreaFacilities
Project Scope In-Service Date Capex ($ in millions)
Choctaw Hub – Brine Sales and Transportation
• Construction of 26-mile, 12-in pipe to customer• 20 year contract with 15-year minimum volumes and
expansion options
Q3 - 13 $50
Sulphur Hub – Propane Storage, Blending and Transportation
• Logistics solution to propane producers in Lake Charles area
Q3 - 13 $12

21
Financial Overview
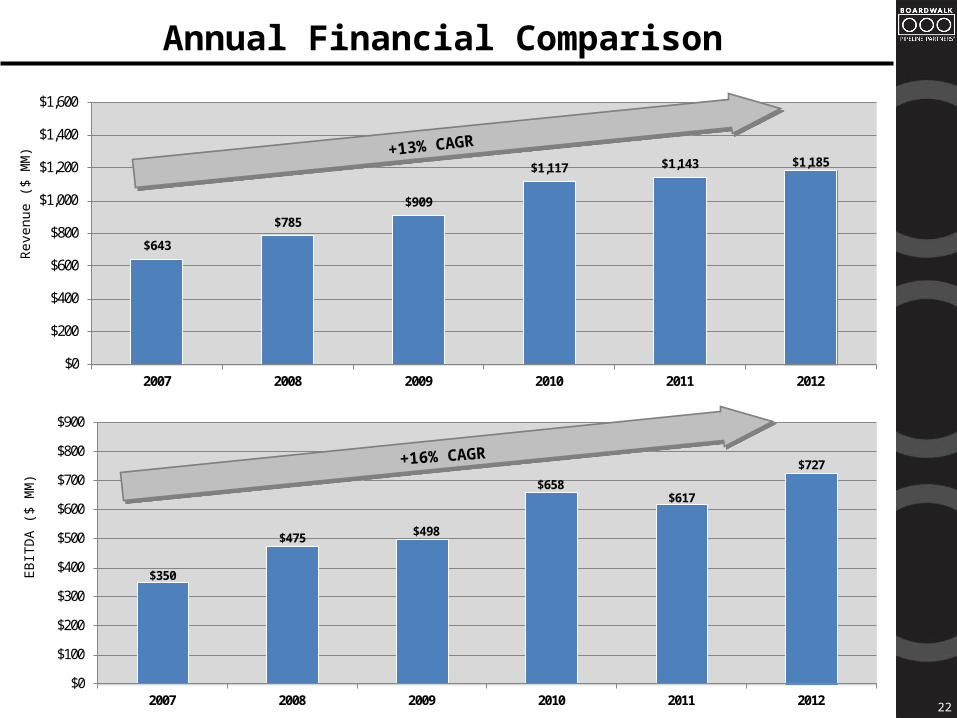
$643
$785
$909
$1,117 $1,143 $1,185
$0
$200
$400
$600
$800
$1,000
$1,200
$1,400
$1,600
2007 2008 2009 2010 2011 2012
$350
$475 $498
$658$617
$727
$0
$100
$200
$300
$400
$500
$600
$700
$800
$900
2007 2008 2009 2010 2011 2012
Annual Financial Comparison
22
Reve
nue
($ M
M)
EBIT
DA ($
MM
)
+16% CAGR
+13% CAGR

23
Interstate Pipelines and Storage Diversified Customer Base
23
Revenue Mix By Service TypeFor the twelve months ended March 31, 2013
Firm Contracts83%
Firm Utilization Charges11%
Interruptible Services6%

Focus on Improving Financial Metrics
2424
($ in millions)December 31,
2011 AdjustmentsMarch 31,
2013
LONG-TERM DEBT:Fixed-Rate Debt 2,650$ 375$ 3,025$ Variable-Rate Debt 200 25 225 Revolving Credit Agreement 459 (89) 370 Subordinated Loan Agreement 100 (100) - Unamortized Debt Discount (10) (2) (12)
TOTAL LONG-TERM DEBT 3,399$ 209$ 3,608$
TOTAL PARTNERS' CAPITAL 3,487$ 357$ 3,844$
TOTAL CAPITALIZATION 6,886$ 566$ 7,452$
LONG-TERM DEBT TO CAPITALIZATION 49.4% 48.4%
LONG-TERM DEBT TO EBITDA RATIO 5.5x 4.9x
ADMINISTRATIVE & GENERAL EXPENSE FOR TWELVE MONTHS ENDED 137$ 113$

BWP Investment Highlights
25
• Transport, store, gather and process natural gas and liquids• Assets well positioned to serve growing markets and access key
producing areas
Strategic and Diversified
Midstream MLP
• Investment-grade ratings at Boardwalk Pipelines, LP and major subsidiaries (BBB/Baa2/BBB)
• Majority of revenues from fixed-fee contracts
Financial Profile
• Management team with > 25 years average energy experience• Well-capitalized and supportive majority owner: Loews
Corporation
Corporate Structure
• Executing growth and diversification strategy• Improving financial metrics
Focus on Long-Term Value to Investors

Annual EBITDA Reconciliation
26
Non-GAAP Financial Measure
Earnings before interest, taxes, depreciation and amortization (EBITDA) is used as a supplemental financial measure by Boardwalk's management and by external users of Boardwalk's financial statements, such as investors, commercial banks, research analysts and rating agencies, to assess Boardwalk’s operating and financial performance, ability to generate cash and return on invested capital as compared to those of other companies in the natural gas transportation, gathering and storage business. EBITDA should not be considered an alternative to net income, operating income, cash flow from operating activities or any other measure of financial performance or liquidity presented in accordance with generally accepted accounting principles (GAAP). EBITDA is not necessarily comparable to a similarly titled measure of another company. The following table presents a reconciliation of Boardwalk’s EBITDA to net income, the most directly comparable GAAP financial measure, for each of the periods presented below.
($ in millions)
2007 2008 2009 2010 2011 2012Net Income 228$ 294$ 163$ 289$ 217$ 306$
Income taxes 1 1 - 1 - 1 Depreciation and amortization 82 125 203 218 227 252 Interest expense 61 58 132 151 160 169 Interest income (22) (3) - (1) - (1) Loss on debt extinguishment - - - - 13 -
EBITDA 350$ 475$ 498$ 658$ 617$ 727$
For the Year Ended December 31
Presentation forNAPTP Annual MLP Investor Conference
May 2013Jamie Buskill, Chief Financial and Administrative Officer
27