
Presentation for Findim Group - d110erj175o600.cloudfront.net · broadband infrastructure Analysys...
178
39166-114 | CONFIDENTIAL Findim Group Review of Telecom Italia 3-year strategy Presentation for Findim Group Joan Obradors, Emil Arnell 20 March 2014 Findim Group
Transcript of Presentation for Findim Group - d110erj175o600.cloudfront.net · broadband infrastructure Analysys...

39166-114 | CONFIDENTIAL
Findim Group
Review of Telecom Italia 3-year strategy
Presentation for Findim Group
Joan Obradors, Emil Arnell
20 March 2014
Findim Group

39166-114 | CONFIDENTIAL
Findim Group
Confidentiality notice
▪ This document and the information contained herein are strictly private and confidential, and are
solely for the use of Findim Group
▪ Copyright © 2014. The information contained herein is the property of Analysys Mason Limited and
is provided on condition that it will not be reproduced, copied, lent or disclosed, directly or
indirectly, nor used for any purpose other than that for which it was specifically furnished
For any communications regarding this
presentation please contact:
Boudicca Proxy Consultants
Sheryl Cuisia, Managing Director
Maria Siano, Account Manager
Telephone: +44 (0)207 183 0048
Email: [email protected]
Website: www.boudiccaproxy.com/findim-ti

39166-114 | CONFIDENTIAL
Findim Group
Contents
3
Executive summary
The context
Fixed domestic
Mobile domestic
TIM Brasil
New services
Company structure
Indicative implementation guidelines
Annex

39166-114 | CONFIDENTIAL
Findim Group
We have worked with Findim on the development of an alternative plan for
TI focused on ensuring future growth and relevance
▪ Telecom Italia (TI) is the incumbent telecoms operator in Italy,
and is 22% owned by the holding company Telco which is
itself majority-owned by Telefonica
▪ Telco has, in recent years, nominated the majority of the
members of the Board of Directors (BoD) of TI
▪ The BoD has come under criticism, especially from minority
investor Findim Group (Findim), regarding the company‟s
recent performance and potential conflicts of interests of the
board
▪ Findim presented a motion for the dismissal of TI‟s BoD at a
special shareholders meeting on 20 December 2013, and for
the election of new BoD members. This motion was narrowly
dismissed
– Telco won the backing of 50.3% of shareholders present at
the meeting
– Findim‟s proposal was backed by more than 40% of the
shareholders present
– 50.4% of the shareholders were represented at the
meeting
4
▪ TI‟s next shareholders meeting is scheduled for 16 April
2014, when it is due to elect a new board
▪ We understand that there will again be different competing
lists of nominations for the board with Findim presenting a
minority list of candidates including:
– Mr. Vito Gamberale, put forward to the shareholders as a
nominee for the Chairman position
– Mr. Girolamo di Genova
– Mr. Franco Lombardi
▪ Findim is also presenting a business plan that will ensure that
the business:
– has a solid basis for future relevance and growth
– can continue to play a key role in the development of the
Italian telecoms sector, in particular with reference to
broadband infrastructure
▪ Analysys Mason has assisted Findim and Mr. Vito
Gamberale, Mr. Girolamo di Genova and Mr. Franco
Lombardi in defining and quantifying the business plan on the
basis of publicly available sources
The events of 2013 Current and future events
Executive summary

39166-114 | CONFIDENTIAL
Findim Group
The share price of TI has been falling since 2001 as the company has
focused on reducing its leverage
5 Executive summary
Evolution of TI‟s share price and leverage
Leverage before
adjustments for
Telecom
Argentina closing
and other items
Note. Share prices have been taken on a quarterly basis
Source: TI, leverage defined as reported net debt over EBITDA
Take-over
by Pirelli
Merger with (and delisting of)
Telecom Italia Mobile
Focus on debt
reduction
CEO
Controlling Group
Chairman
27.929.130.832.1
34.734.035.7
37.339.9
32.935.3
33.4
38.4
0
10
20
30
40
50
20
13
20
10
20
11
EU
R b
illio
n
20
12
20
09
20
08
20
07
20
06
20
05
20
04
20
03
20
02
20
01
20
00
18.0
R. Colaninno C. Buora R. Ruggiero
Olivetti
F. Bernabè M. Patuano
R. Colaninno G. Rossi G. Galateri di Genola A. Minucci M. Tronchetti Provera
Olimpia Telco
Leverage 1.4 2.7 2.6 2.6 2.5 3.1 2.9 2.9 3.1 3.0 3.1 2.8 2.5 2.5

39166-114 | CONFIDENTIAL
Findim Group
The TI group is today predominantly a domestic company (92% of 2013
operating cashflow) with Brazil being the only international contribution
6
* Includes Internet access and business data **includes Sparkle; ***Olivetti, other operations and eliminations
Source: Analysys Mason based on TI investor relations
TI‟s financial performance, FY 2013 (Pro-forma excluding Telecom Argentina)
Executive summary
The domestic operations have seen deteriorating performance and have limited growth prospects
according to the current guidance

39166-114 | CONFIDENTIAL
Findim Group
We have developed a strategy for each of the main areas of TI‟s current
and potential future areas of operation
▪ The following slides provide an indication of our proposed approach for each of TI‟s main businesses, including new areas that we
believe could be sources of significant future growth. These are addressed individually as follows:
7 Executive summary
Domestic
fixed-line
Domestic
mobile
TIM Brasil
Services
Company
Revitalising TI‟s domestic fixed-line operations
Repositioning TI‟s domestic mobile operations (TIM)
Expanding TI‟s mobile and fixed telecoms operations in Brazil
(TIM Brasil), exploring organic and inorganic means for growth
Creating a services business unit
Reconfiguring the company structure
Further analysis and details are provided in the main sections of this report

39166-114 | CONFIDENTIAL
Findim Group
A long-term fixed strategy needs to create a virtuous circle by addressing
both investments and demand in parallel
8 Executive summary | Domestic fixed-line
Investments
(network)
Demand
(for broadband and
ultrabroadband)
Sustainability
and value
creation
Demand cannot materialise without
adequate investment
Demand enables further investment

39166-114 | CONFIDENTIAL
Findim Group
TI should accelerate upgrades to its fixed network in order to lay
foundations for future growth and opex rationalisation
▪ TI has started to upgrade its network to
higher-capacity FTTC, but these plans do not
address the fundamental problems or lay
foundations for growth
– the coverage target remains at c. 50% of
households by 2016
– FTTC deployments are an overlay to
legacy local exchange-fed DSL without the
capacity to migrate all users to FTTC
9
▪ Make FTTC the leading platform
▪ Increase FTTC coverage and capacity and be
ready to exploit FTTH opportunity in some
areas
IDENTIFIED PROBLEMS PROPOSED ACTIONS
Executive summary | Domestic fixed-line
FTTC: Network uses high-speed optical fibre as far as the cabinet, and copper-based wires from the
cabinet to the customer premises
FTTH: Network uses high-speed optical fibre as far as the customer premises
▪ Multiple parallel (modern and legacy)
networks are operated, increasing network
complexity and opex
▪ Plan a gradual migration of legacy voice to
broadband infrastructure to allow
rationalisation of network

39166-114 | CONFIDENTIAL
Findim Group
TI needs to improve its positioning in the retail broadband market to drive
demand and increase ARPUs
▪ Demand in Italy is lower than average (mainly
explained by low ICT literacy) and requires
stimulation by both TI and other players
10
▪ Put pressure on government to pursue
actions to improve ICT literacy
▪ Increase attractiveness of offers by adding
value through content and applications
– partnerships with OTT and content
providers
IDENTIFIED PROBLEMS PROPOSED ACTIONS
Executive summary | Domestic fixed-line
▪ TI is positioned as a low-value provider in the
broadband market and is losing lines
▪ Increase entry-level speed (nominal
bandwidth) in order to position TI as a high-
end provider
▪ TI‟s FTTC and FTTH products are positioned
at a significant premium to its lower-speed
DSL products which is not encouraging take-
up of the higher-speed products
▪ Reduce premium for fixed-line ultra-
broadband (UBB) products relative to entry-
level products to attract users onto higher-
value products

39166-114 | CONFIDENTIAL
Findim Group
TI needs to reposition itself in the domestic mobile market to better
monetise its network
11
IDENTIFIED PROBLEMS PROPOSED ACTIONS
Executive summary | Mobile domestic
▪ TIM has positioned 4G as a premium service,
but does not seem to provide customers with
a strong incentive to migrate to higher data
bundles
▪ Enrich the basket of content and applications
available to customers, potentially by means
of partnerships, and improve effectiveness of
marketing
▪ TIM is the leader in terms of subscriber
market share but is mainly attracting lower-
value subscribers within each market
segment
▪ Accelerate smartphone penetration in the
customer base
▪ Prioritise monetisation/value creation and not
defence of (subscriber) market share
▪ TIM has a strong position in terms of network
quality and coverage, for both existing (2G
and 3G) and 4G networks, but so far has not
been able to monetise its network
▪ Re-balance investments vs. fixed, avoiding
overspending on mobile network by means of
a closer alignment between network roll-out
and marketing and sales
▪ More than 60% of the European mobile
market has been consolidated into four major
groups; TI/TIM is one of the largest stand-
alone players
▪ TIM can adopt a partnership model in order to
gain some of the benefits of consolidation

39166-114 | CONFIDENTIAL
Findim Group
TIM Brasil requires additional network investment, an increased focus on
the postpaid and data segments and greater scale in the fixed market
▪ TIM Brasil is behind its competitors in terms
of network coverage and especially quality
12
▪ Need for further significant network
investments
IDENTIFIED PROBLEMS PROPOSED ACTIONS
Executive summary | TIM Brasil
▪ TIM Brasil has a strong position in the
prepaid segment but is weak in postpaid and
data markets, which are expected to see the
most significant growth
▪ Need to increase its focus on higher-value
segments (e.g. postpaid and data) and, more
generally, seek to become the primary
operator for its users
▪ TIM Brasil is the only mobile player without a
(significant) fixed access network
▪ Pursue partnership to viably increase scale
and footprint in the fixed market and
maximise opportunities in the convergent
market
TIM Brasil has room to grow organically but should nevertheless consider
opportunities to extend its operations inorganically in the short to medium term

39166-114 | CONFIDENTIAL
Findim Group
A new services business unit would help TI address its current service
gap
▪ TI needs content and other services to
stimulate demand for fixed and mobile data
services
▪ It is much less active than its peers when it
comes to innovative and traditional digital and
ICT solutions and products
13
▪ TI should set up a dedicated services
business unit tasked with pursuing new
solutions to provide to:
– the other business units
– other operators
– companies and public administration
▪ The unit should follow a partnership model to
capture innovation and combine internal and
external know-how
IDENTIFIED PROBLEMS PROPOSED ACTIONS
Executive summary | New services

39166-114 | CONFIDENTIAL
Findim Group
TI needs to regain the flexibility to pursue long-term growth through
investment
▪ TI is a stand-alone player in a world
dominated by large groups
▪ It has had to operate within certain cash
constraints, which has lead to a sub-optimal
approach to investments and upgrades
(longer-term growth and opex savings have
been sacrificed due to a lack of capacity to
invest)
▪ The organisation has been geared more
towards the preservation of the status quo
than towards growth
14
▪ New organisational structure to provide
greater flexibility for each line of the business
to pursue its individual goals
▪ The proposed structure would comprise three
business units with clear actions for each
business unit to increase financial flexibility
– Mobile business unit to be allowed to
pursue partnerships and joint
ventures/mergers in Europe and Brazil
– Fixed business unit to pursue a limited
capital increase, in cash or in kind, to
address investment gap
– Services unit to create the right
environment and sufficient organisational
and financial flexibility for innovation
▪ Divestments welcome but only if they create
value for shareholders; pure sale and lease-
back deals without upside to be avoided
IDENTIFIED PROBLEMS PROPOSED ACTIONS
Executive summary | Company structure

39166-114 | CONFIDENTIAL
Findim Group
The Findim Group has outlined an organisation structure that would allow
TI to address some of its key problems
15 Executive summary | Company organisation
TI group
Services Fixed Mobile
▪ Potential for growth
through JVs with local
operators or partnerships
with major groups with
non-overlapping footprint
▪ Limited increase in capital
for network upgrade
coming from institutional
investors
▪ New unit to drive future
growth, with solutions
enabled by partnerships,
JVs and other means
The mobile and fixed business units will continue to provide services to each other
(e.g. backhaul and backbone services, retail service for 4P bundles) but the new
organisation will provide greater flexibility to TI to pursue the objectives of the
strategic plan

39166-114 | CONFIDENTIAL
Findim Group
We have suggested some overall targets for each of the business units
[1/2]
16 Executive summary
Business unit Actions and proposed targets
Fixed domestic ▪ Expansion of FTTC capacity and coverage to target 70% of households and FTTH coverage
to target 25% of households (incl. Milan) in the medium term
– EUR1.5-2.0 bn investment in addition to the EUR1.7 bn announced by TI for 2014-16
▪ Stabilisation of broadband market share at current level
▪ Increase ultrabroadband (UBB) share to 50-60% of broadband lines, driven by partnerships
with international and domestic „over-the-top‟ content providers, while gradually reducing the
price premium of UBB over broadband to c. EUR5 per month
▪ Additional investment of up to EUR1 bn over three years to accelerate network delayering
with target of savings of 30-40% of legacy network opex and 30% of maintenance capex
Mobile
domestic
▪ Slight increase in handset subsidies to prepaid subs. to accelerate smartphone penetration
▪ Increase focus on postpaid and high-value segments (target of +1pp postpaid, -1pp prepaid
market share by 2016) and do not engage in further price war
▪ Improve effectiveness of marketing and up-selling of VAS and add-ons, leading to broadly
stable ARPU by segment and single-digit CAGR increase in VAS/data ARPU
▪ Explore partnerships to further enrich content offering
▪ Closer alignment between network roll-out and sales and marketing. Rather than
aggressively expanding 4G coverage, priority should be given to improving the 3G network
to keep capex below 13% of revenues

39166-114 | CONFIDENTIAL
Findim Group
We have suggested some overall targets for each of the business units
[2/2]
17 Executive summary
Business unit Actions and proposed targets
TIM Brasil ▪ Improve coverage and capacity of data network, bringing 3G coverage to 85% by 2016. 20-
25% additional investments to the EUR3.4 bn announced by TIM Brasil for 2014-16
▪ Target market share increase of 0.5-1.0p.p. in prepaid segment and 1.5-2.0p.p. in the
postpaid segment
▪ Refocus on higher-value subscriber and data take up to stabilise blended ARPU at above
EUR6 per month
▪ Be ready to pursue partnership to improve position and scale on the fixed market and
achieve up to 5% savings on opex and capex
Services ▪ Aim for best-in-class stand-alone performance in the mid- to long term: generating c. 15-
20% of group revenues with EBITDA margin of c. 10-15%
▪ Solutions supplied will allow other business units to provide more attractive products,
thereby improving also their performance
▪ Services to be commercialised through various channels including direct sales, through the
fixed and mobile business units, partners and where appropriate wholesale (depending on
product and target market)

39166-114 | CONFIDENTIAL
Findim Group
Contents
18
Executive summary
The context
Fixed domestic
Mobile domestic
TIM Brasil
New services
Company structure
Indicative implementation guidelines
Annex

39166-114 | CONFIDENTIAL
Findim Group
Introduction
▪ Telecom Italia (TI) is quoted on the Milan Stock Exchange (Borsa Italiana) and on the New York Stock Exchange. The largest
shareholder, with a 22% share, is the holding company Telco, which in turn is majority-owned by Telefónica. Telco has typically
nominated the majority of the Board of Directors (BoD) in the last shareholder meetings
▪ Findim Group (Findim), the investment vehicle of the Fossati family, has held a stake in TI for several years and currently owns 5%
of the company‟s shares
▪ Findim has publicly criticised TI‟s current BoD citing a conflict of interest in relation to Telefónica. Prior to the special
shareholders meeting on 20 December 2013 Findim held a roadshow, aimed at convincing other shareholders (and proxy
advisors) to back its position
– Findim presented a motion at the special shareholders meeting for dismissal of TI‟s BoD, and nomination of new BoD
members. Its motion was narrowly dismissed, as the Telco position won the backing of 50.3% of shareholders present at the
meeting (representing c.54% of the share capital) - Findim was backed by more than 40% of the present shareholders
▪ TI‟s next shareholders meeting is scheduled for 16 April 2014. Among other things, this meeting is supposed to elect a
new BoD
▪ We understand that it is very likely that there will again be different competing lists of nominations for the BoD with Findim Group
again presenting a list for the minority stake including Mr. Vito Gamberale as Chairman nominee, Mr. Girolamo di Genova and Mr.
Franco Lombardi
19 The context

39166-114 | CONFIDENTIAL
Findim Group
Analysys Mason‟s assignment
▪ An alternative group of investors, led by the Findim Group,
with the supervision and advice of Mr. Vito Gamberale, have
expressed a desire for the development of an alternative
business plan for TI
▪ This business plan is intended to provide an alternative
forward view for TI beyond its short-term cash constraints to
ensure that:
– the business has solid bases for future relevance and
growth
– TI can continue to play a key role in the development of
the Italian telecoms sector, in particular with reference to
the development of broadband infrastructure
20
▪ Analysys Mason has been engaged to assist with the
preparation of the business plan following the overall
directions and guidelines of the Findim Group and Mr.
Gamberale
▪ Our work has been conducted largely independently but with
regular alignment meetings with Mr. Gamberale and with the
Findim Group and with inputs from Mr di Genova and Mr
Lombardi
▪ The assignment has been carried out without any contact
with TI and using information from publicly available sources
▪ Our engagement has been funded by the Findim Group
The principals Our engagement
The context

39166-114 | CONFIDENTIAL
Findim Group
In November 2013, the Findim Group presented an outline strategy for TI
to the market which has now been further developed
Install a new democratic, independent Board
that will fairly represent all shareholders
21
Encourage each unit to adopt best practice to
resume growth and regain the leadership in Italy
Create long-term value for all shareholders Organise TI into three capability-based operating
units to facilitate organic growth with more
focused management to stop TI‟s decline
1 1
Overall guidelines proposed by Findim Group
2 2
Defer sale of TIM Brasil until business strategy
is optimised and market environment can yield
maximum price, unless a very high multiple can
be achieved now
Facilitate business heads to think outside the
box to capture new growth opportunities
4 4 Address leverage without selling core assets Create environment for business to evolve from
monopolistic-utility mind-set to entrepreneur
growth mind-set
3 3 Execute new group strategy focused on driving
organic growth from the existing portfolio and
through partnerships
Allow business to form strategic partnerships
(best-in-class)
The context

39166-114 | CONFIDENTIAL
Findim Group
TI has been dealing with the heavy debt burden created through its
leveraged take-overs since 2001
22 The context
Evolution of TI‟s net debt
Take-over
by Pirelli
Merger with (and delisting of)
Telecom Italia Mobile
Focus on debt
reduction
Leverage
before
adjustments for
Telecom
Argentina
closing and
other items
CEO
Controlling Group
Chairman
27.929.130.832.1
34.734.035.7
37.339.9
32.935.3
33.4
38.4
0
10
20
30
40
50
20
13
20
10
20
11
EU
R b
illio
n
20
12
20
09
20
08
20
07
20
06
20
05
20
04
20
03
20
02
20
01
20
00
18.0
R. Colaninno C. Buora R. Ruggiero
Olivetti
F. Bernabè M. Patuano
R. Colaninno G. Rossi G. Galateri di Genola A. Minucci M. Tronchetti Provera
Olimpia Telco
Leverage 1.4 2.7 2.6 2.6 2.5 3.1 2.9 2.9 3.1 3.0 3.1 2.8 2.5 2.5
Note. Share prices have been taken on a quarterly basis
Source: TI, leverage defined as reported net debt over EBITDA

39166-114 | CONFIDENTIAL
Findim Group
CEO
Controlling Group
Chairman
C. Buora R. Ruggiero F. Bernabè M. Patuano G. Rossi G. Galateri di Genola A. Minucci M. Tronchetti Provera
Olimpia Telco
The share price has been constantly declining during the debt reduction
period and performance is in the bottom range of peers
23 The context
Source: Yahoo finance
Average TI share price since 2002
0.0
0.5
1.0
1.5
2.0
2.5
1.0
0 =
1 J
anu
ary
200
2
2014
2013
2012
2011
2010
2009
2008
2007
2006
2005
2004
2003
2002
Performance against peers
0.0
1.0
2.0
3.0
4.0
EU
R
2014
2013
2012
2011
2010
2009
2008
2007
2006
2005
2004
2003
2002
BT Orange Telefonica Deutsche Telecom TI

39166-114 | CONFIDENTIAL
Findim Group
Operations, both in Italy and internationally, have been divested with
proceeds used to reduce debt
24 The context
2008 2009 2011 2013 2010 2012 2000 2002 2005 2007 2004 2006 2001 2003
Italtel and Sirti sold
to Italian investors
Telespazio sold to
Finmeccanica SEAT Pagine
Gialle (Italy) sold to
financial investors
La7 (Italy) sold to Cairo
Communications
MTV Italy sold to
Viacom
TIM Hellas sold to
Apax Partners and
Texas Pacific Group
TIM Peru sold to
America Movil
Elettra Tlc sold to
France Telecom
BBned (Netherlands)
sold to Tele2
Entel (Bolivia) sold to the
Bolivian Government
Sale of controlling
stake in Telecom
Argentina to Fintech
Sale of 25% stake in
Mobilkom (Austria) to
Telekom Austria
Sale of the stake in
Bouygues Telecom
(France)
Finsiel (Italy) sold to
Italian investors
Digitel (Venezuela)
sold to CANTV
Alice France sold to
Free
Hansenet (Germany)
sold to Telefonica Sale of 27% stake in
ETECSA (Cuba)
Entel Chile sold to
Almendral
Source: TI, press searches
Sell of 40.5% stake in
Avea to Turk Telekom
Do
mes
tic o
pera
tio
ns
In
tern
ati
on
al
op
era
tio
ns
Spin-off of Telecom
Italia Media Broadcast
Sale and lease-back of
local exchanges to
Pirelli/Morgan Stanley
Sale and lease-back
of real estate to Pirelli
Sale of 27% stake in
Auna to Spanish
investors
Loquendo sold to
Nuance

39166-114 | CONFIDENTIAL
Findim Group
92% of TI‟s 2013 cashflow (EBITDA – capex) comes from its domestic
operations, which are still dominated mostly by voice and mobile services
25
* Includes Internet access and business data **includes Sparkle; ***Olivetti, other operations and eliminations
Source: Analysys Mason based on TI investor relations
TI‟s financial performance, FY 2013 (Pro-forma excluding Telecom Argentina)
The context
FY 2013 Unit Group Domestic VoiceBroad-
band*Mobile
Whole-
sale**
Elim. and
otherTI Media Other***
TIM
Brasil
Revenues EUR bn 23.4 16.2 4.9 3.0 5.6 3.6 -0.9 0.1 0.2 6.9
% group % 100% 69% 30% 18% 35% 22% -6% 1% 1% 30%
YoY change % -3% -3% -3% -0% -5% -3% -6% -18% -3% -2%
EBITDA EUR bn 9.5 7.7 -0.0 -0.0 1.8
% group % 100% 81% -0.0% -0% 19%
YoY change % -3% -4% -65% -46% -3%
EBITDA margin % revs 41% 48% -2% -10% 26%
% group % 100% 81% -0% -0% 19%
YoY change p.p. -0% -1% 19% 48% -1%
Capex EUR bn 4.4 3.0 0.0 0.0 1.3
% group % 100% 69% 0% 0% 31%
YoY change % -2% -0% -28% -33% -3%
EBITDA - Capex EUR bn 5.1 4.7 -0.0 -0.0 0.5
% group % 100% 92% -0% -0% 9%
YoY change % -4% -6% -39% -45% -2%
Domestic

39166-114 | CONFIDENTIAL
Findim Group
TI has seen declining revenue and EBITDA at the domestic level and at
group level, with negative outlook for domestic and stable for the group
26 The context
Note: Telecom Argentina consolidated in the group accounts from 2010 to 2012, Source: TI
29.530.027.626.9
30.131.331.330.8
29.130.931.430.8
27.2
25.726.726.8
26.9
30.131.331.330.8
29.130.931.430.8
27.2
16.217.9
19.020.1
21.723.2
24.225.8
27.327.129.0
27.927.526.9
9.511.612.211.411.111.311.6
12.912.713.313.713.014.3
7.78.79.29.49.910.010.211.912.713.013.813.012.511.9
0
5
10
15
20
25
30
35
EU
R b
illio
n
2011
11.1
2010
2009
2008
2013
23.4 23.4
2012
10.5
2003
2002
2001
2000
10.2 2007
2006
2005
2004
Domestic Group exc. Argentina Total group
Development of consolidated group revenues and EBITDA
Rev
en
ue
E
BIT
DA
CEO
Controlling Group
Chairman
R. Colaninno C. Buora R. Ruggiero
Olivetti
F. Bernabè M. Patuano
R. Colaninno G. Rossi G. Galateri di Genola A. Minucci M. Tronchetti Provera
Olimpia Telco
CAGR domestic
CAGR group Revenues: 2.4% EBITDA: 3.9% Revenues: -4.7% EBITDA: -3.2%
Revenues: -0.7% EBITDA: 0.0% Revenues: -6.5% EBITDA: -4.4%
Outlook
communicated
by TI for 2014-
2016
Group: stable
Domestic: negative
low single digit
Group: stable
Domestic: negative
low single digit

39166-114 | CONFIDENTIAL
Findim Group
TI‟s performance in the domestic market since 2009 has been poorer than
peers
27
Domestic revenues
The context
Source: Analysys Mason based on operator filings
Domestic EBITDA Domestic EBITDA margin
▪ TI has lost a greater proportion of domestic revenues than Deutsche Telekom, BT and Orange since 2009
▪ In terms of domestic EBITDA it has performed worse than BT and Deutsche Telekom over the same period even if its EBITDA
margin has improved and is the highest of the EU5 incumbent operators
100
0
10
20
30
40
50
60
70
80
90
100
2009 2010 2011 2012 2013
20
09
= 1
00
75
83 88
93
Telefonica Orange BT Deutsche Telekom TI
49%49%48%
0
10
20
30
40
50
60
2009 2010 2011 2012 2013
47%
46%
% o
f re
ve
nu
es
81
100
0
10
20
30
40
50
60
70
80
90
100
110
2009 2010 2011 2012 2013
20
09
= 1
00
89 93 95
Drop due to one-off
redundancy costs

39166-114 | CONFIDENTIAL
Findim Group
During 2013, TI and Telefonica have continued to post the worst
performance of all EU5 incumbents
28 The context
-20%
-15%
-10%
-5%
0%
5%
Ye
ar-
on
-ye
ar
ch
an
ge
Q4 2013 Q3 2013 Q2 2013 Q1 2013
Domestic fixed broadband lines Net debt / EBITDA
Domestic revenue year-to-date Domestic EBITDA year-to-date
-15%
-10%
-5%
0%
5%
Ye
ar-
on-y
ear
ch
an
ge
(%
)
Q4 2013 Q3 2013 Q2 2013 Q1 2013
-4%
-2%
0%
2%
4%
6%
8%
10%
Ye
ar-
on-y
ear
ch
an
ge
(%
)
Q4 2013 Q3 2013 Q2 2013 Q1 2013
2.4x
Orange
2.4x 2.2x
TI
2.9x 2.7x
Telefonica
2.4x
BT
1.3x 1.3x
Deutsche
Telekom
2.2x 2.1x 2013
2012
Source: Analysys Mason based on operator filings
BT Deutsche Telekom Telefonica Orange TI

39166-114 | CONFIDENTIAL
Findim Group
TI has continued to reinvest a significant share of its revenues in Italy, but
has invested less than its competitors in Brazil in absolute terms
29 The context
Source: TI, BT, Orange, Deutsche Telecom, Telefonica
Domestic: capex has remained broadly
stable but is rising as share of revenues
TIM Brasil: investments are 35% lower than its
main competitor‟s
19%
0%
5%
10%
15%
20%
25%5
4
3
2
1
0
2010
3.1
15%
2009
3.5
16%
EU
R b
illio
n
% o
f reve
nu
es
2013
3.0
2012
3.1
17%
2011
4.2
1.3
2.9
22%
15%
Licences
Capex
max bmk
min bmk
% of revenues - inc. licences
% of revenues - exc. licences
EU5 incumbents domestic
capex as % of revenues
1.35 1.50
1.29 1.22 0.96
2.08 2.41 2.30
1.08 0.85
0
1
2
3
4
5
Ca
pe
x (
EU
R b
illio
n)
2011 2012 2009 2010 2013
Vivo TIM Brasil

39166-114 | CONFIDENTIAL
Findim Group
There are significant gaps between the status of both the fixed network in
Italy and the mobile network in Brazil versus peers/competitors
30 The context
Source: Analysys Mason Research, MiSE, Teleco
Domestic fixed: lowest NGA coverage
among European incumbents
TIM Brasil: competitive disadvantage on
3G/4G coverage
91%88%
92%91% 91%
75%76%
87%
70%
32%
23%25%
30%
23%
0%
10%
20%
30%
40%
50%
60%
70%
80%
90%
100%
% o
f p
op
ula
tion
Market Oi Claro Vivo TIM Brasil
4G 3G 2G
% o
f h
ou
se
hold
s c
ove
red
Investments required to guarantee
the future relevance of TI‟s fixed network
Investments required to support and
benefit from data-driven growth
99%95%
100%98%99%95%
100%100%
18%
37%
55%60%61%
64%64%
92%
8%
13%
23%
55%
25%
55%
37%
87%
0%1%3%
0%
88%
FR
1% 1%
ES UK DK
20%
CH
18%
DE BE
98%
22%
NL
22%
IT
DSL FTTH FTTC DOCSIS / CATV

39166-114 | CONFIDENTIAL
Findim Group
Domestic market shares have been steadily declining while the company
has expanded its subscriber market share in Brazil
31 The context
Source: TI, Analysys Mason Research, GSMA Intelligence, AGCOM
63.4%64.7%66.6%68.7%
71.8%
77.6%
84.9%89.1%
93.6%95.9%97.3%
49.7%51.4%52.8%54.9%58.0%59.6%
63.2%63.1%
70.4%66.9%
62.3%
36.1%37.0%37.4%36.8%37.6%41.8%43.6%43.0%42.1%42.6%
46.8%
26.7%26.5%26.0%24.7%23.3%23.9%25.6%25.2%23.3%20.5%
17.8%
0%
10%
20%
30%
40%
50%
60%
70%
80%
90%
100%
%of lin
es/s
ubscribers
Q3
201
3
2012
2011
2010
2009
2008
2007
2006
2005
2004
2003
Fixed BB Fixed line Mobile - Domestic Mobile - Brazil
Development of TI retail market shares

39166-114 | CONFIDENTIAL
Findim Group
Status: Hyper-competitive and
saturated market has destroyed
value
Objective: increase value offers
through data (4G and multi-
device) and innovative services
(M2M, m-payments etc.)
Status: Still the main component of fixed services (replaced by
broadband in other countries)
Objective: management of line loss and trade-off of ARPU with
broadband
Status: Underdeveloped demand/penetration and spending per
active user
Objective: stimulate both demand and willingness to spend
In Italy there seems to be room for growth in broadband by rebalancing
with fixed voice services, but mobile has suffered value destruction
32
10
15
20
25
30
50% 75% 100% 125% 150%
Penetration (households/population)
AR
PU
(E
UR
/mo
nth
)
* Western Europe includes Austria, Belgium, Denmark, Finland, France, Germany, Greece, Ireland,
the Netherlands, Norway, Portugal, Spain, Switzerland and the UK
Source: Analysys Mason Research Telecom Market Matrix, Q3 2013
Italian market vs. rest of Western Europe*
(% households for fixed voice and broadband, % population for mobile)
0 5 10 15 20 25
18.9
-20%
23.5
Fixed voice
Fixed
broadband
Mobile
The context
Revenue/inhabitant (EUR/month)

39166-114 | CONFIDENTIAL
Findim Group
TI has issued very limited details on its three-year targets but its outlook is
for a stabilisation at the group level and continued loss in Italy
33
Revenues
The context
Source: Analysys Mason based on TI investor presentation from 7 March 2014
EBITDA Capex
Group: stable
Domestic: negative low single digit
Brazil: positive mid single digit
Group: <EUR14 bn cum. 2014-16
Domestic: 18% capex / revenues
Brazil: 17% capex / revenues
30
25
20
15
10
5
0
23.4 23.6
27.6
EU
R b
illio
n
2016
2013
2010
16.2
1.3
6.2
20.1
0.3
6.9 8.0
15.2
0.3
Other and adjustments Brazil Domestic
15
10
5
0
EU
R b
illio
n
7.4
0.0 0.0 2.2 1.8
7.7
0.2 1.8
2016
2013
2010
9.6
11.4
9.4
9.6
5
4
3
2
1
0
2016
2013
2010
0.0 0.0
1.3
2.7 3.0
1.4
0.3
1.2
3.1
4.6
EU
R b
illio
n
4.1 4.4
Illustration of 2010 and 2013 actual performance vs. 2016 targets issued by TI
Guidance issued by TI
Group: stable
Domestic: negative low single digit
Brazil: positive mid single digit

39166-114 | CONFIDENTIAL
Findim Group
The macro-economy has been sluggish in Italy since 2008 but the
outlook is for a return to GDP growth and a reduction in unemployment
34 The context
-8%
-6%
-4%
-2%
0%
2%
4%
6%
2008 2009 2010 2011 2012 2013 2014 2015 2016
% y
ear-
on-y
ear
Source: EIU, IMF, Euromonitor
EU15 (Euromonitor)
EU15 (IMF)
EU15 (EIU)
IT (Euromonitor)
IT (IMF)
IT (EIU)
Change in real GDP, Italy vs. EU15 Unemployment rate, Italy vs. EU15
0%
2%
4%
6%
8%
10%
12%
14%
2008 2009 2010 2011 2012 2013 2014 2015 2016
% o
f la
bo
ur
forc
e
EU15 (IMF)
EU15 (EIU)
IT (IMF)
IT (EIU)

39166-114 | CONFIDENTIAL
Findim Group
TI is conditioned by the regulatory environment in Italy although it is
unlikely that the environment will deteriorate further in the near future
35 The context
Source: Analysys Mason based on TI and other sources
Key issues Current status Outlook
Ex-ante regulation TI is subject to ex-ante obligations on the main
fixed access markets including local loop
unbundling, line rental, wholesale broadband
access and covering both copper and FTTC/H
networks
Access prices for copper network were reduced
during 2013 whereas FTTC/H prices were set for
the first time
There might be scope for
wholesale price increases on
copper
Wholesale price decreases on
fibre are likely, but the wholesale
revenues from fibre are very
limited so the impact would be
limited for now
Approval for launch of
retail offers
TI needs to submit all retail offers using fixed
wholesale inputs to the regulator for approval
before commercial launch
Regulation may be reduced if TI
can demonstrate that it has
sufficient measures in place to
guarantee equality of inputs
Termination rates Pure LRIC-based termination rates have been
implemented on both mobile and fixed operations
Impact already factored in –
prices likely to be stable going
forward
Notification for copper
network switch-off
TI needs to provide five years‟ notice and/or
provide equivalent access before switching off its
current copper network
Switch-off has been announced in
Milan but no further movements
have occurred

39166-114 | CONFIDENTIAL
Findim Group
Brazilian GDP growth slowed down in 2011-12 but is now rebounding
somewhat, and inflation is expected to remain above 5%
36 The context
Source: EIU, IMF, Euromonitor
Change in real GDP, Brazil vs. Latin America Exchange rate (BRL:EUR)
-2%
0%
2%
4%
6%
8%
2008 2009 2010 2011 2012 2013 2014 2015 2016
% y
ear-
on-y
ear
LATAM (Euromonitor)
LATAM (IMF)
LATAM (EIU)
BR (Euromonitor)
BR (IMF)
BR (EIU)
0
1
2
3
4
2008 2010 2012 2014 2016
BR
L:E
UR
Inflation (change in consumer prices) in Brazil
0%
1%
2%
3%
4%
5%
6%
7%
2008 2010 2012 2014 2016
Infla
tion
(%
)
Euromonitor IMF EIU

39166-114 | CONFIDENTIAL
Findim Group
Contents
37
Executive summary
The context
Fixed domestic
Mobile domestic
TIM Brasil
New services
Company structure
Indicative implementation guidelines
Annex

39166-114 | CONFIDENTIAL
Findim Group
A long term fixed strategy needs to create a virtuous circle by addressing
both investments and demand in parallel
38 Fixed domestic
Investments
(network)
Demand
(for broadband and
ultra-fast broadband)
Sustainability
and value
creation
Demand cannot materialise without
adequate investment
Demand enables further investment

39166-114 | CONFIDENTIAL
Findim Group
TI should accelerate upgrades to its fixed network in order to lay
foundations for future growth and opex rationalisation
▪ TI has started to upgrade its network to
higher-capacity FTTC, but these plans do not
address the fundamental problems or lay
foundations for growth
– the coverage target remains at c. 50% of
households by 2016
– FTTC deployments are an overlay to
legacy local exchange-fed DSL without the
capacity to migrate all users to FTTC
39
▪ Make FTTC the leading platform
▪ Increase FTTC coverage and capacity and be
ready to exploit FTTH opportunity in some
areas
IDENTIFIED PROBLEMS PROPOSED ACTIONS
Fixed domestic | Network
FTTC: Network uses high-speed optical fibre as far as the cabinet, and copper-based wires from the
cabinet to the customer premises
FTTH: Network uses high-speed optical fibre as far as the customer premises
▪ Multiple parallel (modern and legacy)
networks are operated, increasing network
complexity and opex
▪ Plan a gradual migration of legacy voice to
broadband infrastructure to allow
rationalisation of network

39166-114 | CONFIDENTIAL
Findim Group
TI needs to improve its positioning in the retail broadband market to drive
demand and increase ARPUs
▪ Demand in Italy is lower than average (mainly
explained by low ICT literacy) and requires
stimulation by both TI and other players
40
▪ Put pressure on government to pursue
actions to improve ICT literacy
▪ Increase attractiveness of offers by adding
value through content and applications
– partnerships with OTT and content
providers
IDENTIFIED PROBLEMS PROPOSED ACTIONS
Fixed domestic | Demand
▪ TI is positioned as a low-value provider in the
broadband market and is losing lines
▪ Increase entry-level speed (nominal
bandwidth) in order to position TI as a high-
end provider
▪ TI‟s FTTC and FTTH products are positioned
at a significant premium to its lower-speed
DSL products which is not encouraging take-
up of the higher-speed products
▪ Reduce premium for fixed-line ultra-
broadband (UBB) products relative to entry-
level products to attract users onto higher-
value products

39166-114 | CONFIDENTIAL
Findim Group
Italy is characterised by declining demand for fixed-line services,
accelerated over the past few years by economic crisis
41 Fixed domestic
0
5
10
15
20
25
21.1
66%
2012
Lin
es (
mill
ion
)
21.6
63%
2013
34%
-1.1%
-0.8%
37%
2011
45% 39%
22.6
2004 2003
51%
2007
55%
2006
23.1
2005
30%
23.3
20%
23.1
80%
61% 70%
2010
22.4
61% 54%
22.4
59%
2009
22.4 22.0
39% 46% 41%
2008
49%
10%
-1.5% 23.5
90%
Focus from 2009 in
the following slides
CAGR
Fixed lines voice and broadband (mn)
Voice-only Broadband
▪ Second homes disconnected
▪ Fewer new homes activated
▪ Increased propensity to mobile-only
Voice-only lines are in decline
Growth in fixed broadband
lines has slowed since 2010
Source: Analysys Mason based on AGCOM, Analysys Mason Research and TI

39166-114 | CONFIDENTIAL
Findim Group
The Italian fixed market is performing poorly compared to EU5 mainly due
to a lack of growth in broadband revenues
42 Fixed domestic
Fixed line retail revenues
(2009 = 100)
Fixed broadband revenues
(2009 = 100)
Fixed voice* revenues
(2009 = 100)
* Includes line rental and traffic revenues
Source: Analysys Mason Research
8591
95
100101
10099100100100
2009 2010 2011 2012 2013
88
76
82
100
919194
99100
58
66
77
88
100
2009 2010 2011 2012 2013
91
86
ES FR UK DE IT
134130
125
116
100
100101102100
2009 2010 2011 2012 2013
99

39166-114 | CONFIDENTIAL
Findim Group
Italian broadband penetration and ARPU are amongst the lowest in
Western Europe, whilst the picture is somewhat better on fixed voice
43
Note: data shown refers to Q3 2013
Source: Analysys Mason Research
Fixed domestic
55
60
63
67
67
68
69
70
72
82
85
85
87
92
92
92
IT
AT
PT
SE
ES
IE
FI
DE
GR
BE
UK
NO
DK
FR
NL
CH
26
31
34
37
37
41
71
83
95
98
100
108
109
117
122
129
FI
PT
DE
DK
NL
SE
ES
CH
GB
BE
NO
IE
GR
AT
IT
FR
18
19
19
23
25
25
26
26
26
27
32
36
37
40
44
52
GR
AT
GB
IT
ES
SE
NL
BE
DK
NO
IE
DE
FI
PT
CH
FR
15
16
17
19
23
23
25
27
27
27
27
27
30
30
34
38
DE
GR
FI
GB
AT
BE
SE
NL
IE
IT
PT
DK
NO
CH
FR
ES
Fixed voice ARPU
(EUR/month/user)
Broadband ARPU
(EUR/month/user) Fixed lines penetration
(% of HHs)
Broadband penetration
(% of HHs)

39166-114 | CONFIDENTIAL
Findim Group
Source: Analysys Mason based on TI
Legacy voice services still dominate the fixed revenues of TI, and growth
from broadband has been limited
44 Fixed domestic
Wholesale
EUR3.6 bn
Wholesale
30%
Internet
EUR3.3 bn
ICT & Other
10%
Broadband
18%
Voice
EUR4.9 bn
Terminals & VAS
3%
Line rental
24%
Traffic
15%
Retail: EUR8.2 bn
B
L
T
TI‟s fixed domestic operations revenues
Traffic and access
revenues EUR6.7 bn 2013 full year 2009 full year
Wholesale
EUR4.1 bn
Wholesale
28%
Internet
EUR3.8 bn
ICT & Other
15%
Broadband
11%
Voice
EUR6.8 bn
Terminals & VAS
4%
Line rental
24%
Traffic
18%
Retail: EUR10.6 bn
B
L
T
Traffic and access
revenues EUR7.9 bn

39166-114 | CONFIDENTIAL
Findim Group
Note: TI data refers to full year (2013), EU peers refer to 9 months ending Q3 2013
Source: Analysys Mason Research and TI
BT
Italy has greater potential for increased retail broadband revenues than is
the case for other EU5 incumbent operators
45 Fixed domestic
Traffic
EUR1.0 bn
Line rental
EUR1.6 bn
Broadband
EUR1.1 bn
TI‟s fixed domestic retail revenues (2013)
Orange
Telefónica Deutsche Telekom
B
36%
S
46%
T
17%
S
37%
T
23% 41%
B
B
55%
S
33%
T
11%
B
47%
S
30%
T
22%
L T B L T B
L T B L T B
Traffic
EUR1.8 bn
Line rental
EUR2.8 bn
Broadband
EUR2.1 bn
26%
T
42%
L
32%
B

39166-114 | CONFIDENTIAL
Findim Group
Legacy voice services have been in constant decline in recent years
driven by falling revenues from (mainly voice-only) line rental and traffic
46 Fixed domestic
TI fixed voice revs (EUR bn) TI fixed voice lines (mn) TI fixed voice ARPU (EUR/month)
▪ Other operators are behaving
aggressively in the market and have
significantly lower voice ARPU than
TI
▪ TI‟s fixed voice revenue declined
– strong decrease of fixed voice traffic
– increase in line rental not offsetting
overall line decline
▪ Voice-only lines are declining faster
than lines with broadband services
– commoditised telephony service has
resulted in intense price competition
– greater tendency for voice-only to be
abandoned (in favour of mobile)
Source: Analysys Mason based on Analysys Mason Research and TI
28292930
31
17171717
2021
2426
0
5
10
15
20
25
30
35
20
13
20
12
20
11
20
10
20
09
17
0
2
4
6
8
10
-5.5%
-10.3%
-7.5%
20
13
20
12
20
11
20
10
20
09
13.214.0
14.715.4
16.1
6.37.0
7.58.2
9.1
0
4
8
12
16
20
20
13
20
12
20
11
20
10
20
09
-4.8%
-8.8%
Voice only Voice Line rental Traffic
L
T
Mkt w/o TI TI line rental TI total
Space to further
push subscription
based voice tariffs

39166-114 | CONFIDENTIAL
Findim Group
The decline in TI‟s voice revenues has been only partially offset by rising
broadband revenues
47 Fixed domestic
TI fixed voice and broadband revenues
(EUR bn)
TI fixed voice and broadband lines
(mn)
TI fixed voice and broadband ARPU
(EUR/month)
▪ Broadband revenues have only partially
offset the decline in traditional voice
▪ TI would benefit from upgrading voice-
only lines to bundles with broadband
services
▪ Broadband subscribers typically
have higher switching costs (vs.
voice-only users)
▪ TI‟s broadband ARPU has remained
broadly flat over the years
Source: Analysys Mason based on Analysys Mason Research and TI
282929
3031
1919192020
272829
3435
0
10
20
30
40
20
12
20
11
20
10
20
09
20
13
13.214.0
14.715.4
16.1
8.79.09.19.18.7
0
3
6
9
12
15
18
20
10
20
09
20
12
20
11
20
13
4.5
Tot broadband and Bitstream Voice
0
2
4
6
8
10
20
13
20
10
20
09
20
12
20
11
Broadband Line Rental Traffic Broadband
Total fixed voice Mkt broadband w/o TI
-7.5%
B -6.0%
CAGR
2009-13
L
T

39166-114 | CONFIDENTIAL
Findim Group
TI‟s wholesale revenue have declined despite a modest rise in revenues
from access services (mainly LLU)
48 Fixed domestic
▪ Wholesale revenues declined in the
years to 2012 and have since
stabilised
– regulatory pressure on prices is not
expected to significantly harm TI‟s
wholesale revenues going forward
▪ Overall LLU lines have grown although
somewhat slower in the last year
– share of narrowband access lines has
declined substantially in line with the
trend observed in other EU markets
5.5
5.0
4.5
4.0
3.5
3.0
2.5
2.0
1.5
1.0
0.5
0.0
20
13
20
12
20
11
20
10
20
09
WBA Naked WLR LLU
8,000
6,000
4,000
2,000
0
20
13
20
12
20
11
20
10
20
09
▪ Wholesale revenue decline was
mainly driven by TI‟s intl. wholesale
business (mainly Sparkle) and other
wholesale service (e.g. leased lines,
dedicated links, etc.)
3,574
1354,117
2013 Other
412
Int‟l
317
Other
Access
50
LLU 2009
TI fixed wholesale revenues
(EUR mn)
TI wholesale lines
(mn)
TI wholesale revenues bridge
(EUR mn)
Source: TI
Grown since 2009
but regulated prices
have been revised
downwards in 2013

39166-114 | CONFIDENTIAL
Findim Group
Contents
49
Executive summary
The context
Fixed domestic
Mobile domestic
TIM Brasil
New services
Company structure
Quantification of targets
Network
Broadband demand
Voice demand

39166-114 | CONFIDENTIAL
Findim Group
Source: Analysys Mason based on Analysys Mason Research, European Commission
(Broadband Coverage in Europe 2012), Rapporto Caio (2014), TI
In Italy, fixed broadband mainly relies on TI‟s legacy DSL network; in other
countries there is much greater infrastructure competition thanks to CATV
50
Broadband coverage % HHs by platform (latest available data, for Italy 2013) ▪ Italy is the only European country
without a high-speed broadband
network over cable (DOCSIS)
▪ Alternative FTTH coverage is limited to
Milan where it is operated by wholesale
operator Metroweb and alternative
operator Fastweb
– TI partially uses the Metroweb
network for its FTTH in Milan
▪ FTTC has been deployed only recently
– led by TI, with Fastweb also building
its own network in parallel using TI
copper sub-loops
▪ The lack of alternative networks means
that TI is ideally positioned to exploit the
growth of UBB by
– strengthening its position in FTTC
– deploying FTTH tactically where
demand/density allows it
Legend DSL FTTH FTTC DOCSIS
/ CATV
99%95%
100%98%99%95%
100%100%
18%
37%
55%60%61%
64%64%
92%
8%13%
23%
55%
25%
55%
37%
87%
0%1%0%1%3%
1%
98%
FR IT ES UK DK
20%
CH
18%
DE NL
88%
BE
22% 22%
Fixed domestic | Network
Available
downstream
bandwidth:
<20Mbit/s <50Mbit/s >100Mbit/s <100Mbit/s

39166-114 | CONFIDENTIAL
Findim Group
Incumbent share of fixed lines* (mn)
TI‟s network is a strategic infrastructure for Italy as there is no cable
competition and limited FTTH roll-out
51 Fixed domestic | Network
2003 2004 2005 2006 2007 2008 2009 2010 2011 2012 2013
80%
100%
70%
60%
0%
90%
99% 99% 97% 98% 99% 98% 99% 99%
% o
f p
hysic
al a
cce
ss
99% 99% 99%
Swisscom
KPN
Belgacom
TDC
TF
Orange
BT
DT
TI
* Retail and wholesale
Source: Analysys Mason based on AGCOM and Analysys Mason Research
97% of physical accesses
supplied by TI
Other EU countries have
infrastructural competition from
cable operators
Expected competition at
infrastructure level in Italy
▪ FTTC via TI‟s infrastructure
▪ Some wireless substitution

39166-114 | CONFIDENTIAL
Findim Group
Objective DAE 2013: 100% of residents
covered by basic broadband services
Actual achieved 2013: 98% of population
covered up to 2Mbit/s
(rest partly served by FWA)
“Italy is de facto compliant with the first
EU broadband target” [Caio, 2014]
Objective DAE 2020: 100% of residents
covered by fast broadband (≥30Mbit/s)
Actual achieved 2013: 18% of
households covered with FTTC/VDSL
(30-100Mbit/s)
“Recent investments to FTTC/VDSL
upgrades by all operators makes this
objective look achievable” [Caio, 2014]
Objective DAE 2020: ≥50% of HHs
subscribed to UBB (≥100Mbit/s)
Italy still needs substantial investment to reach the EC digital agenda
(DAE) targets for 2020
52 Fixed domestic | Network
Source: Analysys Mason based on MiSE, Rapporto Caio (2014) and TI
Actual achieved 2013: FTTH coverage
still nascent (FTTH offers available in
some part of selected cities)
“Based on current regulatory rules, level
of demand and planned investments the
third objective of the DAE will not be met”
[Caio, 2014]
Legend: High Medium Low Example of cities where FTTH is available

39166-114 | CONFIDENTIAL
Findim Group
The Italian population is more evenly distributed than in Germany, Spain
and France, requiring greater investment to meet the DAE targets
▪ The population in Italy is generally
more dispersed across the country
than in its benchmarked peers
▪ The first 10% of most densely
populated municipalities account for:
– 40% of all inhabitants in Italy
– 60% of all inhabitants in France
and Germany
– 70% of all inhabitants in Spain
▪ There may be a need for public
funds to boost coverage and meet
the DAE targets in Italy
53
Source: Analysys Mason based on national statistics offices
Fixed domestic | Network
Correlation between population and number of municipalities
0%
10%
20%
30%
40%
50%
60%
70%
80%
90%
100%
0% 10% 20% 30% 40% 50% 60% 70% 80% 90% 100%
% c
um
ula
tive
po
pu
lation
ran
ke
d b
y d
ecre
asin
g
po
pu
latio
n d
en
sity m
un
icip
alit
y
% municipalities
Italy France Germany Spain

39166-114 | CONFIDENTIAL
Findim Group
EU
EU policy for broadband plans stands between a liberalised US approach
and a „public-oriented‟ Asian one, but its effectiveness has yet to be proven
54
* 49% coverage for DOCSIS refers to the average of the Western European area
Source: Analysys Mason, Analysys Mason Research
Fixed domestic | Network
Coverage
(technology)
Limited access regulation Access
obligations
Country/
region
Broadband policy in EU seems to stand in between that of east Asia (where access regulation is imposed but public funds were made
available) and that of the USA (where investments were predominantly private but no access regulation was imposed)
Predominantly private
(public in rural areas) Predominantly public
Access regulation
50% FTTx
85% DOCSIS3.0
Access regulation
37% FTTx
49% DOCSIS3.0*
USA
94-99% FTTx
58-99% DOCSIS
Predominantly private Investing
entity
SG
KR JP
US

39166-114 | CONFIDENTIAL
Findim Group
TI‟s network can be gradually upgraded to achieve long-term objectives
and growth, but this requires investment in the backhaul and access
55 Fixed domestic | Network
National or long distance Regional or backhaul Access
C/DWDM ring
IP/MPLS
SDH ring
ATM
GTW/M
SBC
Terarouter
Terarouter
Catalyst - PoI
Catalyst - PoI
Concentrator
Concentrator
▪ Last-mile infrastructure connecting
end users and LE mainly via copper
(10 500 LEs, 150 000 cabinets and
~600 000 km of copper cables)
• Link between exchanges and the
and second hierarchy of the
network - C/DWDM links (~600
physical locations)
▪ Link between regional locations and
national backbone – PtP and DWDM
(30 national sites; star network
topology with 2 main hubs)
Router
Router and
multiplexer
Router
Router
Mix of legacy and modern protocols.
Scope for rationalisation Requires significant
investments for upgrade
Investments
largely incurred
Control layer
and platforms
Note: VDSL provided by local exchange if local loop is short enough
Source: Analysys Mason on AGCOM, Notiziario Tecnico Telecom Italia – Numero 2/2012, TI
Router
1-10 GigE links 10+ GigE links
Multiplexing on fibre Copper Fibre
Domain Interconnection Platform
BRAS
` LE
OLT
Internet
modem
PSTN and/or ADSL/2+
FTTC/VDSL
FTTH/GPON
Splitter and joints
Joints
LE
SLU
~200-3 000 m
IP
Analogue
IP
Internet
modem
or
Analogue
IP
Internet
modem
or
Cabinet
Cabinet
MSAN*
LLU
~300-4 000 m
Primary Secondary
MDF/
ODF
ODF
Primary Secondary
LE MDF
OLT
DSLAM

39166-114 | CONFIDENTIAL
Findim Group
TI needs to aggressively invest in NGA in order to remain the main access
network provider in Italy
56 Fixed domestic | Network
Political and regulatory pressure
▪ Italy is at risk of not meeting the EC‟s
digital agenda targets for 2020
▪ A fundamental contradiction exists
between the pressure to meet EC‟s
digital agenda targets and the limited
return envisaged for NGA investment
▪ This has resulted in significant
political pressure on TI to develop its
network
– TI is the main private-sector entity
that can contribute to the
achievement of these targets
▪ Various government members,
including the current and previous
prime ministers, have expressed
support for the access network
separation of TI if it does not
accelerate roll-out
Competitive pressure
▪ The lack of infrastructure competition
(especially the lack of CATV) has
until now limited the need for
investments to maintain the
competitive position
▪ Even dominant operators need to
invest to maintain their position:
– Microsoft continued Windows
upgrades to maintain dominance
– Some incumbents (e.g. in Bulgaria
and Romania) delayed launch of
DSL services and now have to
compete with multiple new
entrants
– in Milan, Metroweb has already
replaced TI as the main
broadband network
Pressure to
increase
roll-out

39166-114 | CONFIDENTIAL
Findim Group
EUR5.79/month
Continued network dominance would allow TI to safeguard wholesale
revenues, even if some retail market share is lost
57
*IRU = indefeasible right of use
Source: TI‟s reference offer (2014)
Fixed domestic | Network
TI invests in
infrastructure
OLOs invest in
TI infrastructure
OLOs invest in
their own
infrastructure
In most cases OLOs have access to the final users thanks to TI access network
TI gets wholesale
revenue
TI gets IRU* revenue
and SLU, but not the
vertical
TI does not get
revenue from OLOs
with exception of SLU
Local exchange Cabinet Building User
EUR3900.35/15 years
EUR5.79/month
EUR24.90/month
EUR5.96/month
EUR1700.91/15 years
If an OLO invests in FTTH SLU
is not required anymore
FTTC
FTTH
Vertical
FTTC
FTTH
Vertical
FTTC
FTTH
Vertical
Including co-investment
EUR3900.35/15 years
Legend:
Commitment for 15 years
Payable when line is active
Copper SLU
EUR21.51/month (includes SLU)

39166-114 | CONFIDENTIAL
Findim Group
FTTC should become the only technology for broadband in covered areas
which would enable cost savings for TI and a modern network for all users
58 Fixed domestic | Network
Access
▪ TI intends to provide broadband from the LE in parallel to FTTC
– MSAN at cabinet not dimensioned to serve all fixed broadband users
– TI is currently able to offer FTTC/VDSL services to max c. 5% of the HHs*
▪ TI looks for UBB demand to materialise before committing to further investments
– experience from other markets demonstrate that demand lays behind coverage
▪ Opex savings (maintenance, energy, space etc.) fully achieved if FTTC becomes
the only platform (by removing DSLAM)
* 18% pop. FTTx coverage = 4.5 mn HHs
Note: Assuming an average cabinet size of 180 lines, TI would have upgraded 25 000 cabinets with
fibre (or 1.2 million HHs effectively covered)
Source: Analysys Mason Research, Notiziario Tecnico Telecom Italia
Expand cabinet and
equipment capacity (now
limited to 48 ports)
Currently TI is able to offer
FTTC/VDSL services to
max c. 5% of the HHs*
LE
OLT
Internet
modem
PSTN and/or ADSL/2+
FTTC/VDSL
FTTH/GPON
Splitter & joints
Joints
LE
SLU
~200-3 000 m
IP
Analogue
IP
Internet
modem
or
Analogue
IP
Internet
modem
or
Cabinet
Cabinet
MSAN*
LLU
~300-4 000 m
Primary Secondary
MDF/O
DF
ODF
Primary Secondary
LE MDF
OLT
DSLAM
Make FTTC the leading broadband platform
O
Expand cabinet and
equipment capacity (now
limited to 48 ports)
Currently TI is able to offer
FTTC/VDSL services to
max c. 5% of the HHs*
Concentrator
Concentrator

39166-114 | CONFIDENTIAL
Findim Group
Investments to extend coverage are required to ensure take-up and long-
term return on investments
59 Fixed domestic | Network
Source: Analysys Mason Research
0%
10%
20%
30%
40%
50%
60%
70%
0% 10% 20% 30% 40% 50% 60% 70% 80% 90%
Coverage:
HHs passed as % of total HHs
US
CH
ES
KR
NO
NL
JP
DE
FR FI
Ta
ke
-up
:
HH
s c
on
nec
ted
as %
of H
Hs p
asse
d
BE
AT
US CH
NL
DK
FR
FI
DK
BE
AT
DE
FTTH FTTC
Coverage and take-up benchmark (excluding Italy)
▪ International evidence proves
that take-up follows coverage
▪ FTTC coverage in Italy stands at
18% of households
– take-up is still very limited
given FTTC‟s nascent stage
▪ FTTH coverage in Italy stands at
8% of total households …
– … of which 14% (~300 000)
are connected (the majority
by Fastweb)

39166-114 | CONFIDENTIAL
Findim Group
TI should accelerate and expand FTTC investments with an option to move
to FTTH in the future
60
Access
Fixed domestic | Network
▪ TI expects to achieve over 50% population FTTx coverage by 2016
– we envisage a further acceleration and expansion of coverage targets to meet
DAE objectives and enable exploitation of FTTH potential (commercial impact)
▪ 4G is not positioned as a perfect substitute to the fixed broadband line (as capacity
is shared among users)
– however, without rapid investment in FTTx, a cost-effective roll-out of 4G by
OLOs might erode the role of TI‟s fixed network infrastructure in certain areas
Source: Analysys Mason based on Analysys Mason Research, Notiziario Tecnico Telecom Italia
6.14.7
0.5
11.29.1
5.84.5
0
5
10
15
20
25
10% 20% 30% 40% 50% 60% 70% 80% 90% 100%
EU
R b
illio
n
Cumulative HHs (%)
22.2
8.0
14.6
3.6
7.3
2.8 2.2 1.8 3.3
1.4 2.1
0.9 1.0
FTTH FTTC
FTTC 4G and copper
Currently TI is able to offer
FTTC/VDSL services to
max c. 5% of the HHs*
LE
OLT
Internet
modem
PSTN and/or ADSL/2+
FTTC/VDSL
FTTH/GPON
Splitter and joints
Joints
LE
SLU
~200-3 000 m
IP
Analogue
IP
Internet
modem
or
Analogue
IP
Internet
modem
or
Cabinet
Cabinet
MSAN*
LLU
~300-4 000 m
Primary Secondary
MDF/O
DF
ODF
Primary Secondary
LE MDF
OLT
DSLAM O
Concentrator
Extend coverage
beyond ~50% pop.
Concentrator
Be ready to exploit FTTH
potential in specific areas
Increase FTTC coverage and be ready to exploit FTTH
FTTx coverage capex (FTTH incremental to FTTC)
2013 achieved ~18% 2016 objective >50% Possible target
Note: FTTB can be used as an
alternative to FTTH in specific
circumstances

39166-114 | CONFIDENTIAL
Findim Group
Partnerships with existing fibre access networks could allow TI to
accelerate its network deployment and move to FTTH in certain areas
▪ There are many institutional investors in Italy that invest in
infrastructure of strategic importance for the country
– some have expressed an interest to invest in the TI‟s fixed
access network
▪ There are existing metropolitan fibre networks in Italy
– some of them operate in (or have begun investments in)
Milan and other cities such as Genoa, Bologna, Naples
and Rome
▪ A partnership with existing fibre access networks would allow
TI to:
– accelerate its network upgrade in certain cities where it
could move towards a higher-speed FTTH architecture
– make savings on FTTC deployments
▪ This can be considered in specific areas of the country with
– high dwelling density (dwellings per building)
– high network density (metres of network per building)
– existing infrastructure presence (reusable for FTTH)
61 Fixed domestic | Network
Existing FTTH networks
Examples of high-density cities
Existing FTTH networks and examples of high-dense cities
Milan
Genoa
Bologna Turin
Rome
Naples
Palermo

39166-114 | CONFIDENTIAL
Findim Group
VoBB strategies (examples)
TI should gradually migrate legacy voice (PSTN) to more modern and
cost-effective voice-over-broadband (VoBB) technology
62 Fixed domestic | Network
Access
▪ Voice is declining in importance to users and as source of revenue for TI
▪ Increasing momentum towards phasing out of PSTN/ISDN in EU
– end-of-life for equipment (vendors discontinue support); increasing cost per sub
(O&M – incl. SLAs, energy)
– O&M savings achievable with VoBB; broadband upsell opportunity (bundling);
property sale/rationalisation (real-estate and copper)
▪ To gain VoBB synergies, migration must be co-ordinated with FTTx roll-out
Source: Analysys Mason based on Analysys Mason Research and operators‟ institutional website,
Notiziario Tecnico Telecom Italia
Operator Commentary
Deutsche
Telekom
▪ Pursuing PSTN switch-off across its eight markets by 2018
▪ Migrate remaining voice-only customers using MSANs
AT&T ▪ Transition to an all-IP network using native VoIP by 2020
▪ Regulatory issues: non-migrating customers being cut-off
Telenor ▪ Offer only VoBB or fixed wireless IP based by 2017
▪ Copper phase out in some rural areas with high O&M
Belgacom ▪ Phase out PSTN by 2018 by MSAN-based migration strategy in conjunction
with FTTC roll-out
Telekom
Austria
▪ Successfully completed the transformation of its PSTN to VoIP in 2013
▪ Migrated 1481 exchanges and 2.3 million access lines
Currently TI is able to offer
FTTC/VDSL services to
max c. 5% of the HHs*
OLT
DSLAM O
Concentrator
Concentrator
O
O Moving forward
scope for workforce
rationalisation
Gradual migration to VoBB
LE
OLT
Internet
modem
PSTN and/or ADSL/2+
FTTC/VDSL
FTTH/GPON
Splitter and joints
Joints
LE
SLU
~200-3 000 m
IP
Analogue
IP
Internet
modem
or
Analogue
IP
Internet
modem
or
Cabinet
Cabinet
MSAN*
LLU
~300-4 000 m
Primary Secondary
MDF/O
DF
ODF
Primary Secondary
LE MDF
A technician can perform
~2000 migrations/year
39166-114 | CONFIDENTIAL
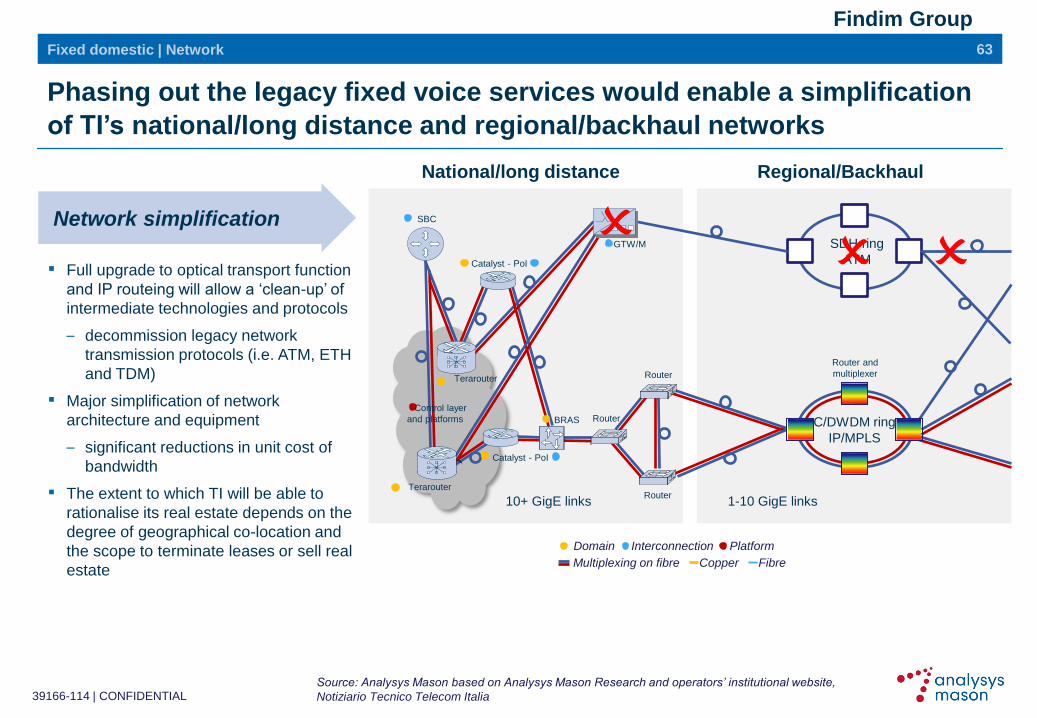
Findim Group
▪ Full upgrade to optical transport function
and IP routeing will allow a „clean-up‟ of
intermediate technologies and protocols
– decommission legacy network
transmission protocols (i.e. ATM, ETH
and TDM)
▪ Major simplification of network
architecture and equipment
– significant reductions in unit cost of
bandwidth
▪ The extent to which TI will be able to
rationalise its real estate depends on the
degree of geographical co-location and
the scope to terminate leases or sell real
estate
Phasing out the legacy fixed voice services would enable a simplification
of TI‟s national/long distance and regional/backhaul networks
63 Fixed domestic | Network
Network simplification
Source: Analysys Mason based on Analysys Mason Research and operators‟ institutional website,
Notiziario Tecnico Telecom Italia
Regional/Backhaul National/long distance
C/DWDM ring
IP/MPLS
SDH ring
ATM
GTW/M
SBC
Terarouter
Terarouter
Catalyst - PoI
Catalyst - PoI
Router
Router and
multiplexer
Router
Router Control layer
and platforms
1-10 GigE links 10+ GigE links
BRAS
`
O O O
Multiplexing on fibre Copper Fibre
Domain Interconnection Platform

39166-114 | CONFIDENTIAL
Findim Group
Contents
64
Executive summary
The context
Fixed domestic
Mobile domestic
TIM Brasil
New services
Company structure
Quantification of targets
Network
Broadband demand
Voice demand

39166-114 | CONFIDENTIAL
Findim Group
Italy has fallen six years behind its EU5 peers in terms of broadband
penetration, yet it seems to have reached a plateau
65 Fixed domestic | Broadband demand
52%48%
42%37%
92%90%
80%
68%
0%
10%
20%
30%
40%
50%
60%
70%
80%
90%
100%
62%
46%
2007
55%
61%
2006
44%
49%
2005
34%
40%
29%
2004
22% 27%
20%
2003
13% 15%
% o
f h
ou
se
hold
s
37 p.p.
Q3
2013
78%
55%
2012
76%
54%
2011
74%
85%
54%
2010
70%
2009
66%
75%
2008
EU4 ES FR UK DE IT
Evolution of fixed broadband penetration in EU5 Broadband users in other EU5 grew
on average at 5.4% CAGR in 2009-
12 compared to 4.2% in Italy…
… despite already higher
penetration (66% vs. 48% in 2009
respectively)
In Q3 2013 penetration in Italy
equalled the average of other EU5
in 2007
A commitment to investment in
infrastructure could catalyse a rapid
growth in take-up, especially if
coupled with greater availability of
content…
…putting Italy on a convergent
trend with EU5 peers
As plateau is reached
enablers (e.g. content,
killer app) are required
Source: Analysys Mason Research

39166-114 | CONFIDENTIAL
Findim Group
▪ In terms of SMEs (10-249 employees) and large
corporations, Italy has same level of integration of
internal processes (with an ERP) as the EU (73%
of all enterprises both in Italy and EU)
▪ Unlike Italian consumers, SMEs and large
enterprises purchase online as much as their
European peers (15% and 25% of enterprises,
respectively)
▪ Fixed broadband lines ≥10Mbit/s account for 14%
of lines in Italy (vs. EU average of 53%)
▪ Italy fixed broadband lines ≥30Mbit/s negligible
▪ Individuals regularly using Internet:
56% in Italy vs. 72% in EU
▪ Nomadic use (laptop/tablet) to access Internet
uncommon amongst Italians: 13% vs. 24% in EU
▪ Individuals accessing info on goods and services
in past three months: 64% of Internet users vs.
79% in EU
Demand-related issues are currently limiting take-up of broadband
services in Italy
66 Fixed domestic | Broadband demand D
em
an
d
-% 100%
Share of fixed BB lines
(≥2 and <10Mbit/s)
Individuals who have
never used the internet
Online banking (% of
internet users )
Citizens‟ use of e-
Government services
Ordering goods or
services online (%
internet users)
Integration of internal
processes - SME
E-G
ov
ICT
lit
era
cy
▪ Italian enterprises using eGOV services close to
EU (85% vs. 88% of enterprises, respectively)
E-C
om
m/E
-biz
Note: data refers to 2013 with the exception of Demand indicator (2012)
Source: European Commission
83.7% 37.1%
34.4%
55.5%
41.4%
26%
25%
61.3%
20.5%
20.6%
37.1%
32.4%

39166-114 | CONFIDENTIAL
Findim Group
Internet usage will naturally increase as the Italian population ages, which
will further stimulate broadband take-up
67 Fixed domestic | Broadband demand
* Internet users penetration (% population)
Source: Analysys Mason based on Istat and Euromonitor
65-74
11-14
41%
3%
88%
60-64
16%
79%
69%
89%
45%
59%
31%
55-59
18-19
76%
45-54
6-10
20-24
35-44
75 +
15-17
86%
25-34
11%
11%
7%
7%
15%
17%
13%
6%
2%
3%
4%
5%
~3
6%
po
pu
latio
n
only ~20% of older people have
used Internet in the last 12 months
~82% of young people have used
Internet in the last 12 months
~2
8%
po
pu
latio
n
Population distribution by age group Individuals who used Internet in last 12 months by age group
52.5% 73.0%*
Illustrative: expected individuals using the Internet

39166-114 | CONFIDENTIAL
Findim Group
In a stagnant broadband market, TI performed poorly especially when
compared to Fastweb which is gradually extending its network footprint
68 Fixed domestic | Broadband demand
Source: Analysys Mason Research
49.6%51.4%
52.8%54.9%
58.0%
13.6%15.7%16.2%15.8%14.6%
12.5%12.5%13.1%12.1%9.9%
0%
10%
20%
30%
40%
50%
60%
2009 2010 2011 2012 2013
% o
f re
tail
su
bscrib
ers
13.9% 11.8% 12.9% 13.2% 13.3%
Vodafone (TeleTu) TI Wind Fastweb
23
-41-51-36
-10-7
242320
7048
23
4Q 2013 3Q 2013 2Q 2013 1Q 2013 3Q 2012 4Q 2012
▪ TI is gradually losing broadband subscribers
– although this trend was recently reversed
after ten quarters of contraction
▪ Fastweb is aggressively signing new
customers, helped by the expansion of its
infrastructure footprint
– it has traditionally focused on the business
segment demonstrating a significant
ARPU premium (vs. market)
– Fastweb co-invested with TI to cover 19
cites with FTTC by the end of 2014
▪ Vodafone and Wind have maintained broadly
stable subscriber bases
– Vodafone plans to cover 150 cities
(6.4 million HHs) with FTTC by 2016
Fixed broadband retail market share Fixed broadband net additions („000)

39166-114 | CONFIDENTIAL
Findim Group
Evolution of incumbents broadband retail subscribers market share in EU5
TI should be able to reverse market share loss at a higher level than other
European incumbents given the lack of infrastructure competition
69 Fixed domestic | Broadband demand
▪ Incumbent operators in other
markets have successfully
reversed similar trends in the loss
of market share
– evidence from UK and
Germany
▪ TI has a more favourable
opportunity than its international
peers due to the relatively limited
infrastructure competition in Italy
– lack of infrastructure
competition means that TI will
generate wholesale revenues
even if losing retail market
share
50%51%53%
58%60%
63%63%
70%
30%29%29%28%27%27%27%
0%
10%
20%
30%
40%
50%
60%
70%
80%
67%
62%
% o
f re
tail
su
bscrib
ers
Q3
2013
2012 2011 2010 2009 2008 2007 2006 2005 2004 2003
55%
24%
28% 25% 24%
TF BT Orange DT TI
Source: Analysys Mason Research

39166-114 | CONFIDENTIAL
Findim Group
TI has a lower ARPU than the overall broadband market and has been
unable to improve its market share
70
Fixed broadband market share of major EU5 fixed incumbents
Fixed domestic | Broadband demand
Source: Analysys Mason Research
25%
30%
35%
40%
45%
50%
55%
60%
65%
25% 30% 35% 40% 45% 50% 55% 60%
12
11
10
09
13
12 11
10
09
13
12 11
10 09
13
12
Re
ve
nu
e m
ark
et sh
are
(%
)
10
09
13 12
11 10 09
Broadband retail subscriber market share (%)
13
11
Above the grey line the operators are creating more value per
customer than the average of their respective markets
Below the grey line the operators are creating less value per
customer than the average of their respective markets
TF Orange BT DT TI
BT improved subs market share
over the years and more
recently also revenue market
share (2013 9m), being
positioned as a high-end
provider in the UK
FT and DT were able to
maintain a position of high-
end providers at expenses of
subscribers market share TF market positioning
deteriorated significantly
over the years
TF launched its Fixed-
Mobile convergent offer
(Fusion) in Q4 2012

39166-114 | CONFIDENTIAL
Findim Group
Source: Analysys Mason Research
There are examples of operators that have successfully increased ARPU,
but this can be at the expense of some market share loss
71 Fixed domestic | Broadband demand
0
5
10
15
20
25
30
35
40
45
20% 25% 30% 35% 40% 45% 50% 55% 60%
10 09
13
12
11 10 09
AR
PU
(E
UR
/ lin
e /
mo
nth
)
Broadband retail subscriber market share (%)
13
12
12
11
10 09
13
11
10 09
13
12 11 10 09
13 12 11 10
10
09
13
12
11 09
13 12 11
Benchmark of broadband ARPU and market share of broadband lines in selected EU countries
Iliad SFR Belgacom Orange BT Deutsche Telekom TI
SFR and Iliad have managed to increase ARPU
• SFR surrendered market share to focus on
higher-value customers
• Iliad initially focused on gaining market share
and then on increasing its ARPU (flat offers)
Most of the European incumbents were
able to protect stable ARPU, often at
the expenses of their market share
BT was able to maintain its ARPU
stable while increasing its market share

39166-114 | CONFIDENTIAL
Findim Group
Operators are focusing on different levers to drive take-up and ARPU to
guarantee sustainability and long-term value creation
72 Fixed domestic | Broadband demand
Levers Applicability to TI Example of operators
Narrow price differential and
introduce discounts to favour
upsell P
BT, Portugal Telecom,
Orange, SFR,
Iliad
Increase speed to improve user-
experience
Partner with content aggregator
and provide value-added
services to enrich offer and make
it attractive for users
Partner with consumer
electronics suppliers to offer
multi-screen solutions
BT, Orange, Belgacom
P
O BT, Virgin Media, Portugal
Telecom, ZON Optimus,
Deutsche Telekom,
Orange P
No need for proprietary
pay-tv platform
VoD, movies, music,
gaming, etc.
P Virgin Media, ZON
Optimus
Example of initiatives
BT: typically charges an extra GBP5/month for
FTTH product; PT: no price difference; Orange:
discounts FTTH to make its equivalent DSL-
based bundles at the same price for 12 months
BT: BT Broadband (DSL) up to 16Mbit/s, BT
Infinity (VDSL) up to 76Mbit/s, BT Infinity (FTTH)
up to 300Mbit/s
BT: HD extra channels and BT Sport; Virgin
Media: Netflix; PT: music streaming, cloud
storage and cloud gaming service; Orange:
special offers on premium content for FTTH subs
Virgin Media: TiVo DVR; ZON Optimus: NDS
Snowflake and DVR

39166-114 | CONFIDENTIAL
Findim Group
Bandwidth offered by TI offers vs. entry-level offers in Europe
TI should focus on increasing entry-level speed (nominal bandwidth) in
order to position itself as a quality and high-end provider
73 Fixed domestic | Broadband demand
▪ Users can be migrated to higher
download speeds relatively cheaply by:
– upgrading DSLAM line cards
(if needed)
– expanding bandwidth/user in
backhaul/core
▪ TI can position itself as a quality and
high-end provider by
– leveraging on its unique network
assets
– differentiating from competition
Source: Analysys Mason based on Analysys Mason Research and TI
50
3030303030
2424
20202020
16161616161615
1210101010
88887
22
Tele
com
Ita
lia
Belg
acom
Tele
net
Virgin
Media
Tele
com
Ita
lia
SF
R
Ilia
d (
Fre
e)
WIN
D (
Info
str
ada)
ON
O
Zig
go
Tele
com
Ita
lia
Vodafo
ne
Talk
Talk
Deuts
che T
ele
kom
Plu
snet
BT
Num
ericable
100
Tele
com
Ita
lia
100
Sky
UP
C N
eth
erlands
Ora
nge
Scarlet
Tele
fónic
a
Fastw
eb
Unitym
edia
Tele
com
Ita
lia
KP
N
UP
C A
ustr
ia
Tele
2 A
ustr
ia
A1 T
ele
kom
Austr
ia
Tele
com
Ita
lia
Sw
isscom
UP
C C
able
com
Tele
com
Ita
lia
640kbit/s
7Mbit/s appears to
be the core service
of TI offering
Median 16Mbit/s

39166-114 | CONFIDENTIAL
Findim Group
Italy is behind other EU countries in terms of download nominal speed
74 Fixed domestic | Broadband demand
82%
20%
63%60%
31%
44%
27%
14%3%
0%
10%
20%
30%
40%
50%
60%
70%
80%
90%
100%
84%
22%
0%
12%
46%
20%
1%
4% 1%
11%
1%
15%
53%
7%
2% 8%
43%
3%
4%
31%
32%
2%
1%
14%
23%
3% 2%
% o
f to
tal co
nn
ections
IT DE ES NL DK UK BE FR
9%
2%
Above 100Mbit/s 30Mbit/s - 100Mbit/s 10Mbit/s - 30Mbit/s 2Mbit/s - 10Mbit/s 144kbit/s - 2Mbit/s
Distribution of download nominal speeds per country (Jan 2013)
Source: Analysys Mason based on European Commission

39166-114 | CONFIDENTIAL
Findim Group
4-8K HD movie size 100-200GB
which takes >30 hours to be
downloaded with a 7Mbit/s connection
Mb
it/s
dow
nstr
eam
TV
Ultra
HD
8K
TV
Ultra
HD
4K
2 b
‟ca
st ch
an
ne
ls
HD
ga
min
g
OT
T s
tre
am
ing
Bro
wsin
g
Pe
rso
na
l C
loud
Skyp
e H
D
Examples of bandwidth requirements per service
New services, such as 4-8K HD TV, will drive an exponential growth of data
traffic which requires high-capacity fixed networks
75 Fixed domestic | Broadband demand
* 1 Exabyte = 1 billion gigabytes
Source: Analysys Mason Research, TI, press search
Drivers for traffic increase include:
– Connected/smart TV adoption and new video formats
– Fifth generation Wi-Fi with >1.3Gbit/s transmission
contributing to increasing mobile off-load
– SME digitalisation / take-up cloud solutions
27.9
3.73.12.7
Exa
byte
*
+23%
+41%
2018 2017
22.2
2016
16.6
2015
11.7
2014
7.9
2013
5.1
2012 2011 2010
Total annual data traffic forecast for Italy
There is a requirement for upgrades of networks to FTTC/H as legacy fixed networks (DSL) and mobile networks do not have
sufficient capacity to provide the expected capacity
1-8 1-10 1-10 1-10 6-8 8-12
20-30
80-120

39166-114 | CONFIDENTIAL
Findim Group
TI‟s broadband offers are consistently priced at a premium compared to its
competitors across all its product offerings
76 Fixed domestic | Broadband demand
0 5 10 15 20 25 30 35 40 45 50 55
20
10
100
110
30
0
Sp
ee
d (
Mb
ps)
Total cost of ownership based on 24 months (EUR/month)
Wind TI Fastweb Vodafone
Double play total cost of ownership (24 months, EUR/month)
Fastweb offers 100Mbit/s at no
premium in the first year, and at
additional EUR5/month thereafter.
Alternatively, customers can be
downgraded to the best available
speed
Wind and Vodafone offer 20-
30Mbit/s as headline speeds,
but actual speed depends on
network availability
Available in cities where FTTH is deployed*
`
TI prices its products at a
premium compared to
competitors in each
segment
Vodafone still offers its
lower-tier products under
the brand TeleTu
*For Vodafone and TI where 100Mbit/s is not available the 30Mbit/s is offered at the same price
Note: tariffs shown include VAT
Source: Analysys Mason based on operators‟ institutional websites (March 2014)

39166-114 | CONFIDENTIAL
Findim Group
The premiums charged for higher speeds and TV services vary a great deal;
in France, where competition is high, the premiums are negligible
77 Fixed domestic | Broadband demand
343232
Total
including
TV
FTTH
1000
Mbit/s
+ IPTV
2
Total FTTH
1000
Mbit/s
0
VDSL
100
Mbit/s
0
ADSL
24 Mbit/s
SFR (EUR/month)
KPN (EUR/month) Belgacom (EUR /month)
Iliad (EUR/month)
12
60
48
Total including TV VDSL
30 Mbit/s + IPTV
VDSL
30 Mbit/s
Swisscom (EUR/month)
3
29
26
30
Total
including
TV
FTTH
1000
Mbit/s
+ IPTV
Total FTTH
1000
Mbit/s
3
VDSL
50
Mbit/s
0
ADSL
24
Mbit/s
114
77
FTTH
30Mbit/s
+ IPTV
22
ADSL
20Mbit/s
20%
Total
including TV
FTTH
100Mbit/s
+ IPTV
15
919
60
4141
Total
including
TV
FTTH
100
Mbit/s
+ IPTV
Total FTTH
100
Mbit/s
9
VDSL
80
Mbit/s
VDSL
40 Mbit/s
▪ In France, Iliad and SFR offer DSL
and FTTx products at the same price
(or even discounted for FTTH) and
no high premium is charged for
better speeds or TV add-on
– this is largely due to the intense
competition in the French market
▪ Swisscom, KPN and Belgacom
charge customers a premium for
each incremental upgrade
– network, speed and TV
Note: tariffs shown include VAT and refer to the total costs of ownership (24 months, EUR/month)
Source: Analysys Mason Research

39166-114 | CONFIDENTIAL
Findim Group
Note: tariffs shown include VAT
Source: Analysys Mason based on TI
Total cost of ownership (24 months)
TI should reduce the premium it charges for UBB products relative to
entry level to favour upsell
78 Fixed domestic | Broadband demand
14.0
37.0
Tutto
7 Mbit/s
0% +38%
Tuttofibra Plus
100 Mega
(Milan only)
50.9
14.0
Tuttofibra 30
Mega
(in covered
cities and Milan)
50.9
Superinternet
20 Mbit/s
41.8
1.0
Superinternet
10 Mbit/s
40.8
3.9
EUR5 premium for 20Mbit/s
▪ Tutto 7Mbit/s: DSL entry-level offer is
expensive given speed offered
– Belgacom and KPN offer
30–40Mbit/s as entry level
– Fastweb offers 100Mbit/s at
EUR37.5/month (which includes voice
allowance)
▪ Superinternet 20Mbit/s: premium price is
higher than Italian and EU peers
▪ Tuttofibra 30Mbit/s: premium over DSL
basic offer does not incentivise take-up
– Swisscom charges a 20% premium to
upgrade from 20 to 100Mbit/s including
IPTV
▪ Tuttofibra Plus 100Mbit/s: available only in
Milan
– priced at no premium over the Tuttofibra
30Mbit/s offer in Milan where
infrastructure competition is in place
– Iliad, SFR and KPN offers no premium
between DSL, FTTC and FTTH
DSL FTTC FTTH
+22%

39166-114 | CONFIDENTIAL
Findim Group
A full proprietary pay-TV or triple-play offering does not seem appropriate
in the Italian market context
79 Fixed domestic | Broadband demand
* Includes the amortised cost for platform development and set-top boxes
Source: Analysys Mason
Triple-play
gross margin
Content costs* IPTV add-on Dual-play
direct costs
Dual-play offer
Negative contribution to
operators‟ margins
▪ The development of a proprietary IPTV
platform is costly and it is usually used as
a loss leader to neutralise cable offerings
and/or an aggressive new entrant
– there is no cable competition in Italy
– an aggressive new entrant in the
broadband market seem unlikely
▪ TI therefore has the opportunity to explore
new cost-effective ways to provide content
to its own users
– this can be done through e.g.
partnerships with content and OTT
providers
ILLUSTRATIVE Dual vs. triple-play margins
Triple-play gross margin is
smaller than for dual-play due
to the high content costs
Willingness to
pay for content
Needed to increase
the appeal of offer,
upsell and reduce
churn
Du
al-p
lay g
ross m
arg
in

39166-114 | CONFIDENTIAL
Findim Group
TI recently signed an agreement with Sky, but this appears to be limited
and has to be explored further in the future
80 Fixed domestic | Broadband demand
Telecom operator Content provider Collaboration agreement highlights
Fastweb (FW) Sky
Sky is looking to expand its
customer base which seems
to have reached a plateau
-20/-30%
Bundled offer Standalone offers
▪The partnership allows Fastweb‟s and Sky‟s
customers to benefit from an enriched
experience at a discounted price
▪Sky content is made available through the
DTH platform with VoD features accessible
through Fastweb‟s broadband service
Fastweb and Sky offer comparison
FW
Sky
FW
Sky
`
Source: Analysys Mason on operators‟ institutional websites
▪ In November 2013, TI struck an agreement for
Sky‟s Winter Olympics content available to TI
subscribers on mobile devices (~30 000
activations) with plans on making more content
available in the future
▪Looking forward, TI has announced that it will
partner with Sky to explore the possibility of
delivering content over the TI‟s fixed
broadband network
Switching costs
and reduce churn
Offer appeal
TI Sky

39166-114 | CONFIDENTIAL
Findim Group
TI should take advantage of exclusive collaborations to drive the appeal of
its UBB proposition
▪ TI should enter into retail partnership agreements with international and/or domestic OTT players
▪ TI should leverage OTT endorsement and co-marketing to drive appeal of its FTTx offer (as opposed to its traditional DSL offer)
▪ Its aim should be to increase broadband subscriber take-up and improve retention rather than monetisation of the add-on services
– partnership does not need to drive a direct increase in revenues for TI: add-ons can be sold at very low or zero margin for TI
▪ Retail-level partnerships with OTT providers could also allow TI to benefit from commercial network-access agreements (such as
the ones entered into by Netflix in the USA) and move towards a two-sided business model
81 Fixed domestic | Broadband demand
International players (e.g. Netflix, Hulu, Google, Amazon, Apple)
Domestic players (e.g. Sky, Mediaset, Rai, Chili)
TI
OTT players gain
path to market
TI increases
appeal of
broadband offers
Example of strategic collaborations

39166-114 | CONFIDENTIAL
Findim Group
Contents
82
Executive summary
The context
Fixed domestic
Mobile domestic
TIM Brasil
New services
Company structure
Quantification of targets
Network
Broadband demand
Voice demand

39166-114 | CONFIDENTIAL
Findim Group
Evolution of incumbent fixed access lines in EU5 (2003=100%)
83 Fixed domestic | Voice demand
Fixed lines have been in decline over the past decade in Italy and
elsewhere, although TI has lost more lines than other EU5 incumbents
49%52%
56%60%
66%
80%84%
98%
100%
69%71%
74%
80%
85%
92%96%96%98%
100%
2003 2004 2005 2006 2007 2008 2009 2010 2011 2012 2013
58%
74%
92%
TF FT BT DT TI
▪ Fixed line (voice-only and bundled)
decline is an inevitable trend for
incumbent operators
▪ Among the factors contributing to
decline in fixed lines are
– competition from cable operators
– FMS
– OTT/VoIP solutions
– Intl. crisis (e.g. disconnecting
second/holidays homes)
▪ Operators‟ focus on convergent
offers (e.g. Telefónica Fusion) helps
them containing such declining trend
Source: Analysys Mason Research

39166-114 | CONFIDENTIAL
Findim Group
Incumbent operators in various countries are addressing „unavoidable‟
loss of fixed lines
84 Fixed domestic | Voice demand
-0.8-0.7-0.7-0.7
0.00.20.2
0.3
-0.6-0.4
0.8
2013 2012 2010
1.5
2009 2011
-0.4
OLO TI Net in/out
Source: Analysys Mason Research, AGCOM
Italy‟s fixed lines net additions (million) EU5 incumbents fixed lines net additions (million)
0.2
-0.6-0.8
-1.1-1.2
-1.6
-2.0
-0.9-1.1
2012
-0.7
2009 2010 2011 2013
TF DT BT FT
▪ TI‟s lost fixed lines are almost all disconnections,
rather than customers churning to other operators
▪ TI can attempt to contain this trend by developing
convergent products (e.g. TIM SMART)
▪ EU5 incumbents have protected themselves against
fixed lines loss more effectively, in part by developing
strong convergent propositions (e.g. Fusion
Telefonica)

39166-114 | CONFIDENTIAL
Findim Group
Fixed-mobile substitution (FMS) is a recurring trend in the industry, but
operators can minimise the impact by implementing tailored initiatives
85 Fixed domestic | Voice demand
Voice-only
subscriber
Broadband
subscriber
▪ Price
▪ Nomadic use of
mobile
▪ Scarce value
added
▪ Second/holiday
homes
▪ Elderly people
▪ Line rental
▪ Fixed voice traffic
▪ Wholesale
revenues (if w/s
line)
▪ Scarce utilisation
at home
▪ No use of
content (e.g. light
web browsing,
mail)
▪ Scarce value
added
▪ Families without
teenagers
▪ Students
▪ Workers
(commuting or
living in a city for
working week-
only)
▪ Line rental
▪ Fixed voice traffic
▪ Wholesale
revenues (if w/s
line)
▪ Fixed-mobile
convergent offers
(compliant to
regulation and
margin squeeze
tests)
▪ Mobile win-back
▪ FWA offers
▪ Stimulate the
attractiveness of
/willingness to
pay for content
▪ Complimentary/
bundling offers
Driver for FMS Profile TI‟s loss Initiatives

39166-114 | CONFIDENTIAL
Findim Group
TIM Smart is a first attempt at a convergent offer although a careful
consideration on ARPU „value destruction‟ should be considered
86
Prescribed bundle: subscribers sign up to a bundle that is defined by the operator in order to benefit
from any savings or additional features. Loose bundle: subscribers get a discount and/or some other
benefit for combining fixed and mobile services from the same operator, but billing is not unified
Source: Operators‟ institutional websites
Fixed domestic | Voice demand
FMC offers Description Offer Implied discount
TIM Smart
(prescribed bundle)
Fixed-mobile offer targeted at families who
internet access on the move and at home
Triple-play offer: fixed + mobile voice +
Internet
Up to 4 SIMs per fixed line activated at a
discounted fee
Fixed: unlimited ADSL (7Mbit/s), unlimited
calls to fixed/mobile lines (only call set-up fee
charged)
Mobile: 400 min/month to national
fixed/mobile lines, 400 SMS to all national
mobile operators, 2GB/month
Telefonica Fusión
(prescribed bundle)
Targeted at households and who want internet
access on the move and at home
Triple-play offer: fixed + mobile voice +
Internet with possibility to add TV content
Single invoice and possibility to add additional
SIM for extra fee
Fixed: ADSL 10Mbit/s, unlimited calls to fixed,
550 min/month to mobile lines
Mobile: unlimited calls, unlimited SMS,
1GB/month 4G Internet traffic
Telekom Vorteil
(loose bundle)
Targeted to families (up to 4 SIMs) and
individuals who want internet access on the
move and at home
Single invoice
Subscribers combine specified fixed and
mobile services to get some services for free:
▪ free calls between family members on one
fixed line and up to four mobiles (worth
EUR4.95 per month)
▪ multi-device security package (worth
EUR3.95 per month)
-25/-30%
F
M
F+M
-30/-35%
F
M
F+M
0%
F F
M M
Discounts in the form of additional
free packages
(same price for additional value)
Reactive move into a rapidly
deteriorating market Discounts vary by technology
(DSL showed above)

39166-114 | CONFIDENTIAL
Findim Group
Contents
87
Executive summary
The context
Fixed domestic
Mobile domestic
TIM Brasil
New services
Company structure
Indicative implementation guidelines
Annex

39166-114 | CONFIDENTIAL
Findim Group
TI needs to reposition itself in the domestic mobile market to better
monetise its network
88
IDENTIFIED PROBLEMS PROPOSED ACTIONS
Mobile domestic
▪ TIM has positioned 4G as a premium service,
but does not seem to provide customers with
a strong incentive to migrate to higher traffic
bundles
▪ Enrich the basket of content and applications
available to customers, potentially by means
of partnerships, and improve effectiveness of
marketing
▪ TIM is the leader in terms of subscriber
market share but is mainly attracting lower-
value subscribers within each market
segment
▪ Accelerate smartphone penetration in the
customer base
▪ Prioritise monetisation/value creation and not
defence of (subscriber) market share
▪ TIM has a strong position in terms of network
quality and coverage, for both existing (2G
and 3G) and 4G networks, but so far has not
been able to monetise its network
▪ Re-balance investments vs. fixed, avoiding
overspending on mobile network by means of
a closer alignment between network roll-out
and marketing and sales
▪ More than 60% of the European mobile
market has been consolidated into four major
groups; TI/TIM is one of the largest stand-
alone players
▪ TIM can adopt a partnership model in order to
gain some of the benefits of consolidation

39166-114 | CONFIDENTIAL
Findim Group
TIM should strive to fully monetise its mobile network by improving its
content offering and especially the way these are marketed to subscribers
89
TIM has invested heavily in its mobile network,
which now is the second best in the country
TIM has not been able to fully monetise its
investments to date
Mobile domestic
* TIM has been compared against the performance of Vodafone, Wind and H3G
Source: Analysys Mason
Stimulate upselling to higher-volume traffic bundles by enriching
the basket of content and applications available to customers
(potentially by means of partnerships) and improve the
effectiveness with which these services are marketed
ARPU
(100% = best) 82.2%
Data as %
of revenue 37.5%
Market share
of postpaid 40.3%
Market share
of businesses 60.5%
Invest to improve coverage and capacity of the 3G network, which
will continue to play a key role in the short to medium term, and re-
balance capex between fixed and mobile to tactically exploit 4G
leadership
3G coverage 88.4%
4G coverage 50.0%
Voice call
attempts
success rate
99.6%
Average 3G
d/l speed
(100% = best)
88.9%
TIM‟s rank*
4
1
1
3
▪ TIM has achieved a competitive edge in terms of 4G coverage
although the 3G network lags behind competitors both in
terms of coverage and average download speed
▪ TIM could better exploit its strong foothold in traditionally high-
value segments
TIM Best
TIM = Best
TIM Best
TIM = Best
TIM = Best
TIM Best
TIM Best
TIM‟s rank*
3
3
1
1
TIM = Best
Market average

39166-114 | CONFIDENTIAL
Findim Group
Aggressive price competition has destroyed value in the Italian mobile
market and resulted in the lowest market ARPU in EU5
90
Benchmark of ARPU and mobile active subscribers penetration in Europe
Mobile domestic
Source: Analysys Mason Research
Note1. Rest of Western Europe (RWE) includes: Austria, Belgium, Denmark, Finland, Greece, Ireland, Netherlands, Norway, Portugal, Sweden and Switzerland
Note2. Penetration has been calculated with active SIMs only (i.e. SIMs that have been used in the last three months), excluding M2M and including wholesale SIMs
Note3. UK‟s ARPU has been cleaned from currencies fluctuation by applying a fixed GBP:EUR exchange rate
10
15
20
25
30
35
40
85% 90% 95% 100% 105% 110% 115% 120% 125% 130% 135% 140% 145% 150%
‟11 ‟10
‟09 Q3 ‟13
‟12
‟11
‟10 ‟09
Active subscribers penetration (%)
Q3 ‟13
‟12
‟11 ‟10 ‟09 Q3 ‟13
‟12 ‟11
‟10
‟09
Q3 ‟13
‟12
‟11
‟10
Q3 ‟13 ‟12
‟11 ‟10
‟09
AR
PU
(E
UR
/ s
ubs / m
onth
)
‟12 Q3 ‟13
‟09
-10.1%
-1.3%
-3.0%
-7.0%
-8.8%
-4.8%
CAGR ‟09-‟13
Re
ven
ue
-11.7%
-3.4%
-5.5%
-10.7%
-9.8%
-4.7%
CAGR ‟09-‟13
AR
PU
▪ Significant value destruction due to
price war initiated by H3G
▪ The entry of Free in Q1 2012
significantly increased competition
▪ Severely hit by the crisis (reduction in
revenue, ARPU and penetration)
▪ Better retail revenue trend (i.e. excl.
MTR cuts) due to better economic
situation and some market
consolidation

39166-114 | CONFIDENTIAL
Findim Group
TIM remains the largest mobile operator in terms of subscriber market
share but its position is not reflected in a revenue premium
91
Market share of revenue (incl. interconnection) Market share of active subscribers
Mobile domestic
Source: Analysys Mason Research
36.1%
0%
5%
10%
15%
20%
25%
30%
35%
40%
45%
50%
Q3 2013 2012
37.0%
2011
37.4%
2010
36.8%
2009
37.6%
34.3%34.4%34.9%36.1%
0%
5%
10%
15%
20%
25%
30%
35%
40%
45%
50%
2009 2010 2011 2012 2013
38.4%
H3G Wind Vodafone TIM
1 2

39166-114 | CONFIDENTIAL
Findim Group
TIM has defended its domestic subscriber market share at the expense of
ARPU which (unlike most peer incumbents) is now below market average
92
Mobile market share of major EU5 fixed incumbents based on active subscribers
Mobile domestic
Source: Analysys Mason Research, GSMA Intelligence, TIM
25%
30%
35%
40%
45%
50%
25% 30% 35% 40% 45% 50%
‟11 ‟12
‟10
‟13
‟13 ‟12 ‟11
‟10
‟09
‟12
‟11
‟10
‟09
‟13
‟10 ‟11 ‟12 ‟13 ‟09
Active subscribers market share (%)
‟09
Re
ve
nu
e m
ark
et sh
are
(%
)
Above the grey line the operators are creating more value per
customer than the average of their respective markets
Below the grey line the operators are creating less value per
customer than the average of their respective markets
Deutsche Telekom
TIM
Telefonica
Orange
For each 1 p.p. in subscriber
market share, TI lost 2.2 p.p. in
revenue market share between
2009 and 2013
Unlike TIM, Orange and Telefonica
have successfully increased their
ARPU premium in markets that have
seen similar deterioration to Italy
Note1: BT has not been included as it is a fixed-only operator
Note2 :Wholesale SIMs included, M2M SIMs excluded

39166-114 | CONFIDENTIAL
Findim Group
Pre
pa
id/P
os
tpa
id
Bu
sin
es
s/R
esid
en
tial
TIM 29.8%
Vodafone 32.0%
Wind 27.1%
H3G 11.1%
TIM 60.5%
Vodafone 26.6%
Wind 6.8%
H3G 6.0%
TIM‟s ARPU does not reflect its subscriber market share leadership in the
postpaid and business segments
93
Market share of prepaid
Mobile domestic
Note: Due to different sources being used, the residential/business split is based on registered SIMs,
whereas the prepaid/ postpaid split is based on active SIMs
Source: Analysys Mason Research, AGCOM quarterly reports
Market split Market share of postpaid
Residential
SIM
Business
SIM
Prepaid
SIM
Postpaid
SIM
Market share of residential Market split Market share of business
76.7%23.3%
Ma
rke
t se
gm
en
ts w
ith
hig
he
r A
RP
U
85.8%14.2%
TIM 40.3%
Vodafone 26.8%
Wind 8.0%
H3G 24.9%
TIM 34.8%
Vodafone 30.9%
Wind 29.2%
H3G 5.0%
Q3
2013 Q3
2013
Q3
2013
Q3
2013

39166-114 | CONFIDENTIAL
Findim Group
TIM has the third lowest ARPU among Italian MNOs in both prepaid and
postpaid segments, with an increasing discount over market ARPU
94
ARPU blended
Mobile domestic
Note: ARPU has been calculated using active SIMs only
Source: Analysys Mason on Analysys Mason Research
13.2
17.619.8
0
5
10
15
20
25
30
35
40
45
50
55
2009 2010 2011 2012 2013
EU
R/s
ubscrib
er/
mo
nth
15.7
20.4
27.5
31.8
37.1
0
5
10
15
20
25
30
35
40
45
50
55
2010 2011
40.0
2009 2012
22.3
Q3 2013
ARPU postpaid ARPU prepaid
H3G Wind Vodafone TIM
10.1
15.015.9
0
5
10
15
20
25
30
35
40
45
50
55
Q3 2013 2012
12.1
2011
13.4
2010 2009
TIM -10.4%
Vodafone -10.2%
Wind -8.3%
H3G -13.5%
CAGR ‟09-‟13
TIM -13.4%
Vodafone -10.8%
Wind -10.6%
H3G -11.3%
CAGR ‟09-‟13
TIM -10.2%
Vodafone -8.7%
Wind -8.1%
H3G -8.8%
CAGR ‟09-‟13
-3% -6% -4% -7% -7% -9%
TIM discount over market ARPU has increased over time in both the prepaid and the postpaid segment
ARPU decline
started showing a
slowdown in the
last three quarters
3
3
3

39166-114 | CONFIDENTIAL
Findim Group
Italy is still a highly prepaid market compared to EU5, with a lower
smartphone penetration and therefore lower data share of revenue
95
Share of prepaid contracts
Mobile domestic
Source: Analysys Mason Research
SIM split by device in use (2013)
▪ The historically high proportion of
prepaid subscribers in Italy is mainly
due to the extra monthly tax of
EUR5.16 (EUR12.91 for corporates
clients) applied to postpaid plans.
This is unique in Europe, and
operators should lobby for its removal
38%
77%
49%
31%
56%
52%
82%
32%
19%
41%
ES
FR
UK
DE
IT
* Mobile broadband (MBB) is defined
as all mobile broadband (2G+) PC,
laptop, netbook or tablet connections
via a USB modem or datacard.
4%
5%
6%
5%
11%IT 58% 32%
ES 48% 48%
FR 39% 55%
UK 39% 55%
DE 53% 41%
Mobile broadband*
Smartphones
Basic handsets
Share of data revenue
46%
19%
25%
32%
28%
25%
32%
46%
52%
41%
FR
UK
IT
DE
ES
2009 2013 2009 2013
▪ A low smartphone penetration
inevitably leads to data contributing a
lower share of revenue (i.e. MNOs
are unable to fully exploit the growing
demand for data services)
▪ Italy has the lowest smartphone
penetration in EU5

39166-114 | CONFIDENTIAL
Findim Group
TIM has the lowest share of 3G/4G subscribers in the market and is
struggling to extract value from data services
96
Data as percentage of revenue Share of 3G-/4G-enabled SIMs
Mobile domestic
Source: GSMA Intelligence, Analysys Mason Research
30%
25%
0%
5%
10%
15%
20%
25%
30%
35%
40%
45%
50%
55%
% o
f re
ve
nu
e
Q3 2013
37%
2012
33%
2011 2010
28%
2009
Market H3G Wind Vodafone TIM
23%
59%
36%
100%
27%
36%
100%
59%
63%
42%
-17% -13%
Market
H3G
Wind
Vodafone
TIM
2013 2009
TIM should look to increase smartphone penetration and take-up of data services across its subscriber base
4
3
H3G has no
2G network

39166-114 | CONFIDENTIAL
Findim Group
Italy has the highest MBB penetration in EU5, driven by intense price
competition
97
Tablet penetration of population (2013) Datacard penetration of population (2013)
Mobile domestic
Source: Analysys Mason Research, Euromonitor, AGCOM quarterly reports, press release
0%
5%
10%
15%
ES
1.1%
FR
3.4%
UK
4.2%
DE
4.2%
IT
11.5%
0%
5%
10%
15%
ES
3.0%
FR
2.3%
UK
3.1%
DE
2.3%
IT
4.2%
ARPU from MBB (datacards + tablets) ▪ MBB has been very successful in Italy, due to:
– the limited UBB infrastructure and low fixed broadband
usage, which have led to a certain degree of fixed-
mobile substitution
– price competition, led by mobile-only operator H3G,
has brought MBB ARPU to the lowest of the EU5
0
5
10
15
20
25
30
35
40
9% 15% 14% 13% 12% 10% 11% 16% 8% 7% 6% 5% 4% 3%
MBB penetration (% population)
‟13 ‟12 ‟11
‟13 ‟12
MB
B A
RP
U (
EU
R /
mo
nth
)
‟13 ‟12 ‟11
‟13
‟11
‟11
‟13 ‟12 ‟11
‟12
23% 17% 7% 6% 10%
Share of total tablets with an active mobile connection
Notes:
Datacards include all mobile broadband (3G+) PC, laptop, netbook
connections via a USB modem or datacard. Excludes tablets and e-readers
Tablets include e-readers, excluding PC, laptop and netbooks

39166-114 | CONFIDENTIAL
Findim Group
Last reported number of sites in 2012 (thousand) Population coverage at the end of 2013
TIM has not managed to monetise what overall seems to be the second
best network in the market
98 Mobile domestic
Source: Analysys Mason, AGCOM, Telegeography, GSMA Intelligence, operators‟ data, press release
QoS indicators for voice and data (3G) services (H1 2013) 3G average download and upload speed in 2013 (Mbit/s)
4G 3G
94.0%
2G 4G 3G
95.7%
2G
99.8%
4G
18.0%
3G
92.0%
2G
99.5%
4G
50.0%
3G
88.4%
2G
99.8%
TIM Vodafone Wind H3G
~14.0
4G 3G
13.6
4G 3G
~9.5
2G 4G 3G
11.9
2G
13.6
4G 3G
~15.0
2G 2G
16.8
TIM Vodafone Wind H3G N
o 2
G
No 2
G
6.126.51
4.58
7.096.30
1.541.431.141.781.79
0
2
4
6
8
10
Market H3G Wind Vodafone TIM N
/A
N/A
N/A
N/A
Upload Download
97%
98%
99%
100%99.4%
99.2%
Vodafone
99.5% 99.3%
TIM
99.6% 99.9%
99.2%
Wind H3G
98.0%
Voice call attempt success Data package delivery success rate
1 4 1
3
1
1 1
1 2

39166-114 | CONFIDENTIAL
Findim Group
▪ TIM‟s 4G network covered c.50% of population at the end of
2013
– TIM management‟s plan is to reach 70% by 2015 and 80%
by 2016
– Vodafone, TIM‟s main competitor, is well behind, with
coverage of c. 20% of the population
TIM has achieved a clear position of leadership in terms of 4G network
coverage but must now tactically focus on monetising its 3G/4G networks
99 Mobile domestic
TIM only
TIM + Vodafone
TIM + Vodafone + H3G
Vodafone only
4G coverage (10 March 2014)
TI must rebalance investments in fixed and mobile
networks, favouring the former for the next three years
Rather than further expanding 4G coverage (already
significantly beyond competition), TIM should focus
mobile investment on improving the 3G network (which
we believe will continue to play a major role in the short
to medium term) and maximise value extraction from 4G
network to exploit the 4G lead it has achieved
Note: map shows municipalities covered by each operator (actual area covered
may be smaller than the overall municipality territory)
Source: Analysys Mason, operators‟ websites

39166-114 | CONFIDENTIAL
Findim Group
In other markets, mobile operators have been able to exploit 4G services
to increase ARPU, a goal so far unachieved by Italian MNOs
100
ARPU evolution since the launch of 4G
Mobile domestic
Source: Analysys Mason on GSMA Intelligence
0.80
0.84
0.88
0.92
0.96
1.00
1.04
1.08
1.12
1.16
1.20
-4 -3 -2 -1 0 1 2 3 4 5 6 7 8 9 10 11 12 13 14 15 16 17 18
Norm
alis
ed A
RP
U (
Qua
rter
of la
un
ch
= 1
)
Quarters since 4G launch
SK Telecom (KR)
KT (KR)
Vodafone (DE)
Telia (SE)
EE (UK)
AT&T (USA)
Verizon (USA) Some operators managed to increase their
ARPU following 4G launch The 4G advantage has faded for
many MNOs because of competitive
price pressure in the medium term
However, some operators appear to
have sustained their higher ARPU

39166-114 | CONFIDENTIAL
Findim Group
TIM‟s marketing strategy for 4G smartphone plans seems to focus solely
on speed and does not promote upselling through content
101 Mobile domestic
* TIM offer for existing clients (either fixed or mobile);
**VDF (RELAX) offer is limited to clients with a RELAX plan
Source: Analysys Mason on operators‟ data and Analysys Mason Research
▪ Tablets and dongles: TIM‟s 4G plans - like Vodafone‟s -
are priced at a premium over 3G plans but combine the
higher speed of 4G with a larger data traffic allowance
– the new pricing schemes should aim to incentivise
upselling and cross-selling
▪ Smartphones: TIM prices 4G as an option on all 3G plans
that reflects increased speed but no extra data allowance;
furthermore TIM does not explicitly promote content
services to 4G smartphone users
– We believe this approach to be too focused on speed
and so does not stimulate additional consumption,
hindering monetisation
3G
4G
Monthly tariffs of data-only plans for dongles and tablets Smartphones plans: 4G premium vs 3G
0
5
10
15
20
25
30
35
40
0 5 10 15 20 25 30 35 40
Price (
EU
R/m
onth
)
Data allowance (GB/month)
H3G
H3G
H3G
H3G
VDF**
VDF
TIM * TIM
VDF**
VDF
TIM * TIM
Operator 4G premium
(EUR/month)
Additional traffic
(GB/month)
TIM EUR5 0GB
Vodafone EUR10 2GB
H3G EUR1 0GB
Note: Table above applies to both prepaid and postpaid plans
Note: Wind has not launched 4G services at the time of writing
4G included
by default in
top-tier
postpaid
plan EUR1
premium
TIM:
EUR10
premium
TIM should be advertising content and applications more effectively and directly to its mobile users in order to incentivise upselling

39166-114 | CONFIDENTIAL
Findim Group
TIM appears to lag behind EU5 peers in terms of content breadth and
applications offered, developed mostly in-house rather than with partners
102 Mobile domestic
Note. The table includes a non-exhaustive selection of most evidently marketed content/applications
Source: Analysys Mason
Operator ICT Content
video
Content
music
Other (selection) Voice and
messaging
M2M, verticals
(selection)
Assess-
ment
Vodafone
• Cloud (5GB free,
EUR5 per month
for 1000GB)
• Football (Italy)
• Sky Sport (UK) • Spotify
• M-payments
(Vodafone Wallet)
• Press (RCS)
• Telepass (Italy)
• Voice
Message+
• Automotive
(Volkswagen, Bosch,
TomTom)
• Banking (ASB Bank)
Orange • Cloud (free) • Orange TV
• Football • Deezer
• M-payments (Orange
Cash, with Visa)
• PartyCall
(Facebook)
• Automotive (Renault)
• Energy (GDF Suez)
Deutsche
Telekom • Mobile TV • Spotify
• Gaming (with Zynga
and Rovio)
• Mobile NFC (
with Mastercard)
• Automotive (AG)
• Smart home (QIVICON)
Telefonica • mCloud • Movistar TV • Spotify • Gaming (with EA
Games) • TU Go
• Avea
• OnStar
TIM • TIM Cloud
(200GB on 4G)
• Football
• Cubovision • Cubomusic
• Cubogame
• Press (Espresso)
• NFC (Intesa Sanpaolo)
• Automotive (FIAT)
TIM is largely dependent on applications developed in-house and
has not invested sufficient effort on marketing them as an add-on to pure connectivity
Developed in-house
External partnerships

39166-114 | CONFIDENTIAL
Findim Group
TIM should look to monetise its existing 4G network by offering innovative
services to existing and new segments
103 Mobile domestic
Note: VoLTE = Voice over LTE
Source: Analysys Mason
4G-based services across target user and product segments
Consumer segment Corporate/government segment
Vo
ice
D
ata
Legend: New services and segments that
can be addressed with 4G
Enhanced mobility
applications
• Videoconferencing, tele-
presence, large file
transfers, real-time
remote access to
business apps, rich
media collaboration
3
Fully offered
Partially offered
Not offered
TIM
today
Enhanced data
• On the go (e.g. video-
streaming/download, TV, online
gaming, music and entertainment
• At home (e.g. voice on demand
(VoD), online gaming, music and
entertainment)
VoLTE + add-on features
• Add-on features for consumer
segments include rich
communication services and
messaging
• Add-on features for SMEs include
video conferencing
1
2
Wholesale solutions
• M2M/Wholesale
connectivity: remote fleet
tracking, m-health, smart home
etc.
• Utility solutions: healthcare,
education, agriculture etc.
• Pure wholesale: service
provision to VoIP provides
4

39166-114 | CONFIDENTIAL
Findim Group
We would recommend that TIM follows a partnership approach for the
deployment of video services over 3G and 4G
104
Source: Analysys Mason, Industry Inputs
Mobile domestic
Partnering with OTT video
providers such as Netflix
and Hulu
Partnering with TV channel
providers and Direct To
Home/cable pay-TV
operators to offer live TV
services
Blocking access to OTT
video, this is not a
permanent solution
„Backwards-integrating‟ by
acquiring service providers
who can be a valuable
addition to their service
portfolio and offer exclusive
content
Enhanced data 1
Developing in-house
applications that provide
video search and streaming
Offering content as a mix of
ad-supported and paid-for
content 2. Build
3. Buy 4. Block
1. Partner
Monetisation of video generates revenues through either a new stream,
more of the same data consumption or a hybrid of the two
4G Video
Strategies

39166-114 | CONFIDENTIAL
Findim Group
Given the take-up of IP messaging and VoIP, TIM should look at providing
integrated solutions to address the OTT threat and limit revenue loss
105
Source: Analysys Mason, Industry Inputs, operator websites and reports
Mobile domestic
Total Revenue Voice Revenue SMS Data Others
Illustrative share of TIM‟s revenue by segment, 2016
Loss relative to 2012
• Enhance data rev: Operators have so far been unable to neutralise
the threat from OTT services. In a 4G environment, with larger data
allowances, operators will face a greater risk of revenue loss unless
they proactively counter the threat
• New services: VoLTE + rich communication services enable
operators to offer integrated voice, video and IM services that can
offer an enhanced user experience, hence countering the OTT threat
Take-up of OTT VoIP and messaging applications in
smartphones in Italy
The enhanced user experience and aggressive pricing
of OTT players is eroding TIM‟s revenues
(although this is an industry-wide trend)...
... and this will be even more acute in a 4G environment,
unless operators are more pro-active
VoLTE + Add-ons 2
0%
10%
20%
30%
40%
50%
60%
70%
80%
2010 2011 2012 2013 2014 2015 2016 2017 2018
Pe
ne
tra
tion
of sm
art
pho
ne
s (
%)
IP messaging applications
OTT VoIP applications
Gain relative to 2012

39166-114 | CONFIDENTIAL
Findim Group
For VoLTE operators, voice, video and IM integration is a strong differentiator
as current usage of integrated services is limited to Wi-Fi/fixed networks
106 Mobile domestic
Pure mobile services allow a low level of integration across different
voice + add-on services Highly integrated service, which allows features switching
back and forth between voice and video calls
VoLTE with rich communications services integration does
not require users to sign up to an app. Service is enabled on
handset and works across operators
3G mobile operator 4G mobile operator
Low level of service integration
VoIP (e.g.Skype calls)
Voice calls
Video calling (e.g. Facetime) on 3G
VoIP with video (e.g.Skype)
Email/data
IM services on data plan (e.g. WhatsApp)
SMS
Integrated offer on-the-go and in homes/offices
HD Voice calls (higher quality, lower connection time)
HD Video calling
HD video conferencing
Media/phonebook sharing
IM services on data plan
Email/data
Add-o
ns:
IM/M
edia
Add-o
ns:
Vid
eo
Voic
e
4G networks can address the mobile opportunity for HD voice
and integrated services
4G networks can also drive usage away from Wi-Fi. A survey
of 4G users in the UK found that since using 4G, 43% of
users use fewer or no public Wi-Fi hotspots
VoLTE + Add-ons 2
High level of service integration
Services
offered on
3G, but the
experience
is sub-
optimal

39166-114 | CONFIDENTIAL
Findim Group
TIM is not yet exploiting 4G to offer mobility applications/solutions for
SMEs and enterprise customers, which Verizon is doing effectively
107
* Survey by Arthur D. Little of 256 US businesses using 4G. Survey base not exclusively Verizon-
served businesses, and includes businesses using other 4G services as well
Source: Analysys Mason, Verizon website and press releases
Mobile domestic
Verizon‟s 4G enterprise/SME plans
Verizon offers cloud-based HD
video conferencing to SME
customers
Additional features:
Multi-party video conferences
from any smartphone
Cross-platform content
collaboration across participants
Data protection and encryption
Content-sharing with
participants, including HD video
Real-time mark-up of
documents
Use of OS-native applications
Deploy real-time pointers and
sticky notes in discussions
67%
47%
39% 37%
11%
4% 3%
Incre
ase
dpro
ductivity
Cu
t C
osts
Won m
ore
bu
sin
ess
Incre
ase
dem
plo
yee
mo
tivation
Incre
ase
dcusto
mer
satisfa
ctio
n
Supp
ort
ed
ne
w w
ays o
fw
ork
ing
Oth
er
Benefits identified by US businesses using 4G*
Has 4G benefitted your organisation?
There are multiple pricing plans for businesses, depending on their
size, sector and their mobility and business requirements
Verizon also has an SME support portal, from which it recommends
applications (even third-party apps) for different business needs for
SMEs
Enhanced mobility applications 3

39166-114 | CONFIDENTIAL
Findim Group
Finally, TIM should look to monetise 4G by offering wholesale services and
enter new areas within M2M and utility services
108 Mobile domestic
Source: Analysys Mason, Verizon, AT&T, DSME
Wholesale
M2M Utility
Pure wholesale:
operator sells capacity
only; no involvement in
product development
M2M: supporting
communication between
machines, operator
creates products in-house
or supports external
developers by selling
capacity
Utility: supporting sectors
such as health and
education, operator creates
products in-house or
supports external
developers by selling
capacity
Given the better bandwidth and lower latency, 4G would allow TIM to sell additional bandwidth through wholesale services targeting
various applications, as well as directly offer new services within M2M and utility services
Wholesale solutions 4

39166-114 | CONFIDENTIAL
Findim Group
Partnering with established players in the European market could unlock
synergies, diversify risk and increase share price
109 Mobile domestic
Operational synergies
▪ Savings could be achieved by means
of
– creation of procurement clubs to
consolidate demand and apply
greater bargaining power
– Entering into international roaming
agreements could reduce overall
interconnection costs and improve
TIM‟s position amongst travellers
Increase in share value
▪ Financial markets expect consolidation
in the telecoms sector: active
participation in this process may
increase TI‟s share value
▪ A merger with other European players
(a more extreme form of partnership)
could reduce the TI‟s leverage and
cost of debt
Risk mitigation and
diversification
▪ Partnerships can reduce time to
market and implementation risks of
innovative initiatives within the
company, by sharing best practices
across the group/partners
▪ The increased geographical
diversification resulting from a
potential merger reduces market-
specific risk
– TIM would be less subject to
domestic market fluctuations
Value
creation of
partnerships

39166-114 | CONFIDENTIAL
Findim Group
TI has not participated in the consolidation of the EU mobile market, where
two thirds of subscribers are now controlled by four major groups
110 Mobile domestic
EE subscribers have been split equally between T-Mobile and Orange
Source: Analysys Mason based on TeleGeography
DE
IT
UK
FR
PL
ES
RO
NL
PT
GR
SE
CZ
AT
BE
HU
LT
LV
EE
FI
IE
LU
CH
BG HR
SI
MT
Mobile subscribers in EU27* by major group Mobile subscriber market share in the EU27*
Mobile subscriber market share in the USA
Ge
rma
ny
Ita
lyU
nite
d…
Fra
nce
Po
lan
dS
pain
Ro
man
iaN
eth
erl
and
sP
ort
ug
al
Gre
ece
Sw
ede
nC
ze
ch
…A
ustr
iaB
elg
ium
Hu
nga
ryB
ulg
aria
Sw
itze
rla
nd
Fin
lan
dS
lova
kia
Irela
nd
Cro
atia
Lith
ua
nia
La
tvia
Slo
ven
iaE
sto
nia
Lu
xe
mbo
urg
Ma
lta
Vodafone OrangeTelefonica T-MobileOthers
Europe is tending towards a
more consolidated market
structure, in line with the
current US market
* Excluding Cyprus,
including Switzerland
SK
35%30%
17%15% 3%
Verizon
AT&T
Sprint
T-Mobile
Others
20%
14%15%
17%
34%
Vodafone
Orange
Telefonica
T-Mobile
Others
TI
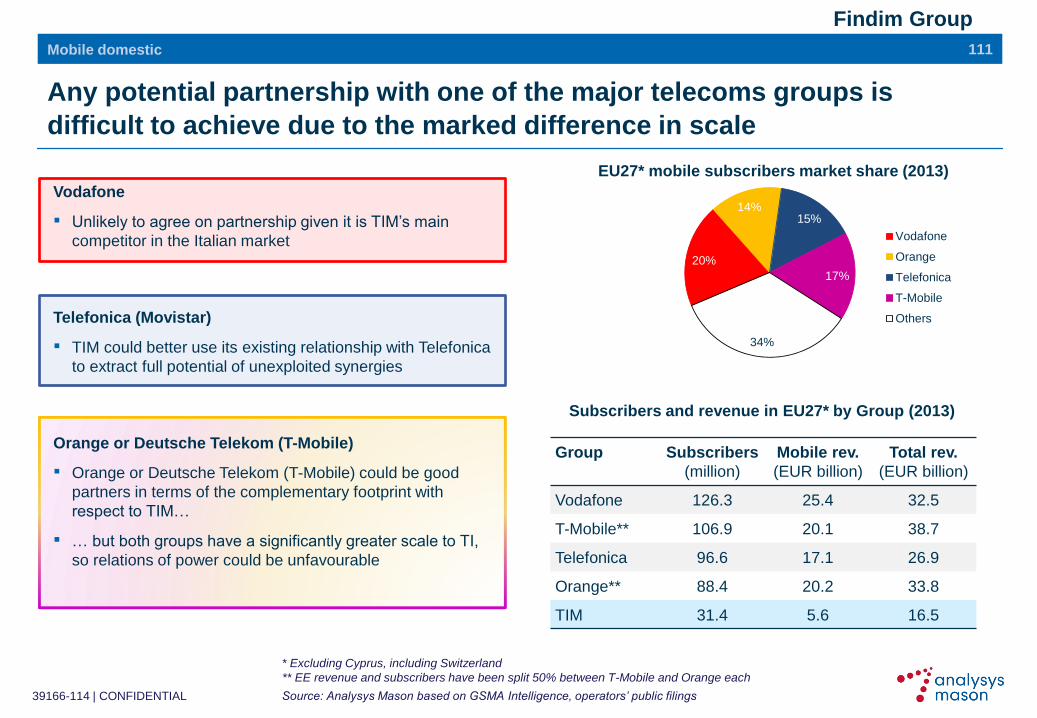
39166-114 | CONFIDENTIAL
Findim Group
Any potential partnership with one of the major telecoms groups is
difficult to achieve due to the marked difference in scale
111 Mobile domestic
* Excluding Cyprus, including Switzerland
** EE revenue and subscribers have been split 50% between T-Mobile and Orange each
Source: Analysys Mason based on GSMA Intelligence, operators‟ public filings
Vodafone
▪ Unlikely to agree on partnership given it is TIM‟s main
competitor in the Italian market
Telefonica (Movistar)
▪ TIM could better use its existing relationship with Telefonica
to extract full potential of unexploited synergies
Orange or Deutsche Telekom (T-Mobile)
▪ Orange or Deutsche Telekom (T-Mobile) could be good
partners in terms of the complementary footprint with
respect to TIM…
▪ … but both groups have a significantly greater scale to TI,
so relations of power could be unfavourable
EU27* mobile subscribers market share (2013)
Subscribers and revenue in EU27* by Group (2013)
Group Subscribers
(million)
Mobile rev.
(EUR billion)
Total rev.
(EUR billion)
Vodafone 126.3 25.4 32.5
T-Mobile** 106.9 20.1 38.7
Telefonica 96.6 17.1 26.9
Orange** 88.4 20.2 33.8
TIM 31.4 5.6 16.5
20%
14%15%
17%
34%
Vodafone
Orange
Telefonica
T-Mobile
Others

39166-114 | CONFIDENTIAL
Findim Group
Telekom Austria 12m/20m
31.4
25.1
22.5
20.3
17.4 15.0 12.7 12.4
11.1
10.7
9.8
8.3
55.0 TI
H3G
Vimpelcom
SFR (FR)
Telia
Polkomtel (PL)
KPN
Telekom Austria
Bouygues (FR)
Play (PL)
Telenor
Iliad (FR)
Others
There are opportunities for partnerships with smaller groups with
European presence or with any of the French independent operators
112 Mobile domestic
▪ Based on criteria of non-competition and size,
TIM could seek to partner
- with other large independent operators,
Bouygues, SFR, Iliad, PT, H3G or Telia Group
- with any of the smaller EU operators (e.g.
Polkomtel, P4, Tele2, Belgacom, Oi, Elisa,
Zon) IT
FR
PL
NL
PT
SE
AT
Mobile subscriber base of selected operators and second-tier groups
(EU27*/global subscribers)
Ge
rma
ny
Ita
lyU
nite
d…
Fra
nce
Po
lan
dS
pain
Ro
man
iaN
eth
erl
and
sP
ort
ug
al
Gre
ece
Sw
ede
nC
ze
ch
…A
ustr
iaB
elg
ium
Hu
nga
ryB
ulg
aria
Sw
itze
rla
nd
Fin
lan
dS
lova
kia
Irela
nd
Cro
atia
Lith
ua
nia
La
tvia
Slo
ven
iaE
sto
nia
Lu
xe
mbo
urg
Ma
lta
Vodafone OrangeTelefonica T-MobileOthers
TIM 31m/104m
H3G (EU27) 25m/74m
Vimpelcom 22m/176m
SFR 20m
Bouygues 11m
Free 8.3m
Polkomtel (group) 15m
P4 11m
Zon 3m
PT 8m/58m
KPN 13m/35m
Telenor 10m/192m
Telia 17m/84m
Tele2 8m/9m
252m
Some of these
groups have
significant operations
outside of the EU
Subscriber market share in the EU27*
* Excluding Cyprus,
including Switzerland
Source: Analysys Mason based on TeleGeography
BE Belgacom 5m
Partnerships with some
operators (or related entities)
run a greater risk of
challenges on competition
grounds. These operators
appear in grey text

39166-114 | CONFIDENTIAL
Findim Group
Contents
113
Executive summary
The context
Fixed domestic
Mobile domestic
TIM Brasil
New services
Company structure
Indicative implementation guidelines
Annex

39166-114 | CONFIDENTIAL
Findim Group
TIM Brasil requires additional network investment, an increased focus on
the postpaid and data segments and greater scale in the fixed market
▪ TIM Brasil is behind its competitors in terms
of network coverage and especially quality
114
▪ Need for further significant network
investments
IDENTIFIED PROBLEMS PROPOSED ACTIONS
TIM Brasil
▪ TIM Brasil has a strong position in the
prepaid segment but is weak in postpaid and
data markets, which are expected to see the
most significant growth
▪ Need to increase its focus on higher-value
segments (e.g. postpaid and data) and, more
generally, seek to become the primary
operator for its users
▪ TIM Brasil is the only mobile player without a
(significant) fixed access network
▪ Pursue partnership to viably increase scale
and footprint in the fixed market and
maximise opportunities in the convergent
market
TIM Brasil has room to grow organically but should nevertheless consider opportunities to extend its operations inorganically
in the short to medium term

39166-114 | CONFIDENTIAL
Findim Group
TIM Brasil needs to improve its network and shift its commercial focus in
order to be able to capture the postpaid and data opportunity
115
TIM Brasil‟s lags behind peers in both coverage and quality TIM Brasil has gained market share by focusing on prepaid
and lower-value subscribers
TIM Brasil
* TIM Brasil has been compared against the performance of Vodafone, Wind and H3G
Source: Analysys Mason
A new commercial strategy increasingly focused on quality and
value (rather than pure subscriber acquisition) is needed to
mitigate the risk of losing prepaid subscribers and to increase
ARPU
TIM Brasil‟s rank*
17% Share of
postpaid
Market share
of postpaid 19.5%
78.9% ARPU
(100% = best)
Data as
% of ARPU 22.1%
4
3
3
TIM Brasil needs to keep investing significantly to catch up in
terms of network coverage, capacity and capabilities in order to
be able to exploit the opportunity
3G coverage 70.4%
4G coverage 23.1%
95.6%
Access
data session
success rate
79.7%
Avg. speed
vs. contracted
speed
TIM Brasil‟s rank*
4
3/4
3
4
▪ Brazil is a developing telecoms market seeing rapid growth in
data services, which requires higher-quality mobile networks
▪ Planned MTR reductions will result in some users
disconnecting secondary SIMs
– this is a risk for TIM in light of its focus on low-value
prepaid customers
TIM Best
TIM Best
TIM Best
TIM Best TIM Vivo
TIM Best
TIM Best
TIM Best
Market average
N/A
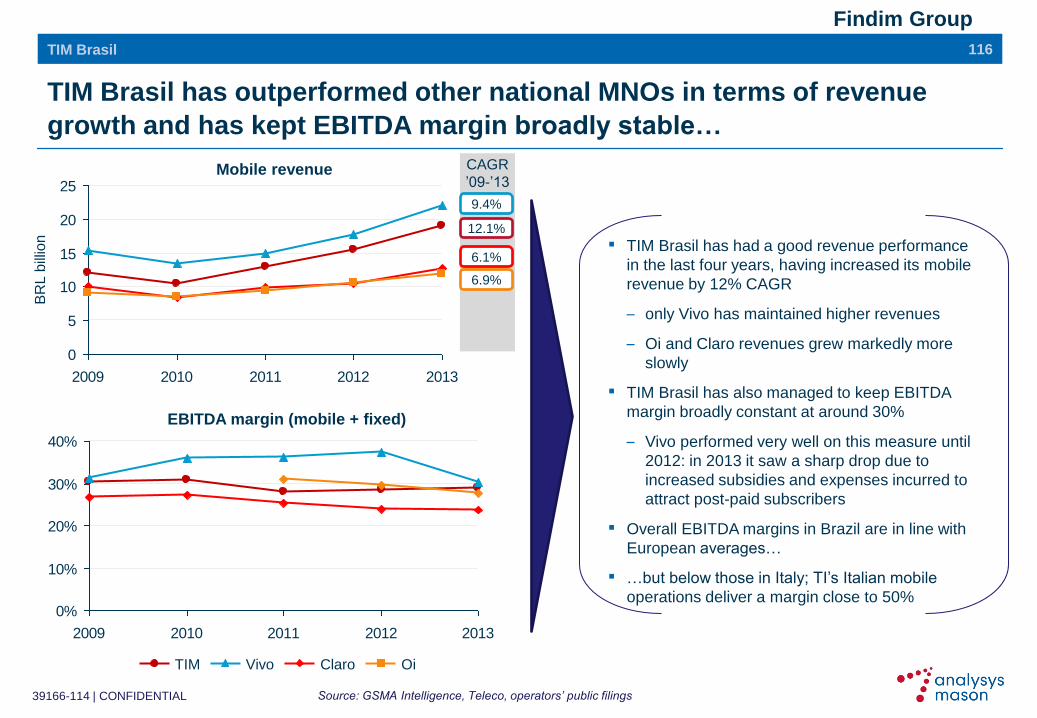
39166-114 | CONFIDENTIAL
Findim Group
TIM Brasil has outperformed other national MNOs in terms of revenue
growth and has kept EBITDA margin broadly stable…
116
EBITDA margin (mobile + fixed)
Mobile revenue
TIM Brasil
Source: GSMA Intelligence, Teleco, operators‟ public filings
0
5
10
15
20
25
2009 2010 2011 2012 2013
BR
L b
illio
n
0%
10%
20%
30%
40%
2009 2010 2011 2012 2013
Oi Claro Vivo TIM
▪ TIM Brasil has had a good revenue performance
in the last four years, having increased its mobile
revenue by 12% CAGR
– only Vivo has maintained higher revenues
– Oi and Claro revenues grew markedly more
slowly
▪ TIM Brasil has also managed to keep EBITDA
margin broadly constant at around 30%
– Vivo performed very well on this measure until
2012: in 2013 it saw a sharp drop due to
increased subsidies and expenses incurred to
attract post-paid subscribers
▪ Overall EBITDA margins in Brazil are in line with
European averages…
▪ …but below those in Italy; TI‟s Italian mobile
operations deliver a margin close to 50%
CAGR
‟09-‟13
9.4%
12.1%
6.1%
6.9%

39166-114 | CONFIDENTIAL
Findim Group
... although it seems to have focused on cashflow generation rather than
on investments
▪ In EU markets, MNOs invest capex equal to an
average of 10-15% of revenue
▪ Brazil is naturally a more capex-intensive market
than EU countries:
– it is a developing market, with a large area,
coupled with exacting coverage obligations
▪ Despite the good revenue and EBITDA
performance, TIM Brasil has invested less with
respect to peers (as a proportion of revenue)
– it seems TIM Brasil has used EBITDA
generation to increase free cashflow rather
than prioritising re-investment
▪ possibly to reduce debt
117
Source: GSMA
TIM Brasil
0%
5%
10%
15%
20%
25%
2009 2010 2011 2012 2013
% r
eve
nu
e
0%
5%
10%
15%
20%
25%
2009 2010 2011 2012 2013
(EBITDA – Capex)/total revenue
Oi Vivo TIM
Capex/Revenue (mobile + fixed)
In 2013 TIM Brasil spent EUR1.3
billion in capex, which is 38% less
than what Vivo spent (EUR2.1 billion)

39166-114 | CONFIDENTIAL
Findim Group
TIM Brasil has gained mobile market share by diluting its ARPU below
market average
118
ARPU by mobile operator Market share by mobile operator
TIM Brasil
Source: GSMA Intelligence, Teleco
▪ TIM Brasil has steadily increased its market share since
2009, overtook Claro in 2011 and is today the second
operator by market share of subscribers
▪ Mobile ARPU in the market has been falling since 2009
▪ Competition has intensified and SIMs rose from 91% to
136% of population at the end of 2013
– TIM Brasil has significantly diluted its ARPU (-11%
discount over market ARPU in 2013) in order to gain
market share
10
12
14
16
18
20
22
24
26
28
30
2009 2010 2011 2012 2013
27,1
BR
L/s
ub
scrib
er/
mo
nth
19,0 19,1
21,2
23,4
0%
5%
10%
15%
20%
25%
30%
35%
2009 2010 2011 2012 2013
26,7% 26,5% 26,0%
24,7% 23,3%
TIM Others Oi Claro Vivo Market average
CAGR
‟09-‟13
-4.2%
-9.3%
-9.1%
-2.5%

39166-114 | CONFIDENTIAL
Findim Group
TIM Brasil‟s strategy to focus on prepaid subscribers has helped it gain
market share but this now needs revision to achieve sustainable growth
119
Share of prepaid
TIM Brasil
Source: GSMA Intelligence
Market share prepaid
84.8%
85.5%85.3%84.3%
83.1%
60%
65%
70%
75%
80%
85%
90%
95%
100%
2009 2010 2011 2012 2013
28.9%
0%
5%
10%
15%
20%
25%
30%
35%
40%
2009 2010 2011 2012 2013
28.3% 27.6% 26.1%
24.1%
▪ TIM Brasil (along with Oi) has the
highest share of prepaid subscribers… ▪ TIM Brasil has kept a broadly constant
share of postpaid subscribers
▪ Vivo has focused on postpaid, where it
has strengthened its market
leadership
Market share postpaid
19.5%19.6%19.3%19.1%19.7%
0%
5%
10%
15%
20%
25%
30%
35%
40%
2009 2010 2011 2012 2013
Oi Claro Vivo TIM Market average
▪ …and has increased its market share
of prepaid significantly in the last four
years (+5p.p.) mainly at the expense
of Vivo

39166-114 | CONFIDENTIAL
Findim Group
A new focus on quality and postpaid subscribers is needed in light of the
potential disconnection of secondary SIMs following planned MTR cuts
120
MTR evolution Average SIMs per subscriber in Latin America, Q4 2013
TIM Brasil
Source: GSMA Intelligence, Teleco, Anatel
▪ The Brazilian regulator, Anatel has already reduced MTRs by
32% starting from February 2014, and will reduce them again
by 33.3% in 2015
▪ MTR reduction will allow operators to lower off-net rates,
incentivising users to consolidate to a single SIM
– this is a risk for TIM Brasil in light of its greater reliance on
low-value prepaid customers than Vivo and Claro
– but it is also an opportunity for TIM Brasil to increase ARPU
if it can move away from pure on-net price competition and
focus more on value and quality
1.88
1.84
1.81
1.731.48
1.72
1.85
1.91
1.94
1.94
2.09
2.09
2.11
2.13
EU5 avg.
Brazil
Mexico
Italy
Bolivia
Peru
Venezuela
Colombia
Paraguay
Ecuador
Costa Rica
Argentina
Chile
Uruguay
0.0
0.1
0.2
0.3
0.4
0.5
2015 2011 2010 2016 2013 2012 2014
BR
L/m
inute
Italy Brazil
56% unique
subscribers
penetration In
Brazil in 2013
EUR1cent
▪ Due to high MTRs, prices for on-net calls are significantly
lower than for off-net calls. As a consequence:
– Brazilian mobile users optimise their spend by owning
multiple SIMs, using each SIM for calls to the same
network (around 80% of all mobile calls placed in the
country are on-net)
– Brazil‟s multi-SIM usage is the highest in Latin America
and significantly higher than in Italy and the rest of Europe

39166-114 | CONFIDENTIAL
Findim Group
Share of data revenue
Brazil is a developing telecoms market that is seeing robust growth in data
services
121
Telecommunication market revenue
TIM Brasil
Source: GSMA Intelligence, Analysys Mason Research, Anatel, CETIC, TIM Brasil
▪ Brazil is a market where voice is still the predominant
service in terms of revenue
▪ However, by 2018 data services are forecast to generate
more revenue than voice
– mobile data in particular is projected to grow by 6.1%
CAGR in the period 2013-18
▪ 14% of Brazilian households could not receive broadband
services in 2012 (latest data available)
▪ Analysts project that fixed voice penetration will fall in the
short term
– this represents a significant opportunity for mobile
operators (including TIM Brasil)
0
10
20
30
40
50
60
70
80
0%
10%
20%
30%
40%
50%
60%
70%
80%
2018 2017 2016
Fix
ed lin
es (
mill
ion)
Household
s p
enetr
ation (
%)
2015 2014 2013 2012 2011 2010 2009
Broadband penetration Fixed penetration Broadband Voice
33 31 29 28 27 26 25 24 23 23
0
40
80
120
160
200
16
45
2012
115
28
14
45
2011
111
27
11
44
2010
106
25
8
42
2009
105
23
6
42 26
2016
33
24
121 126
2014
35
21
42
123
37
42 41
2015
44
31
119
2013
19
41
2017
131
40
28 BR
L b
illio
n
2018
129
38
FIX - voice MOB - data MOB - voice FIX - data
39% 51% 28%
Fixed lines and households penetration CAGR
‟13-‟18
-1.2%
-1.9%
2.9%
6.1%
1.0%

39166-114 | CONFIDENTIAL
Findim Group
Mobile services are generally more affordable than fixed and can exploit
the broadband opportunity in both urban and rural areas
122
Willingness to pay (2012, latest available data) Households without internet and reasons for not having it
(2012, latest available data)
TIM Brasil
Note: MBB = „dongles‟, datacards, tablets and eReaders
Source: Analysys Mason on CETIC and TIM Brasil‟s data
8.8
11.8
16.2
36.8
Total
households
61.3
24.5
Lack of coverage
Other
Households
NOT connected
to the internet
Households
connected
to the internet
Households
without internet
36.8
Too
expensive
71%
65%
59%
48%
39%
24%
18%
12%5%
2%1%
1%
BRL 10
BRL 20
BRL 30
BRL 40
BRL 50
BRL 70
BRL 80
BRL 100
BRL 150
BRL 200
BRL 250
> BRL 250
(40%)
(60%)
(44%)
(32%)
(24%)
More likely
addressed by
fixed
Capability of mobile SIMs in Brazil (2012)
~25% of SIMs use Internet services
Handset - non Internet
capable
55% Handset - Internet capable
but not connected
18%
Handset - with Internet
23%
MBB
3% 100% = total
market lines (SIMs)
Addressable
by mobile

39166-114 | CONFIDENTIAL
Findim Group
TIM Brasil is lagging behind in capturing revenues from data services, and
needs to change its strategy to tap into the market opportunity
123
Data revenues as % of mobile revenues Mobile subscribers by technology (2013)
TIM Brasil
Source: GSMA Intelligence, Teleco, Analysys Mason Research
▪ TIM Brasil‟s current mix of 2G/3G/4G subscribers is not
inferior to Vivo‟s and Oi‟s (but significantly worse that
Claro‟s)
▪ We have not been able to find data regarding the proportion
of 3G/4G handsets that actively buys data services (it is
common in Latin America to have an advanced device
without data plans)
▪ However, TIM Brasil is lagging behind Vivo (market leader)
in terms of data as a proportion of revenue
– likely to be due to TIM Brasil‟s customer base being
dominated by lower-spending prepaid customers
– this in turn may be in part due to TIM Brasil‟s poorer data
network
Oi
73.6%
26.2%
0.3%
Claro
38.3%
61.4%
0.3%
Vivo
62.8%
36.5%
0.7%
TIM
64.8%
34.6%
0.6%
0%
5%
10%
15%
20%
25%
30%
35%
40%
+13%
+12%
4Q13
32.4%
23.2%
3Q13
32.4%
22.5%
2Q13
32.3%
22.1%
1Q13
29.7%
21.4%
4Q12
28.6%
20.7%
3Q12
27.8%
19.4%
2Q12
27.2%
18.7%
1Q12
2G 3G 4G Vivo TIM
1 year growth

39166-114 | CONFIDENTIAL
Findim Group
TIM Brasil needs to invest more in network improvements to fill the
coverage gap with Vivo and Claro
124 TIM Brasil
Source: Analysys Mason on Teleco‟s data
88%92%91%91% 91%
75%76%
87%
70%
23%25%30%
23%
32%
0%
20%
40%
60%
80%
100%
Oi Claro Market TIM Vivo
4G 3G 2G
Population coverage (end of 2013) Number of sites by operator (end of 2013)
▪ TIM Brasil‟s 2G coverage is in line with Vivo‟s and Claro‟s
– however, TIM Brasil‟s spectrum holdings in low-frequency
bands are likely to translate into inferior indoor voice
coverage
▪ All four MNOs are subject to stringent 3G coverage
obligations (60% of municipalities with less than 30 000
inhabitants) which will require significant capex
– on 3G coverage, TIM Brasil lags well behind Vivo and
Claro
– TIM Brasil and Oi were reported to have failed to meet
the 3G coverage targets in November 2013
▪ Similarly onerous coverage obligations are attached to the
recently awarded 4G licences in the 2500MHz band
– the upcoming 700MHz auction may open an opportunity
for TIM Brasil and the whole industry to lobby for milder
coverage obligations as well as for band-agnostic
coverage obligations
– this would allow TIM Brasil use 700MHz spectrum to
reach the coverage obligations set on its 2.5GHz holding
and thereby realise significant capex savings
5,359
14,77514,50713,901
14,851
TIM Vivo Others Oi Claro
Mainly
Nextel
Highest number
of sites despite
lower coverage
is due to inferior
spectrum
holding (see
next slide)
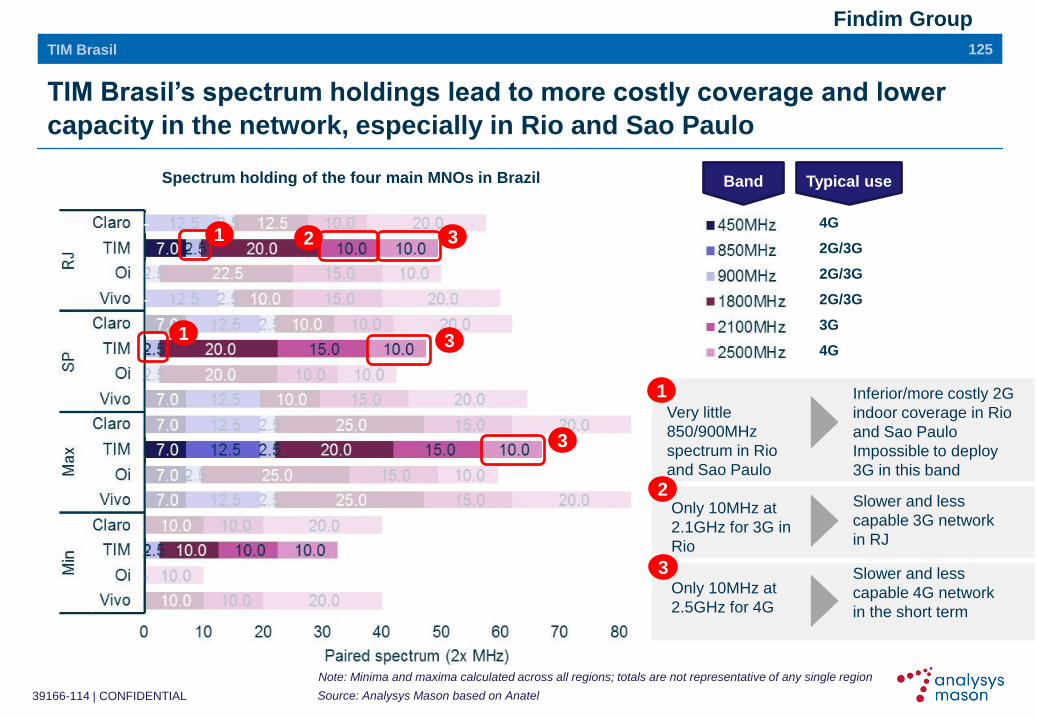
39166-114 | CONFIDENTIAL
Findim Group
TIM Brasil‟s spectrum holdings lead to more costly coverage and lower
capacity in the network, especially in Rio and Sao Paulo
125
Source: Analysys Mason based on Anatel
TIM Brasil
Spectrum holding of the four main MNOs in Brazil
4G
2G/3G
2G/3G
2G/3G
3G
4G
Note: Minima and maxima calculated across all regions; totals are not representative of any single region
1
2
3
Very little
850/900MHz
spectrum in Rio
and Sao Paulo
Only 10MHz at
2.1GHz for 3G in
Rio
Only 10MHz at
2.5GHz for 4G
Inferior/more costly 2G
indoor coverage in Rio
and Sao Paulo
Impossible to deploy
3G in this band
Slower and less
capable 3G network
in RJ
Slower and less
capable 4G network
in the short term
Typical use Band
1
1
2 3
3
3

39166-114 | CONFIDENTIAL
Findim Group
TIM Brasil had severe problems with network quality in 2012, which it is
addressing with an investment plan
126
“Plano de Melhorias”: BRL9.52 billion in 2012-14
TIM Brasil
Source: Anatel, TIM Brasil
Network expansion
Roll-out of additional sites
and fibre backhaul to
increase capacity of the
existing network
Network resilience
Reduction in fault rate
Network optimisation
Network upgrade aimed at
improving the quality of
service
Customer care channels
New customer care
channels in place
Results achieved by Dec 2013
KPI Achievement
2G antennas 1138 additional antennas
3G antennas 2597 additional antennas
Optic fibre Reached 46 959km
Modernisation 63% of equipment has been updated
▪ Brazilian mobile operators have consistently faced
problems with network quality (high dropped call rates
and poor call completion rates)
▪ There have also been high levels of complaints to
Anatel in the areas of billing, call centre services and
the time taken to solve problems
– as a result, Anatel has set quality targets for both
fixed and MBB providers
▪ In 2012, Anatel suspended the sale of mobile voice
and internet services in 19 states (out of 27) for TIM
Brasil* due to network capacity issues, excessive
service interruption, and number of complaints
▪ In order to gain the suspension of the penalty, TIM
Brasil had to present an investment plan addressing
the detected network quality issues
* Anatel suspended service sale to Oi and Claro in 5 and 3 states,
respectively, while no infringement was detected for Vivo

39166-114 | CONFIDENTIAL
Findim Group
Significant effort has been dedicated to improving TIM Brasil‟s fibre
backhaul and backbone infrastructure
127 TIM Brasil
Source: TIM Brasil
▪ Fibre to the site (FTTS) allows the capacity of a site to
be increased from 2-8Mbit/s to >100Mbit/s
▪ 95% of sites have active fibre (FTTS phase 2) in the
targeted 39 cities (25% of population), allowing for
better average speeds
Year km of fibre Action
2009 15 000 Acquisition of Intelig
2011 20 500 AES Atimus acquisition – Rio de Janeiro and
Sao Paulo – 5500km of fibre backhauling
2013 46 000 Own construction and fibre swap with Telebras
2016 65 000 Further fibre backbone expansion
Fibre network expansion (backbone + backhaul) MBB/FTTS Project (backhaul)
Fibre network expected
by the end of 2016

39166-114 | CONFIDENTIAL
Findim Group
TIM Brasil‟s mobile network still scores poorly vs. competitors on a
number of quality indicators, signalling the need for further investments
128
% of municipalities where the operator had the worst
quality indicators (April 2013, latest data available)
TIM Brasil
* In the 6 largest cities
Source: Analysys Mason based on Anatel data
Quality indicators – TIM Brasil vs top performer* (October
2013)
16% 31%7%
Oi
Claro
Vivo
TIM
Drop of
connection
- Data
14%
16%
39%
Access to
network -
Data
7% 2%
32%
60%
Drop of
calls - Voice
31%
20%
42%
Access to
network -
Voice
22%
45%
17%
Drop free
data session 99.3% 97.8%
Access to
data network 99.0% 95.6%
Drop free
voice calls 99.2% 98.8%
Access to
voice network 98.5% 97.6%
Average speed
(% of contracted) 88.8% 79.7%
2
4
3
3
TIM
Brasil Delta to top score Anatel target
95%
98%
98%
95%
TIM‟s rank
▪ Anatel conducts periodical reviews of network quality in which TIM Brasil performs poorly relative to competitors
▪ TIM Brasil needs to increase its level of investments in order to support the commercial strategy
– network quality is a necessary attribute for an operator aiming to exploit the significant opportunity in data traffic
▪ We believe TIM Brasil should explore ways to maximise its network-sharing agreement with Oi in order to save capex required to
bring its network coverage and quality to parity with market leaders
4

39166-114 | CONFIDENTIAL
Findim Group
TIM Brasil is the only major mobile operator in Brazil without significant
fixed operations
TIM Brasil
Fixed operations Mobile operations
129
Oi
GVT
Embratel
Vivo
Net Claro
TIM
Brasil
Live TIM
Intelig
Brand Market share* Brand Market share**
28%
25%
27%
Oi 18% 28%
Vivo 18%
<1%
30%
12%
Algar <1% Algar 2%
Sercomtel <1%
Main shareholder
Telefónica: Spanish telecoms incumbent with fixed/mobile
operators in several countries
Portugal Telecom: Portuguese incumbent with fixed/mobile
operations in several Portuguese speaking countries
América Móvil: Mexican company, major shareholder of
Telmex with fixed/mobile operations in various American
markets
Others: Mainly national shareholders and public/private
ventures
Source: Analysys Mason based on Teleco, GSMA Intelligence, Telegeography
* Mobile subscribers; ** Broadband subscribers
Vivendi: French media and telecoms company; owner of
SFR, one of major mobile operators in France

39166-114 | CONFIDENTIAL
Findim Group
TIM Brasil has a very limited foothold in the fixed market, which should be
expanded to exploit the opportunity from the fixed broadband growth
▪ FTTH in Rio de Janeiro and Sao Paulo with 881 000
homes passed (Q3 2013)
▪ Intelig: an operator that focuses on business market
segment, acquired in 2009
▪ TIM Brasil has a very low share of the national market
because of its very limited footprint
– however, it is the leading provider of UBB services
(>34Mbit/s download speed) in its areas of coverage
130
▪ There is a strong opportunity to be exploited in the market
for fixed broadband lines, which are expected to grow by
8% CAGR in the next five years
▪ Offering quadruple play services would help TIM Brasil to
re-position and better address high-value market segments
▪ There is room for TIM Brasil to grow organically in the fixed
broadband market
Fixed broadband opportunity
TIM Brasil
Source: Analysys Mason, TIM Brasil, Analysys Mason Research
TIM Brasil‟s fixed network
▪ TIM Brasil‟s strategic plan puts little emphasis on the fixed
broadband market growth opportunity
▪ Although the plan mentions the exploitation of fibre assets,
it also stresses the fact that it will be done with “reduced
investment and efficient approach”
▪ Intelig is due to be restructured in order to exploit the
synergies with mobile to increase the addressable market
49%48%46%
36%
24%21%
0
10
20
30
40
50
0%
15%
30%
45%
60%
2014
43%
2017
2015
2016
2013
2012
2011
2010
2009
28%
40%
Ho
use
ho
lds p
en
etr
ation
(%
)
2018
31%
Fix
ed b
roa
dba
nd
lin
es (
mill
ion)
Broadband Broadband penetration
TIM Brasil‟s Strategic Plan for 2014-16

39166-114 | CONFIDENTIAL
Findim Group
TIM Brasil can achieve significant value creation organically but should
nevertheless be ready to consider partnerships for further growth
▪ We developed a strategic plan for the
organic growth of TIM Brasil based on
three pillars to capture the data opportunity:
– further investments to improve the
capillarity and quality of the networks to
close the gap with competitors
– market re-positioning to address higher
value segments
– expansion in the fixed market that can be
achieved leveraging on its existing assets
(further FTTH roll-out, fibre backbone and
backhaul deployment, restructuring of
Intelig)
131
▪ In addition, as an upside to the organic
growth plan, TIM Brasil should be ready to
consider opportunities to partner or
merge with other established players in the
Brazilian market in order to:
TIM Brasil
TIM Brasil
today
Organic
growth
Organic
growth +
partnerships
ILLUSTRATIVE
– expand footprint
with reduced time
to market
– optimise
investments
– exploit
convergence
– enrich service
offering

39166-114 | CONFIDENTIAL
Findim Group
TIM Brasil‟s value could be increased by partnering with established fixed
operators with commercial fit, robust network and compatible operations
132 TIM Brasil
Service
complementarity
and commercial fit
Robust and
capillary
network
Antitrust-compatible
operations and non-
conflicted shareholders
Track record
TIM Brasil would greatly
benefit from partnering with
a fixed operator with triple-
play capabilities in order to
better target high-value
market segments (e.g.
affluent families and
businesses) and help TIM
Brasil reposition
The ideal partner should
have non-conflicted
shareholders and
operations in Brazil that are
compatible with TIM Brasil‟s
from an antitrust point of
view
TIM Brasil is implementing
a significant investment
plan to complete its
backbone and backhaul
networks. Partnering with a
national fixed operator
would allow TIM Brasil to
achieve capex savings and
shorten time to market
TIM Brasil should seek
partnerships with
established operators with a
strong footprint and
operational track record in
the fixed market
Industrial partnerships can
maximise the value of TIM Brasil
2
3 4
1
In light of these considerations, GVT and Oi seem to be ideally positioned to partner with TIM Brasil

39166-114 | CONFIDENTIAL
Findim Group
GVT and Oi could be suitable partners that would allow TIM Brasil to
achieve its full potential by exploiting product and network synergies
133 TIM Brasil
Source: Analysys Mason, Telegeography
1 Complementary product portfolio that could give TIM
Brasil the opportunity to offer quad-play
High-quality voice, broadband and pay-TV services (via
cable and satellite): GVT could help TIM Brasil address
high value segments
Oi offers quadruple play services in all states
40% (#1) and 28% (#2) market share of voice and
broadband respectively on a national basis
3
Wholly owned by Vivendi, which has no conflicting
interests with TI in Brazil or elsewhere
Oi has recently been announced to be on the verge to
merge with parent company Portugal Telecom that does
not compete with TI in any market outside Brazil
4 Efficient company with a significant commercial track
record that can be exploited for cross-selling purposes
- GVT has been gaining market share over the years in
the fixed, broadband and pay-TV markets
Established in 2012 as the merge of former national
incumbents Brasil Telecom, Tele Norte Leste and Telemar
Track record in cooperating with TIM Brasil (network
sharing agreement for both 3G and 4G networks)
2
Owned access (mainly copper, with some FTTH) and fibre
backbone infrastructure that covers 150 cities
Fixed incumbent operator in areas accounting for 78% of
total population
Access network mainly based on copper with FTTH in Rio
de Janeiro and Belo Horizonte
Partnership opportunity with GVT Partnership opportunity with Oi
Serv
ices
Netw
ork
C
onflic
t T
rack
reco
rd

39166-114 | CONFIDENTIAL
Findim Group
Contents
134
Executive summary
The context
Fixed domestic
Mobile domestic
TIM Brasil
New services
Company structure
Indicative implementation guidelines
Annex

39166-114 | CONFIDENTIAL
Findim Group
A new services business unit would help TI address its current service
gap
▪ TI needs content and other services to
stimulate demand for fixed and mobile data
services
▪ It is much less active than its peers when it
comes to innovative and traditional digital and
ICT solutions and products
135
▪ TI should set up a dedicated services
business unit tasked with pursuing new
solutions to provide to:
– the other business units
– other operators
– companies and public administration
▪ The unit should follow a partnership model to
capture innovation and combine internal and
external know-how
IDENTIFIED PROBLEMS PROPOSED ACTIONS
New services

39166-114 | CONFIDENTIAL
Findim Group
TI already offers some digital and ICT services and runs a start-up
incubator aimed at fostering innovation
▪ On-demand cloud solutions
commercialised to
companies and the public
sector also via the Impresa
Semplice brand
136
Source: TI websites
New services
a) TI Digital Solutions caters for
large companies with
services dedicated to
customer support
b) The Global Partnership
Programme caters for
international operators with
consultancy-like support
▪ Working Capital is an
incubator programme
targetted at digitally
innovative start-ups
▪ Presence in Milan, Rome and
Catania
Nuvola Italiana
a) TI Digital Solutions
b) Global Partnership
Programme
Working Capital
▪ Examples of services
provided:
– storage
– security
– surveillance
– education platform
a) Solutions such as CRM and
social analytics
b) Sharing of best practices,
improvement of platforms
and services, ready-made
solutions
▪ Startups supported via:
– commercial platform
– support from venture
capital experts
– economic grants
What
Products
and
initiatives
▪ TI can differentiate itself by
leveraging its network
▪ Solutions tailored for the
specific client and
commercialised as
consultancy projects
▪ Working Capital aims to
support TI‟s Open Innovation
mission Comments

39166-114 | CONFIDENTIAL
Findim Group
TI‟s enterprise services revenues are in decline and account for a much
smaller proportion of total revenues than international benchmarks
▪ Enterprise services revenue have been calculated as the
sum of revenues from ICT services and the sale of
equipment
137
Note: Enterprise services for TI consider revenue from the sale of ICT services and Equipment;
DT figures consider the System Solutions unit; Orange figures consider the Enterprise Services unit
TI = Telecom Italia, DT = Deutsche Telekom; OR = Orange
Source: TI, Deutsche Telekom, Orange
New services
1.400
1.200
1.000
800
600
400
200
0
-16%
2013
831
2012
850
2011
1.016
2010
1.018
2009
1.035
EU
R m
illio
n
Benchmark of Enterprise services revenue (2013)
0
4
8
12
16
20
24
TI DT OR
% T
ota
l re
ve
nu
e
3.6%
15.8% 15.9%
Enterprise services revenue for TI
▪ TI enterprise services account for a far smaller proportion
of total revenues with respect to Orange and Deutsche
Telekom
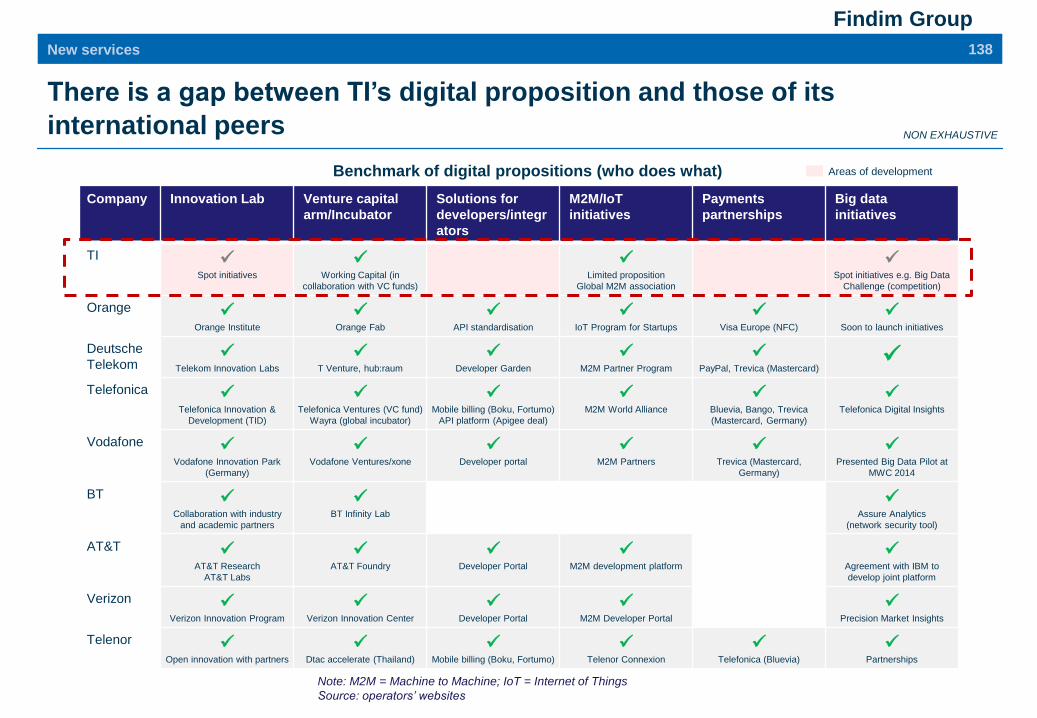
39166-114 | CONFIDENTIAL
Findim Group
There is a gap between TI‟s digital proposition and those of its
international peers
138 New services
Note: M2M = Machine to Machine; IoT = Internet of Things
Source: operators‟ websites
Company Innovation Lab Venture capital
arm/Incubator
Solutions for
developers/integr
ators
M2M/IoT
initiatives
Payments
partnerships
Big data
initiatives
TI
Spot initiatives
Working Capital (in
collaboration with VC funds)
Limited proposition
Global M2M association
Spot initiatives e.g. Big Data
Challenge (competition)
Orange
Orange Institute
Orange Fab
API standardisation
IoT Program for Startups
Visa Europe (NFC)
Soon to launch initiatives
Deutsche
Telekom
Telekom Innovation Labs
T Venture, hub:raum
Developer Garden
M2M Partner Program
PayPal, Trevica (Mastercard)
Telefonica
Telefonica Innovation &
Development (TID)
Telefonica Ventures (VC fund)
Wayra (global incubator)
Mobile billing (Boku, Fortumo)
API platform (Apigee deal)
M2M World Alliance
Bluevia, Bango, Trevica
(Mastercard, Germany)
Telefonica Digital Insights
Vodafone
Vodafone Innovation Park
(Germany)
Vodafone Ventures/xone
Developer portal
M2M Partners
Trevica (Mastercard,
Germany)
Presented Big Data Pilot at
MWC 2014
BT
Collaboration with industry
and academic partners
BT Infinity Lab
Assure Analytics
(network security tool)
AT&T
AT&T Research
AT&T Labs
AT&T Foundry
Developer Portal
M2M development platform
Agreement with IBM to
develop joint platform
Verizon
Verizon Innovation Program
Verizon Innovation Center
Developer Portal
M2M Developer Portal
Precision Market Insights
Telenor
Open innovation with partners
Dtac accelerate (Thailand)
Mobile billing (Boku, Fortumo)
Telenor Connexion
Telefonica (Bluevia)
Partnerships
Areas of development Benchmark of digital propositions (who does what)
NON EXHAUSTIVE

39166-114 | CONFIDENTIAL
Findim Group
TI should develop new competencies to bridge the existing gap, this can
be realised through a dedicated business unit and through partnerships
▪ TI has the opportunity to develop and bring new digital
services onto the market
▪ It should develop digital services that:
– enable the fixed and mobile business units to provide
innovative services to their respective end-users
– cater directly to corporates and the public sector with
tailored solutions
▪ This can be done via a dedicated business unit that would:
– attract new competencies beyond those in the traditional
TI business
– focus on partnerships in a flexible fashion (i.e. without the
bureaucratic burdens typical of large corporations)
139 New services
▪ Several companies have created dedicated subsidiaries either to offer new services…
– in the telecoms industry: Deutsche Telekom, SingTel, SK Telecom have each recently created digital subsidiaries that operate
outside the legacy business, in order to limit the bureaucracy that is typical of large companies
▪ …or to cater to a new market
– in the FMCG industry: when Nespresso (controlled by Nestle) expanded beyond the business market for coffee capsules to enter
the home market in the 2000s, it started a dedicated subsidiary. This move allowed the company to immediately adopt a new
culture and pivot from a B2B to a B2C marketing approach
A business unit focused on services
would help to attract know-how
▪ Developing cross-industry partnerships would:
– complement competencies available in-house with those
available elsewhere in the market
– support the development of innovative solutions/products
by joining forces with external parties
▪ TI brings value to partnerships with:
– network infrastructure ownership and know-how
– customer base (customer insights, customer care and
distribution channels)
▪ Partners should be selected on the basis of:
– competencies and the intellectual properties owned
– capability to help TI reduce the time-to-market
Partnerships can support the development
of a well-rounded digital proposition

39166-114 | CONFIDENTIAL
Findim Group
ICT and Cloud
Dig
ital
An overall digital proposition should focus on the development of
innovations and should target both the Group and external clients
140 New services
Research and
Development
Service enabler
Partnerships with industry leaders
Incubation of promising start-ups
Development and testing of product concepts
Streamlining of solutions to enable digital
services for the Group‟s fixed and mobile units
Focus on providing tailored solutions to
companies and the public administration
Scouting of innovation trends
R&D of innovative digital products
Support the fixed and mobile units to
launch innovative services for end-users
Address companies and the public
administration with digital services
Description Actions Workstream
Workstreams to support the development of an all-round digital proposition
1a
1b
2
Investment/growth opportunity
Current activity/Opportunity to enlarge scope
1

39166-114 | CONFIDENTIAL
Findim Group
The services unit will use a range of commercial channels to reach end
users
141 New services
Public
Administration
Large
companies SMEs Residential
Specific
corporate
users (e.g. advertisers,
developers)
Wholesale Mobile Fixed Partners
ICT and Cloud services Digital
End users
Commercial
channels
Services
unit
Digital should
contract with
wholesalers only
where there is no
competition for
end users
E.g. contents to
be resold
E.g. big data
analytics, big
data access via
APIs

39166-114 | CONFIDENTIAL
Findim Group
The Research and Development function of the „digital‟ stream should
work with a wide and flexible remit so as to capture radical innovations
142 New services
Partnerships Incubation of startups
Scouting of trends
Working with partners (market
leaders, universities) and being part
of an ecosystem is critical to
success in the new digital market
Each partner brings unique
expertise in its field and can support
the definition of innovative
products
services
applications
Examples of companies that
cooperate with partners
AT&T
Verizon
T Systems (Deutsche Telekom)
Research and
Development
Incubating startups and the
scouting of trends would foster the
generation of ideas and projects
within the Digital services unit
innovative products and services
are more and more often the
product of startups
technological trends begin years
in advance of commercial
deployment and TI should
experiment solutions early
Examples of companies that
support startups
Telefonica (Wayra, Amérigo)
Vodafone Ventures
T Venture (Deutsche Telekom) The R&D function would support TI by:
developing digital product concepts
deploying new products in
collaboration with partners
Development of concepts and
deployment of partners‟ solutions
1a

39166-114 | CONFIDENTIAL
Findim Group
TI can initially focus its activities on digital segments where the best
prospects for growth can be identified
143 New services
1a
Examples of focus areas for the research and development function
NON EXHAUSTIVE
Res
ea
rch
an
d d
eve
lop
me
nt
Big data
(monetise user
data)
Mobile operators have access to large amounts of behavioural
data (e.g. positioning, calls, numbers called) that are well suited to
be analysed to provide insights on consumer habits
Data availability keeps growing and the commercialisation of
analytics programs could effectively allow TI to cope with
traditional revenue streams otherwise losing ground
M2M
(catering to
smaller vertical
sectors)
Currently, much of the M2M value is tied to a small number of
large contracts with players such as automotive manufacturers
and utilities. Nonetheless, there is considerable value in smaller
vertical sectors
TI could focus on developing tailored end-to-end solutions by
partnering with providers active in different/smaller vertical sectors
(e.g. patient monitoring, maintenance of heavy equipment)
To be further investigated

39166-114 | CONFIDENTIAL
Findim Group
The „service enabler‟ function of the digital stream should streamline
solutions to enable the commercial launch of digital services
144 New services
The fixed and mobile units would be the main clients of the digital services
unit, these units would acquire
digital solutions to support the provision of innovative services to end-
users
solutions to improve service quality and customer satisfaction (e.g.
analytics platform)
Digital services
(Service enabler)
Fixed Mobile
Outputs of research and
development
Identification of business
needs and supply of
solutions
Definition and sharing of
requirements with the digital
solutions unit Continuous
interaction to identify
needs and provide
ad hoc solutions
1b

39166-114 | CONFIDENTIAL
Findim Group
The „digital services‟ function would benefit from partnerships that can
bring relevant know-how to develop new products and services
145 New services
Payments
Healthcare
Hardware manufacturers
Software producers
Home automation
1
Analytics tools providers
Examples of potential partners Benefits of partnership
Test hardware being in concept
phase and anticipate trends
Italtel, Telit, STM, Cisco, Huawei
Participate in the development of
innovative software
Microsoft, Android, Firefox OS
Participate in the development of
data analytics tools
HP, IBM, SAS
Address a developed ecosystem of
hardware integrators and installers
Bticino, Vimar, Philips
Exploit the experience and know-how
of long-standing players
CartaSì, Ingenico, Gemalto, Isis,
Bluevia (Telefonica)
Participate in the development of
health-related connected tools
Philips, General Electric
ILLUSTRATIVE

39166-114 | CONFIDENTIAL
Findim Group
The ICT and cloud function should focus on tailored solutions to reduce
ICT complexity for the public administration, large companies and SMEs
146 New services
ICT and Cloud services
Large
companies
Public
administration
Public administration, large companies and SMEs are offered tailored
solutions that can address current and future needs e.g.
cloud computing
integrated communication solutions
Identification of rising
business trends and
definition of products
Wide range of
solutions both from
external partners and
internal units
Digital needs driven
by companies and PA
Specific
commercial
channels (based
on consultative
relationships)
2
SMEs
Commercial
partners Mobile Fixed
Solutions
partners
Internal
solutions Mobile Fixed

39166-114 | CONFIDENTIAL
Findim Group
The ICT and cloud solutions can be clustered into three segments that
answer enterprise needs from different angles
147 New services
Innovative applications End-user solutions
Vertical solutions tailored for
specific industries, (energy,
transport, logistics, healthcare)
Enterprise solutions
cloud computing
data warehousing
analytics applications
hosting services
Flexible workplace: solutions
to provide flexibility in the
workplace, allowing employees
to work from different locations
Data security: protection of
data stored on mobile devices
ICT security Service desk
Core
solutions
Support
services
Legacy applications
Management of business
critical services
ERP system
CRM system
Corporate collaboration
HD videoconferencing
Telepresence
Customer interaction
WAN optimisation
2

39166-114 | CONFIDENTIAL
Findim Group
The ICT and cloud function would benefit from partnerships that can help
build high-quality integrated solutions for enterprises
148 New services
Hardware integrators
Software integrators
Logistics
2
Consultancies
Advertising
Data centres
Examples of potential partners Benefits of partnership
ILLUSTRATIVE
Develop tailored hardware and
software solutions
Almaviva, HP, CSC, IBM, Accenture,
Engineering
Cater to the needs of the largest
clients TelecityGroup, KPNQwest
Support clients on extensive projects Altran, Accenture
Develop innovative solutions for
billboards, mobile advertising,… JPDecaux
Develop innovative solutions for
parcel delivery DHL, ups, Amazon

39166-114 | CONFIDENTIAL
Findim Group
Contents
149
Executive summary
The context
Fixed domestic
Mobile domestic
TIM Brasil
New services
Company structure
Indicative implementation guidelines
Annex

39166-114 | CONFIDENTIAL
Findim Group
TI needs to regain the flexibility to pursue long-term growth through
investment
▪ TI is a stand-alone player in a world
dominated by large groups
▪ It has had to operate within certain cash
constraints, which has lead to a sub-optimal
approach to investments and upgrades
(longer-term growth and opex savings have
been sacrificed due to a lack of capacity to
invest)
▪ The organisation has been geared more
towards the preservation of the status quo
than towards growth
150
▪ New organisational structure to provide
greater flexibility for each line of the business
to pursue its individual goals
▪ The proposed structure would comprise three
business units with clear actions for each
business unit to increase financial flexibility
– Mobile business unit to be allowed to
pursue partnerships and joint
ventures/mergers in Europe and Brazil
– Fixed business unit to pursue a limited
capital increase, in cash or in kind, to
address investment gap
– Services unit to create the right
environment and sufficient organisational
and financial flexibility for innovation
▪ Divestments welcome but only if they create
value for shareholders; pure sale and lease-
back deals without upside to be avoided
IDENTIFIED PROBLEMS PROPOSED ACTIONS
Company structure

39166-114 | CONFIDENTIAL
Findim Group
The organisation outlined by the Findim Group would allow TI to address
some of its key problems
151 Company structure
TI group
Services Fixed Mobile
▪ Potential for growth
through JVs with local
operators or partnerships
with major groups with
non-overlapping footprint
▪ Limited increase in capital
for network upgrade
coming from institutional
investors
▪ New unit to drive future
growth, with solutions
enabled by partnerships,
JVs and other means
Separating domestic fixed and mobile operations into separate business units
runs against the prevailing trend for increased integration.
It may be necessary to address TI‟s problems and
would not preclude offering converged products if implemented correctly

39166-114 | CONFIDENTIAL
Findim Group
Each business unit will be tasked with pursuing its specific key issues
152 Company structure
TI Group
Services Fixed Mobile
▪ Aim to participate in cross-
border consolidation
▪ Manage transition from
voice- to data-centric
operator
▪ Increase domestic user
spend by leveraging 4G
and data/content potential
▪ Gradually increase value
of Brazil operations by
improving company
positioning in a growing
market
▪ Enable large-scale NGA
deployment to ensure
future relevance
▪ Stimulate broadband take-
up and willingness-to-pay
(for connectivity and
content)
▪ Manage traditional voice
revenue decline while
extracting short-term cash
▪ Explore long-term opex
savings vs. short-term
cash management
▪ Create a strong new
player in the ICT
infrastructure and digital
economy
▪ Exploit economies of
scope and of scale with
the other BUs
Proposed group organisation – objectives
Each BU will have its own management team and P&L to ensure appropriate incentives and focus

39166-114 | CONFIDENTIAL
Findim Group
TI Group
We have suggested an outline perimeter for each business unit
153 Company structure
Retail network
Services Fixed Mobile
TIM Italy
▪ Mobile brand
▪ Mobile network (mobile
dedicated assets including
BTS, RAN)
▪ Product development and
marketing
▪ Spectrum
TIM Brasil
▪ All operations
Fixed network
▪ Access copper and NGA
▪ Backhaul and core
Wholesale operations
▪ Regulated and commercial
▪ TI Sparkle
Retail operations
▪ Broadband, PSTN and others
▪ Sales of quad-play
▪ Product development and
marketing
▪ B2B
▪ Broadband, PSTN
▪ Managed network services
▪ Vertical solutions
▪ Sales responsibility for add-on
services (cloud, etc.)
Technology and product
development focus
Digital
▪ Big data
▪ Payments
▪ Entertainment and social
ICT and cloud
▪ ICT infrastructure
▪ Cloud
▪ Cyber security
▪ Verticals
Admin, finance,
overall strategy

39166-114 | CONFIDENTIAL
Findim Group
TI should conduct a detailed project before setting up the new structure in
order to refine the perimeters, responsibilities and management
154 Company structure
Assessment of
management skills
▪ Assessment of skills of the current management and their fit with the new
organisation structure
▪ Identification of profiles to recruit externally
Activities and
responsibilities
▪ Full mapping of the activities and responsibilities of each business unit and of
interactions between them
Assets ▪ Identification of tangible and intangible assets to be transferred to each
business unit
Brand
▪ Evaluation of brand strategy
▪ Investigation of possibility to move to a one-brand solution or to adopt different
brands – to include existing and potentially new brands
Financial structure ▪ Debt and equity structuring considerations and negotiations between business
units and holding
Areas to be assessed during set-up of business unit
HR policies
▪ Review of HR activities, communication and terms of employment to ensure
retention of skilled staff and to ensure that they have appropriate training, skills
and incentives to support the new organisation

39166-114 | CONFIDENTIAL
Findim Group
Market
Economies of scale and of scope will be guaranteed through the set-up of
a range of agreements between the units
155 Company structure
Note: excludes wholesale to external clients
Group
Services Fixed Mobile
Proposed group organisation – illustration of interactions between the units
Network
assets
Mobile as
input for
quad-play
Backhaul
and core
network Solutions
Admin and staff Admin and staff
Admin and staff Solutions
Retail
Only to
corporate
clients

39166-114 | CONFIDENTIAL
Findim Group
The plan is based on the premise of the existing group perimeter but we
do not believe that divestments should be excluded a priori
156 Company structure
Type of divestment Examples Recommended approach
Non-strategic/
non-substantial
▪ Telecom Italia Media
Broadcast
Most of these activities have
already been divested
▪ Continue with divestment plans
Strategic and
substantial but that
can be easily
separated
▪ TIM Brasil
Most of these activities have
already been divested
▪ Divest if value can be maximised. This
may require some strengthening of the
company situation and choosing the right
moment to divest and being open to JVs
Sale and lease-back ▪ Towers in Italy and Brazil
▪ Real estate in Italy
▪ Carefully assess and design divestments
to avoid pure cash vs. opex swap
▪ Focus on ensuring value creation for TI
(upside for the investor that is recognised
to TI and/or future opex savings/
efficiencies enabled by the divestment)
We believe different types of divestments should be treated differently

39166-114 | CONFIDENTIAL
Findim Group
A tower sale in Italy can create value for TI, but the details of the deal need
to be carefully considered to ensure that the value is internalised
▪ A tower sale and lease-back creates value to TI if the buyer‟s
valuation of the portfolio is higher than TI‟s assessment of the
NPV of the cash flows transferred to the buyer
▪ The values depend on transaction-specific details such as
the commercial terms and perimeter of the sale. To illustrate
the impact, we have therefore compared
– the value to a buyer
▪ based on benchmarks of recent transactions, e.g. E-
Plus/American Towers, we estimate this to be up to c.
EUR200 000 per tower (assuming full size towers and
not roof tops)
– the value to TI based on the perpetuity of:
▪ cash flows transferred to the buyer of EUR10 000 per
year per tower
▪ cost of capital of 6% (i.e. cost of debt) or 10% to
scenarios of TI using the proceeds instead of debt
financing or to remunerate its average cost of capital
▪ this provides us with a value per tower of between
EUR100 000 (10% CoC) and EUR170 000 (6% CoC)
▪ TI has c. 12 000 sites but we do not know how many of these
that can be divested. Based on previous transactions we
assume that no more c. 4000 towers can be divested
157
▪ A transaction at a similar price to the one achieved by E-plus
appears to make economic sense to TI under our
assumptions
Illustration of value creation of sale of Italy towers
Company structure
Notes: cash flows transferred to buyer include: Lease-back by TI, lease revenues from third parties and costs
(e.g. land lease) incurred by TI today. The 12 000 sites of TI likely include rooftop sites. The largest
transactions we are aware of in Europe comprised c. 2000 towers (Bouygues Telecom and E-Plus)
1
2
0
100
200
300
400
500
600
700
800
+133
+400
Possible
transaction
price
800
Value to TI
- scenario 2
667
Value to TI
- scenario 1
400
EU
R m
illio
n

39166-114 | CONFIDENTIAL
Findim Group
The upside for TI of a tower sale may be higher in Brazil than in Italy due to
the market maturity
▪ A buyer of a tower portfolio can create an upside by attracting more external tenants than the operator would do on its own – the
greater the scope for doing so, the higher the upside typically paid by the buyer to the MNO
▪ In the Brazilian market, significant investment is expected from all MNOs for increasing network coverage. This leaves significant
scope for an independent TowerCo to increase tenancy ratios
– consolidation in the Brazilian tower market is expected. The independent tower market has grown rapidly in the past few
years, following tower spin-offs from national MNOs and a growing presence of independent TowerCos (including AMT, SBA)
– TIM Brasil could also benefit from consolidation by gaining access to existing sites for its network extension
▪ The Italian market is much more mature which means that the upside for a buyer is significantly smaller and a transaction would
therefore be much more similar to a financial lease
158
Source: Analysys Mason, Teleco, press releases
Company structure
Distribution of existing towers in Brazil (2013) Number of towers per independent operator (2013)
TowerCo # of towers
American Towers 7500
Grupo TorreSur 6000
BR Towers 4000
SBA Communications 5000
Others 4000
63 393
towers
TIM 22%
Vivo 12%
Claro 22%Oi 5%
TowerCos 39%

39166-114 | CONFIDENTIAL
Findim Group
TI still retains some real estate that it can potentially monetise through
sale and lease-back deals
▪ TI has c. 10 400 local exchanges, often situated in prime urban locations
– these were built to house copper main distribution frames (MDFs), voice (PSTN) concentrators and other switching equipment
▪ Modern technologies allow a significant reduction of the footprint of the installed in local exchanges which provides the possibility
for the operators to divest or let their real estate portfolio
– a full rationalisation requires a decommissioning of MDFs which can require that all (voice and broadband) lines are migrated to
FTTx
▪ TI entered into sale and lease-back deals for the majority of its local exchange buildings in 2002 (with Pirelli Re and Morgan
Stanley) and in 2006 (with Pirelli Re.) which limits the scope for TI to benefit from such rationalisation
▪ We understand that TI still has a relatively large real estate portfolio of office and technical buildings that it could monetise through a
sale and lease-back deal
– TI has not made public any details on this real estate portfolio
159 Company structure

39166-114 | CONFIDENTIAL
Findim Group
TI should continue to attempt to influence some key market developments
160 Company structure
Source: Analysys Mason based on TI and various other sources
Key issues Current status Outlook
Pursue digital agenda ▪ Italy has low ICT literacy compared to peers
which is a key driver for the low broadband
take-up
▪ There is likely to be a need for some public
intervention to ensure ubiquitous high-speed
coverage
▪ Uncertain outlook as the government has yet to
implement any of the announced plans
▪ TI should, together with the other operators, push
the government to become an enabler
OTT payment for
network usage
▪ European operators have limited scope to
charge OTT players for the traffic generated
due to pressures over net neutrality
▪ Regulatory outlook uncertain, TI and other
European operators are lobbying for changes
▪ Operators in the USA have started to reach
commercial solutions which also TI could pursue
Mobile market over-
establishment
▪ The Italian mobile market is exceptionally
competitive: the fourth operator, H3G,
generates limited returns despite having
been in the market for c. 10 years
▪ Other large European markets such as the
UK and Germany have seen consolidation
with Germany being in the process of
reducing to three operators
Consolidation has been discussed – e.g. in the shape
of a merger between Wind and H3G or even between
TI and H3G
▪ Negotiations between Wind and H3G appear to
have broken down
▪ Difficult for TI to participate in consolidation
process given its high market share
▪ Uncertainty over reaction from competition
authorities

39166-114 | CONFIDENTIAL
Findim Group
Contents
161
Executive summary
The context
Fixed domestic
Mobile domestic
TIM Brasil
New services
Company structure
Indicative implementation guidelines
Annex

39166-114 | CONFIDENTIAL
Findim Group
Summary of the value creation actions proposed in the strategic plan
▪ Throughout the report we have made a number of recommendations to enable TI to resume growth, both
domestically and internationally, and create value for its shareholders
▪ In the remainder of this section we:
– summarise the actions and recommendations for each operational business unit
– propose a selection of operational targets for the company to provide guidance on the suggested
implementation of the plan
– provide a suggested timeline for the implementation of the strategic plan
162 Indicative implementation guidelines

39166-114 | CONFIDENTIAL
Findim Group
Actions and initiatives for value creation: domestic fixed
163 Indicative implementation guidelines
Area Actions Initiatives and results
Broadband and
ultrabroadband
▪ Increase FTTx coverage and
capacity ▪ Expansion of FTTC capacity and coverage to
target 70% of HHs and FTTH coverage to target
25% of HHs (incl. Milan) in the medium term
– EUR1.5-2.0 bn investments in addition to the
EUR1.7 bn announced by TI for 2014-16
▪ Make FTTC the leading
platform
▪ Pursue actions to improve
ICT literacy
▪ Actively influence government to enhance focus
on digital agenda, resulting in an improvement of
ICT literacy and an increase in broadband
penetration
▪ Increasing UBB share of BB in line with other EU
countries (target: 50-60%)
– aim at gradually switching off legacy DSL
equipment in local exchanges
▪ Stabilisation of BB market share at current level,
in line with virtuous EU5 incumbents
▪ Stabilise BB market share

39166-114 | CONFIDENTIAL
Findim Group
Actions and initiatives for value creation: domestic fixed
164 Indicative implementation guidelines
Area Actions Initiatives and results
Broadband and
ultrabroadband
▪ Increase attractiveness of
offers
▪ Improve content through collaboration with
international and domestic OTT content providers
▪ Upgrade existing and new users to higher speeds
(access and backhaul network upgrades)
▪ Gradual alignment of UBB „pricing premium‟ to c.
EUR5/month; restructuring of BB pricing
De-layering ▪ Migration of users to VoBB ▪ VoBB migration, starting with commercial offer
and then moving to forced migration in high BB
and UBB penetration areas (possibly not fully
achievable in plan timeframe)
▪ Increased investments of up to EUR1.0 bn over
3 years to complete migration (CPE and
adapters and network capacity upgrades)
▪ De-layering and
rationalisation of network
▪ Long-term savings of up to 30-40% of legacy
network opex and 30% of maintenance capex
▪ Opex savings in the
medium-term

39166-114 | CONFIDENTIAL
Findim Group
Actions and initiatives for value creation: mobile domestic
165 Indicative implementation guidelines
Analysis Actions Initiatives and results
Mobile domestic ▪ Accelerate smartphone
penetration in the customer
base
▪ Slight increase in handset subsidies to prepaid
subscribers to accelerate smartphone
penetration
▪ Privilege monetisation /
value creation and not
(subscriber) market share
defence
▪ Enrich the basket of content
and applications available to
customers, potentially by
means of partnerships, and
improve marketing
effectiveness
▪ Re-balance investments vs.
fixed, avoiding to overspend
on mobile network
▪ Increase focus on postpaid and high-value
segments (target of +1pp postpaid, -1pp prepaid
market share by 2016)
▪ Do not engage in further price war
▪ Improve effectiveness of marketing and up-
selling of VAS and add-ons, leading to broadly
stable ARPU by segment and single digit CAGR
increase in VAS/data ARPU
▪ Explore partnerships to further enrich content
offering
▪ Closer alignment between network roll-out and
sales and marketing
▪ Rather than too aggressively expand 4G
coverage, focus should be on improving the 3G
network to keep capex below 13% of revenues

39166-114 | CONFIDENTIAL
Findim Group
Actions and initiatives for value creation: TIM Brasil
166 Indicative implementation guidelines
Area Actions Initiatives and results
TIM Brasil ▪ Need for further significant
network investments
▪ Improve coverage and capacity of data network,
bringing 3G coverage to 85% by 2016
▪ 20-25% additional investments to the EUR3.4 bn
announced by TIM Brasil for 2014-16
▪ Need to increase its focus in
higher-value segments (e.g.
postpaid and data) and,
more in general, seek to
become the primary
operator for its users
▪ Pursue partnership to viably
increase scale and footprint
in the fixed market and
maximise opportunities in
the convergent market
▪ Depending on partner, there can be a revenue
upside in high-end / postpaid segments currently
not effectively targeted by TIM Brasil
▪ Depending on partner 2-5% opex savings
▪ Depending on timing and partner, 3-5% capex
savings
▪ Target market share increase of 0.5-1.0p.p. in
prepaid segment and 1.5-2.0p.p. in the postpaid
segment
▪ Refocus on higher-value subscriber and data
take up to stabilise blended ARPU at above
EUR6 per month

39166-114 | CONFIDENTIAL
Findim Group
Actions and initiatives for value creation: services
167 Indicative implementation guidelines
Area Actions Initiatives and results
Services ▪ Set up a services business
unit
▪ Focus on supply to other group BUs, enterprise
customers and wholesale
▪ Define and implement partnership framework
▪ Start commercialising services through various
channels including direct sales, through the fixed
and mobile BUs, partners and where appropriate
wholesale (depending on product and target
market)
▪ Aim at best-in-class stand-alone performance in
the mid-to-long term: generating c. 15-20% of
group revenues with EBITDA margin of c. 10-
15%
▪ Solutions supplied will allow other BUs to
provide more attractive products, thereby
improving also their performance

39166-114 | CONFIDENTIAL
Findim Group
Possible timeline for main proposed actions
168 Indicative implementation guidelines
2014 2015
May Jun Jul Aug Sep Oct Nov Dec Jan Feb Mar Apr May Jun Jul Aug Sep Oct Nov Dec
Increased FTTx coverage and capacity
Actions
Holding level/Structural
Preparatory study
Set up structure
Services
Pursue JVs
Focus on postpaid and data
Fixed domestic
TIM Brasil
Pursue partnerships
Investment rebalancing
Offer repositioning
Mobile domestic
Accelerated network delayering
ICT literacy
Content partnerships
Offer repositioning
Implementation of business unit structure
Assessment of divestment opportunities
Accelerated network investment

39166-114 | CONFIDENTIAL
Findim Group
Contents
169
Executive summary
The context
Fixed domestic
Mobile domestic
TIM Brasil
New services
Company structure
Indicative implementation guidelines
Annex Examples of fixed-line strategies
Glossary of acronyms

39166-114 | CONFIDENTIAL
Findim Group
BT links video and broadband to drive penetration of its superfast BT
Infinity services; Virgin Media does the same to protect its TV base
BT (incumbent operator UK)
▪ BT Infinity penetration grew five-fold to 1.9 million in two years; BT‟s
broadband ARPU increased by 14%, while line loss was more than
halved, driven by
– narrow pricing differential between DSL-like and Infinity-based
propositions (typically GBP5/month)
– speed increases to the BT Infinity services widening the quality
differential with DSL services
– value-added/content services made available for BT Infinity (e.g. HD
extra channels, BT Sport* directly to the TV and 802.11ac Home
Hub)
170
* BT acquired exclusive live broadcast rights (2015-17) to Champions League and Europa League football for GBP900 million
Note: RGU = Revenue Generating Unit; TiVo is a DVR developed and marketed by TiVo, Inc.
Source: BT and Virgin Media institutional websites, press search
Annex
Virgin Media (cable-TV operator UK)
▪ Launch of TiVo-centric triple-play bundles (Q2 2012) enabled Virgin
Media to limit cable TV RGUs losses to -0.6%, while cable broadband
RGUs increased by 6.6%
▪ The co-branded, TiVo-powered TV service enables Virgin Media to
differentiate itself through a range of features
– e.g. content search/recommendation and access to apps such as
Netflix and YouTube on the TV
Subscribers evolution and 3P/4P bundle penetration
Cable internet and TV RGUs and TiVo penetration
20%17%
15%13%
10%
Q2
2013
Q1
2013
Q4
2012
5%
Q4
2011
4%
Q1
2012
Q3
2012
7% 9%
Q4
2013
Q3
2013
Q2
2012
BT Infinity Retail fixed BB subs Active lines
52%49%
Q4
2011
40%
Q4
2013
Q1
2012
44%
30%
Q4
2012
Q1
2013
Q2
2012
12%
35%
Q3
2012
18% 25%
Q2
2013
Q3
2013 Cable TV Cable Internet TiVo penetration

39166-114 | CONFIDENTIAL
Findim Group
PT and ZON Optimus have both successfully driven the penetration of
NGA services in their battle for market supremacy
Portugal Telecom (incumbent operator in Portugal)
▪ FTTH subscribers increased by 70% to 372 000 thanks to PT‟s
bundling strategy which enabled it to grow its pay-TV and fixed
broadband subscriber bases by 26.2% and 17.1%, respectively
▪ PT fixed broadband recent growth was also sustained by the launch of
quad-play bundles („M4O‟) in Q1 2013
– M4O combine traditional services with MEO-branded services
▪ value added services: music streaming (NMusic), cloud storage
and cloud gaming service (Playcast Media Systems) on PCs
– M4O are offered at no differential price between DSL or fibre version
171
Source: PT and ZON Optimus institutional websites
Annex
ZON Optimus (cable operator in Portugal)
▪ Iris Fibra 3P bundle was launched in Q1 2011 combining 30Mbit/s+
cable broadband with a next-generation TV experience featuring
content search and recommendation through the NDS Snowflake user
interface, more TV channels, a DVR and a multi-screen video service
– Iris Fibra subscribers more than quadrupled to 437 600 in the 2 years
to Q4 2013
▪ Despite of the strong competitive challenge from PT, the Iris Fibra
bundles enabled ZON to grow its cable pay-TV subscriber base by
2.2% over the period
Subscribers evolution and 3P/4P bundle penetration
Cable internet and TV RGUs and TiVo penetration
74%72%71%69%68%67%66%64%61%
Q1
2013
Q4
2013
28% 27% 26% 20% 24%
Q1
2012
22%
Q4
2011
Q3
2012
29%
Q3
2013
28% 27%
Q2
2012
Q4
2012
Q2
2013
FTTH
Pay-TV subscribers
Fixed accesses Triple / quad-play
Fixed broadband subscribers
88%86%98%98%98%98%97%96%96%
25%
Q2
2012
Q2
2013
13%
Q4
2011
Q4
2013
42% 36%
43%
Q4
2012
Q1
2013
47%
30%
Q3
2012
21% 16%
Q1
2012
Q3
2013
Fixed broadband subscribers
Pay-TV subscribers
Triple / quad-play
Iris Fibra

39166-114 | CONFIDENTIAL
Findim Group
Orange is losing overall fixed broadband market share but its share of
FTTH/B is increasing thanks to its Orange Open quad-play bundles
Orange (incumbent operator France)
▪ Orange‟s market share has decreased by ~2p.p. in the past 2 years
– however, the number of Orange FTTH subscribers grew more than
three-fold to 319 000 during the same time
▪ Part of this success can be attributed to the Orange Open quad-play
bundles
– launched in August 2010 as a pre-emptive measure against Free
Mobile‟s anticipated entry into the market (which eventually occurred
in January 2012), the number of Orange Open subscribers
quadrupled to 4.8 million in the 2 years to December 2013
▪ The fibre-based Open bundles cost EUR5 more per month than
comparable DSL-based bundles. Orange incentivises subscribers to
take up the higher-end fibre-based bundles with:
– promotional tariffs which puts them on par with equivalent DSL-
based bundles for 12 months
– special offers on premium content, available to fibre subscriber only
▪ Orange also emphasises the benefits of fibre, such as faster
downloads, or the ability to use multiple Internet-connected devices
concurrently
172
* Orange DSL subscribers include small number of subscribers who receive broadband by satellite
and other technologies
Source: Orange and ARCEP institutional websites
Annex
Subscribers evolution and 3P/4P bundle penetration
59%58%58%56%56%
53%50%50%
48%
Q4
2013
41%
Q3
2013
41%
Q2
2013
41%
Q1
2013
41%
Q4
2012
41%
Q3
2012
42%
Q2
2012
42%
Q1
2012
42%
Q4
2011
42%
FTTH/B
Fixed broadband
Orange Open
Orange FTTH
Orange DSL *

39166-114 | CONFIDENTIAL
Findim Group
Contents
173
Executive summary
The context
Fixed domestic
Mobile domestic
TIM Brasil
New services
Company structure
Indicative implementation guidelines
Annex Examples of fixed-line strategies
Glossary of acronyms

39166-114 | CONFIDENTIAL
Findim Group
Glossary of acronyms [1]
174 Annex
*See slide on topology of access networks
Acronym Explanation
2G Second-generation mobile technology
3G Third-generation mobile technology
4G Fourth-generation mobile technology
ADSL Asymmetric digital subscriber line
ARPU Average revenue per user
ATM Asynchronous transfer mode
B2B Business to business
BB Broadband Internet connection
BRAS Broadband remote access server
BTS Base transceiver station
BoD Board of Directors
BU Business unit
CAGR Compounded annual growth rate
Capex Capital expenditure
CoC Cost of capital
CATV Cable television
DAE Digital Agenda for Europe
DOCSIS Data over cable service interface specification (standard allowing
the transmission of data on a cable system)
DSLAM* Digital subscriber line access multiplexer
EBITDA Earnings before interest, taxes, depreciation, and amortisation
Acronym Explanation
EC The European Commission
EIU The Economist Intelligence Unit
ETH Ethernet
EU The European Union
EU5 The 5 largest EU countries: France, Germany, Italy, Spain, the UK
FBB Fixed broadband (BB access via fixed network)
FMCG Fast moving consumer goods
FMS Fixed-mobile substitution
FTR Fixed termination rate (fee paid by calling operator to the
receiving (fixed-line) operator to terminate a voice call)
FTTx* Fibre to the home / cabinet / street
FFTC* Fibre links LE to cabinet
FTTH* Fibre links LE to home
FTTS* Fibre to LE to street (Cabinet)
FWA Fixed-wireless access
FY Fiscal year
G&A General and administrative
GDP Gross domestic product
ICT Information and communication technology
IMF International Monetary Fund
IoT Internet of things

39166-114 | CONFIDENTIAL
Findim Group
Glossary of acronyms [2]
175 Annex
Acronym Explanation
RAN Radio access network - part of a mobile telecom system that
bridges the core network to end-users‟ devices
RGU Revenue-generating unit
SDH Synchronous Digital Hierarchy
SIM Subscriber identity module, also known as SIM card
SLU Sub-loop unbundling
SME Small and medium enterprises
TDM Time domain/division multiplexing
TI Telecom Italia
TIM-B TIM Brasil
UBB Ultra Broadband (>30Mbit/s)
VAS Value-added services
VAT Value-added tax
VDSL* Very-high-bit-rate digital subscriber line
VoBB Voice over broadband
VoD Video on demand
VoIP Voice over IP
VoLTE Voice over LTE
WACC Weighted average cost of capital
WAN Wide-area network
xWDM x-wavelength division multiplexing (C: code; D: dense)
YoY Year-on-year
Acronym Explanation
IP/MPLS Internet protocol/multi-protocol label switching
IRU Indefeasible right of use
KPI Key performance indicator
JV Joint venture
LRIC Long-run incremental cost
LE Local exchange
LTE Long-term evolution (4G mobile technology standard)
LLU Local loop unbundling
M2M Machine to machine
MBB Mobile broadband (BB access via mobile network)
MDF* Main distribution frame
MNO Mobile network operator
MTR Mobile termination rate (fee paid by calling operator to the
receiving (mobile) operator to terminate a voice call)
MSAN* Multi-service access node
NGA Next-generation access (FTTx, DOCSIS 3.0+)
NPV Net present value
ODF* Optic distribution frame
Opex Operational expenditure
OLT* Optical line terminal
OTT Over the top (online distributor of digital content, usually
independent from telecom operators)
PSTN* Public switched telephone network
*See slide on topology of access networks

39166-114 | CONFIDENTIAL
Findim Group
Country codes
176 Annex
Code Country
IE Ireland
IT Italy
LT Lithuania
LU Luxembourg
LV Latvia
MT Malta
NL Netherlands
PL Poland
PT Portugal
RO Romania
SE Sweden
SI Slovenia
SK Slovakia
GB United Kingdom
Code Country
AT Austria
BE Belgium
BG Bulgaria
CY Cyprus
CZ Czech Republic
DE Germany
DK Denmark
EE Estonia
GR Greece
ES Spain
FI Finland
FR France
HR Croatia
HU Hungary

39166-114 | CONFIDENTIAL
Findim Group
Topology and speed of access networks
177 Annex
Concentrator
Concentrator
Note: VDSL can be provided if local loop is short enough; GPON = Gigabit Passive Optical Network
Source: Analysys Mason on AGCOM, Notiziario Tecnico Telecom Italia and TI
Router
LE
OLT
Internet
modem
PSTN and/or ADSL/2+
VDSL on FTTC (Fibre to the cabinet)
FTTH (Fibre to the home) / GPON
Splitter & joints
Joints
LE
SLU
~200-3,000 m
MSAN*
LLU
~300-4,000 m
MDF/
ODF
ODF
LE MDF
OLT
DSLAM
IP
Analogue
IP
Internet
modem
or
Analogue
IP
Internet
modem
or
Cabinet
Cabinet
Primary Secondary
Primary Secondary
Copper Fibre
Speed attainable Download (Mbps)
20
55 (VDSL)
Speed attainable Upload (Mbps)
1
3 (VDSL)
100-1,000 100-1,000
Access infrastructure
PS
TN
FT
Tx
Un
derl
yin
g p
hysic
al in
frastr
uctu
re

39166-114 | CONFIDENTIAL
Findim Group
Contact details
178
Joan Obradors
Partner
Emil Arnell
Principal
For any communications regarding this
presentation please contact:
Boudicca Proxy Consultants
Sheryl Cuisia, Managing Director
Maria Siano, Account Manager
Telephone: +44 (0)207 183 0048
Email: [email protected]
Website: www.boudiccaproxy.com/findim-ti
Cambridge
Tel: +44 (0)1223 460600
Fax: +44 (0)1223 460866
Dubai
Tel: +971 (0)4 446 7473
Fax: +971 (0)4 446 9827
Dublin
Tel: +353 (0)1 602 4755
Fax: +353 (0)1 602 4777
Johannesburg
Tel: +27 (0)10 596 8000
Fax: +27 (0)86 504 4764
London
Tel: +44 (0)20 7395 9000
Fax: +44 (0)20 7395 9001
Madrid
Tel: +34 91 399 5016
Fax: +34 91 451 8071
Milan
Tel: +39 02 76 31 88 34
Fax: +39 02 36 50 45 50
New Delhi
Tel: +91 124 4501860
Paris
Tel: +33 (0)1 72 71 96 96
Fax: +33 (0)1 72 71 96 97
Singapore
Tel: +65 6493 6038
Fax: +65 6720 6038
Boston
Tel: +1 202 331 3080
Fax: +1 202 331 3083
Manchester
Tel: +44 (0)161 877 7808
Fax: +44 (0)161 877 7810
0)1223 460866


![(1) DISTRICTS) BILL (2) - parliament.wa.gov.au · 388[ASSEMBLY] Mr Bertranm Mr Bryce Mr B. T. Burke Mr T. J. Burke Mr Carr Mr Davies Mr H. D. Evans Ayes Mr Laurance Mr Rushton Mr](https://static.fdocuments.us/doc/165x107/5b407eb07f8b9aff118d53d3/1-districts-bill-2-388assembly-mr-bertranm-mr-bryce-mr-b-t-burke.jpg)
