Presentation for etfSA March 2012 Nerina Visser · Presentation for etfSA March 2012 Nerina Visser...
40
Making ETFs the Core of your Investment Plans Presentation for etfSA March 2012 Nerina Visser
-
Upload
nguyenkhanh -
Category
Documents
-
view
219 -
download
1
Transcript of Presentation for etfSA March 2012 Nerina Visser · Presentation for etfSA March 2012 Nerina Visser...
Making ETFs the Core of your Investment Plans
Presentation for etfSA
March 2012 Nerina Visser

2
Agenda
• Making the best use of ETFs to meet Investment Objectives
– How to make investment decisions
– How to make sure you get what you need from your investments
• Investment Strategies and Portfolio Construction using ETFs/ETNs
– “How to bake a cake”
– Understand how ETFs can be used to build your investment portfolio
– Understanding risk and volatility
• The growing impact of climate change
– “How to plant and grow a perennial garden”
– The benefit of incorporating the “green advantage” into your portfolio

Making the best use of ETFs to meet Investment Objectives
How to make sure you get what you need from your investments

4
What are your investment objectives?
• To go on an overseas holiday?
• To buy a house?
• To save for your children’s education?
• To retire comfortably?
• To get from Johannesburg to Cape Town!

5
Choose the vehicle that is best suited to your journey
Requirement Best vehicle
Speed Aeroplane
Scenic journey 4x4
Space / size Bus

6
Choose the vehicle that is best suited to your journey
Requirement Best vehicle
Speed Aeroplane
Scenic journey 4x4
Space / size Bus
ETF
investment requirement
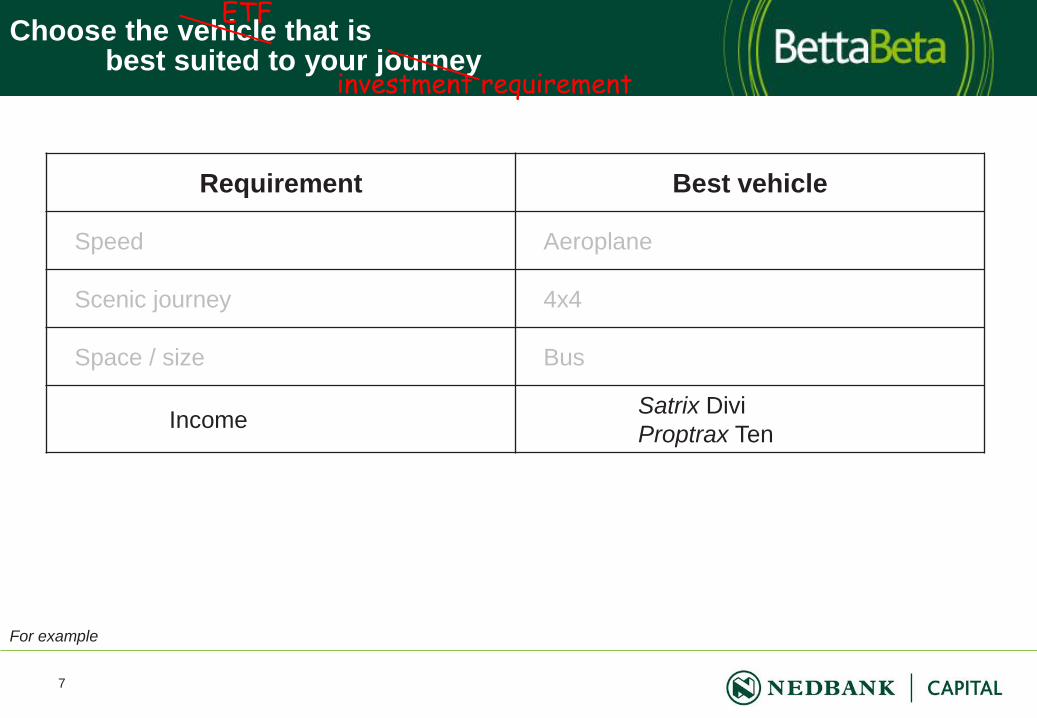
7
Requirement Best vehicle
Speed Aeroplane
Scenic journey 4x4
Space / size Bus
Income Satrix Divi
Proptrax Ten
For example
Choose the vehicle that is best suited to your journey
ETF
investment requirement

8
Requirement Best vehicle
Speed Aeroplane
Scenic journey 4x4
Space / size Bus
Income Satrix Divi
Proptrax Ten
Inflation hedge RMB Inflation-X
NewFunds NewGold
For example
Choose the vehicle that is best suited to your journey
ETF
investment requirement
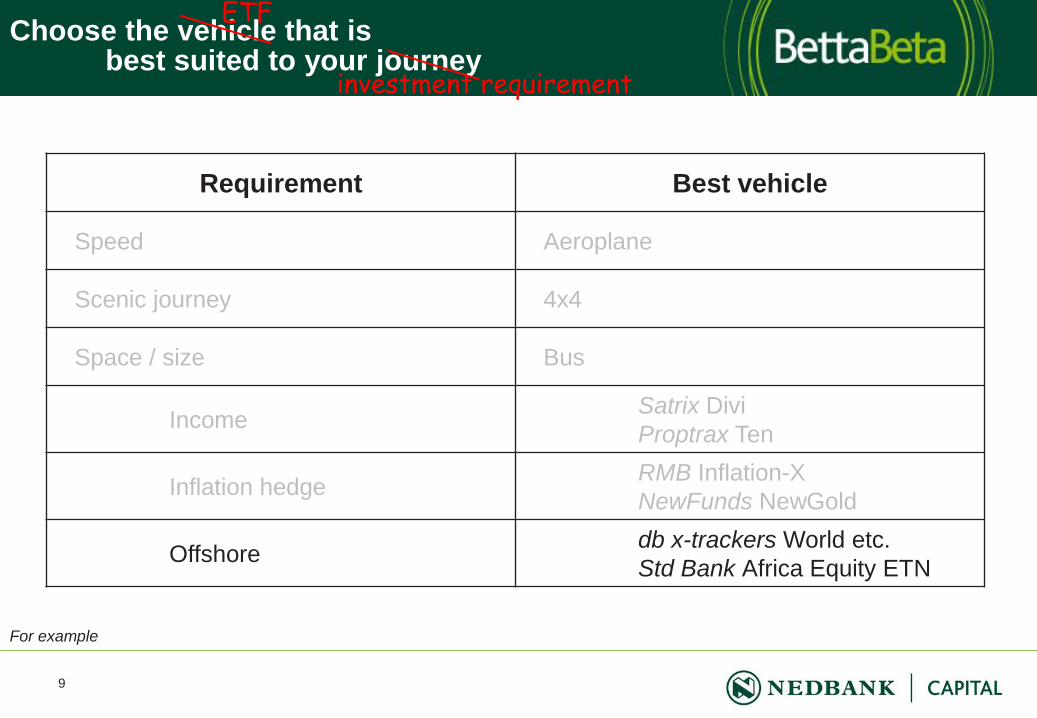
9
Requirement Best vehicle
Speed Aeroplane
Scenic journey 4x4
Space / size Bus
Income Satrix Divi
Proptrax Ten
Inflation hedge RMB Inflation-X
NewFunds NewGold
Offshore db x-trackers World etc.
Std Bank Africa Equity ETN
For example
Choose the vehicle that is best suited to your journey
ETF
investment requirement

10
How do I know what performance to expect from my ETF investment?
• An investment in an ETF gives you the assurance that you will receive the same return as the
underlying asset, which usually means an index such as the Top40, after costs
• Although you do not know in advance what absolute return you will receive, you do know that
you will receive the same return as the index
• This means that an ETF has very low relative risk when compared to the benchmark index
• However, one could still have absolute risk in your investment
– If the index declines by 10%, your ETF investment will also decline by 10%
• Your ETF investment will have the same return and risk characteristics as the index it tracks
Make sure you know what that is!

11
ETFs come with a built in “maintenance plan”!
• The “F” in the ETF is managed for you!
– Periodic rebalancing
– Changes in underlying constituents
– Quarterly distributions
• ETFs represent a more tax efficient investment vehicle
– Dividend Withholding Tax (DWT)
• Fund management expenses are paid from pre-tax income in the fund
• DWT is only payable on the net-of-fees distribution, usually paid quarterly to unit holders
– Capital Gains Tax (CGT)
• All trades within the ETF trust is CGT exempt; CGT only applicable once you sell your ETF investment
• However, remember that there is an initial portion that is tax-free
– Securities Transfer Tax (STT)
• No STT payable on an ETF investment! (0.25% per transaction)
How to bake a cake
Investment Strategies and Portfolio Construction using ETFs/ETNs

13
What do you need to bake a cake?
• Basic ingredients
– Flour, butter, sugar, eggs, milk, raising agent
• Special ingredients
– Chocolate, nuts, fruit, icing, etc.
• Equipment
– Measuring cups, baking trays, oven, mixing
spoons, etc.
14
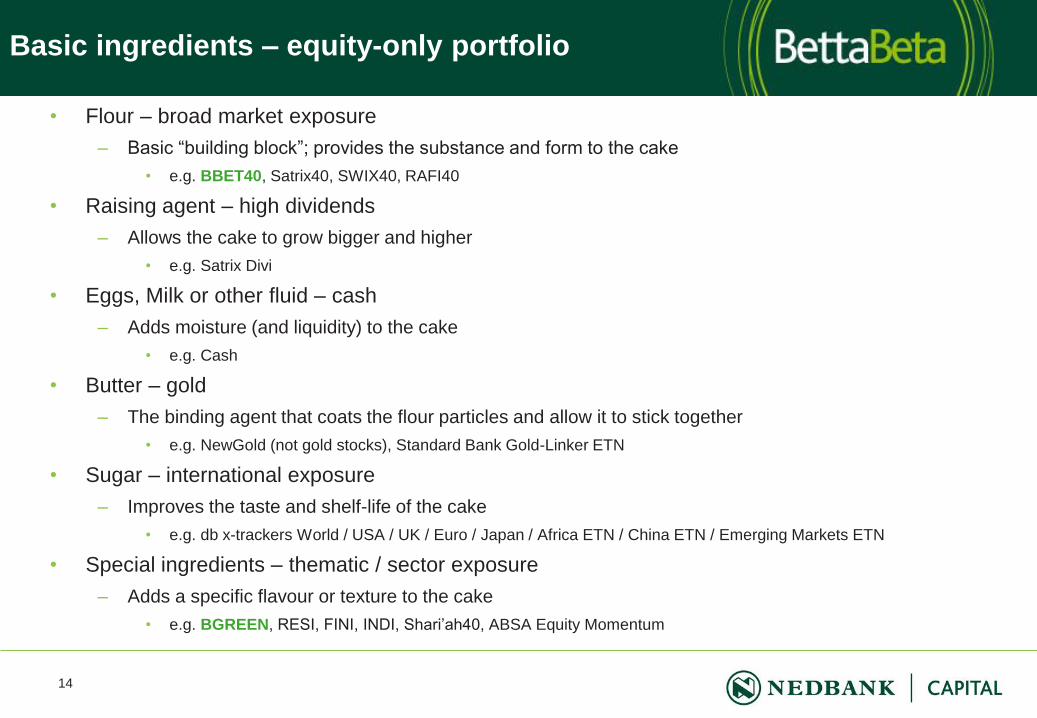
Basic ingredients – equity-only portfolio
• Flour – broad market exposure
– Basic “building block”; provides the substance and form to the cake
• e.g. BBET40, Satrix40, SWIX40, RAFI40
• Raising agent – high dividends
– Allows the cake to grow bigger and higher
• e.g. Satrix Divi
• Eggs, Milk or other fluid – cash
– Adds moisture (and liquidity) to the cake
• e.g. Cash
• Butter – gold
– The binding agent that coats the flour particles and allow it to stick together
• e.g. NewGold (not gold stocks), Standard Bank Gold-Linker ETN
• Sugar – international exposure
– Improves the taste and shelf-life of the cake
• e.g. db x-trackers World / USA / UK / Euro / Japan / Africa ETN / China ETN / Emerging Markets ETN
• Special ingredients – thematic / sector exposure
– Adds a specific flavour or texture to the cake
• e.g. BGREEN, RESI, FINI, INDI, Shari’ah40, ABSA Equity Momentum

15
Basic ingredients – balanced fund portfolio
• Flour – broad market exposure, both equities and bonds
– Basic “building block”; provides the substance and form to the cake
• e.g. BBET40, Satrix40, SWIX40, RAFI40, Investec ZGOVI, BIPS Inflation-X
• Raising agent – high dividends, listed property
– Allows the cake to grow bigger and higher
• e.g. Satrix Divi, Proptrax
• Eggs, Milk or other fluid – cash
– Adds moisture (and liquidity) to the cake
• e.g. Cash
• Butter – gold
– The binding agent that coats the flour particles and allow it to stick together
• e.g. NewGold (not gold stocks), Standard Bank Gold-Linker ETN
• Sugar – international exposure
– Improves the taste and shelf-life of the cake
• e.g. db x-trackers World / USA / UK / Euro / Japan / Africa ETN / China ETN / Emerging Markets ETN
• Special ingredients – thematic / sector exposure, commodities
– Adds a specific flavour or texture to the cake
• e.g. BGREEN, RESI, FINI, INDI, Shari’ah40, ABSA Equity Momentum, Standard Bank Commodity-Linker ETNs

16
• Read the label on the packet
• As index-tracking funds, ETFs are completely transparent
• The “list of ingredients” can be found on the daily valuation statistics published on the website
– e.g. Satrix INDI 25
– Not a domestic industrial index any longer
How do you know what are in your “ingredients”?

17
Three sample recipes for Extremely Tasty Flop-free Cakes
• Linda’s Lekker Low-risk Lake
– Very low risk tolerance; Focus on capital protection and income generation
– 5% after tax income draw-down p.a.
• Mandla’s Marvelous Medium-risk Make
– Average risk tolerance; Combine capital growth and some income generation
– 2% after tax income draw-down p.a.
• Humphrey’s Hearty High-risk Hake
– Very high risk tolerance; Focus on maximum capital gain
– No income draw-down required

18
“Extremely Tasty Flop-free cakes” investment in different ETFs
Potential ETF “Ingredients” L M H
Flour
BBET40 – BettaBeta Equally Weighted Top40 ETF 15 35 40
ZGOVI – zShares Govi ETF 10 10 10
RMBINF – RMB Inflation-X ETF 20 5 –
Raising
agent
STXDIV – Satrix Divi ETF 10 5 –
PTXTEN – Property Tracker Ten ETF 10 5 –
Fluids Cash 10 5 –
Butter GLD – NewFunds NewGold ETF 5 10 5
Sugar MXWO – DBX World ETF 10 10 15
MSEMFI – DB MSCI Emerging Markets ETN – 5 10
Special
ingredients
BGREEN – BettaBeta Be Green ETF 10 10 10
SBAOIL – Standard Bank Oil ETN – – 10

19
“Extremely Tasty Flop-free cakes” % investment in different ETFs
Potential ETF “Ingredients” Low (%) Med (%) High (%)
Flour
BBET40 – BettaBeta Equally Weighted Top40 ETF 15 35 40
ZGOVI – zShares Govi ETF 10 10 10
RMBINF – RMB Inflation-X ETF 20 5 –
Raising
agent
STXDIV – Satrix Divi ETF 10 5 –
PTXTEN – Property Tracker Ten ETF 10 5 –
Fluids Cash 10 5 –
Butter GLD – NewFunds NewGold ETF 5 10 5
Sugar MXWO – DBX World ETF 10 10 15
MSEMFI – DB MSCI Emerging Markets ETN – 5 10
Special
ingredients
BGREEN – BettaBeta Be Green ETF 10 10 10
SBAOIL – Standard Bank Oil ETN – – 10 Disclaimer: Not to be construed as a recommendation or as investment advice
20
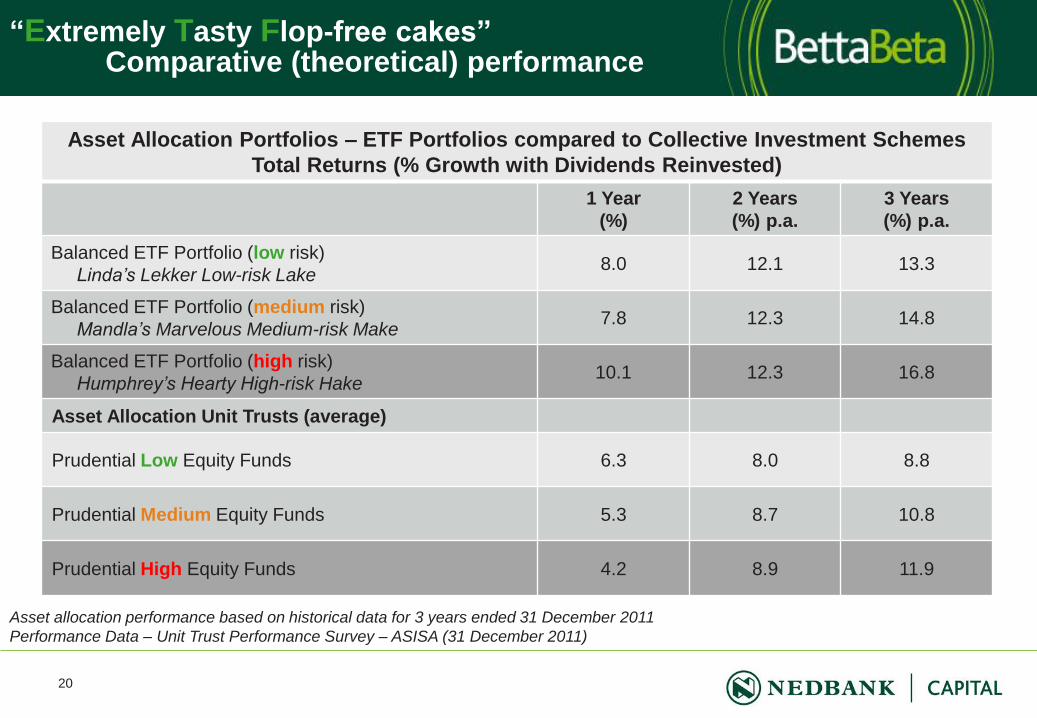
“Extremely Tasty Flop-free cakes” Comparative (theoretical) performance
Asset allocation performance based on historical data for 3 years ended 31 December 2011
Performance Data – Unit Trust Performance Survey – ASISA (31 December 2011)
Asset Allocation Portfolios – ETF Portfolios compared to Collective Investment Schemes
Total Returns (% Growth with Dividends Reinvested)
1 Year
(%)
2 Years
(%) p.a.
3 Years
(%) p.a.
Balanced ETF Portfolio (low risk)
Linda’s Lekker Low-risk Lake 8.0 12.1 13.3
Balanced ETF Portfolio (medium risk)
Mandla’s Marvelous Medium-risk Make 7.8 12.3 14.8
Balanced ETF Portfolio (high risk)
Humphrey’s Hearty High-risk Hake 10.1 12.3 16.8
Asset Allocation Unit Trusts (average)
Prudential Low Equity Funds 6.3 8.0 8.8
Prudential Medium Equity Funds 5.3 8.7 10.8
Prudential High Equity Funds 4.2 8.9 11.9

21
Equipment
• Measuring cup
– How much of what depends entirely on your investment objectives and risk tolerance
• Mixing spoons
– “One of the secrets to a successful cake is not to mix it too much – it makes the texture dense
and the cake will not rise as much”
– Decide on your desired exposures, invest accordingly and don’t “over-mix”
• Baking tray
– etfSA account
• Oven
– Stock exchange
– “Remember not to open the oven door too soon during the baking process”
Understanding risk and volatility
The differences behind different weighting methodologies
and the role of equal weighting in a portfolio

23
• Two funds, both with an average return of 12% p.a., but different levels of volatility
• Fund A: 10% p.a. volatility vs. Fund B: 20% p.a. volatility
• On a compound return basis, Fund A outperforms Fund B by 30% over 20 years
Volatility – the silent killer

24
BettaBeta Equally Weighted Top 40 ETF – Relative Performance since inception
Performance (annualised) since listing (25-Mar-10): Highest return – Lowest risk
16.1 17.7 17.1
Performance of ETFs from 25-Mar-10 to 29-Feb-12 on an NAV basis; Source: Nedbank Capital
Risk (% standard
deviation p.a.) 17.7 20.3

25
Top 40 index (TOPI) – Stock-specific Exposure
TOPI ETOP
RESI
FINI
INDI
TOPI does not provide
the necessary “ground
clearance” for the
bumpy ride of the JSE
Top 2 names
(BIL and AGL)
≈ 25% of index
Top 5 names
≈ 50% of index
Bottom 10 names
≈ 5% of index

26
Equally Weighted Top 40 Index (ETOP) compared to Market Cap Weighted Top 40 Index (TOPI)
TOPI ETOP
RESI
FINI
INDI
ETOP provides a
much “smoother ride”

27
Top 40 indices – Historical Performance
Equal weighting gives a similar return but at much lower risk!
All indices are total return and based at 1000 at Dec-02
How to grow a perennial garden
Incorporating the “green advantage” into your investment portfolio

29
What is required for a perennial garden?
“Perennial plants are the backbone of nearly every flower garden. Unlike annual plants, which must
be replanted each spring, perennials regrow from the same roots every year. People grow
perennial plants because they are such easy-care, dependable performers, and because they offer
an enormous variety of color, texture and form.”
What is required for a perennial garden?
• Healthy, fertile soil
• Good planning
• Regular tending and watering
• Correct plant selection!

30
• Source of information must independent, objective, transparent, consistent and reputable
• The Carbon Disclosure Project (“CDP”) is an independent not-for-profit international organisation
holding the largest database of primary corporate climate change information in the world
• The Top 100 companies on the JSE are rated on the basis of the disclosure and performance of
their response to climate change and how they manage it
• The Nedbank Green Index uses the Disclosure scores for constituent selection and the
Performance ratings for the weight in the index
• Top 10 holdings in the index:
Source: Nedbank Capital; as at 29-Feb-12
Weight in Nedbank Green Index (%)
EXX Exxaro Resources 4.2
WHL Woolworths Holdings 4.0
REM Remgro 3.8
GFI Gold Fields 3.8
NED Nedbank Group 3.8
BTI British Am. Tobacco 3.7
MND Mondi Ltd 3.3
PIK Pick N Pay 3.2
BAW Barloworld 3.1
SNT Santam 3.1
Company
Nedbank Green Index – finding green companies

31
Why NOT green investing?
A UNEP FI / UNISA survey
found that the
single greatest barrier
to responsible investing in SA is
the belief that responsible investing results in underperformance

32
Rationale for Green Investing
• There is growing awareness that Environmental, Social and Governance (“ESG”) factors
affect the (financial) bottom line and as such influence investment performance
• Example: Goldfields – Beatrix Methane Gas Project
– Extracting methane gas from the underground mine areas reduces the risk of explosions and
thereby improves the safety in the mining operations
→ Increase turnover (higher probability of meeting production targets)
– The extracted methane gas is used as an alternative source of energy thereby reducing the cost of
electricity
→ Reduce expenses
– The company receives carbon credits for the reduction in carbon emissions
→ Additional revenue earned
• Improved financial performance results in superior investment performance

33
Cumulative outperformance since inception: >40% vs. the ALSI
Source: Nedbank Capital; As at 29-Feb-12
Performance of Nedbank Green Index vs. All Share Index (ALSI) & Socially Responsible Investment Index (SRI)
Why NOT green investing!

34
• Past performance is no guarantee of future performance
• We cannot guarantee
– the absolute level of the future performance
– the level of relative outperformance
• What we can guarantee is
– the rules-based process behind the stock selection
Important disclaimer!
*Source: Riscura Analytics
• Independent* attribution analysis on the relative
performance proves that the outperformance
comes primarily from stock selection
35
What is the “green advantage”?
• Managing environmental risks and opportunities affects financial outcomes
• It is a “rating system” that identifies quality of management – how does a company deal with
change and challenges
– It separates the victors from the victims
• Being environmentally responsible does not have to come at a cost in performance
• Investing in companies with strong environmental credentials incentivises companies to
behave responsibly and allows investors to act on their environmental convictions
• The BettaBeta Be Green ETF (share code: BGREEN) provides exactly such an investment
opportunity
36
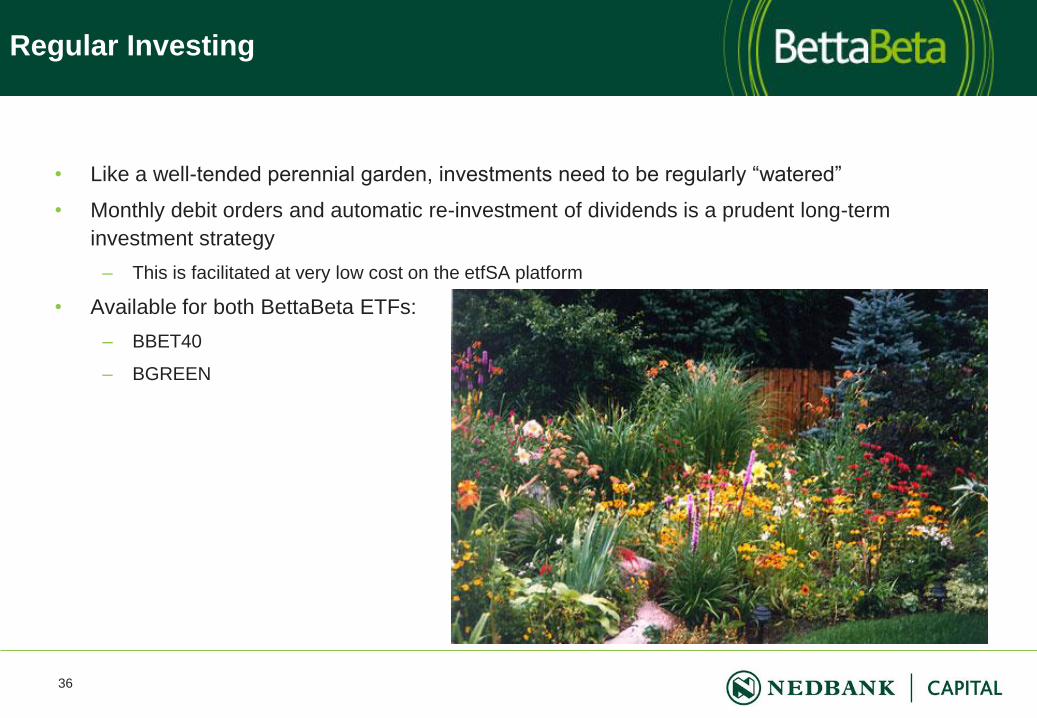
Regular Investing
• Like a well-tended perennial garden, investments need to be regularly “watered”
• Monthly debit orders and automatic re-investment of dividends is a prudent long-term
investment strategy
– This is facilitated at very low cost on the etfSA platform
• Available for both BettaBeta ETFs:
– BBET40
– BGREEN

37
Thank You
For more information, please refer to our website: www.bettabeta.co.za
38
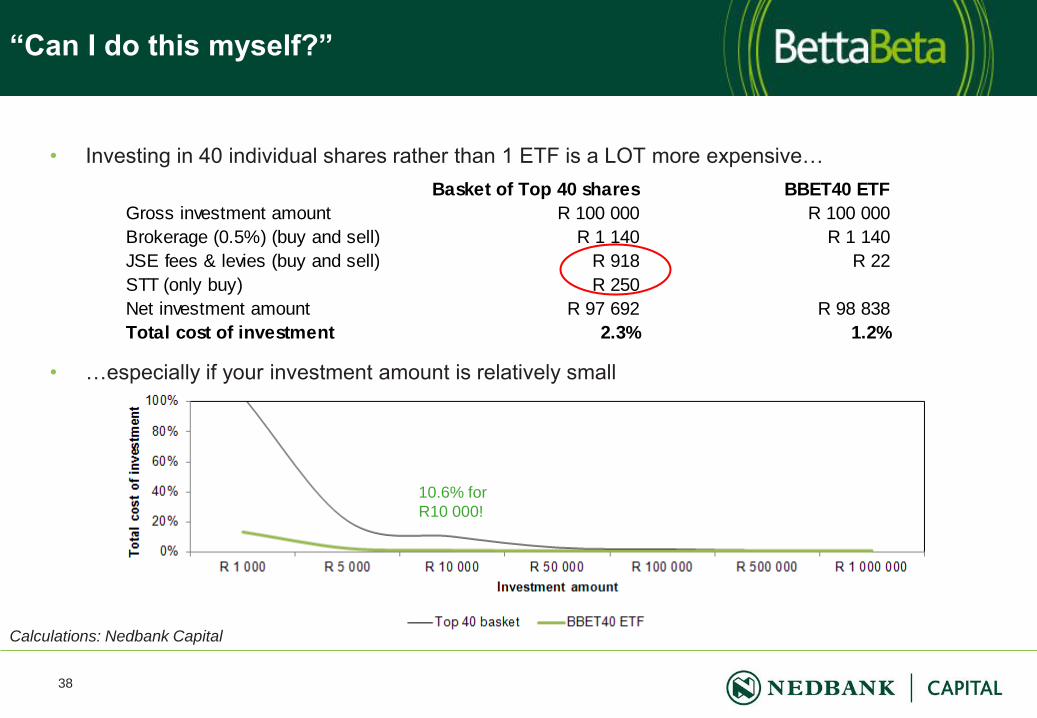
• Investing in 40 individual shares rather than 1 ETF is a LOT more expensive…
• …especially if your investment amount is relatively small
Basket of Top 40 shares BBET40 ETF
Gross investment amount R 100 000 R 100 000
Brokerage (0.5%) (buy and sell) R 1 140 R 1 140
JSE fees & levies (buy and sell) R 918 R 22
STT (only buy) R 250
Net investment amount R 97 692 R 98 838
Total cost of investment 2.3% 1.2%
“Can I do this myself?”
10.6% for
R10 000!
Calculations: Nedbank Capital

39
What ETF / ETN options are available?
Asset class Category ETFs available
Equities
only
Broad market
access
BettaBeta Equally Weighted Top40 (BBET40) Satrix40, SWIX and
RAFI, BIPS40, NewFunds eRAFI, Stanlib40 and SWIX
Sector
exposure
Satrix RESI10, FINI15 and INDI25
NewFunds eRAFI RESI20, FINI15 and INDI25
Listed property Proptrax, Proptrax Ten
Style / thematic BettaBeta Be Green (BGREEN) Satrix Divi, NewFunds Shari’ah40,
NewRand, NewSA and Equity Momentum
Fixed
interest only
Regular bonds z-shares GOVI, NewFunds GOVI
Inflation-linked
bonds
BIPS Inflation-X, NewFunds ILBI
Foreign
exposure
Foreign equity
markets
db x-trackers World, USA, UK, Euro, Japan, Africa, China, Emerging
Markets, Standard Bank Africa
Alternative
investments
Commodities NewFunds NewGold, Standard Bank Commodity-linkers (Gold, Silver,
Platinum, Palladium, Copper, Corn, Oil, Wheat, Commodity basket)
Multi-asset Balanced funds NewFunds MAPPS Protect and Growth

40
Why (physical) gold in an investment portfolio?
• Gold is often considered a high risk investment, but over the last 16 years, it has
been no more risky than South African equities!
*Jun-95 is the inception of the current All Share index data
• Its most important contribution relates to its diversification benefits – thanks to
negative correlations