Presentation for ESDM PV Workshop · 2013-07-30 · Presentation for ESDM PV Workshop July 15th,...
21
Presentation Presentation for ESDM PV Workshop July 15th, 2008 KANEKA CORPORATION
Transcript of Presentation for ESDM PV Workshop · 2013-07-30 · Presentation for ESDM PV Workshop July 15th,...

PresentationPresentation for ESDM PV Workshopp
July 15th, 2008KANEKA CORPORATION

What is solar PV system
Off-grid Application: SHS (Solar Home System)
*PV : Photovoltaic → Photon + voltaic →produce electricity from sunlight
g pp ( y )
What is solar PV systemOff-grid Application: PV Hybrid system (PV + Diesel genset)
What is solar PV systemOn-grid Application: Residential PV system

What is solar PV systemOn-grid Application: Large-scale PV system
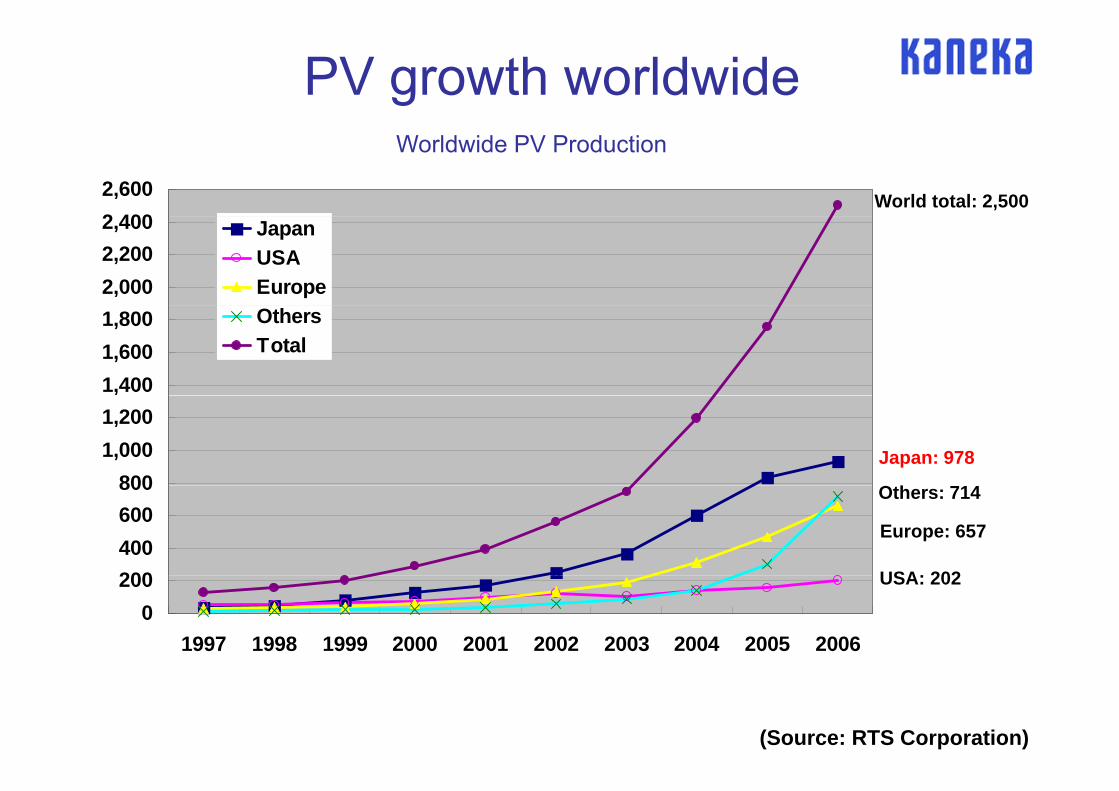
PV growth worldwide
2 4002,600 World total: 2,500
Worldwide PV Production
2,0002,2002,400 Japan
USAEurope
1,4001,6001,800 Others
Total
8001,0001,200
Japan: 978
O
200400600800 Others: 714
Europe: 657
USA: 202
0200
1997 1998 1999 2000 2001 2002 2003 2004 2005 2006
USA: 202
(Source: RTS Corporation)

PV growth worldwideCumulative worldwide PV installation
1600.0
Australia
Cumulative worldwide PV installation
1200.0
1400.0 AustraliaSwitzerlandGermanySpain
1000.0FranceItalyJapanNetherland
600.0
800.0 NetherlandUSA
400.0
0.0
200.0
1992 1993 1994 1995 1996 1997 1998 1999 2000 2001 2002 2003 2004 2005
(Source: RTS Corporation, Solarbuzz)
1992 1993 1994 1995 1996 1997 1998 1999 2000 2001 2002 2003 2004 2005

PV growth worldwidegWorldwide PV installations by market in 2007
Japan
Rest of World,226MW, 8%
Japan,226MW, 8%
Rest of
USA, 226MW,8%
Rest ofEurope,
170MW, 6%
Germany,1,328MW,
47%Spain,
650MW, 23% %650MW, 23%
(Source: Solarbuzz)

PV power generation cost trendPV C l i PV i
p g
3701 422
400 1,600
PV system cost(10thousands yen/kWp)
Cumulative PV capacity(MW)- Japan case -
1,422
300
350
1 200
1,400System price per kWp
Power generation cost per kWh
Cumulative PV capacity (Total)
¥260/kWh1,132 1,119
250
300
1,000
1,200Cumulative PV capacity (Total)
Cumulative PV capacity(Residential)
Subsidy: 900K Yen/kWp200
170
637
860
620
859
150
200
600
800
Subsidy: 900K Yen/kWp
120104 102 93 84 75 71 69 67 66¥120/kWh
¥140/kWh
¥65/kWh 330
452
280
430100
150
400
600Subsidy: 20K Yen/kWp
¥71/kWh¥72/kWh¥82/kWh
¥58/kWh¥52/kWh¥49/kWh¥48/kWh¥46/kWh¥46/kWh
24 31 43 60 91133
209
2 6 13 33 57115
189280
0
50
0
200
1993 1994 1995 1996 1997 1998 1999 2000 2001 2002 2003 2004 2005Year
(Source: Source: Ministry of Economy, Trade and Industry of Japan)

PV incentives
(Source: JPEA)

Feed-In TariffCase of Germany and Spain
Application SizeFIT
EUR/kWhDecrease fromthe past year Application Size
FITEUR/kWh
Decrease fromthe past year
≦30kW 0.4921 ≦30kW 0.4675
Until 2008/12Until 2007/12
30~100kW 0.4682 30~100kW 0.4448100~1,000kW 0.4630
100~1,000kW 0.4399
>1,000kW - - >1,000kW 0.4399 -
F l d 0 3796 6 5% F l d 0 3549 6 5%
Germany
Rooftop5% 5%
Rooftop
Free land - 0.3796 6.5% Free land - 0.3549 6.5%
Period Period20years 20years
DraftUntil 2008/9
Application SizeFIT
EUR/kWhDecrease fromthe past year Application Size
FITEUR/kWh
Decrease fromthe past year
≦100kW 0.44 ≦20kW 0.44100kW~10,000kW 0.4175 20~200kW 0.39Rooftop
-10,000kW 0.4175 20 200kW 0.39
>200kW 0.33
Free land - 0.31
Cap/Period Cap/Period
Spain
up to 1,200MW/25years
-
up to 1,200MW/25years
All application
p pp , y p , y

Case study: Investment to large-scale PV systemI f Si PVIn case of c-Si PV sysem:
Free land installation in Germany EUR/Wp EUR/200kWp
System cost 3.619 723,702
(I) PaymentCash 0.724 144,740Preferential loan (Payback period: 15yrs/Annual interest: 3.5%) 2.895 578,962Payment total 3.619 723,702
(II) Annual expenditureRepair cost 0.023 4,600Insurance cost 0.013 2,600Miscellaneous 0.012 2,400
Revenue is calculated
Annual expenditure total 0.048 9,600
(III) Amount repaidLoan repayment 3.854 770,829Annual expenditure x 20yrs (inflation rate 2.5%) 1.226 245,232Revenue is calculated
based on:-Generated output power is estimated as 900kWh/kWp/year in
Amount repaid total 5.080 1,016,061
(IV) RevenueIncome from electric power selling(Installation on March, FIT: EUR0.355/kWh for 20yrs) 6.477 1,295,475900kWh/kWp/year in
Germany.
( y )Interest income from electric power selling amount 0.325 64,951Revenue total 6.802 1,360,425
(V) Calculation of profits and lossesRevenue in 20yrs 1.722 344,364y ,Investment amount 0.724 144,740
Asset management ratio 2.379Asset management yield 4.43%
(Remarks) These are just estimated figures for reference and are not guaranteed ones.

Case study: Investment to large-scale PV systemIn case of c Si PV sysem:In case of c-Si PV sysem:
Free land installation in Germany EUR/Wp EUR/200kWp
System cost 3.619 723,702
(I) PaymentCash 0.724 144,740Preferential loan (Payback period: 15yrs/Annual interest: 3.5%) 2.895 578,962Payment total 3.619 723,702
(II) Annual expenditureRepair cost 0.023 4,600Insurance cost 0.013 2,600Miscellaneous 0.012 2,400Annual expenditure total 0.048 9,600
(III) Amount repaidLoan repayment 3.854 770,829Annual expenditure x 20yrs (inflation rate 2.5%) 1.226 245,232
Revenue is calculated based on:-Generated output power is estimated as
p y ( )Amount repaid total 5.080 1,016,061
(IV) RevenueIncome from electric power selling(Installation on March, FIT: EUR0.355/kWh for 20yrs) 7.514 1,502,751
1,044kWh/kWp/year like Indonesia.
( , y ) , ,Interest income from electric power selling amount 0.377 75,303Revenue total 7.890 1,578,053
(V) Calculation of profits and lossesRevenue in 20yrs 2.810 561,992Revenue in 20yrs 2.810 561,992Investment amount 0.724 144,740
Asset management ratio 3.883Asset management yield 7.02%
(Remarks) These are just estimated figures for reference and are not guaranteed ones.
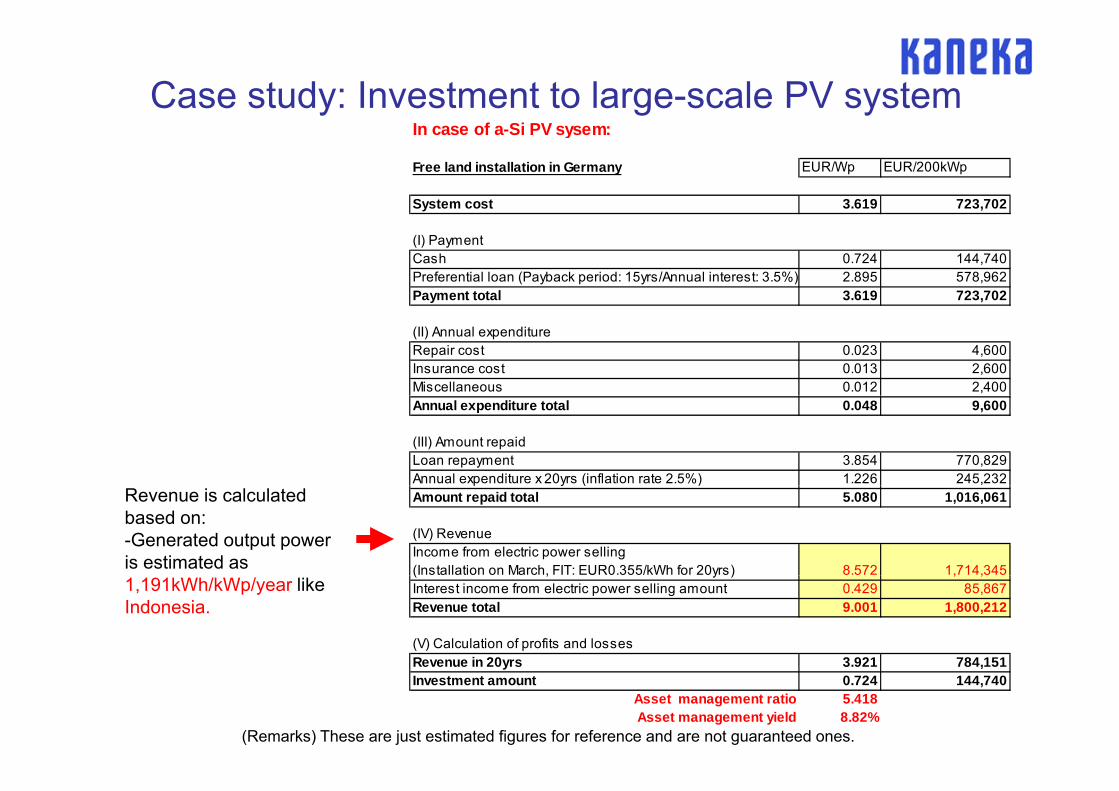
Case study: Investment to large-scale PV systemIn case of a Si PV sysem:In case of a-Si PV sysem:
Free land installation in Germany EUR/Wp EUR/200kWp
System cost 3.619 723,702
(I) PaymentCash 0.724 144,740Preferential loan (Payback period: 15yrs/Annual interest: 3.5%) 2.895 578,962Payment total 3.619 723,702
(II) Annual expenditureRepair cost 0.023 4,600Insurance cost 0.013 2,600Miscellaneous 0.012 2,400Annual expenditure total 0.048 9,600
(III) Amount repaidLoan repayment 3.854 770,829Annual expenditure x 20yrs (inflation rate 2.5%) 1.226 245,232
Revenue is calculated based on:-Generated output power is estimated as
p y ( )Amount repaid total 5.080 1,016,061
(IV) RevenueIncome from electric power selling(Installation on March, FIT: EUR0.355/kWh for 20yrs) 8.572 1,714,345
1,191kWh/kWp/year like Indonesia.
( , y ) , ,Interest income from electric power selling amount 0.429 85,867Revenue total 9.001 1,800,212
(V) Calculation of profits and lossesRevenue in 20yrs 3.921 784,151Revenue in 20yrs 3.921 784,151Investment amount 0.724 144,740
Asset management ratio 5.418Asset management yield 8.82%
(Remarks) These are just estimated figures for reference and are not guaranteed ones.
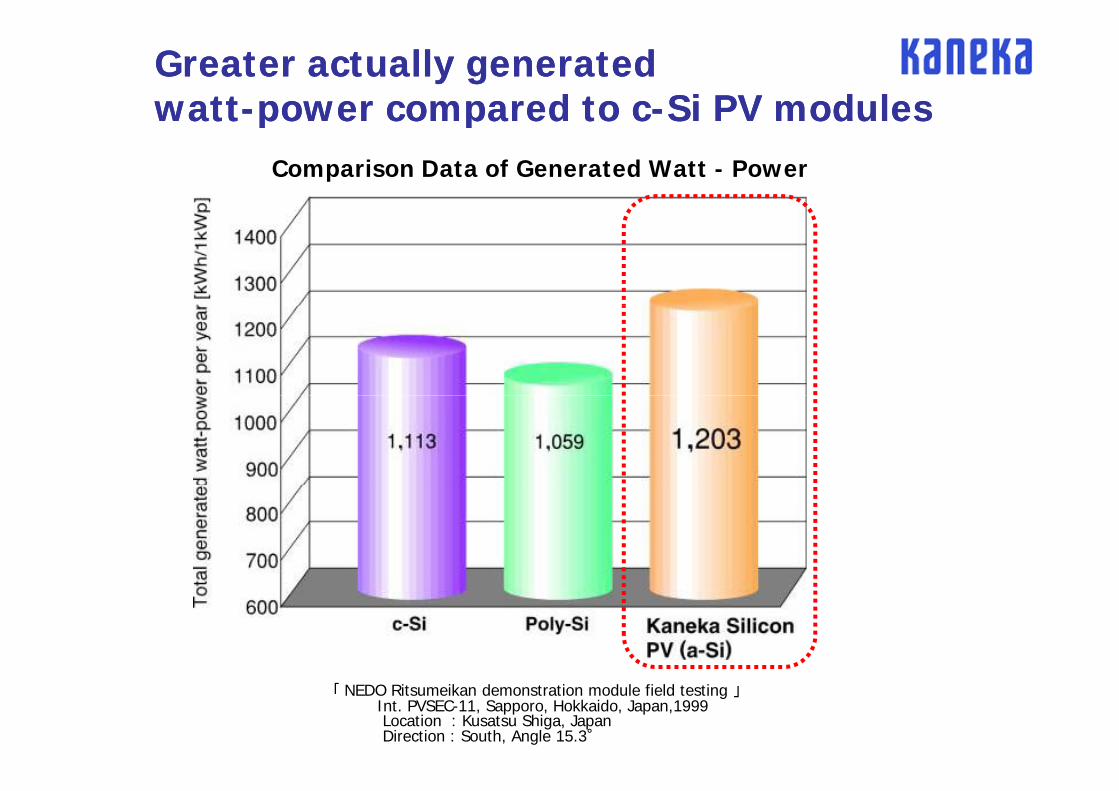
Greater actually generated Greater actually generated wattwatt--power compared to cpower compared to c--Si PV modulesSi PV modules
Comparison Data of Generated Watt - Power
p pp p
「 NEDO Ritsumeikan demonstration module field testing 」Int. PVSEC-11, Sapporo, Hokkaido, Japan,1999Location : Kusatsu Shiga, JapanDirection : South, Angle 15.3°

Superior performance under highSuperior performance under high--temperaturetemperaturemakes real difference in actual generated wattmakes real difference in actual generated watt--powerpower
160 30Si
makes real difference in actual generated wattmakes real difference in actual generated watt powerpowerComparison of total generated watt-power per month
kWh]
(Temp: )
120
14025
c-SiPoly-SiKaneka a-Si
Temp(℃ )r per
1kW
p[k
80
100
15
20p( )
wat
t-pow
er
40
60
80
10
15
y ge
nera
ted
20
405
Tota
l mon
thl
01 2 3 4 5 6 7 8 9 10 11 12
0
T
1999 1998「 NEDO Ritsumeikan demonstration module field testing 」
Int. PVSEC-11, Sapporo, Hokkaido, Japan,1999Location : Kusatsu Shiga, JapanDirection : South, Angle 15.3°
*Temperature data: Location=Ohtsu Shiga, Source=Japan Meteorological Agency
1999 1998
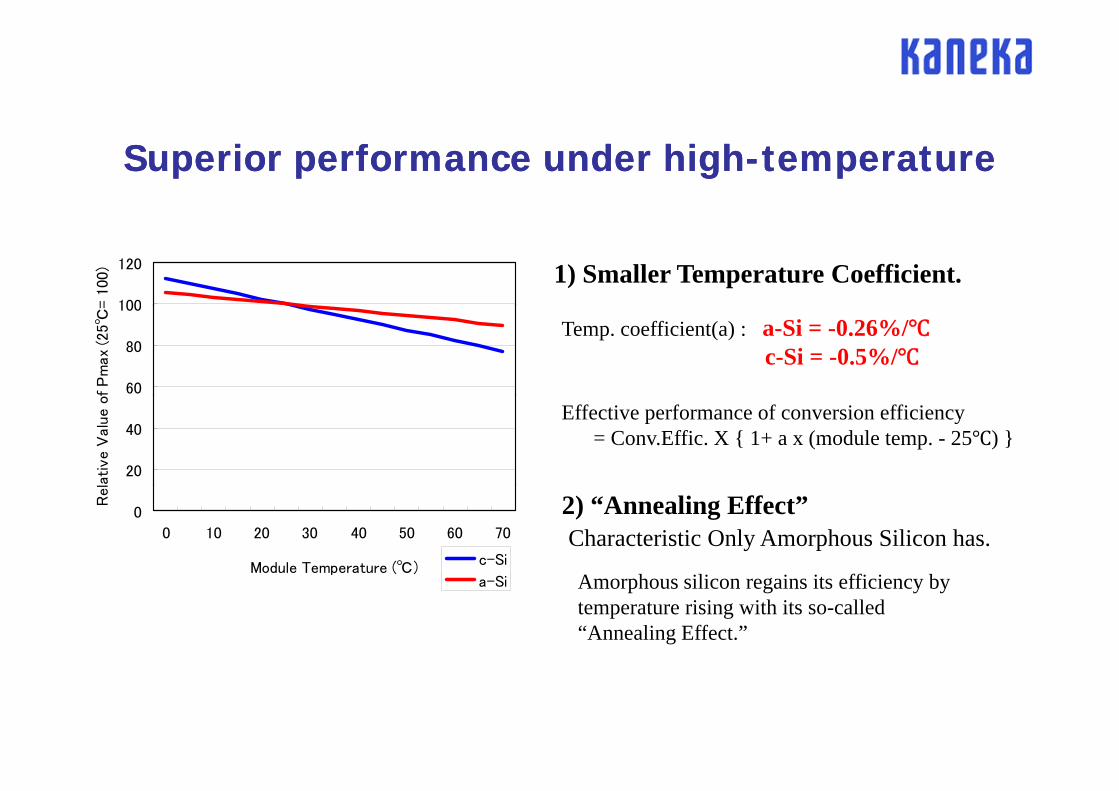
Superior performance under highSuperior performance under high--temperaturetemperature
100
120
= 1
00) 1) Smaller Temperature Coefficient.
60
80
100
f P
max
(25℃
=
Temp. coefficient(a) : a-Si = -0.26%/c-Si = -0.5%/
20
40
ative V
alu
e o
f
Effective performance of conversion efficiency = Conv.Effic. X { 1+ a x (module temp. - 25 ) }
0
0 10 20 30 40 50 60 70
Module Temperature (℃)
Rel
c-Si
2) “Annealing Effect”Characteristic Only Amorphous Silicon has.
A h ili i i ffi i ba-Si Amorphous silicon regains its efficiency by temperature rising with its so-called “Annealing Effect.”

Actual Generated Output Power of PV System at Thailand
System Overview of SERT System
p y
System Overview of SERT System at Phitsanulok, Thailand
Hybird c-Si:2.88kW
a-Si:3.67kW p-Si:3.66kW
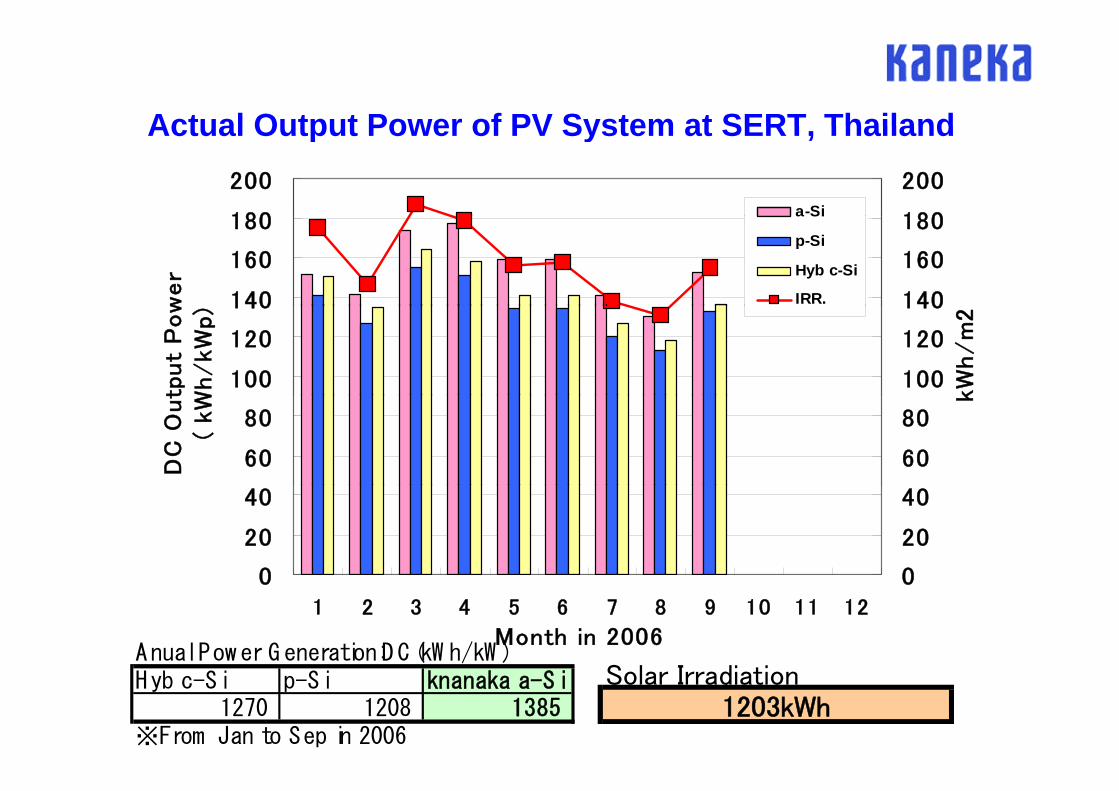
Actual Output Power of PV System at SERT Thailand
180
200
180
200a-Si
Actual Output Power of PV System at SERT, Thailand
140
160
180
wer
140
160
180a Si
p-Si
Hyb c-Si
IRR.
100
120
140
tput
Pow
Wh/kW
p)
100
120
140
kW
h/m
2
60
80
DC
Out
( kW
60
80
k
0
20
40
0
20
40
01 2 3 4 5 6 7 8 9 10 11 12
Month in 2006
0
Anual Pow er G eneration:D C (kW h/kW )SHyb c-Si p-Si knanaka a-Si
1270 1208 1385※From Jan to Sep in 2006
Solar Irradiation1203kWh
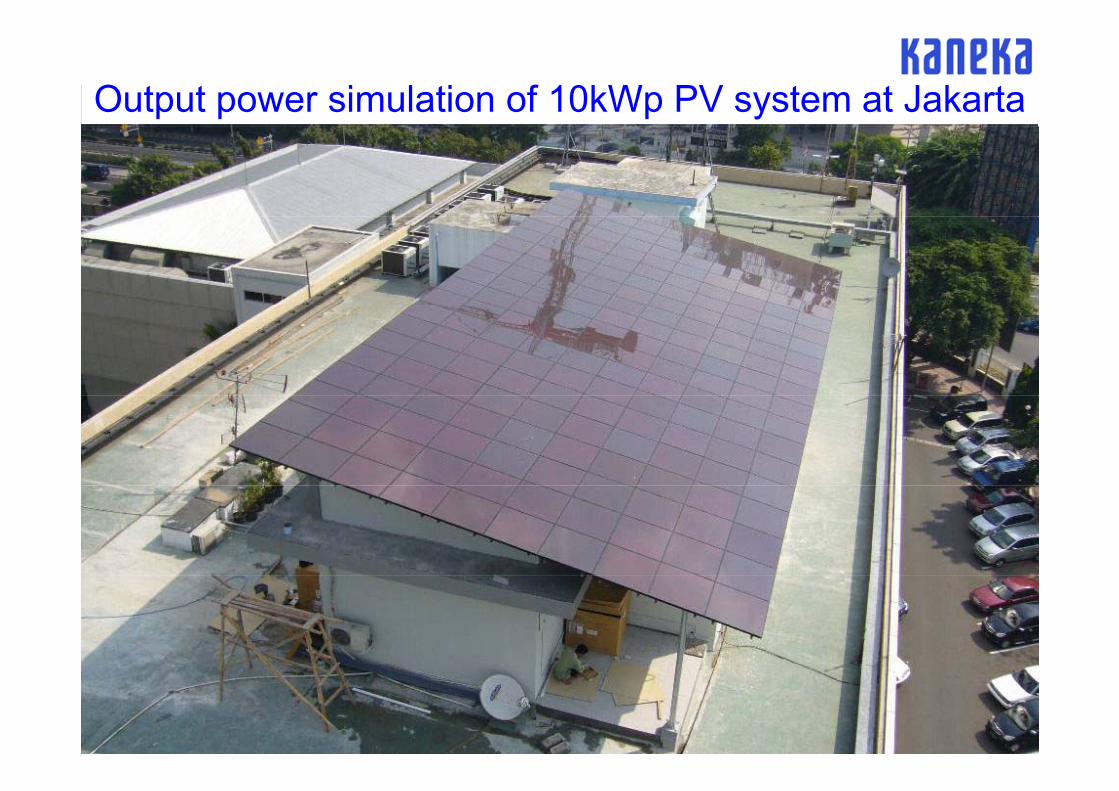
Output power simulation of 10kWp PV system at Jakarta

Output power simulation of 10kWp PV system at Jakarta
1,000
1,200
25
30(kWh) (deg C)
600
800
,
15
20
400
600
10
15
0
200
0
5
Jan Feb Mar Apr May Jun Jul Aug Sep Oct Nov Dec
Irradiation(kWh/m2) 104 114 137 130 133 126 134 141 136 133 108 112
A-Si: AC power (kWh) 776 893 1,097 1,041 1,059 1,007 1,067 1,133 1,093 1,065 827 849
P-Si: AC power (kWh) 721 792 953 902 918 875 926 976 941 923 744 770
Air Temp (deg C) 27 27 28 28 28 28 28 28 28 28 28 28Air Temp.(deg C) 27 27 28 28 28 28 28 28 28 28 28 28
Annual output power by a-Si/10kWp system : 11,906kWh (+14% than p-Si)Annual output power by p-Si/10kWp system : 10,441kWh(Remarks)(1) These are just estimated figures for reference and are not guaranteed ones. (2) AC power of 10kWp system of a-Si PV module and p-Si PV module. (3) Installation point: Jakarta, Indonesia. (4) Installation angle, direction: 10degree, North. (5) Inverter efficiency: 92% (6) Annual irradiation is estimated as 1,507/kWh/m2.