Presentation By Dr Arjoon Suddhoo Executive Director ... Dr Arjoon Suddhoo Executive Director...
56
Presentation Presentation By Dr Arjoon Suddhoo By Dr Arjoon Suddhoo Executive Director Executive Director Mauritius Research Council Mauritius Research Council 29 May 2012 29 May 2012
Transcript of Presentation By Dr Arjoon Suddhoo Executive Director ... Dr Arjoon Suddhoo Executive Director...

PresentationPresentationBy Dr Arjoon SuddhooBy Dr Arjoon Suddhoo
Executive DirectorExecutive DirectorMauritius Research CouncilMauritius Research Council
29 May 201229 May 2012

Overview
A small Island in a Big Ocean Economic & Social Challenges Energy Landscape Marine Renewable Energy Devices– -
Conventional & non-conventional Implications for Mauritius Challenges in implementation A way forward

Towards a Blue Economy(Mauritius)
(From green to a blue evolution)

Where is Mauritius?

Languages used in Mauritius(The Rainbow Nation)
Muticultural
Size 2000 kmsPopulation: 1.3 million

From Sugar to textile, tourism, financial services and ICT sector
Oceanic IndustryOceanic Industry
© http://www.gov.mu © http://www.gov.mu

© http://www.gov.mu
Sugar & Fishing Sector

Textile/Manufacturing Sector

ICT
Financial Services
Tourism
Tourism/Finance/ICT Sector
© http://www.gov.mu © http://www.gov.mu © http://www.gov.mu
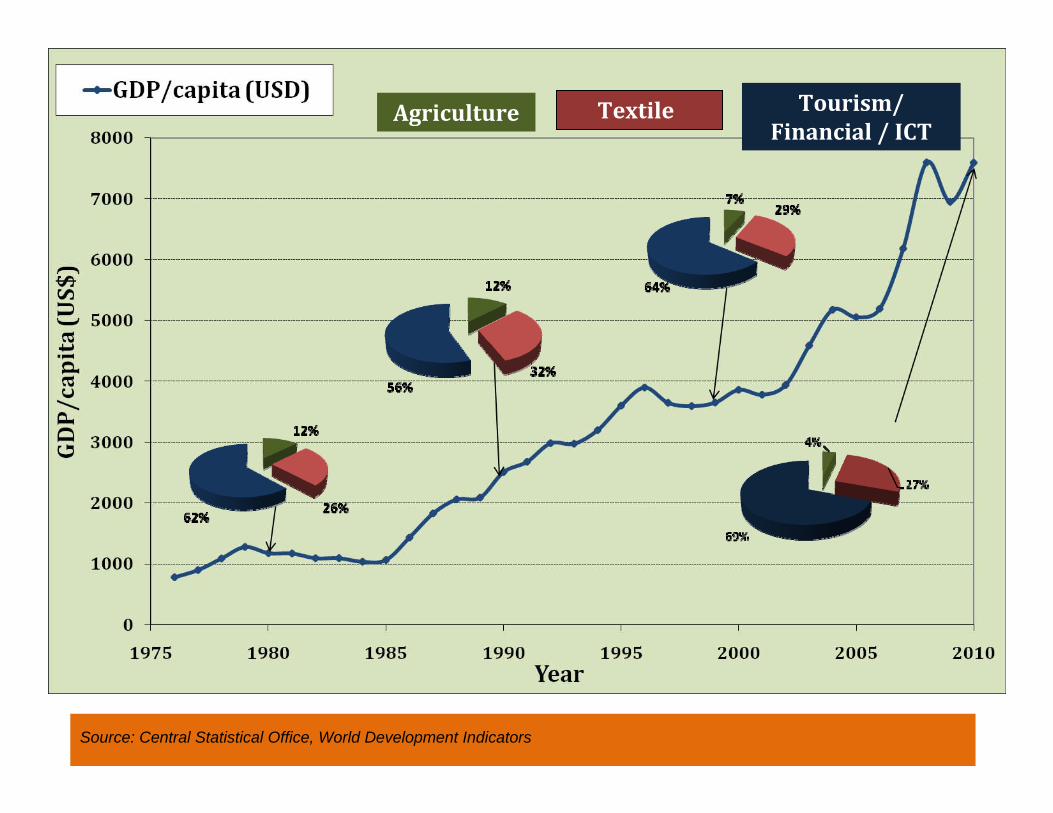
Source: Central Statistical Office, World Development Indicators
Tourism/Financial / ICT
TextileAgriculture

New Economic Order
– Past Economic development supported by preferential trade agreements
– Erosion of long-standing preferences (sugar, textiles)
– Regionalisation & Globalisation– Euro-Centric Economy– Consolidation of existing economic sectors – Paradigm shift in economic strategy– Let us turn to the Ocean !!!

Exclusive Economic Zone of Mauritius

The Blue Evolution
• Exclusive Economic Zone – 2.4 million sq km• 1100 x land space of Mauritius• 4 x size of France• One Third size of Europe• Mauritius is a big OCEAN STATE
“We’ve barely scratched the surface of thatOcean”

‘Blue’ Developments
• Seafood Hub ( Processing + logistics)• Aquaculture (lagoon based)
• Seaweed Industry• Ocean Economy• Ocean State• “The Ocean for Energy”

Ocean for Energy
Oceanfor Food
Ocean for Water
Ocean for Minerals
Ocean for Leisure
Ocean for Health

Marine Based Renewable Energy Potential
Solar Offshore WindWave Tidal Saline Power Marine under water Currents Marine Deep Sea Currents Deep sea water thermal gradients Marine Biomass Integrated Approach

www.siemens.com
Offshore Wind Turbines

The Pelamis Wave Energy Converter
www.marinet.org.uk
www.southampton.ac.uk/business/images/OPIllus.JPG

www.yourownenergy.com
WaveGen Oscillating Wave Column

www.scotsrenewables.com
PowerBuoy
www.rechargenews.com

CETO
www.carnegiewave.com
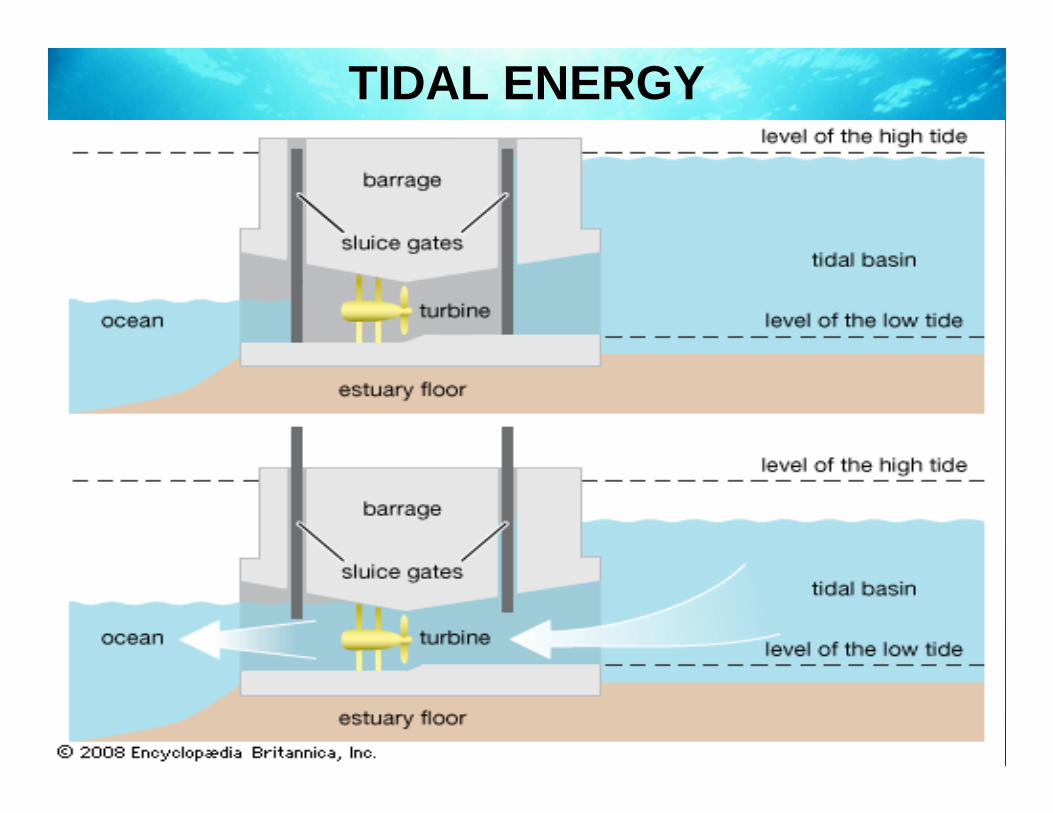
TIDAL ENERGY

http://pemsea.org/eascongress/international-conference/presentation_t4-1 ki df
Sihwa Tidal Power Station, Korea
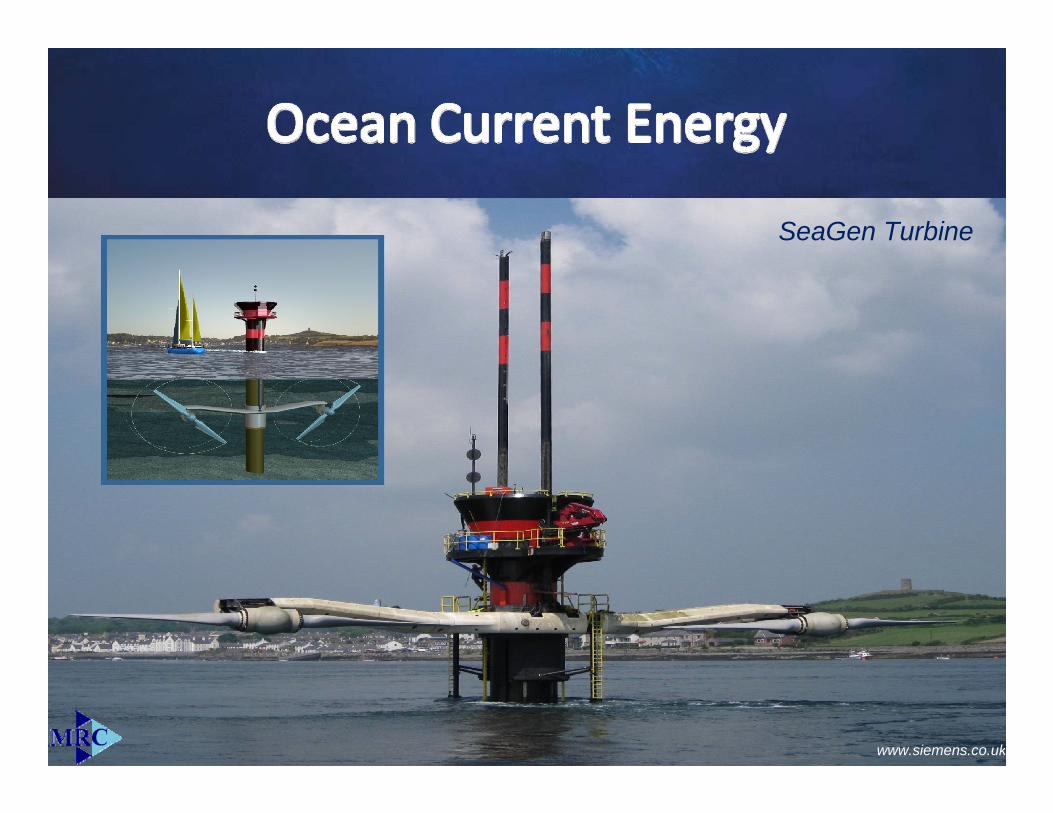
www.siemens.co.uk
SeaGen Turbine

www.euinfrastructure.com
OpenHydro Turbine

www.ocean7.at
Salinity Gradient Power

Offshore Energy Conversion Devices Power Rating
Offshore Wind Turbines 3-5 MW
Pelamis Wave Energy Converter 0.75 MW
WaveGen Oscillating Wave Column
500 kW
PowerBuoy 150 kWSeaGen Turbine 1.2 MW
OpenHydro Turbine 1 MW
DEEP SEA WATER STRATEGY

Deep Ocean Water, Mauritius
Because of the Great Conveyor Belt that arrives in our EEZ, our Deep (>1000m) Sea Water is:
very cold (5 to 6 C)very oldfree from pathogens/pollutantsvery purerich in mineralsrich in nutrients

0
200
400
600
800
1000
1200
1400
1600
1800
2000
0
5
10
15
20
25
30
Depth(m)
Tem
p(°
C)
Mauritius Deep Sea WaterMauritius Deep Sea WaterTemperature Profile
HawaiiMauritius

Mineral content ‐Mauritius
MINERALS (mg/L)DEEP SEAWATER(Averaged)
Calcium 400
Magnesium 1,367
Sodium 10,667
Potassium 420
Bicarbonate 137
Sulphate 2300
Chloride 19,670
Nitrate 0.37
Nitrite < 0.005

Age of Deep Sea Water
Carbon 14 Dating in Perth, Australia
(94.18%MC)
500 Years Old
5 Centuries

AquacultureAquacultureAquacultureSalmon,Salmon,Salmon, Trout, OystersTrout, OystersTrout, Oysters
SeaweedSeaweedSeaweedCultureCultureCulture
Pearl CulturePearl CulturePearl Culture
ThalassotherapyThalassotherapyThalassotherapy
CosmeticsCosmeticsCosmetics
DesalinatedDesalinatedDesalinatedMineral WaterMineral WaterMineral Water
HealthcareHealthcareHealthcareProductsProductsProducts
PharmaceuticsPharmaceutics
AquaponicsAquaponicsAquaponics
InlandInlandInlandTourismTourismTourism
High PurityHigh PurityHigh PurityMarine SaltMarine SaltMarine Salt
Deep Ocean WaterDeep Ocean WaterApplicationsApplications
Environment Friendly
ORGANIC
Jobs & WealthRev: Rs 5 billion yearly
(Foreign Currency)
Democratisationof Economy
Science & TechnologyDriven
RenewableRenewableRenewableEnergyEnergyEnergy

High Quality SaltDesalination
Plant
Deep Sea Bottled Mineral
Water
6oC
20oC
AQUACULTURE
Increase Increase TempTemp
Increase Increase TempTemp
Remove Remove NutrientsNutrients
6o C C
old W
ater
Pipe
25oC
Clean Lagoon
Water discharge
A Land Based Oceanic Industry
High Value Seaweeds, Oysters
& Pearls
Oceanarium
1000M
SPA
Thalassotherapy
Cooling Station
Air Conditioning Hotels/Buildings
Pump
13oC
High Value Fish (Salmon, Lobster)
Low TemperatureRich on NutrientsRich in MineralsMedicinal PropertiesPharmaceutical + therapeutic Properties

Plug to Electricity
Chiller
70
Water130
Water70
Fan
130
Warm Air
WARM SEA WATER
COLD SEA WATER 60
Cold Air
Air ConditioningAir Conditioning
Heat Exchanger

Cold Water
discharge
Desalinated Water
Sun
Mariculture
Nori
AbaloneClamsOystersLobstersShrimpsSalmonSteelhead trout
Warm Water
Kelp
Phytoplankton
Zooplankton
Cold water refrigerationAir-conditioning
Hotel/Buildingair-conditioning
Cold Water
Irrigation
Drinking
Electricity
OTEC
Source: National Renewable Energy LaboratorySource: National Renewable Energy Laboratory
OTEC ApplicationOTEC Application

www.otecorporation.com

The Energy Landscape in Mauritius

0
500
1000
1500
2000
2500
3000
3500
4000
4500
GWh
Electricity Consumption 2000 – 2010‐ 2025
CIA World Factbook, 2011

Long-Term Energy Strategy 2009-2025, Ministry of Renewable Energy & Public Utilities, October
Electricity Generation 2012


Longitude 57.00 E 57.25 E 57.50 E 57.75 E 58.00 ELatitude A B C D E
19.75 S 1 442.498 473.371 495.551 515.574 522.690
20.00 S 2 458.301 467.417 500.606 524.400 539.237
20.25 S 3 462.001 475.254 510.847 570.753 569.039
20.50 S 4 475.254 485.738 521.429 570.129 558.399
20.75 S 5 475.815 506.190 534.517 542.900 536.577
Height h = 80m
Mauritius Offshore Wind Power Density [W/m2]

Simulation of small Offshore wind farms

Conceptual Offshore Wind FarmFlic en Flacq
Sea surface area <50m deep ~ 5 Square kmTurbine Type Repower 5MNo. of turbines 11Rated power PeR 5075 kWDiameter D 126 mOffshore cut‐in wind speed Vc 3.5 m/sOffshore cut‐out wind speed Vf 30 m/sRated wind speed Vr 14 m/sSite Mean Weibull wind speed Vavgw 9.189103486 m/sc 9.704479395k 8.984847526Capacity Factor CF 0.4797871Annual No. of Operating hours 2000 hrsAverage power output 27 MW
Annual Energy Output 54 GWh
30%* of power consumption for Black River
* Assuming average islandwise load distribution to be same as peak power

Conceptual Offshore Wind FarmMahebourg
Sea surface area <50m deep ~ 16 Square kmTurbine Type Repower 5MNo. of turbines 22Rated power PeR 5075 kWDiameter D 126 mOffshore cut‐in wind speed Vc 3.5 m/sOffshore cut‐out wind speed Vf 30 m/sRated wind speed Vr 14 m/sSite Mean Weibull wind speed Vavgw 9.763878391 m/sc 10.3812766k 7.791622483Capacity Factor CF 0.529792517Annual No. of Operating hours 2000 hrsAverage power output 59 MW
Annual Energy Output 118 GWh
71%* of power consumption for East of Mauritius
* Assuming average islandwise load distribution to be same as peak power demand

Conceptual Offshore Wind FarmSouthern Coast of Mauritius
Sea surface area <50m deep ~ 12 Square kmTurbine Type Repower 5MNo. of turbines 15Rated power PeR 5075 kWDiameter D 126 mOffshore cut‐in wind speed Vc 3.5 m/sOffshore cut‐out wind speed Vf 30 m/sRated wind speed Vr 14 m/sSite Mean Weibull wind speed Vavgw 9.763878391 m/sc 10.3812766k 7.791622483Capacity Factor CF 0.529792517Annual No. of Operating hours 2000 hrsAverage power output 40 MW
Annual Energy Output 81 GWh
32%* of power consumption for South of Mauritius
* Assuming average islandwise load distribution to be same as peak power

Offshore Wave Energy Potential for Mauritius
• 180 km of waveline at 1km from the reef
• Average wave power density of about 40 kW/m
• Theoretical wave power potential of 7.2 GW
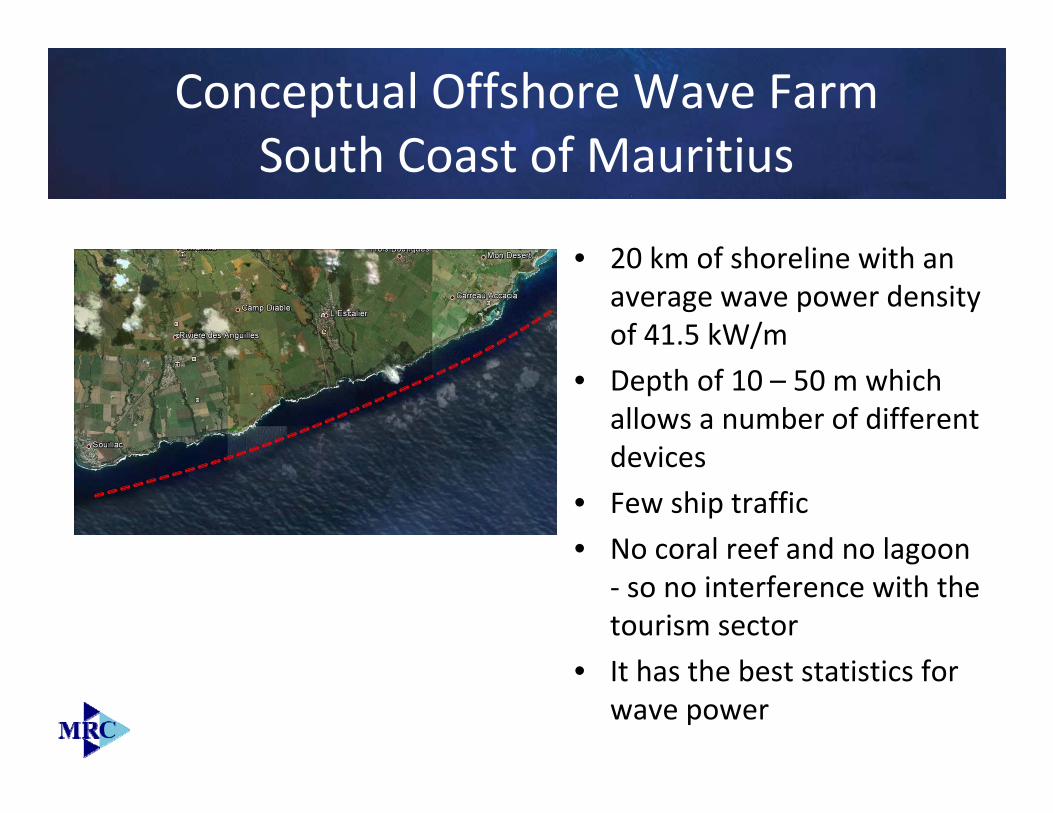
Conceptual Offshore Wave FarmSouth Coast of Mauritius
• 20 km of shoreline with an average wave power density of 41.5 kW/m
• Depth of 10 – 50 m which allows a number of different devices
• Few ship traffic
• No coral reef and no lagoon ‐ so no interference with the tourism sector
• It has the best statistics for wave power

Conceptual Offshore Wave FarmSouth Coast of Mauritius
Based on Pelamis Wave Technology
Total installable power = 37.5 MWAbout 90% of power requirement for the south of
Mauritius
Source: www.marinet.org.uk
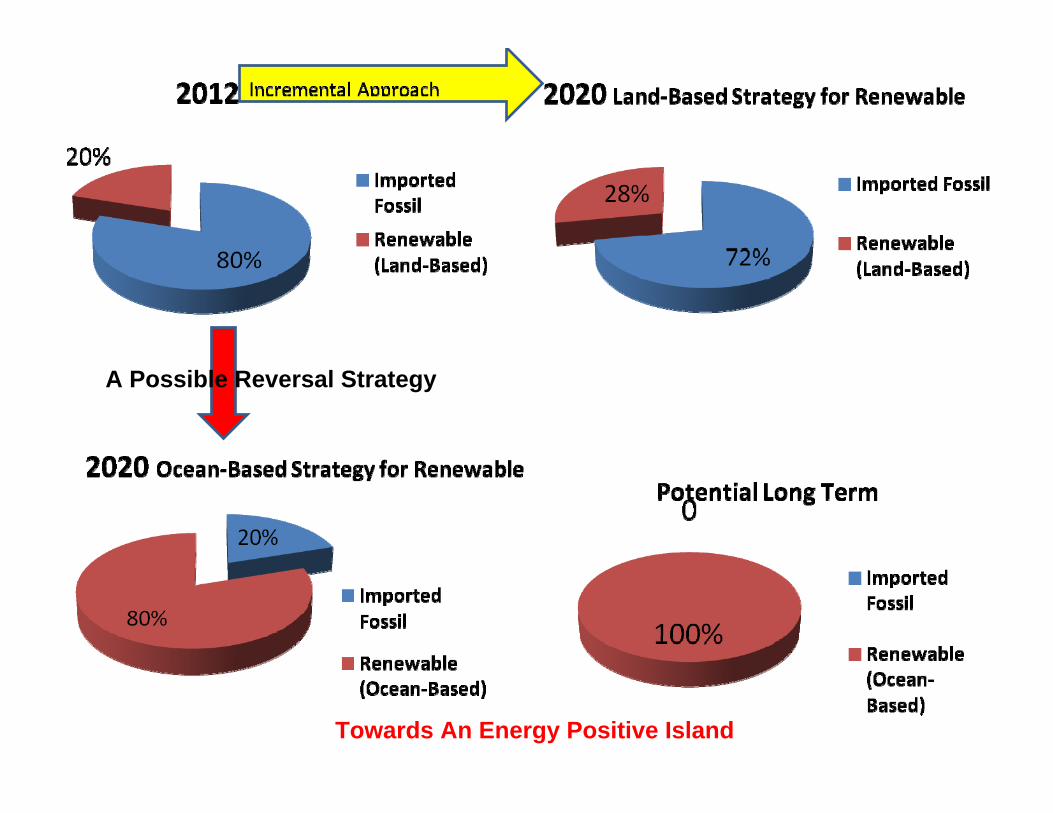
A Possible Reversal Strategy
Towards An Energy Positive Island

Ocean Energy Predictability
Solar – Semi-predictableWind - Semi predictableWave – Semi-predictable Marine current – predictable OTEC – Predictable Tidal – Predictable Saline Power – predictable

Challenges & Way ForwardReduce Waste Change Mindset for Ocean Technology Disinvest in land-based fossil fuel – Compensate Sorted out Grid Balancing Issues Promote Portfolio of Energy Sources Need for Ocean Energy Resources Assessments Need Scientific knowhow, data, & equipment Require international collaboration Adjust legal framework for offshore development Adopt the precautionary principle. An island Role-Model ??

Critical Success Factors
A Change Management Exercise A Situation of Emergency A Champion Unfreeze old ways of doing things Introduce new ways – Communications
SCIENCE + POLICY + FUNDING + EQUITY = TECHNOLOGY + BUSINESS(WEALTH & JOBS & LESS CO2)
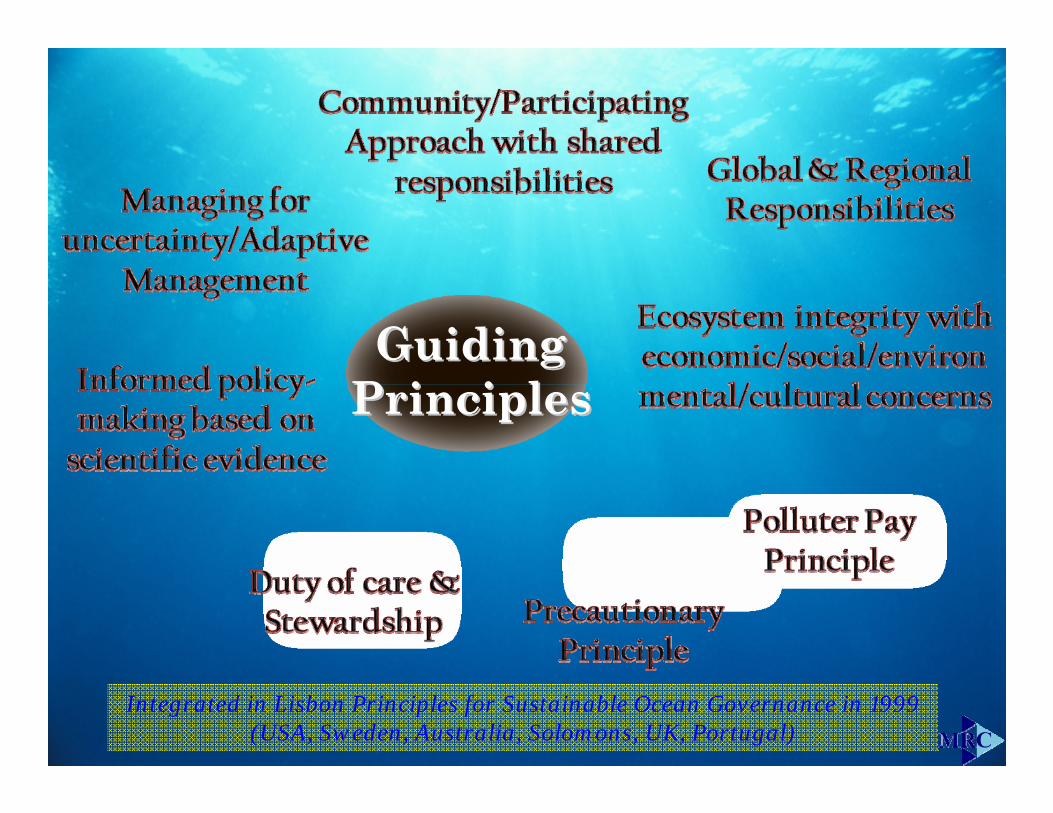
Guiding Guiding PrinciplesPrinciples
Integrated in Lisbon Principles for Sustainable Ocean Governance in 1999 (USA, Sweden, Australia, Solomons, UK, Portugal)

• Government’s Programme (2012 – 2015)– Clauses 15‐24 (Chapter 1, Prosperity)
• EEZ of 2.3 million Km2
• Further submissions to the UN with respect to other parts of ourcontinental shelf
• Expansion of our spatial boundaries, development of scientific knowledge and business opportunities
• Exercise of our rights can give us access to vast natural and mineral resources
• Extending the economic space for investors, businesses, workers, entire population by setting out a concrete and practical plan for developing the Ocean economic space
• High productivity jobs and improving living standards• Exploitation of land/marine resources, land/sea transportation,
cargo/port services• Need for effective regulatory regime and skills
Thank You for your attention