Presentation at Nomura Investment Forum 2017 (PDF) at Nomura Investment Forum 2017 Koji Nagai Group...
53
Connecting Markets East & West © Nomura November 29, 2017 Presentation at Nomura Investment Forum 2017 Koji Nagai Group CEO Nomura Holdings, Inc.
Transcript of Presentation at Nomura Investment Forum 2017 (PDF) at Nomura Investment Forum 2017 Koji Nagai Group...
Connecting Markets East & West
© Nomura November 29, 2017
Presentation at Nomura Investment Forum 2017
Koji Nagai Group CEO Nomura Holdings, Inc.

0
50
100
150
Jan-14 Jul-14 Jan-15 Jul-15 Jan-16 Jul-16
Major European banks CDS (bps)2
1. Source: Markit CDX North America High Yield index (5 year) 2. Major European banks is average of Deutsche Bank, UBS, Credit Suisse, and Barclays (5 year, euro-denominated)
250
300
350
400
450
500
550
600
Jan-14 Jul-14 Jan-15 Jul-15 Jan-16 Jul-16
US high yield bond credit spread (bps)1

250
300
350
400
450
500
550
600
Jan-14 Jan-15 Jan-16 Jan-17
US high yield bond credit spread (bps)1
0
50
100
150
Jan-14 Jan-15 Jan-16 Jan-17
Major European banks CDS (bps)2
1. Source: Markit CDX North America High Yield index (5 year) 2. Major European banks is average of Deutsche Bank, UBS, Credit Suisse, and Barclays (5 year, euro-denominated)

Global economy remains firm
1. Source: US Department of Labor, Eurostat. 2. IMF World Economic Outlook, October 2017.
Unemployment rate declining in US and Europe1 Strong economic growth expected to continue2
3
3.2
1.7
4.3
3.6
2.2
4.6
3.7
2.0
4.9
0
1
2
3
4
5
6
Global Advanced economies
Emerging market and developing economies
(%) (%)
6.6
4.2
11.9
8.9
2
3
4
5
6
7
8
9
10
11
12
Jan-14 Jan-15 Jan-16 Jan-17
US umemployment rate (%) EU unemployment rate (%) 2016 2017(E) 2018(E)

0
10
20
30
40
50
60
70
80
79 81 83 85 87 89 91 93 95 97 99 01 03 05 07 09 11 13 15 17 19
0
10,000
20,000
30,000
40,000
Finishing off Abenomics under third longest post-war administration as Japan corporate earnings at record high
Corporate earnings at record high Abenomics coming to completion
4
Longest post-war administrations
1st 2nd 3rd
Productivity revolution
Nikkei 225 (rhs)
Productivity revolution / intense investment (3 years)
Promote corporate sector capital and personnel investment
Tax / budget / regulatory reform
Free higher education
Free early childhood education
Secure caregiving personnel
Russel/Nomura Large Cap recurring profit (lhs)
Three arrows
New three arrows
Human resource development revolution
Prime Minister Eisaku Sato Shigeru Yoshida Shinzo Abe
Days in office 2,798 days 2,616 days 2,166 days
Period 1964 – 1972 1946 – 1954 2006 – 2007(1st) 2012 – present (2nd)
(trillions of yen)

5
Progress of Vision C&C
Beyond 2020 – Post Vision C&C
Challenges ahead
Environmental changes affecting our business – Domestic
– Retail strategy –
Environmental changes affecting our business – Global
– Wholesale strategy –
New growth strategy
Driving efficiencies (Corporate operating model)
1
2
Agenda

1. Progress of Vision C&C

Management targets
2012 mid-term management targets
1. March 2020 assumptions: Nikkei 225 at Y25,000; USD/JPY rate Y115; Effective tax rate for Japanese corporates below 30%; Global fee pool annual growth rate of 1%. 7
Announced long-term management vision for 2020 (Vision C&C) Create organization capable of consistently delivering EPS of Y100 1
Establish an operating platform capable of delivering sustainable growth under any environment
Improve profitability of international business
Transforming business model in Japan Two
challenges
Sep 2012 Aug 2014
Announced mid-term management targets (EPS Y50)
Achieved EPS and other key targets 2 years ahead of schedule
Improving Wholesale profitability
Reinforce Japan businesses
Optimal allocation of resources
FY2019/20 FY2014/15 FY2016/17 FY2015/16 . . . FY2012/13 FY2013/14
Key
challenges

2012 mid-term management targets: Achieved all KPIs
8
Y119.3trn (as of end Oct 2017)
Improving Wholesale profitability
Reinforce Japan businesses
2012 mid-term management
targets EPS Y50 Achieved three times since
FY2013/14
Income before income taxes: Y100bn
Retail
Achieved for three straight years from FY2013/14
Retail client assets: Y100trn (Raised from Y90trn in Dec 2013)
Recurring revenue: Y69.6bn Consistently achieved since FY2014/15 4Q
Asset Management Income before income taxes: Y25bn Achieved for four straight years
from FY2013/14
Wholesale
Income before income taxes: Y125bn Achieved FY2016/17
of which, international: Y50bn FY2016/17 (Group int’l): Y88.1bn
Additional $1bn cost reduction (total $2bn)
Completed Sep 2013
Key KPIs Status (as of Nov 2017)

Management targets
Working towards 2020 Vision C&C
1. March 2020 assumptions: Nikkei 225 at Y25,000; USD/JPY rate Y115; Effective tax rate for Japanese corporates below 30%; Global fee pool annual growth rate of 1%.
FY2019/20 FY2014/15
Improve profitability of international business
Transforming business model in Japan
FY2016/17 FY2015/16
Two
challenges
Sep 2012
FY2012/13 FY2013/14
Aug 2014
Announced mid-term management targets (EPS Y50)
Achieved EPS and other key targets 2 years ahead of schedule
Improving Wholesale profitability
Reinforce Japan businesses
Optimal allocation of resources
9
Announced long-term management vision for 2020 (Vision C&C) Create organization capable of consistently delivering EPS of Y100 1
Establish an operating platform capable of delivering sustainable growth under any environment
Key
challenges
. . .

FY2019/20 Vision C&C: Key KPIs
1. March 2020 assumptions: Nikkei 225 at Y25,000; USD/JPY rate Y115; Effective tax rate for Japanese corporates below 30%; Global fee pool annual growth rate of 1%. 10
Y119.3trn (as of end Oct 2017)
FY2019/20 management
target1 EPS Y100 FY2016/17: Y65.65
Retail
Client assets: Y150trn
Recurring revenue: Y150bn (cost coverage ratio: Approx. 50%)
FY2016/17: Y73.7bn (25%) FY2017/18 2Q annualized: Y84.4bn
(28%)
Asset Management
Wholesale Fee pool market share: 3.4% FY2016/17: 3.2%
Key KPIs KPIs as of Nov 2017
KPIs to achieve 2020 long-term management
vision AuM: Y55trn Y49.3trn (as of end Oct 2017)

Retail: Client assets
11
FY15/16 KPI (Y90trn)
(Sep 2012)
Increased KPI to Y100trn
(Dec 2013)
FY19/20 KPI (Y150trn)
(Aug 2014) 150
100
(trillions of yen)
72.0
90.9
104.8
119.3
0.0
20.0
40.0
60.0
80.0
100.0
120.0
140.0
160.0
Mar Jun Sep Dec Mar Jun Sep Dec Mar Jun Sep Dec Mar Jun Sep Dec Mar Jun Sep Dec Mar Jun Sep Oct Mar
2012 2013 2014 2015 2016 2017 2020
Target Results

41.6
84.4
150
15%
28%
50%
-20%
-10%
0%
10%
20%
30%
40%
50%
0.0
20.0
40.0
60.0
80.0
100.0
120.0
140.0
160.0
180.0
1Q 2Q 3Q 4Q 1Q 2Q 3Q 4Q 1Q 2Q 3Q 4Q 1Q 2Q 3Q 4Q 1Q 2Q 3Q 4Q 1Q 2Q
Recurring revenue(annualized) Recurring revenue cost coverage ratio (rhs)
Retail: Steady increase in recurring revenue and recurring revenue cost coverage ratio
12
FY2012/13 FY2013/14 FY2014/15 FY2015/16 FY2016/17 FY2017/ 18
FY2019/20 KPI
(billions of yen)
FY2015/16 recurring revenue target (Y69.6bn)

Retail: Building platform for consulting services
1. Based on number of domestic transactions introduced or joint brokered by the Real Estate Department. 13
Operating leases
84.4 340
100
200
300
0
50
100
FY2014/15 FY2015/16 FY2016/17
Amount of contractsNumber of contracts (rhs)(billions of yen)
Real estate
117.3
572
0
200
400
600
800
0
40
80
120
FY2014/15 FY2015/16 FY2016/17
Transaction valueNumber of transactions (rhs)
1
1 (billions of yen)
407
0
100
200
300
400
500
Mar-16 Mar-17 Latest(Oct-17)
Testamentary trustsEstate settlements
Estate planning Introductions to Nomura Trust & Banking
(accumulated)
13
37
60
FY2014/15 FY2015/16 FY2016/17
Number of completed deals
(#) (#)
SME M&A
(#) (#)

FY19/20 KPI (Y50trn)
(Aug 2014)
Increased to Y55trn
(May 2017)
Asset Management: Assets under management
14
(trillions of yen)
55
33.0
49.3
0
10
20
30
40
50
60
Mar Jun Sep Dec Mar Jun Sep Dec Mar Jun Sep Dec Mar Jun Sep Dec Mar Jun Sep Dec Mar Jun Sep Oct Mar
2012 2013 2014 2015 2016 2017 2020
Target Results
50

Asset Management: Initiatives to boost AuM
Enhance solution capabilities to diversify
distribution channels
Set up organization to target novice
investors
Establish client base in Australia, Latin
America, etc
Current businesses
Enhance ETF product offering to use as
tool for long-term asset building
Develop latest technologies and invest
in research using seed and pilot funds
Increase client base
Mutual provision of products with ACI to
enhance global presence
Consider alliances, investments,
acquisitions of asset managers outside
Japan
Increase product offering
15
Current products
Current client base

Benefits of collaboration with American Century Investments (ACI)
1. Nomura Corporate Research and Asset Management. 16
Mandates to manage ACI funds In May 2017, NCRAM1 started managing high
yield for ACI target date funds
Providing products to ACI distribution channels In Oct 2017, started distributing NCRAM1 high
yield funds to US retail investors via ACI channels
Investment trust business In Oct 2016, started offering ACI’s Global
REIT Fund for Fund Wrap products
In Nov 2016, started distributing ACI’s US equity funds to retail clients
Investment advisory and international business In Sep 2016, started distributing ACI’s global
equity fund to pension funds
Distributing ACI global fixed income fund to international clients
AuM: Approx. Y180bn AuM: Approx. $1bn
AuM: Approx. $900m
Domestic
International
Nomura Group American Century Investments
Asset Management
Division
American Century
Investments
Mutual provision of products, synergies
through client introductions

Review profitability and resource allocation by strategy to focus on competitive strengths; Profitability improved significantly
Wholesale: Continue to review business portfolio
17
FY11/12 FY12/13 FY13/14 FY14/15 FY15/16 FY16/17
Profitability by region and by
strategy
High (Income before income taxes)
Low (Loss
before income taxes)
External environment and
internal positioning Action plan
Core businesses
Capital intensive, highly
profitable businesses
Low profitability, less capital intensive
businesses
Businesses requiring rebuild
Focus on areas of competitive strengths to improve profitability
Reduce costs, close certain businesses Shift resources to
growth areas
Rightsize areas where margins and fee pools are expected to shrink
Disciplined investment to enhance market position
Fee pool outlook?
Necessary for franchise?
・・・
Market share, com
petitive strengths?
・・・・・

7,519
6,879 6,511 6,419
5,871 5,325
FY11/12 FY12/13 FY13/14 FY14/15 FY15/16 FY16/17
Wholesale: Lower costs, manage risk
1. Translated to US$ using month-end spot rate (average) for each year. 2. Cost base assuming business conditions remain unchanged from FY2015/16.
Cost reductions centered on fixed costs1 Risk assets trending down
18
(millions of USD) (Indexed, FY2012/13 = 100)
Q4 annualized:
Approx. $5.1bn
Apr 2016 target: Approx. 20% reduction
Run rate cost target2
Achieved one year
ahead
Variable costs
Fixed costs
100 96
82
72
60
Mar-13 Mar-14 Mar-15 Mar-16 Mar-17

- 10% 20% 30% 40% 50%
<-25
-10 to -25
-10 to 0
0 to +10
+10 to +25
+25 to +50
>+50
FY16/17-FY17/18 1HFY12/13-FY15/16
Wholesale daily revenues
Wholesale: Strong focus on risk culture
19
W
holesale daily revenues (millions of USD
)
Percentage of total business days
マイナス収益
FY12/13 - FY15/16
FY16/17 - FY17/18 1H
92% 97%
8% 3%
Positive days
Negative days
FY12/13 - FY15/16
FY16/17 - FY17/18 1H
Positive days Negative days

7.86 3.14
28.37
55.81 60.03
35.52
65.65
1H 30.20
100
??
FY2016/17
FY2015/16 management target (announced in Sep
2012)
FY2019/20 management target (announced in Aug
2014)
Group performance: Making steady progress
1. Diluted net income per share attributable to Nomura Holdings shareholders. 20
(yen)
EPS1 and 2020 management target
FY2012/13 FY2013/14 FY2014/15 FY2015/16 FY2019/20 Target
FY2017/18 FY2010/11 FY2011/12
FY2017/18 3Q performance (as of Nov)
Stock market rally has lifted Retail net revenue to trend slightly above 2Q, while assets under
management in Asset Management continue to grow
Wholesale roughly unchanged from 2Q

Mar-16 Mar-17 Oct-17 2020 KPI
Challenges on road to 2020: Retail
1. Cash and securities inflows minus outflows, excluding regional financial institutions. 2. Inflows of cash and securities of Retail channels
Inflows of Y19trn required to reach Y150trn target, but net inflows of cash and securities not yet at sufficient level
21
Lifting client assets to Y150trn by 2020 Net inflows of cash and securities1 remains a challenge
385
1,076 997
48
-306 -193
FY12/13 FY13/14 FY14/15 FY15/16 FY16/17 FY17/18 1H
281 266
376 301
362
465
(trillions of yen)
Market factors
Inflows
*FY2019/20 assumptions: Nikkei at 25,000; USD/JPY exchange rate at Y115
107.7
150
100.6
119.3
(billions of yen)
(billions of yen)
Inflows of cash and securities 2 added in Apr 2017 as indicator to evaluate business expansion and
has grown steadily
Approx. 19
Apr May Jun Jul Aug Sep

Selectively grow in our areas of competitive strength
Challenges on road to 2020: Wholesale
Products FY2016/17 net revenue 2020 CAGR
Advisory M&A
Execution Agency Execution
Primary ECM, DCM, ALF
Solutions Solutions, Client Financing
Liquidity and market making
Flow Fixed Income
Macro (Rates, FX), Spread Products (Credit, Securitized Products)
Non-Cash Equities Equity Products
Business strategy
高
22
Revenue mix needs to be further diversified as secondary trading susceptible to market volatility is still the main revenue driver
10%~
5-10%
0-5%
0-5%
0-5%
High
Market risk
Low

2. Beyond 2020: Post Vision C&C
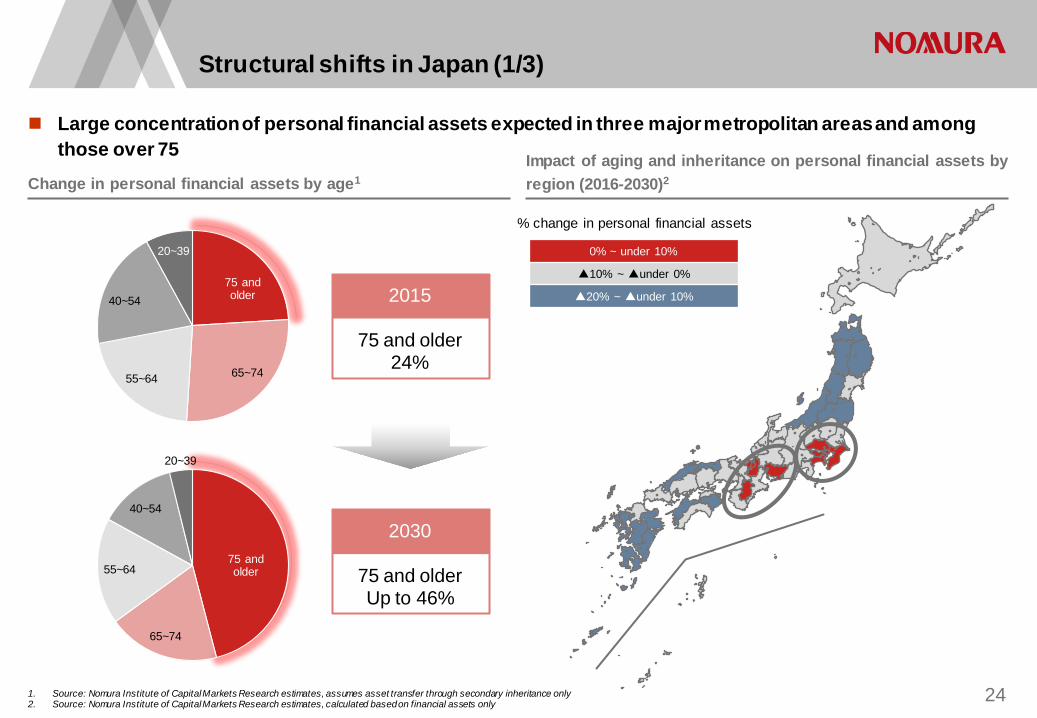
Structural shifts in Japan (1/3)
Change in personal financial assets by age1 Impact of aging and inheritance on personal financial assets by region (2016-2030)2
24
Large concentration of personal financial assets expected in three major metropolitan areas and among those over 75
2015
75 and older 24%
2030
75 and older Up to 46%
75 and older
65~74 55~64
40~54
20~39
75 and older
65~74
55~64
40~54
20~39
1. Source: Nomura Institute of Capital Markets Research estimates, assumes asset transfer through secondary inheritance only 2. Source: Nomura Institute of Capital Markets Research estimates, calculated based on financial assets only
0% ~ under 10%
▲10% ~ ▲under 0%
▲20% ~ ▲under 10%
% change in personal financial assets

Structural shifts in Japan (2/3)
Rise in business succession needs as small and medium-sized enterprise owners age
Age distribution of small and medium-sized enterprise owners1 Number of small and medium-sized enterprises1
25
Peak age of business owners
47 years old (1995)
66 years old (2015)
Around 80? (2030)
?
1. Source: Nomura, based on data from The Small and Medium Enterprise Agency, 2016 White Paper on Small and Medium Enterprises. Number of small and medium businesses = Number of companies+ number of businesses owned by individuals
4,837
4,326 4,201 3,809
1999 2004 2009 2014 2030
(thousands of companies)
?
0.0
5.0
10.0
15.0
20.0
35-39
40-44
45-49
50-54
55-59
60-64
65-69
70-74
75-79
80 andolder
1995 2005
2015
(%)

Rapid change in consumer spending due to advancement in digital technology
Structural shifts in Japan (3/3)
1. Source: Nomura, based on data from the Ministry of Internal Affairs and Communications. 26
(%) Smartphone usage comparison1
10
50
64
72
4
22
29
41
0
20
40
60
80
2010 2012 2014 2016
Total 65 and older

Retail: Medium to long term strategy to address structural shifts (1/2)
27
Further use of IT and changing consumer behavior
Reallocate resources (branches, retail channels, etc.)
Enhance M&A support and provide new solutions
Provide user-friendly services that make use of digital
innovation
1
2
3
Respond to senior generation needs (financial
gerontology research)
Initiatives for asset builders leveraging IT
Increase in senior population Shift of financial assets to three major
metropolitan areas
Aging of small and medium-sized business owners
Rise in business succession needs
Structural shifts Nomura’s strategies

Retail: Initiatives for the over 75 age group
Average life expectancy in Japan1 Enhancing support through financial services
28
Commenced joint research on financial gerontology2
Symposium Outlook for research on longevity and financial gerontology (Mar 2017)
Financial gerontology: How to extend good health and the life of your assets
Published Apr 2017
Established Financial Gerontology Research Center in Jun 2016
(age)
(year) 1. Source: Cabinet Office, Government of Japan. 2. Financial gerontology is the study of the impact that aging and living longer will have on the economy and financial behavior.
58.0
80.8
84.7
61.5
87.0
91.1
55.0
60.0
65.0
70.0
75.0
80.0
85.0
90.0
95.0
1950 1960 1970 1980 1990 2000 2010 2015 2020 2030 2040 2050 2060
Male
Female
Joint research on financial gerontology2 with Keio University

Retail: Medium to long term strategy to address structural shifts (2/2)
29
Corporates
Individuals (Senior
generation)
(Asset builders)
Main channels
Branches
Contact centers
Online services
Previous
Services for salaried workers
Clients
Take orders, process Dedicated dial service for new
clients
Consulting services
Total approach to clients’ assets (asset management, business succession, inheritance planning, M&A, real estate, etc. )
Provide exclusive digital services
Face-to-face C
omplem
ent face-to-face
Mid- to long-term direction
Services that must be carried out by people
Further enhance consulting
services
Remote consulting
IT services offering greater convenience
Digital advisory services
Platform for salaried employee
market

Retail: Growing needs from broader range of clients to build assets
1. Includes Junior NISA 2. Participants, etc. is total of participants (pays contributions) and persons authorized to give investment instructions (no contributions, asset management only).
Installment-type investments through NISA (accumulated)1 Increase in defined contribution pension plan participants2
(billions of yen)
30
As of Oct 2017 Total investments via 10 major firms: over Y400bn Nomura share among 10 major firms: 62%
(thousands of participants)
Jan 2017: Scope of individual DC participants expands
Oct 2001: DC plans introduced
Oct 2005: Allow ed to move assets from DB plans
Jan 2012: Matching contributions start
(end Sep) 0
100
200
300
400
500
600
700
2003 2006 2009 2012 2015
254.4
0.0
50.0
100.0
150.0
200.0
250.0
300.0
Dec2014
Jun2015
Dec Jun2016
Dec Jun2017
As of Sep 2017 Participants, etc.: Approx. 620,000 Client assets: Approx. Y1.125trn (of which, 60% in investment trusts)

Structural shifts in markets: Change in monetary policies of central banks
31
3.6%
1.7% 1%
3%
5%
7%
2010 2011 2012 2013 2014 2015 2016 2017
UST turnover ratio JGB turnover ratio
(%)
Central bank balance sheets
Purchase of sovereign bonds by
central banks (12-month moving
average)
Liquidity of Japan / US government
bonds1
1. Source: Securities Industry and Finance Markets Association(SIFMA), Japan Securities Dealers Association, Ministry of Finance, Japan turnover ratio calculated as monthly trading volume of Dealer-to-client transactions excluding treasury discount bills, etc. to total JGB outstanding; Includes City Banks & Long-term Credit Banks, Regional Banks, Trust Banks, Agricultural, Forestry and Fishery Fin. Insts., Second-tier Regional Banks, Shinkin Banks, Insurance Companies, Investment Trusts, National & Local Public Officers Mutual Aid Associations, Foreigners and Individuals. Excludes transaction by Government, Bank of Japan, Japan Post Bank, Japan Post Insurance, business Corporations, other financial institutions etc.
2. Nomura estimates
Change in monetary policies
US
Japan
Oct 2014 – End of tapering Dec 2015 – Start of rate hikes Since 2016 – Three rate hikes
implemented Rates hikes expected in Dec 2017
and three times in 2018 2
Monetary easing continues Purchases declining
Europe Oct 2017 – ECB decided to
extend bond-buying program and reduce amounts
0
200
400
600
Jan-07 Jan-10 Jan-13 Jan-16
BoJ Fed ECBIndexed, Jan 2007 = 100
(billions of USD)
-10010203040
-1,0000
1,0002,0003,0004,000
Jan-05 Jan-08 Jan-11 Jan-14 Jan-17
Fed ECB BOJ BOE % of GDP (rhs)

Structural shifts in markets: Lower commissions over the medium to long term
1. Source: Bank for International Settlements 2. Source: Greenwich Associates
Increase in electronic trading1 Lower commissions for high-touch equity execution business2 Possible changes due to MiFID-II
32
10.0
15.0
20.0
25.0
2005 2008 2011 2014
Bps
75%
60% 55%
80%
70% 70%
Equities(cash)
FX(spot)
Interest rates(UST)
2012 2015
Electronic trading account for growing share of market volume
Transparency prior to executing
deals
Transparency after executing deals
Best execution
Recordkeeping &
Reporting
Supervision of algorithmic
trading
Unbundling
Hong Kong
Europe US
Japan

Selective expansion in areas and businesses with competitive advantage
Wholesale: Delivering consistent growth
Products 2020 CAGR
Advisory M&A
Execution Agency Execution
Primary ECM, DCM, ALF
Solutions Solutions, Client Financing
Liquidity and market making
Flow Fixed Income
Macro (Rates, FX), Spread Products (Credit, Securitized Products)
Non-Cash Equities Equity Products
Business strategy
High
Market risk
Low
33
10%~
5-10%
0-5%
0-5%
0-5%
1
2
3

Expand Americas business centering on Investment Banking
Wholesale: Strengthening our missing link – The Americas
1. Source: ECM / M&A: Thomson Reuters; DCM: Thomson DealWatch Japan All Debt (including self-funded); Jan – Sep 2017 2. Source: Dealogic, fee pools for ECM, DCM, M&A and ALF 3. Nomura headcount based on producers.
34
21%
68%
Fee pool Headcount2 3 23% 20%
Fee pool Headcount3 2
56%
12%
Fee pool Headcount2 3
Leading franchise in Japan #1 in Japan-related league tables1
Main broker for 62.6% of companies listed in Japan
Franchise underweight in relation to market size
Asia (incl. Japan)
Americas EMEA
Americas remains largest market in the world Enhance Americas franchise through organic growth, alliances, and acquisitions
$44,831
(millions of USD)
$17,174
$18,194
EMEA/Asia cross border2
$1,488
Americas/EMEA cross border2
$4,070
Americas/Asia cross border2
$2,230
1

Investment Banking Global Markets
Wholesale: Build up client financing capabilities
Closer collaboration in Global Markets and Investment Banking
35
2
Advisory
Secondary trading
Execution
Build integrated platform from origination to distribution −Comprehensive coverage of traditional financing mandates and non-traditional solutions businesses in international regions
Provide total solutions tailored to client needs −Agile use of financial resources within risk framework
Primary
Solutions
Client Financing

Wholesale: Digitization of flow businesses
Industry trends Nomura’s response
Electronic platforms for macro business
Growth of algorithmic trading
New liquidity providers: ATS, electronic brokers
Automation of market making
MiFID II: Best execution, price transparency
Innovation to meet changing regulatory requirements
Electronification
Changes to intermediary business
Regulatory requirements
Further develop Instinet platform and increase products
3
36
Enhance efficiency in sales process: Use fintech in low touch businesses to improve productivity
Automation of trading, further use of AI and quants analysis, leverage third-party platforms
Build up talent pool to drive digitalization
Establish W
holesale Digital O
ffice

Growth strategy (1): Merchant banking business (1/2)
Meeting the needs of our clients Nomura Principal Finance investment track record
37
0 2 12 21
77
119
189
227
278
2000 2001 2002 2003 2004 2005 2006 2007 2008
Skylark
MBO
Tsubaki Nakashima
MBO
Huis Ten Bosch
Turnaround sponsor
Millennium Retailing
Capital increase
Sliontec
MBO
Tungaloy (formerly Toshiba
Tungaloy)
MBO
Resort Solutions (formerly Misawa Resort)
MBO
Wanbishi Archives
MBO
Accumulated equity investments (billions of yen) No. of investments: 18
Value: Y280bn
IRR: Approx. 25%
Establish Merchant Banking Preparation Office
Increase the scope of solutions we provide to clients
Target investments
Client companies of Retail and Japan Investment Banking. Extend to AEJ clients in the future.
Equity investments
Initial upper limit of Y100bn
Increased demand from clients
Japanese companies Domestic SME owners
Recalibrating business portfolios Selling off non-core businesses
Business succession Looking at M&A
(year)

404 585
1,918 2,009
6,497
FY2012/13 FY2013/14 FY2014/15 FY2015/16 FY2016/17
Number of discussions with SMEs on M&A
Growth strategy (1): Merchant banking business (2/2)
1. Source: Thomson Reuter
Increase in Japan-related M&A1 Retail seeing an increase in M&A inquiries from SMEs
38
(#)
453 453
358
291 321 307
396
445
573
648
0
100
200
300
400
500
600
700
2007 2008 2009 2010 2011 2012 2013 2014 2015 2016
Deals which financial sponsors involved Others
(Apr-Mar)
(#)

Strategy tailored to market size and stage of development of each country
Growth strategy (2): Paving the way for future growth in Asia
1. Source: United Nations; IMF for Taiwan 2. Source: Nomura, based on data from World Federation of Exchanges on market capitalizations as of August 2016.
GDP per capita (2014)1
Nomura platform
AuM growing at local consolidated subsidiary Nomura Asset Management Taiwan
Providing information on financial markets and products to financial institutions in the Shanghai FTZ through Shanghai Nomura Lujiazui Investment Management
BDO Nomura Securities has started offering online trading for individual investors
Capital Nomura Securities conducting business for high-net-worth and middle-class individuals
Established Nomura China Asset Management and planning to manage private equity funds in China
39
A B C D Already a fairly large market Mature individual investors Nomura has platform
Large market Grow th potential Nomura platform w eak
Developing market Limited Nomura platform
Small market Low per-capita GDP Strong grow th potential
China
Hong Kong
Korea
Indonesia
Malaysia Philippines
Singapore Thailand
India
Vietnam Myanmar
Taiw an
Market size
2
A
C
B
D
Wholesale
Asset Management
Retail
Strengthening our platform
Established Asia Infrastructure Project Office
(Aug 2016)

Growth strategy (2): Entering China onshore market
1. Source: 2015 China Securities Investment Fund Fact Book. 2. Source: Oliver Wyman
First foreign investment bank to enter China in 1982 China’s personal financial assets and wholesale business
Start of reform and opening-up policy 1978
1982 Opened Beijing Representative Office (first foreign investment bank in China)
1986 Opened Shanghai Representative Office
2014 Shanghai Nomura Lujiazui Investment Management
2011 Established Nomura Information Technology
Nomura China Asset Management (preparation for managing PE funds)
1989 Garden Hotel (Shanghai), Beijing Fortune Building
Announcement on opening up onshore financial market to foreign firms (Allow wholly owned subsidiaries from 2020 for securities firms and 2022 for life insurers)
2017
Preparing to build out China onshore platform − Leverage product distribution capabilities backed by
high-net-worth business experience, expertise and global network
Consider operating full line-up securities business in future depending on progress of reform and opening up of the market
Wholesale business fee pool (2016E)2
$18bn
Chinese f inancial institutions
Around 80%
Foreign f inancial institutions
Around 20%
40
88trn yuan (Y1,440trn)
Bank deposits 55.2trn yuan (63%)
* Sep 2017: 65.1trn yuan
Stocks 16.3trn yuan
(19%)
Bank w ealth management products 13.3trn yuan (15%) * Jun 2017: 15.2trn yuan
Public funds
3.2trn yuan (4%)
Personal financial assets (2015)1

Growth strategy (3): Digital innovation initiatives (1/2)
41
Accelerator program, Voyager
Develop new businesses
Promote open
innovation
Venture firms
Aim to develop new businesses to provide solutions to social issues
Establishment of N-Village (April 2017)
• Provide higher quality services to clients • Create new businesses • Promote existing company businesses
and support business expansion of start-ups
Nomura Holdings
Nomura Research Institute
Nomura Real Estate Holdings
Initiatives in Japan Five companies selected in first phase of Voyager; first business developed in October 2017
LAND: Artificial Intelligence that brings together logic and formulas
A more casual approach to inheritance through eGift
App that helps users turn their challenges into habits; bring profits to
companies
Help people with lifestyle diseases to become healthy
Tw o family households in the digital age
Grandparents living aw ay from their grandchildren can see pictures and videos of them by simply using their televisions at home
Commercialization

Accelerator Program Voyager – First India Demo Day
Growth strategy (3): Digital innovation initiatives (2/2)
42
Aiming to develop the financial industry by providing innovative solutions to capital market and investment
banking challenges
Apr
May
Nov
Establishment of Voyager in Powai, India
Application deadline – 150 startups applied from around the world
Eight selected companies took part in Demo Day
2017
Management of workflow systems leveraging AI
Generates personalized recommendations to match
individual customer needs using various analytic functions
A human-like conversation platform built on AI and NLP
System for detecting and preventing fraud, leveraging
behavioral analytics
Mimics human intelligence and applies it to AI and NLP platform on textual data to automate enterprise
processes
AI-based system which assists legal teams in contract extraction,
and knowledge management
Provides a platform to optimize workflows for financial institutions,
primarily operational risk and compliance
Summarizes data and provides key insights for companies in a human-
like language

-60
Reduce fixed costs by approx. Y60bn over the next five years
Driving efficiencies (Corporate operating model)
43
FY2016/17
initiatives
Digitalization/ Automation
Pursue automation using robotics, etc.
Use AI and voice recognition to create
efficiencies
Cloud outsourcing
Use the cloud to reduce data centers
Revise/consolidate duplicated work
Integrated purchasing
Set up new department to oversee all purchasing
Consolidate purchasing and manage down purchasing costs
Global real estate strategy
Gather information globally on real estate
Review office space
1,080.4
Annual costs after all
initiatives completed
3 segment total 935
Medium to long term cost reduction target
Variable costs
Fixed costs
(billions of yen)

3. Financial and capital management

0
5
10
15
20
Mar-13 Mar-14 Mar-15 Mar-16 Mar-17 Sep-17
Operational risk Market risk Credit risk
Risk assets declining on sales of equity holdings and stringent risk management Build up of capital also helping improve capital ratios
45
(trillions of yen)
Financial and capital management: Managing risk assets, improving capital ratios
• Sale of stake in Fortress • Offering of part of stake
in JAFCO • Sold part of stake in DSB
• Sold stake in Mitsui Life Insurance
• Sold all stake in JAFCO
• Sold stake in Takagi Securities
• Sale of UK Annington shares • Offering of part of stake in
Nomura Real Estate Holdings
Wholesale: Trending dow n mainly in market risk
1. Based on Basel III.
17.4%
11.9%
18.4%
0.0%
5.0%
10.0%
15.0%
20.0%
Mar-13 Mar-14 Mar-15 Mar-16 Mar-17 Sep-17
CET1 ratio Tier 1 ratio
Targeting CET1 ratio of 11% or more

Proactively bought back shares since March 2014
Financial and capital management: Policy on holding and retiring treasury stock
46
Including share buybacks in Oct
(Completed Oct 23)
Policy on holding and retiring
treasury stock
Upper limit of treasury stock holdings: Approximately 5% of outstanding shares
Retirement policy: In principal, retire treasury stock held above upper limit
− Dec 18, 2017: Plan to retire 179m shares (4.7% of outstanding shares)
(millions of shares)
370
105 182
224 225 214 267 294
336
191
179
9.7%
-4.0%
-2.0%
0.0%
2.0%
4.0%
6.0%
8.0%
10.0%
0
100
200
300
400
Mar-14 Sep-14 Mar-15 Sep-15 Mar-16 Sep-16 Mar-17 Sep-17
Treasury stock Treasury stock as percentage of outstanding shares

Financial and capital management: Capital efficiency and effective use of capital
Dividend payout ratio: Approx. 30%
Invest surplus capital in future growth areas and use for
additional shareholder returns
Ensure returns above cost of capital
Achieve 2020 management target of EPS of
Y100
− Aim for ROE of about 10%
Maintain appropriate capital ratios
− Common Equity Tier 1 ratio: over 11%
Improve capital efficiency Robust financial position
47

4. In closing

Businesses Current New
In closing
49
Transform domestic business model
Improve profitability of international business
Expand Americas platform
Strategic alliance with ACI
Expand retail business in AEJ
Establish Retail/ Wholesale two-pronged strategy in China
1 2
4 3
Merchant Banking
Initiatives targeting asset builders
Transform domestic business model
Improve profitability of international business
Strategic alliance with ACI
1
3
Businesses Current
2
4
Current Beyond 2020 – Post Vision C&C
Market
Current New
Market
Current New


Disclaimer
This document is produced by Nomura Holdings, Inc. (“Nomura”). Nothing in this document shall be considered as an offer to sell or solicitation of an offer to buy any security, commodity or other
instrument, including securities issued by Nomura or any affiliate thereof. Offers to sell, sales, solicitations to buy, or purchases of any securities issued by Nomura or any affiliate thereof may only be made or entered into pursuant to appropriate offering materials or a prospectus prepared and distributed according to the laws, regulations, rules and market practices of the jurisdictions in which such offers or sales may be made.
The information and opinions contained in this document have been obtained from sources believed to be reliable, but no representations or warranty, express or implied, are made that such information is accurate or complete and no responsibility or liability can be accepted by Nomura for errors or omissions or for any losses arising from the use of this information.
All rights regarding this document are reserved by Nomura unless otherwise indicated. No part of this document shall be reproduced, stored in a retrieval system or transmitted in any form or by any means, electronic, mechanical, photocopying, recording or otherwise, without the prior written permission of Nomura.
This document contains statements that may constitute, and from time to time our management may make “forward-looking statements” within the meaning of the safe harbor provisions of The Private Securities Litigation Reform Act of 1995. Any such statements must be read in the context of the offering materials pursuant to which any securities may be offered or sold in the United States. These forward-looking statements are not historical facts but instead represent only our belief regarding future events, many of which, by their nature, are inherently uncertain and outside our control. Actual results and financial condition may differ, possibly materially, from what is indicated in those forward-looking statements. You should not place undue reliance on any forward-looking statement and should consider all of the following uncertainties and risk factors, as well as those more fully discussed under Nomura’s most recent Annual Report on Form 20-F and other reports filed with the U.S. Securities and Exchange Commission (“SEC”) that are available on Nomura’s website (http://www.nomura.com) and on the SEC‘s website (http://www.sec.gov); Important risk factors that could cause actual results to differ from those in specific forward-looking statements include, without limitation, economic and market conditions, political events and investor sentiments, liquidity of secondary markets, level and volatility of interest rates, currency exchange rates, security valuations, competitive conditions and size, and the number and timing of transactions.
Forward-looking statements speak only as of the date they are made, and Nomura undertakes no obligation to update any forward-looking statement to reflect the impact of circumstances or events that arise after the date the forward-looking statement was made.
The consolidated financial information in this document is unaudited.

Nomura Holdings, Inc. www.nomura.com