Presentation
42
Tong-Tai Machine & Tool Co. (4526TT) TARGET PRICE : TWD 18.73 -23.55% DOWNSIDE Sell JUNE 22, 2013
-
Upload
shane-chung -
Category
Documents
-
view
42 -
download
0
Transcript of Presentation

Tong-Tai Machine & Tool Co. (4526TT)
TARGET PRICE : TWD 18.73 -23.55% DOWNSIDE
Sell
JUNE 22, 2013

INVESTMENT THESIS
1. Capex delays in Chinese Auto Market
2. Yen Weakening Enhances Price Competition
3. PCB Drilling Struggles in Transition
1Investment Theses Chinese Auto
Market Yen Depreciation PCB Drilling Valuation

Capex Delays in Chinese Auto Market
• 25% revenue derived from Chinese local auto makers in 2012
• Demand from auto makers expected to plunge
2Investment Theses Chinese Auto
Market Yen Depreciation PCB Drilling Valuation

-75%
-50%
-25%
0%
25%
50%
75%
0
100
200
300
400Ja
n, 2
011
Jul,
2011
Jan,
201
2
Jul,
2012
Jan,
201
3
Sale Volume of Japan Manufacturers YoY
Japanese auto sales in China shrink after anti-JP protest
Customer vehicle sales have weakened since 2011
5.2%
26.0%29.8%
-6.1% -5.5%
3.1% 2.8% 2.8%
-20%
-10%
0%
10%
20%
30%
40%
0.0
1.0
2.0
3.0
4.0
5.0
2008 2009 2010 2011 2012 2013(f) 2014(f) 2015(f)
(Unit: mn) CV Shipments YoY
Source: China Association of Automobile Manufacturers
• Japanese motor sales dropped
• CV market will continue to be flat in next 3 years
• The boost in demand was triggered by stimulus during 2009 to 2010 but growth will revert to double digits in next 3 years
Source: China Association of Automobile Manufacturers
6.7%
45.4%
32.4%
2.5%4.3%
12.4%12.0% 12.0%
0%
10%
20%
30%
40%
50%
0
5
10
15
20
25
30
2008 2009 2010 2011 2012 2013(f) 2014(f) 2015(f)
Car Shipments YoY
Source: CAAM, Team Estimate
Overcapacity limits machinery demand
(Unit: mn)(Unit: k)
3

0%
40%
80%
120%
160%
Indu
stry
Ave
rage
SAIC
Grea
t Wal
l
Dong
feng
Brill
ianc
e
CCAG JA
C
Geel
y
GAC
BYD
FAW
2011 2012(f) 2013(f) 2014(f)
3.4%
18.7%8.0%
72.1%
54.6%
-29.4%
13.6% 16.0%
-40%
-20%
0%
20%
40%
60%
80%
0
10
20
30
40
2008 2009 2010 2011 2012 2013(f) 2014(f) 2015(f)
Capex YoY(RMB bn)
Source: DataStream, Team Estimate
Capex will be postpone to 2H14 • Chinese auto makers have built large capacity through 2012, which leads to falling capacity utilization among the industry
• We expect auto makers will postpone capacity expansion in 2013
-120
-80
-40
0
40
80
Jan,
201
1
Apr,
2011
Jul,
2011
Oct
, 201
1
Jan,
201
2
Apr,
2012
Jul,
2012
Oct
, 201
2
Jan,
201
3
Apr,
2013
(Units: 10k)
Inability to sell high inventory will deter expansion
Source: Goldman Sachs
Auto makers delay expansion on 80% capacity utilization
Source: China Association of Automobile Manufacturers
4

Yen Weakening Enhances Price Competition
5Investment Theses Chinese Auto
Market Yen Depreciation PCB Drilling Valuation

FX Change
Order
• Price competition• Market determination
Shipment• Sales recognition
-25%
-20%
-15%
-10%
-5%
0%
5%
Oct Nov Dec Jan Feb Mar Apr May Jun Jul Aug Sep Oct Nov Dec
2012 2013
JPY/USD TWD/USD KRW/USD
1 Month
22% Yen Depreciation since Oct. 2012
3 Months
Source: Team Estimate
6

-25%
-20%
-15%
-10%
-5%
0%
5%
Oct Nov Dec Jan Feb Mar Apr May Jun Jul Aug Sep Oct Nov Dec
2012 2013
JPY/USD TWD/USD KRW/USD
Taiwanese and Korean Currencies under Depreciation Pressure in Jan. 2013
FX Change
Order
• Price competition• Market determination
Shipment• Sales recognition
1 Month
3 Months
Source: Team Estimate
7

-25%
-20%
-15%
-10%
-5%
0%
5%
Oct Nov Dec Jan Feb Mar Apr May Jun Jul Aug Sep Oct Nov Dec
2012 2013
JPY/USD TWD/USD KRW/USD
FX Change
Order
• Price competition• Market determination
Shipment• Sales recognition
1 Month
3 Months
Price Reduction to be Recognized in May
Source: Team Estimate
8

80%
85%
90%
95%
100%
105%
110%
115%
120%
125%
130%
Oct Nov Dec Jan Feb Mar Apr May Jun Jul Aug Sep Oct Nov Dec
2012 2013
JP TW KR
30%
Tong-Tai Competes with 30% Lower Selling Price
Source: Team Estimate
9

80%
85%
90%
95%
100%
105%
110%
115%
120%
125%
130%
Oct Nov Dec Jan Feb Mar Apr May Jun Jul Aug Sep Oct Nov Dec
2012 2013
JP TW KR
• Maintain current selling prices
Fall in sales and market share
• Reduce selling prices Fall in gross profit
30%
10%
Price Difference Narrows to 10%
Source: Team Estimate
10

Mechanical Drilling Struggles in Transition
11Investment Theses Chinese Auto
Market Yen Depreciation PCB Drilling Valuation

• ASP decreases under fierce competition
• Shipments remain flat as the demand for laser drilling cannibalizes that for mechanical drilling
(NTD 10k)
(NTD bn)
Drilling machine sales to tumble
Source: Team Estimate
Source: Team EstimateSource: Team Estimate
ASP to drop because of price competition Shipments continue to decline through 2015
$1.22
$1.14$1.13
$1.03
1.00
1.05
1.10
1.15
1.20
1.25
2012 2013(f) 2014(f) 2015(f)
$350.86
$333.32
$323.41
$313.80
300
310
320
330
340
350
360
2012 2013(f) 2014(f) 2015(f)
348
342
348
329
315
320
325
330
335
340
345
350
2012 2013(f) 2014(f) 2015(f)
(Units)
12

306
548
331210
719
325 348 342 348 329
15%
22%
19%
29%
25% 25% 25%23% 22%
20%
0.0%
5.0%
10.0%
15.0%
20.0%
25.0%
30.0%
35.0%
0
100
200
300
400
500
600
700
800
2006 2007 2008 2009 2010 2011 2012 2013(f) 2014(f) 2015(f)
Shipment Market Share • ASP has moved down 12% for Japanese PCB drilling machine manufacturers
• Tong-tai does not retain its price competitiveness and will suffer decreasing market share
• PCB markers are to invested more capex in any layer HDI
Tong-tai’s market share to decrease
(Units)
Any layer HDI cannibalizes market for traditional PCB
(NTD bn)
iPhone 4
Source: Bloomberg
Source: Team Estimate
6.61
2.83
10.59
4.82 4.89 5.22 5.28 5.32
30%
26%
39%
17%19% 19% 18% 17%
0%
5%
10%
15%
20%
25%
30%
35%
40%
45%
0
5
10
15
20
25
30
35
2008 2009 2010 2011 2012 2013(f) 2014(f) 2015(f)
Capex Capex on Mechanical Drilling % of Capex
13

ValuationSell
Share Price (June-14-2013)
Target Price
TWD 24.5
TWD 18.73
Market Cap (TWD mn)
Share Outstanding (mn)
5,549
226.5
2015 EPS2014 EPS2013 EPS
$ -0.36$ -0.49$ -0.16
TP 18.73
BVPS 20.81
$0
$10
$20
$30
$40
$50
$60
1Q09
2Q09
3Q09
4Q09
1Q10
2Q10
3Q10
4Q10
1Q11
2Q11
3Q11
4Q11
1Q12
2Q12
3Q12
4Q12
1Q13
2Q13
3Q13
4Q13
1Q14
2Q14
3Q14
4Q14
1Q15
2.20x
0.63x
1.81x
1.42x
1.02x
14Investment Theses Chinese Auto
Market Yen Depreciation PCB Drilling Valuation

Q & A
Market Analysis – Mechanical Drilling
Market Analysis – Laser Drilling
PCB Market Outlook
Upside Case for Tong-tai
Passenger Vehicle Market
Current Headwind in Auto Market
Scooter Market in Vietnam
Auto Market in India
Machinery Market Outlook
Comparable Companies
Shareholder Structure
Subsidiaries
Korea’s Free Trade Agreements
Light-Duty Truck Market
PMI & BCI
Drilling Machine Market Outlook
PCB Drilling
Auto Market
Politics
Financials Macro
Balance Sheet
Income Statement
Statement of Cash FlowAuto Market Customers
Capex Forecast
FX Change Analysis
Key Financial Ratios
Sensitivity Analysis

28.9%
30.0%
21.9%
7.3%
52.9%
33.2%
5.2%
7.1%
14.1%
13.0%
12.2%
0%
10%
20%
30%
40%
50%
60%
0
5
10
15
20
25
2005
2006
2007
2008
2009
2010
2011
2012
2013
(f)
2014
(f)
2015
(f)
(Unit: mn) PV Sale Volume YoY
China
IndiaIndonesia
Japan
Malaysia
Russia
Taiwan
Thailand
The U.S.
0
200
400
600
800
$0 $15,000 $30,000 $45,000 $60,000GDP Per Capita: Dollars in USD
(Vehicle per 1,000 people)
PV demand to see strong growth Vehicle penetration follows GDP per capita
PV Market Still on the Rise

2001
2005
2010 2012
2013(f)
2014(f)
2015 (f)
R² = 0.9851
0
5
10
15
20
25
¥0 ¥20,000 ¥40,000 ¥60,000 ¥80,000
14.3%
14.6%
18.5%
16.9%
11.6%
13.3%14.4%
11.9%12.0%
11.0%10.0%
0%
5%
10%
15%
20%
0
10,000
20,000
30,000
40,000
50,000
60,000
70,000
2005
2006
2007
2008
2009
2010
2011
2012
2013
(f)
2014
(f)
2015
(f)
Average Wage YoY
Average Wage: Dollars in RMB
PV Sales Volume (mn)
Growing wages will promote PV sales Wages are highly correlated with PV sales
Conclusion: Increasing wages still support growth in auto market
PV Market Still on the Rise
(Dollars in RMB)

0.0
0.5
1.0
1.5
2.0
Jan, 2008 Jan, 2009 Jan, 2010 Jan, 2011 Jan, 2012 Jan, 2013
(Units: mn)
-40%
-20%
0%
20%
40%
60%
80%
100%
120%
140%
0%
10%
20%
30%
40%
Jan,2002
Apr,2003
Jul,2004
Oct,2005
Jan,2007
Apr,2008
Jul,2009
Oct,2010
Jan,2012
Apr,2013
Money Supply (M2) Car Sales Volume YoY
Growth in monthly sales have slowed down since 2011
M2 moves ahead of car sales
Short-term Headwinds• Car sales YoY have shown
little growth since 2011• Low money supply growth
deters consumers’ willingness to retire their old vehicles
• Limitations on car purchase in big cities
0.0
0.5
1.0
1.5
2.0
Jan,
200
9
Jul,
2009
Jan,
201
0
Jul,
2010
Jan,
201
1
Jul,
2011
Jan,
201
2
Jul,
2012
(Units: mn) PV Sales Volume
Beijing Guangzhou
Restrictions do little impact on car sales

Age 2012 2015(F) Growth rate
15-19 121,090 121,728 1%20-24 116,568 119,172 2%25-29 108,186 112,869 4%30-34 98,203 103,381 5%35-39 86,742 93,046 7%40-44 76,598 81,313 6%45-49 67,124 71,973 7%50-54 57,934 61,948 7%55-59 49,468 52,728 7%60-64 36,362 42,791 18%Total 818,275 860,949 5%
Active Population
Source: BMI(Units: k)
Auto Market in India
2.48 3.19 3.43 3.44 3.64 3.93 4.320.0
1.0
2.0
3.0
4.0
5.0
2009 2010 2011 2012 2013(F) 2014(F) 2015(F)
Vehicle Sales
9.37 11.77 13.44 14.11 15.28 16.50 17.760.0
2.5
5.0
7.5
10.0
12.5
15.0
17.5
20.0
2009 2010 2011 2012 2013(F) 2014(F) 2015(F)
Scooter Sales
Source: BMI
(Units: mn) (Units: mn)
Population: 1.2 bn
Motorcycle: 0.21 bn
Vehicle: 0.06 ~ 0.12 bn
Penetration Rate:
Motor (17%), Vehicle (5%~10%)
I. Tightened Monetary Policy Reverse
II. Penetration Rate
Source: BMI

I. Penetration Rate
II. Active Population
2.37 2.87 2.55 2.69 3.00 3.31 3.11 2.95 2.86 2.830.0
1.0
2.0
3.0
4.0
2006 2007 2008 2009 2010 2011 2012 2013(F) 2014(F) 2015(F)
Scooter Sales
Source: BMI, Team Estimate
Age 2012 2015(F) Growth Rate
15-19 8,161 6,806 -17%20-24 9,115 8,892 -2%25-29 8,602 8,862 3%30-34 7,575 8,202 8%35-39 6,770 6,991 3%40-44 6,304 6,609 5%45-49 5,761 6,012 4%50-54 4,936 5,449 10%55-59 4,001 4,446 11%60-64 2,573 3,455 34%Total 63,798 65,724 3%
Low Growth Rate in Active Population
Source: BMI
(Unit: mn)
(Units: k)
Population: 90 mn
Motorcycle: 25 mn
Penetration Rate: 27.7%
3.6 persons / unit
Scooter Market in Vietnam

• Chinese businesses in rural area buy LDTs for transportation and logistics
• Manufacturers have cut demand for trucks owing to shrinking export activities
-60%
-40%
-20%
0%
20%
40%
60%
80%
100%
120%
-10%
0%
10%
20%
30%
40%
50%
60%
Jan,2010
Jul,2010
Jan,2011
Jul,2011
Jan,2012
Jul,2012
Jan,2013
China Export YoY LDT Sales Volume YoY
Light-Duty Truck Market
1
0
5
10
15
20
Jan, 2010 Jul, 2010 Jan, 2011 Jul, 2011 Jan, 2012
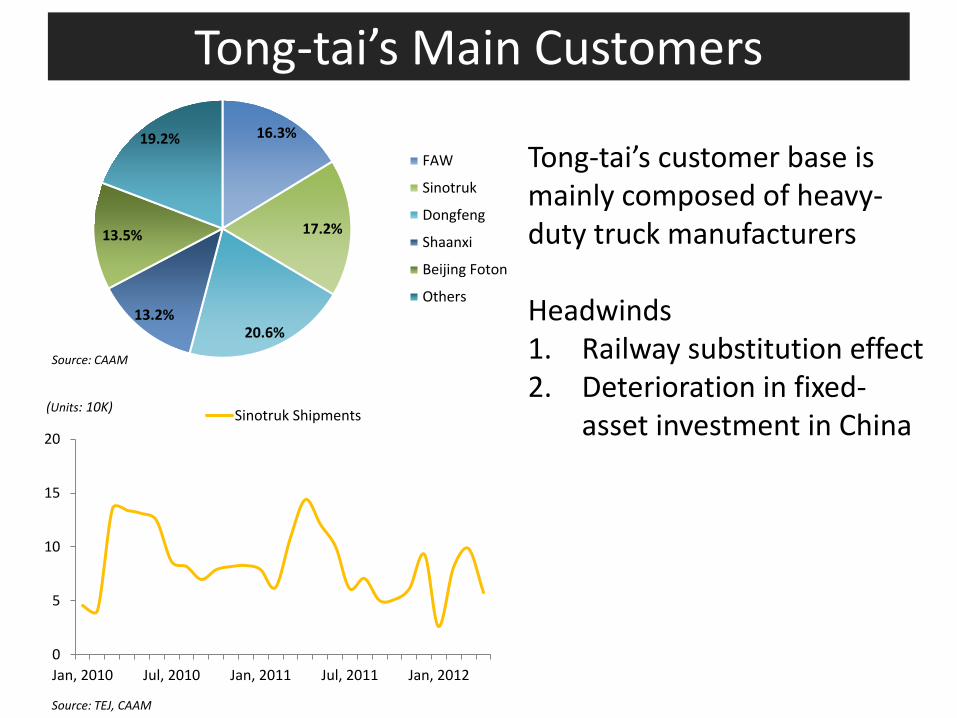
(Units: 10K) Sinotruk Shipments
16.3%
17.2%
20.6%13.2%
13.5%
19.2%FAW
Sinotruk
Dongfeng
Shaanxi
Beijing Foton
Others
Tong-tai’s customer base is mainly composed of heavy-duty truck manufacturers
Headwinds1. Railway substitution effect2. Deterioration in fixed-
asset investment in China
Source: CAAM
Source: TEJ, CAAM
Tong-tai’s Main Customers
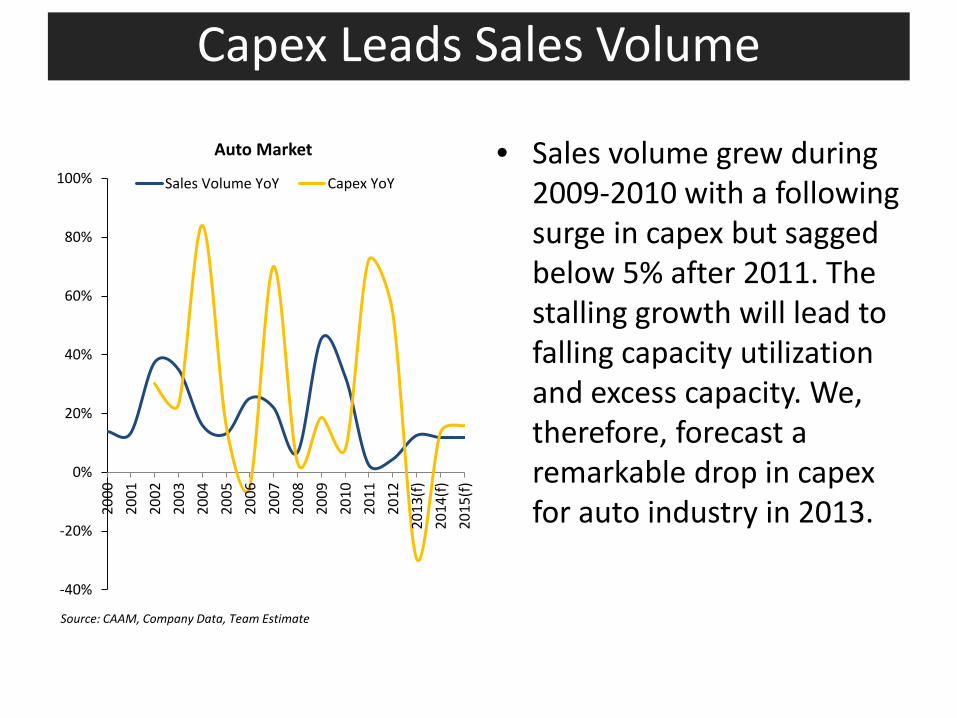
• Sales volume grew during 2009-2010 with a following surge in capex but sagged below 5% after 2011. The stalling growth will lead to falling capacity utilization and excess capacity. We, therefore, forecast a remarkable drop in capex for auto industry in 2013.
-40%
-20%
0%
20%
40%
60%
80%
100%
2000
2001
2002
2003
2004
2005
2006
2007
2008
2009
2010
2011
2012
2013
(f)20
14(f)
2015
(f)
Auto Market
Sales Volume YoY Capex YoY
Capex Leads Sales Volume
Source: CAAM, Company Data, Team Estimate

Europe The U.S. India
Lathe 2.7% 4.2%、4.4%
12.5%
Machine Center 2.7% 4.2%
Sawing Machine 2.7% 4.4%、3.3%
Bench Grinders 1.7%、8% 4.4%、3.3%
Drilling Machine 2.7%、8% 4.2%
Milling Machine 2.7% 、8% 4.2%
Grinding Machine 2.7% 、8% 4.4%
Boring Machine 1.7%、8% 4.2%
Milling & Boring Machine 1.7% 4.2%
Electric Discharge Machine 8% 3.5%、2.4%
Hydraulic Presses 8%、2.7%、1.7% 4.4%
Shearing Machine 8%、2.7%、1.7% 4.4%
Korea’s Free Trade Agreements
1

Shareholder Structure
II. Low QFII
I. Stable Composition
11.32%
15.83%
0.93%
6.98%
0.02%
64.92%
Directors and Supervisors
Large Shareholders
Managers
Foreign Institutional Investors
Domestic Institutional Investors
Individuals
1

• HONOR SEIKI CO., LTD (52%)– CNC vertical lathes & single purpose CNC lathes– Customization
• Asia Pacific Elite Corp. (100%)– Gantry machining center & motor drive high speed gantry machining
• Quick-TECH Machinery Co., Ltd(100%)– CNC Lathes
Net Income Contribution to Parent Company2007 2008 2009 2010 2011 2012
HONOR SEIKI CO., LTD 5.1% 11.3% 35.0% 4.9% 6.6% 25.9%
Asia Pacific Elite Corp. -1.3% -3.2% -27.6% -9.2% -8.4% -1.8%
Quick-TECH Machinery Co., Ltd - - - 0.1% 3.4% 1.5%
Source: Company Data
Subsidiaries

Components Ticker Market Cap (NTD mn) P/E P/B
Hiwin TT:2049 118,631 N.M 0.75NSK JP:6471 149,509 29.38 1.44THK JP:6481 86,262 26.38 1.37Fanuc JP:6954 1,075,280 23.01 2.54
Machine ToolsAwea TT:1530 2,910 10.41 1.18Goodway TT:1583 4,036 10.16 1.37Tongtai TT:4526 5,311 27.54 1.11Takisawa TT:6609 1,339 10.60 0.89Okuma JP:6103 38,394 15.53 1.13Mori Seiki JP:6141 40,952 23.07 1.15Doosan Infra KS:042670 54,424 11.73 1.00Gildemeister GY:GIL 41,112 13.01 1.44
Shieh Yih TT:4533 1,807 10.38 0.83
Source: Bloomberg, TEJ
Comparable Companies

(NT$ in mn) 2Q12 3Q12 4Q12 1Q13 2Q13(f) 3Q13(f) 4Q13(f) 1Q14(f)Net Sales 1,771 1,882 1,891 1,453 1,837 1,818 1,751 1,678Cost of Goods Sold -1,363 -1,419 -1,378 -1,133 -1,414 -1,404 -1,312 -1,303
Gross Profit 408 463 512 320 423 413 439 375Operating Exp -301 -320 -440 -311 -310 -309 -305 -299Marketing Expense -127 -128 -208 -140 -144 -143 -139 -135G&A -135 -116 -172 -125 -129 -128 -127 -126R&D -39 -76 -59 -47 -38 -38 -38 -38
Operating Income 107 143 73 9 113 104 134 75Net Interest -9 -8 -1 -7 -11 -13 -18 -15Exchange Gain and Loss 25 -33 -11 47 -3 1 1 1Others 29 -3 -16 -39 8 9 9 9
Pretax Income 152 98 45 60 95 88 107 54Income Tax -85 -15 36 -22 -20 -18 -23 -9
Earning from Continuing Ops 68 83 81 38 75 70 84 45Minority -22 -18 -28 -12 -10 -10 -10 -9
Net Income 45 66 54 27 65 60 74 36EPS 0.20 0.29 0.24 0.12 0.29 0.26 0.32 0.15Ratio(%) 2Q12 3Q12 4Q12 1Q13 2Q13(f) 3Q13(f) 4Q13(f) 1Q14(f)Sales Growth (YoY) -34.4% -19.1% -1.7% -13.7% 3.7% -3.4% -7.4% 15.5%Sales Growth (QoQ) 5.2% 6.3% 0.5% -23.2% 26.4% -1.0% -3.7% -4.2%Gross Margin 23.0% 24.6% 27.1% 22.0% 23.0% 22.7% 25.1% 22.3%Operating Margin 6.0% 7.6% 3.9% 0.6% 6.1% 5.7% 7.7% 4.5%Net income Margin 2.6% 3.5% 2.8% 1.8% 3.6% 3.3% 4.2% 2.1%Tax Rate 18.4% 55.6% 15.3% -80.1% 36.3% 20.8% 20.3% 21.5%
Financial Summary

(NT$ in mn) 2011 2012 2013(f) 2014(f) 2015(f)Cash & Short-term Investment 1,099 1,105 1,013 1,016 1,091Accounts Receivable 3,169 2,534 2,776 2,957 3,197Inventory 3,967 3,698 3,471 3,619 3,784Others 445 578 503 526 557
Current Asset 8,680 7,914 7,762 8,118 8,630Net PP&E 2,647 2,775 2,881 3,031 3,179Other Non-Current Assets 497 466 473 473 473
Total Asset 11,786 11,120 11,117 11,623 12,283
Accounts Payable 1,492 1,231 1,334 1,476 1,664ST. Borrowing 1,859 1,734 1,893 2,051 2,260Current Portion of LT. Debt 264 507 89 85 80Other Current Liability 1,328 1,256 0 0 0
Current Liability 4,944 4,728 3,315 3,611 4,004LT. Debt 1,371 965 832 832 832Bond 0 0 0 0 0Other Long-Term Liability 0 0 0 0 0
Long-Term Liability 1,371 965 832 832 832Other Non-Current Liability 176 158 242 242 242
Total Liability 6,490 5,850 4,389 4,685 5,078Total Equity 5,296 5,270 6,728 6,938 7,205
Balance Sheet

(NT$ in mn) 2011 2012 2013(f) 2014(f) 2015(f)Net Sales 8,717 7,226 6,858 7,459 8,099
Cost of Goods Sold (6,563) (5,427) (5,263) (5,753) (6,248)Gross Profit 2,154 1,799 1,595 1,706 1,851 Operating Exp (1,400) (1,336) (1,235) (1,249) (1,294)
Marketing Expense (709) (586) (566) (582) (618)G&A (570) (542) (509) (516) (524)R&D (121) (207) (161) (152) (151)
Operating Income 753 463 360 456 557 Net Interest (24) (26) (50) (58) (59)Exchange Gain and Loss 66 (60) 45 3 4 Others (15) 11 (14) 28 17
Pretax Income 780 389 351 371 460 Income Tax (201) (81) (83) (77) (100)
Earnings from Continuing Ops 578 308 268 294 360 Minority (2) (87) (41) (36) (40)
Net Income 576 221 227 258 320
NOPAT 594 242 265 305 366EBIT 738 474 392 488 577EBITDA 895 652 580 669 761EPS 2.60 0.98 0.99 1.12 1.38BVPS 23.89 23.27 29.41 30.03 31.19Shares Outstanding (mn) 222 227 229 231 231
Income Statement

(NT$ in mn) 2011 2012 2013(f) 2014(f) 2015(f)Net Income 578 308 268 294 360 DD&A 170 193 188 181 184 Working Capital Investment (751) 644 87 (187) (217)Other Adjustment 596 (150) (147) 56 98
Cash Flow from Operation 593 995 396 344 425 Capex (396) (319) (272) (331) (332)Other Adjustment (175) (66) 31 (12) (55)
Cash Flow from Investment (571) (385) (241) (343) (387)Debt Increase (Decrease) (7) (289) (48) 158 209 Stock Issuance (Repurchase) 30 10 0 0 0 Cash Dividend (264) (287) (226) (136) (155)Other Adjustment 44 (3) (22) (20) (16)
Cash Flow from Financing (197) (570) (297) 2 38 Exchange Influence 72 (35) 49 (0) (1)
Net Change in Cash (103) 6 (93) 3 75 FCFF (138) 477 182 (0) (11)FCFE (163) 169 96 111 153
Statement of Cash Flow

Ratio(%) 2011 2012 2013(f) 2014(f) 2015(f)
Growth-YoYNet Sales 1.5% -17.1% -5.1% 8.8% 8.6%NOPAT -3.7% -59.3% 9.6% 15.0% 20.0%EBIT -27.7% -35.8% -17.4% 24.5% 18.4%EBITDA -22.7% -27.1% -11.1% 15.4% 13.8%EPS -11.9% -62.3% 1.3% 12.7% 23.7%ProfitabilityGross Margin 24.7% 24.9% 23.3% 22.9% 22.9%Operating Margin 8.6% 6.4% 5.3% 6.1% 6.9%Net Income Margin 6.6% 3.1% 3.3% 3.5% 3.9%Capital StructureDebt Ratio 29.6% 28.8% 25.3% 25.5% 25.8%Current Ratio 175.6% 167.4% 234.1% 224.8% 215.6%Quick Ratio 95.3% 89.2% 129.4% 124.6% 121.0%
Financial Ratios

Source: Company Data, TEJ
Exchange Gain and Loss
-8%
-6%
-4%
-2%
0%
2%
4%
6%
8%1Q
08
2Q08
3Q08
4Q08
1Q09
2Q09
3Q09
4Q09
1Q10
2Q10
3Q10
4Q10
1Q11
2Q11
3Q11
4Q11
1Q12
2Q12
3Q12
4Q12
1Q13
FX chg Exchange gain and loss/Sales
Slope = -88%

Sensitivity Analysis
Optimistic Neutral Pessimistic
Scenarios
1. TWD/JPY drops 10%2. JPMT fix prices
1. TWD/JPY is fixed2. JPMT lower prices
based on Yen depreciation
1. TWD/JPY rises 10%2. JPMT lower prices
based on Yen depreciation
2013 Gross Margin 28.6% 23.2% 21.6%
2013 EPS $2.73 $0.99 $0.13
2014 EPS $3.37 $1.12 $0.34
2015 EPS $3.90 $1.38 $0.52
Source: Team Estimates

0
3,000
6,000
9,000
12,000
15,000
Japa
n
Germ
any
Italy
Taiw
an
Switz
erla
nd
Chin
a
Kore
a
U.S
Spai
n
Belg
ium
2011 2012
0
3,000
6,000
9,000
12,000
15,000
Chin
a
U.S
Germ
any
Indi
a
Kore
a
Braz
il
Mex
ico
Turk
ey
Russ
ia
Fran
ce
2011 2012
0
8,000
16,000
24,000
32,000
Chin
a
Japa
n
Germ
any
Kore
a
Italy
Taiw
an U.S
Switz
erla
nd
Spai
n
Aust
ria
2011 2012
(USD: mn)
0
10,000
20,000
30,000
40,000
50,000
Chin
a
U.S
Japa
n
Germ
any
Kore
a
Indi
a
Italy
Braz
il
Taiw
an
Mex
ico
2011 2012
Source: Gardner
Machinery Tool Export Machinery Tool Import
Machinery Tool Production Machinery Tool Consumption
+5.9%
+5.2%
Machinery Market Outlook
Source: Gardner
(USD: mn)
(USD: mn) (USD: mn)
Source: Gardner Source: Gardner

0
10
20
30
40
50
60
70
2009 2010 2011 2012 201360%
65%
70%
75%
80%
85%
2009 2010 2011 2012 2013
Source: USMTO Source: TEJ
0
10
20
30
40
50
60
70
2009 2010 2011 2012 201397.0
97.5
98.0
98.5
99.0
99.5
100.0
100.5
101.0
101.5
102.0
2011 2012 2013 May-13
Source: TEJSource: CECIMO
The U.S. Machinery MarketIndustry capacity utilization is below 80% PMI sustains above 50
PMI is below 50BCI has been decreasing
The U.S. Machinery Market
1

• The market comprises four laser drilling machine manufacturers
• Market Share– 80% Hitachi and Mitsubishi– 20% Han’s Laser and Tong-tai
• Tong-tai’s laser drilling machines are on average 15% - 20% cheaper than those of Hitachi
• Tong-tai’s ASP: NT$ 1.4 – 1.6 billion• Gross Margin: 30%
0
2
8
1
2009 2010 2011 2012
Tong-tai’s Laser Drilling Machine Shipment
Source: Company Data
PCB Laser Drilling Machines
Tong-tai’s Laser Drilling Machine Shipments
(Units)

Source: Company Data
306
548
331
210
719
325348
2006 2007 2008 2009 2010 2011 2012
(Units)
PCB Mechanical Drilling Machines
• Tong-tai competes with Hitachi and Han’s Laser
• Market Share– 25% Tong-tai– 15% Hitachi– 19% Han’s Laser
• Tong-tai’s mechanical drilling machines are on average 15% -20% cheaper than those of Hitachi
• Tong-tai’s ASP: NT$ 3.0-4.0 million• Gross Margin: 20% - 25%
Tong-tai’s Mechanical Drilling Machine Shipments

CAGR6.5%
CAGR7.5%
CAGR4.1%
CAGR2.0%
CAGR1.5%
CAGR8.2%
0.0
3.0
6.0
9.0
12.0
15.0
IC S
ubst
rate
FPC
Mul
tilay
er
Doub
le S
ide
Sing
le S
ide
HDI
HDI and IC substrate are new focus
PCB Market Outlook
$22.85 $23.02 $21.85 $29.26 $32.06 $33.58 $35.82 $38.22 $40.79
12.93%
0.77%
-5.11%
33.94%
9.57%
4.73%6.70% 6.70% 6.70%
-10%
0%
10%
20%
30%
40%
0
10
20
30
40
50
2007 2008 2009 2010 2011 2012 2013(f) 2014(f) 2015(f)
PCB Sales
China and Taiwan Sales YoY(USD bn) (USD bn)

20.23 22.85 23.02 21.85 29.26 32.06 33.58 35.82 38.22 40.79
2109
2476
1755
732
2838
13001387
14871599
1651
222
529
311158
259
548
793
1147
1660
2401
0
5
10
15
20
25
30
35
40
45
0
500
1000
1500
2000
2500
3000
2006 2007 2008 2009 2010 2011 2012 2013(f) 2014(f) 2015(f)
PCB Sales (incl. only China & Taiwan) Mechanical Drilling Machine Shipments (LHS) Laser Drilling Machine Shipments (LHS)
Drilling Machine Market Outlook
(US$ bn)(Units)
Source: Prismark
HDI Debuted
Financial Crisis
iPhone adoptedAny Layer HDI
iPad adoptedAny Layer HDI

8 1 34 83 120
1.5%
3.0%
5.0% 5.0%
0.0%
1.0%
2.0%
3.0%
4.0%
5.0%
6.0%
0
25
50
75
100
125
150
2011 2012 2013(f) 2014(f) 2015(f)
Production yield improves of Tong-tai's laser
Laser Drilling Machine Shipments Market Share
1.22
1.77
2.49
3.00
0.8%
44.9%40.8%
20.5%
0.0%
10.0%
20.0%
30.0%
40.0%
50.0%
60.0%
0.0
0.5
1.0
1.5
2.0
2.5
3.0
3.5
2012 2013(f) 2014(f) 2015(f)
Sales: 35.4% upside potential
Mechanical Drilling Machine Sales Sales YoY
Upside for Tong-tai’s PCB Drilling Machines
(NTD bn)
(Units)
(Units)
325 348 372 430 446
25% 25% 25%
26% 26%
24.0%
25.0%
26.0%
27.0%
0
100
200
300
400
500
2011 2012 2013(f) 2014(f) 2015(f)
Tong-tai's market share stabilizes at 25% - 26%
Mechanical Drilling Machine Shipments Market Share
Production yield improves of Tong-tai’s laser drilling machines