ShiftingWale.Com in Delhi | Packers and Movers in Delhi | Household Shifting Services in Delhi
7/13/2016
1
Context for Transportation in Delhi
8th July, 2016
Structure of the Presentation
Delhi- Introduction
Transportation Issues & Challenges
Food for thoughtFood for thought
• Urban Planning• Institutional framework
• Demand Management side• Supply Side

7/13/2016
2
Delhi Transportation
INTRODUCTION
Delhi- Growth Indicators
The urban area in Delhi has
grown by 53% from (22% in 1961 to 75% in 2011)
138.
50 167.
53
140160180
khs
)
400% population growth from 1961 to 2011
Density increased by 8 times
4.06
4.14
4.88
6.38
9.18 17.4
4
26.5
9
40.6
6 62.2
0 94.2
1
020406080
100120
1891
1901
1911
1921
1931
1941
1951
1961
1971
1981
1991
2001
2011
2021
Pop
ula
tion
in L
a k

7/13/2016
3
Growth in vehicles
• 6% growth in road length between 2006 and 2012 and 1-2% between 2012-2014
43% h i i hi l d i 2006 2012 d 11% b
3,000,000
3,500,000
4,000,000
4,500,000
5,000,000cl
e Pop
ula
tion Car and Jeep
Two-wheeler
Auto Rickshaw
• 43% growth in private vehicles during 2006-2012 and 11% between 2012-2014
0
500,000
1,000,000
1,500,000
2,000,000
2,500,00020
02-0
3
2003
-04
2004
-05
2005
-06
2006
-07
2007
-08
2008
-09
2009
-10
2010
-11
2011
-12
Veh
ic
Auto Rickshaw
Taxi
Bus
Good Vehicle
Travel Characteristics
BICYCLE
Modal Share Delhi 2008• Delhi aims to achieve 80:20 modal shift by 2021 (including walk & cycle trips) MPD 2021 BICYCLE
4% CAR/TAXI 9%
2W14%
BUSCYCLE RICKSHAW
WALK ONLY 35%
walk & cycle trips) MPD-2021• Buses per lakh population declined
from 57 (1981) to 25 (2014)• average journey speed in Delhi –
14-16 km per hour• A commuter spends around 10 hrs
a week travelling from home to BUS 27%
METRO 3%
TRAIN 1%
AUTO RICKSHAW 5%
CYCLE RICKSHAW 2%
a week travelling from home to office
• Lower Income Group spends about 20 to 25% of income on transportation- highly dependent on public transport
7/13/2016
4
Delhi Transportation
ISSUES & CHALLENGES
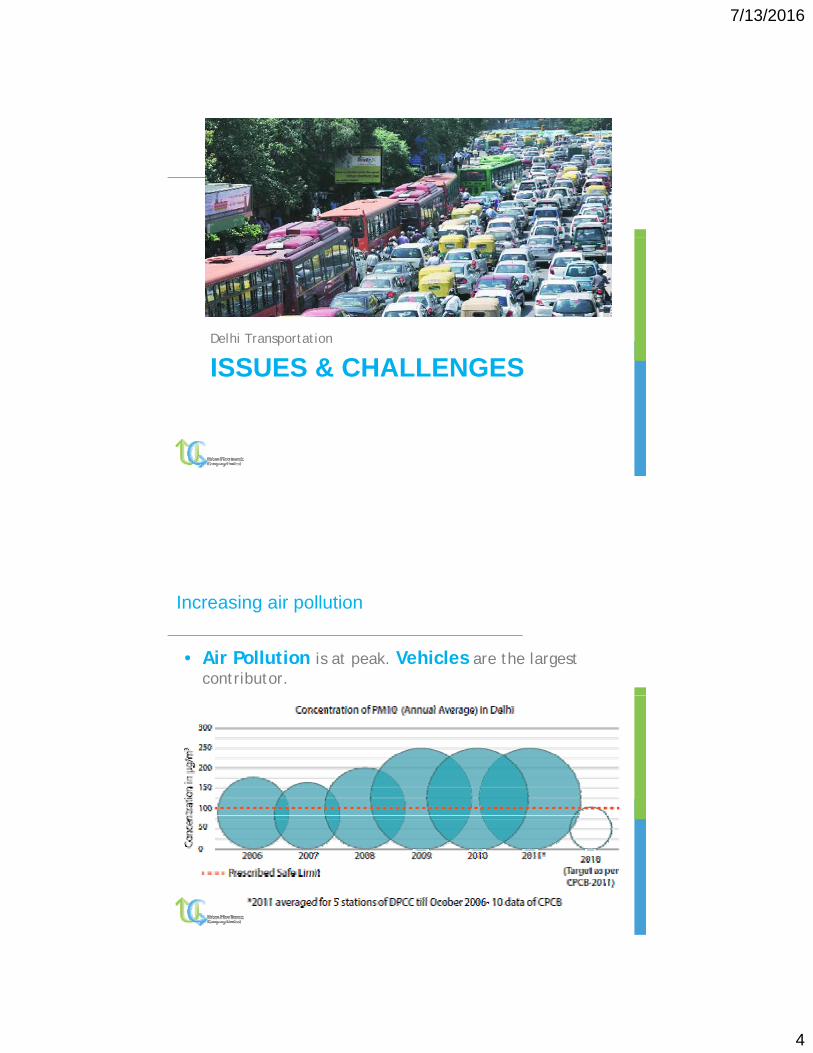
Increasing air pollution
• Air Pollution is at peak. Vehicles are the largest contributor.

7/13/2016
5
Bus Transport- Present Conditions
• 40,000 trips per day made by DTC
• 4.5 Million daily ridership of DTC
• 130% Average occupancy on buses for all routes. More than 150% during peak hours.
Data as in March 2015Data Source: DTC & CSE
• 49% of Trips in Delhi are catered by buses which constitute only 1% of the daily traffic.
Bus Transport- Present Conditions
• Rs. 8 per Km Loss* bLoss* per bus
• Rs. 1000 Cr. Annual loss for last three years
* Operational loses
Data as in March 2015Data Source: DTC & CSE
Operational loses

7/13/2016
6
Bus Transport- Issues and challenges
• High Breakdown of buses
• No increase in fleet size• No increase in fleet size
• Increasing revenue losses
• Shortage of Bus Parking/ space for Depot
• Absence of Route Rationalisation- Low productivity of bus fleetof bus fleet
• Overcrowding of buses in peak hours
• Low Fleet and Vehicle Utilization
Delhi Metro
• 213Km of existing MRTS Network (Including Airport Line)
– Daily Avg ridership ~ 28 Lakhs (2016)y g p ( )
• 200Km MRTS network under Construction (Phase III)
Issue and Challenges
Overcrowding during peak hours• Overcrowding during peak hours
• Inadequate Feeder Service
• Lack of integration with other modes

7/13/2016
7
How Metro commuters travel?
Access to Metro Dispersal from Metro
More than 50% of access trips and 40% of dispersal trips are non-walk trips
Car3.9% Two Wheeler
5.7%
Autorickshaw9.3%
Bus10.7%
Metro feeder
Walk43.9%
Car1.60%
Two Wheeler0.88%
Autorickshaw9.51%
Bus7.19%
Metro feeder0.88%
Company cab0.56%
E-rickshaw4.32%
Shared auto-rickshaw
5 84%
Walk60.99%
Dispersal from Metro
Metro feeder0.8%
Shared autorickshaw
8.4%Company cab0.5%
Grameen Seva4.2%
E-rickshaw5.1%
Cycle-rickshaw5.1%
Cycle1.8%
5.84%
Grameen Seva2.00%
Cycle-rickshaw4.48%
Cycle1.04%
Overcrowding during peak hours
8 -11 AM and 16-20 PM Capacity @6 pax/sqmt

7/13/2016
8
•More than 50% of the totalcommuters enters into thesystem within 6 hrs of peakperiod (total hrs of operation-18-
Peak hour of Peak Period
period (total hrs of operation 1819 hrs)
•Peak hour contribute 40%-50% ofpeak 3 hours duration
Road Safety
• Highest fatal road accidents amongst top 10 cities (2014)
• Between 8pm and 1 am- high number of accidents (2014)• Between 8pm and 1 am high number of accidents (2014)
Data Source: CSE & DTP

7/13/2016
9
Road Safety
Number of total accidents on different roads- fatal and simple • 3/4th of accidents on 8 major arterial roads (2012)
• Least accidents in Lutyen’s Delhi• Least accidents in Lutyen s Delhi
• Bus and Metro Station are most prone to accidents. Increase in trend near PT access points and
flyovers.
Data Source: CSE & DTP
Vulnerable Road Users
• 44.8% people killed in road accidents were pedestrians (2014)
• Highest pedestrian and cyclist fatality amongst Indian Cities
• 40% of roads have no footpaths
• 86% of roads have no pedestrian phasing for crossing
• 65% roads have low illumination (< 8 lux) unsuitable for pedestriansData Source: CSE & DTP

7/13/2016
10
Congestion
• Number of private vehicles doubled in last decade
• Reduction of average peak hour speed– 15 Kmph- 2016 (UMTC SLB surveys)
– 8 Kmph- 2031 (Forecast by Rites travel demand model)
• 99% of delay in private vehicles is due to traffic signals and traffic congestion
69.52%
0.19%
0.10%
0.67%
29.52%
Traffic Signal
Police Control
Animal Crossing
Pedestrian Crossing
Traffic Congestion
Data Source: CSE & DTP
Delhi Transportation
FOOD FOR THOUGHT
7/13/2016
11
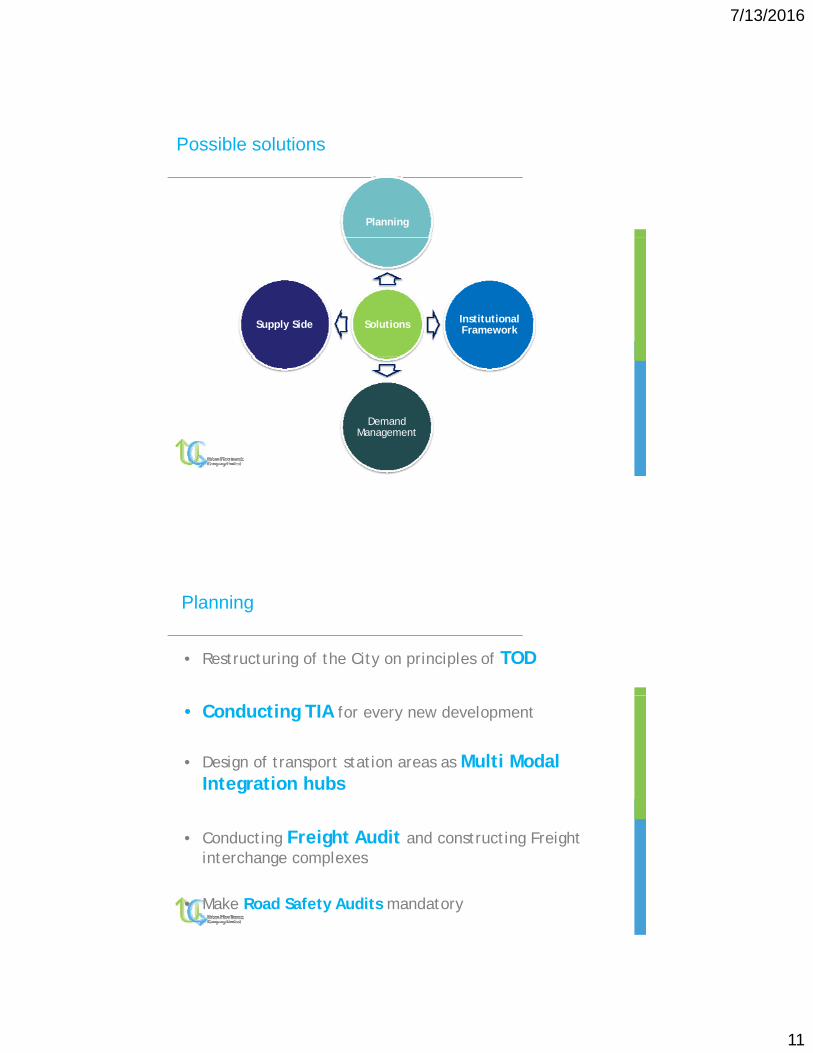
Possible solutions
Planning
Solutions Institutional FrameworkSupply Side
Demand Management
Planning
• Restructuring of the City on principles of TOD
• Conducting TIA for every new development
• Design of transport station areas as Multi Modal Integration hubs
• Conducting Freight Audit and constructing Freight interchange complexes
• Make Road Safety Audits mandatory

7/13/2016
12
Traffic Impact Assessment
• A comprehensive and systematic process that sets out transport issues relating to a proposed d ldevelopment.
• Identifies the anticipated transport impacts of the development
• Assessment of road network for sufficient capacity to accommodate the residual vehicular trips created by the developmentthe development
• Propose measures to improve accessibility and safety for all modes of travel
Transit Oriented Development
Transit Oriented Development (TOD) is essentially any development, macro or micro, that is focused around a transit node, and facilitates complete ease of access to the transit facility, thereby inducing people to prefer to
Image Source: Infratrans
inducing people to prefer to walk and use public transportation over personal modes of transport.
Image Source: UTTIPEC, DDA

7/13/2016
13
Institutional Framework
1. Delhi Development Authority (DDA)2. New Delhi Municipal Council (NDMC)3. Municipal Corporation of Delhi (MCD)4 P bli W k D t t GNCTD
UMTA to cross the City
4. Public Works Department, GNCTD5. National Highway Authority of India (NHAI)6. Delhi Traffic Police 7. Delhi Transport Corporation (DTC)8. Northern Railways (NR)9. Delhi Metro Rail Corporation (DMRC)10. Airport Authority of India (AAI)11. Government of National Capital Territory of Delhi (GNCTD)12. Ministry of Road Transport & Highways 13 Ministry of Urban Development (MoUD) Govt of India
DUMTA
Limits??
13. Ministry of Urban Development (MoUD), Govt. of India14. Indian Road Congress (IRC)15. Central Road Research Institute (CRRI)16. Automobile Association of Upper India (AAUI)17. Delhi State Industrial and Infrastructure Development
Corporation (DSIIDC)18. Delhi Tourism, GNCTD19. Delhi Urban Art Commission (DUAC)20. Delhi Integrated Multi-Modal Transit System (DIMTS)
• Urban Transport Fund
• Exclusive Resources
Demand Management
• Staggering office hours
• Impose Congestion Pricing• Impose Congestion Pricing
• Impose Vehicle Rationing
• Increase on-street Parking Charges and optimize off-street parking charges.
• Impose annual parking fee on all vehicles instead of • Impose annual parking fee on all vehicles instead of onetime charge.
• Link Vehicle registration with available parking space

7/13/2016
14
Benefits of Staggering
• Uniform distribution of passengers trips• Better Utilization of Fleet capacity• Avoid cost of acquisition of more fleet to meet
the peak demand• Smaller queue at
– Ticket counter– Fare gate
Security– Security– Parking entry
• Reduced journey time for commuters• Lesser congestion in feeder network/systems• Lesser crowding ie more comfort for commuter
Supply Side
• Increase existing bus fleet• Migration towards alternate fuels• Allow bus priority through dedicated corridors and
dedicated signal phasing
• Provide subsidised land for bus parking• Construct Multi level bus depot for optimum utilisation
of land
i b • Allow premium buses for choice riders
• Improve first & last mile connectivity for metro stations
• Improve footpaths and construct cycling network

7/13/2016
15
Particulars Base Case( l G d l l)
Multilevel (G+2)
Comparison of parking capacity for Multi Level Depot
(only Ground level)
Land Area in Acres 5 5
Land Area in sqmt 20234 20234
Total number of Buses can be Parked
120 315
Area per Bus( sqmt/bus)
169 64
Significance of First & Last mile connectivity
M M Cycle Rickshaw/ Auto/ Walk-Cycle Rickshaw/
First & last mile connectivity takes 50% of journey time of a commuter
JOURNEY
First Mile Metro Last Mile
M M Feeder Bus etc-Walk
• Help connect low demand areas • First & last mile connectivity assist
Auto/bike sharing etc.
Help connect low demand areas with metro systems at a low cost
• Suppresses the parking demand at metro stations
• Offer affordable mode of transport
First & last mile connectivity assist in sustaining the ridership of main transit system by expanding the network.
• Makes system more flexible & approachable with reduction in total travel time

7/13/2016
16
Thanks You