Presentatie RS H1 2014
35
Kinepolis Group Results H1 2014 August 28, 2014
Transcript of Presentatie RS H1 2014
Kinepolis GroupResults H1 2014
August 28, 2014

Business Review Half 1 2014CEO, Mr Eddy Duquenne
2
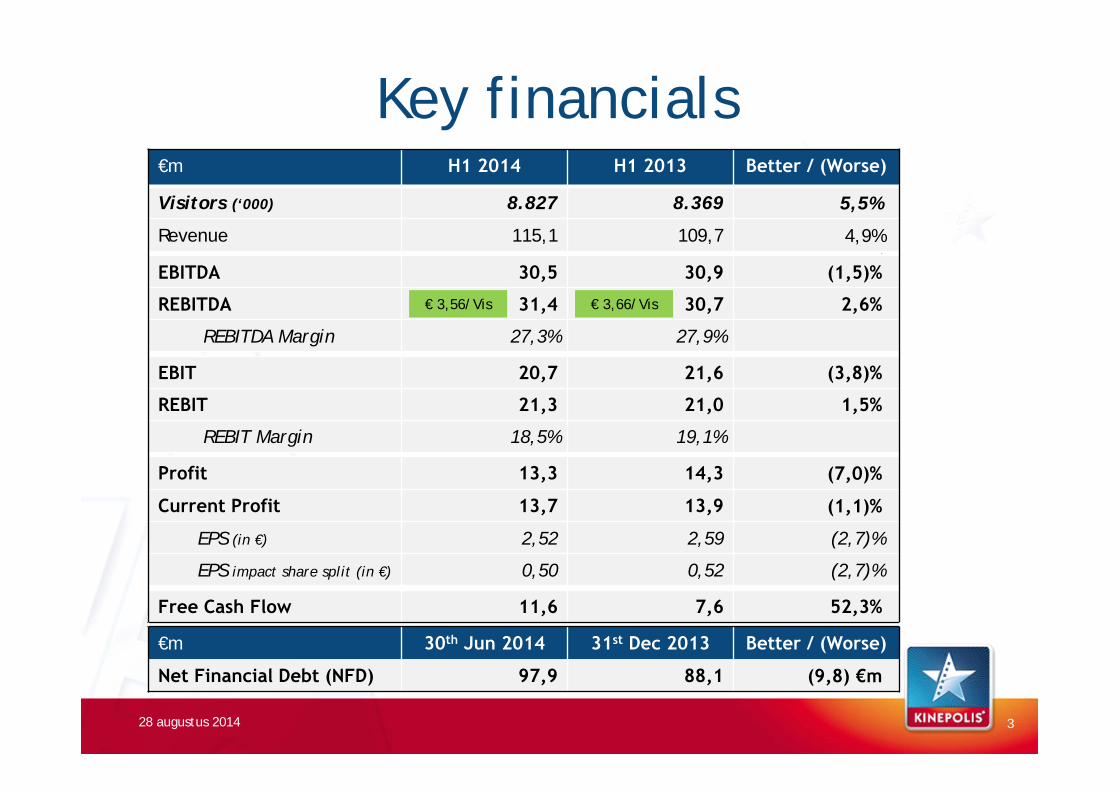
Key financials€m H1 2014 H1 2013 Better / (Worse)
Visitors (‘000) 8.827 8.369 5,5%
Revenue 115,1 109,7 4,9%%
EBITDA 30,5 30,9 (1,5)%
REBITDA 31,4 30,7 2,6%
REBITDA Margin 27,3% 27,9%
EBIT 20,7 21,6 (3,8)%
REBIT 21,3 21,0 1,5%
REBIT Margin 18,5% 19,1%
Profit 13,3 14,3 (7,0)%
Current Profit 13,7 13,9 (1,1)%
EPS (in €) 2,52 2,59 (2,7)%
EPS impact share split (in €) 0,50 0,52 (2,7)%
Free Cash Flow 11,6 7,6 52,3%
€m 30th Jun 2014 31st Dec 2013 Better / (Worse)
Net Financial Debt (NFD) 97,9 88,1 (9,8) €m
28 augustus 2014
€ 3,56/Vis € 3,66/Vis
3
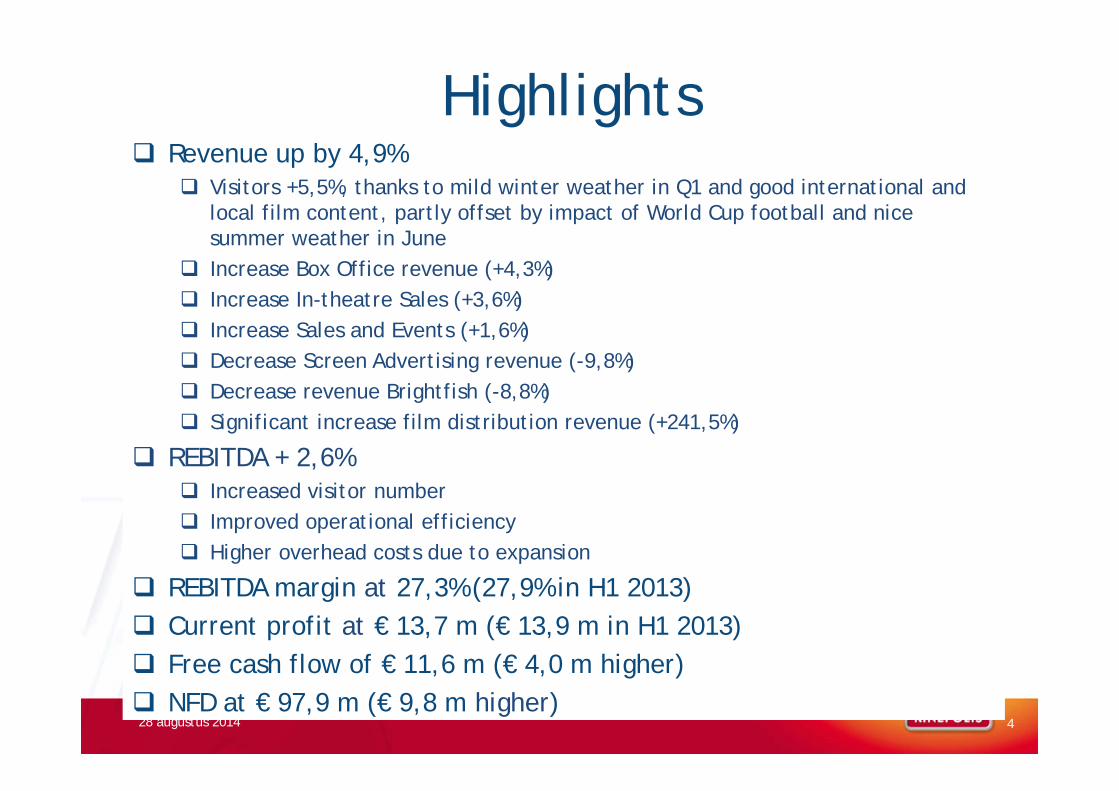
Highlights
28 augustus 2014 4
Revenue up by 4,9% Visitors +5,5%, thanks to mild winter weather in Q1 and good international and
local film content, partly offset by impact of World Cup football and nice summer weather in June
Increase Box Office revenue (+4,3%) Increase In-theatre Sales (+3,6%) Increase Sales and Events (+1,6%) Decrease Screen Advertising revenue (-9,8%) Decrease revenue Brightfish (-8,8%) Significant increase film distribution revenue (+241,5%)
REBITDA + 2,6% Increased visitor number Improved operational efficiency Higher overhead costs due to expansion
REBITDA margin at 27,3% (27,9% in H1 2013) Current profit at € 13,7 m (€ 13,9 m in H1 2013) Free cash flow of € 11,6 m (€ 4,0 m higher) NFD at € 97,9 m (€ 9,8 m higher)
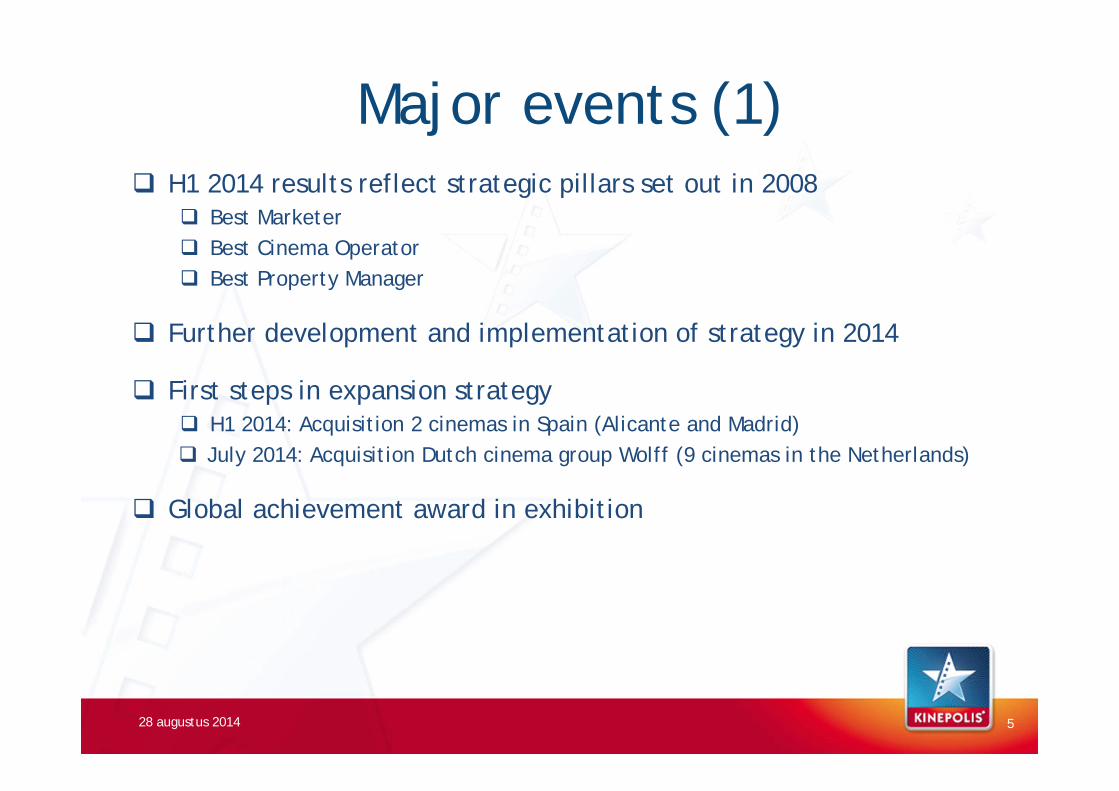
Major events (1) H1 2014 results reflect strategic pillars set out in 2008
Best Marketer Best Cinema Operator Best Property Manager
Further development and implementation of strategy in 2014
First steps in expansion strategy H1 2014: Acquisition 2 cinemas in Spain (Alicante and Madrid) July 2014: Acquisition Dutch cinema group Wolff (9 cinemas in the Netherlands)
Global achievement award in exhibition
28 augustus 2014 5
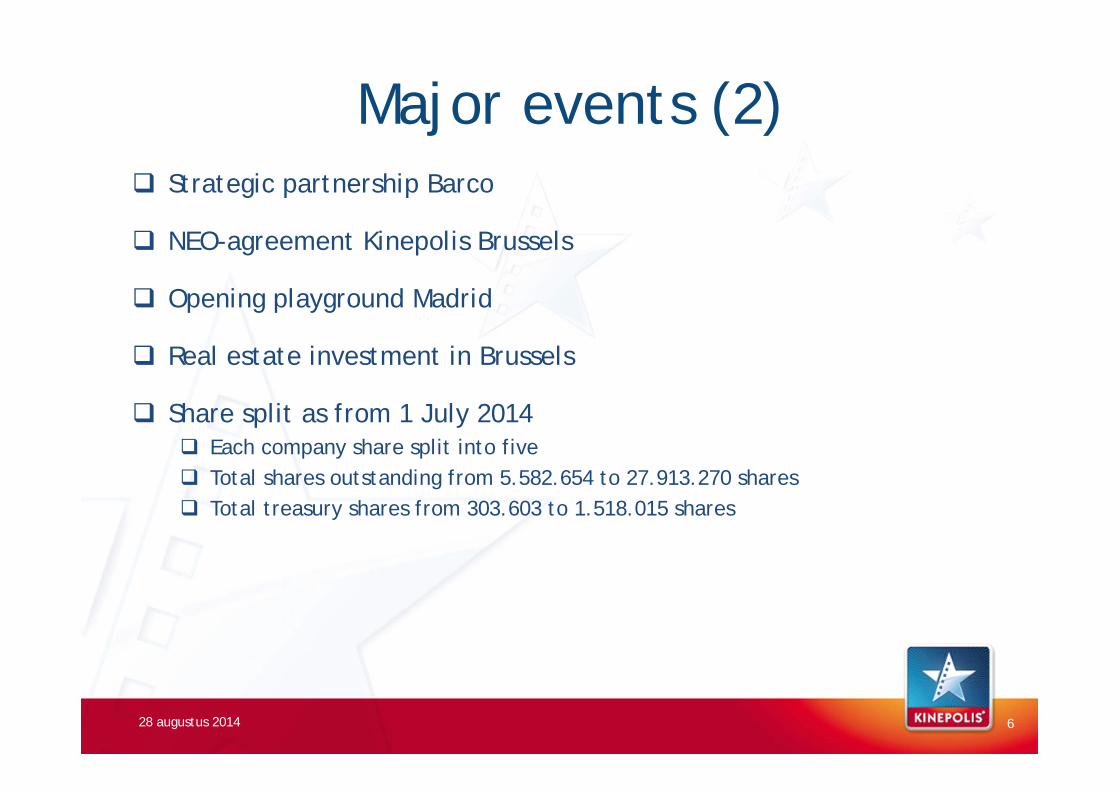
Major events (2) Strategic partnership Barco
NEO-agreement Kinepolis Brussels
Opening playground Madrid
Real estate investment in Brussels
Share split as from 1 July 2014 Each company share split into five Total shares outstanding from 5.582.654 to 27.913.270 shares Total treasury shares from 303.603 to 1.518.015 shares
28 augustus 2014 6
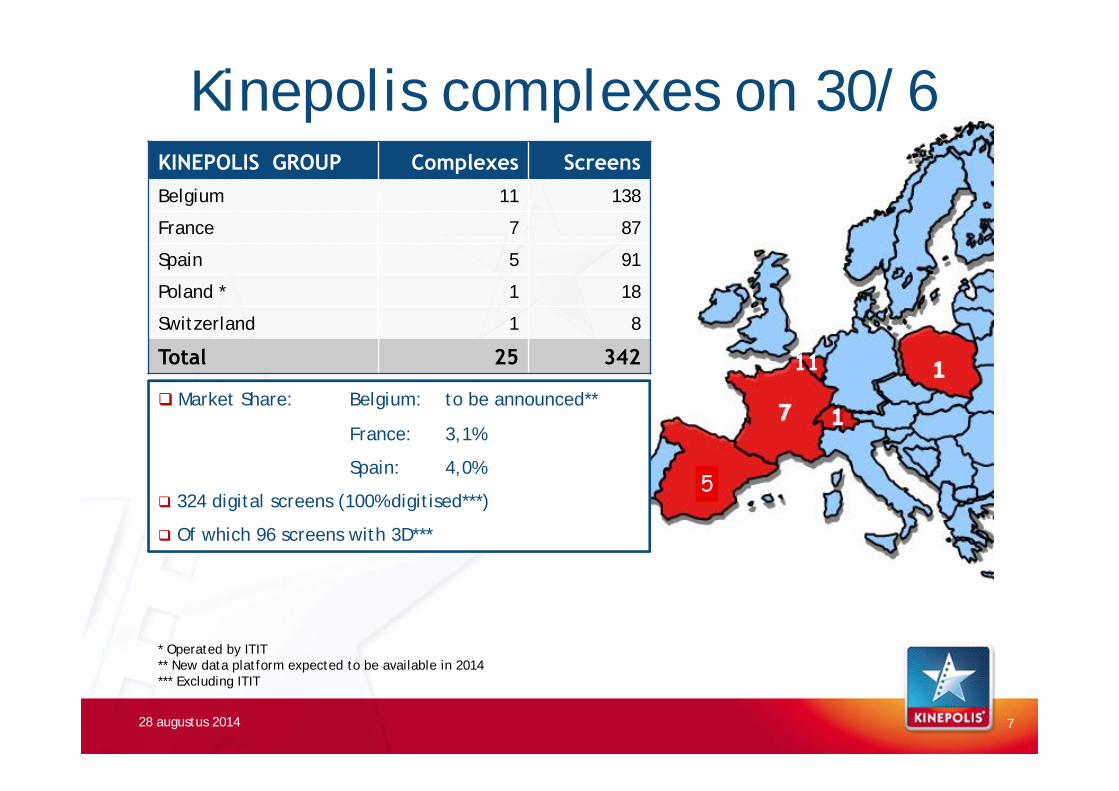
Market Share: Belgium: to be announced**
France: 3,1%
Spain: 4,0%
324 digital screens (100% digitised***)
Of which 96 screens with 3D***
Kinepolis complexes on 30/6KINEPOLIS GROUP Complexes ScreensBelgium 11 138
France 7 87
Spain 5 91
Poland * 1 18
Switzerland 1 8
Total 25 342
28 augustus 2014
11
* Operated by ITIT ** New data platform expected to be available in 2014*** Excluding ITIT
7
5
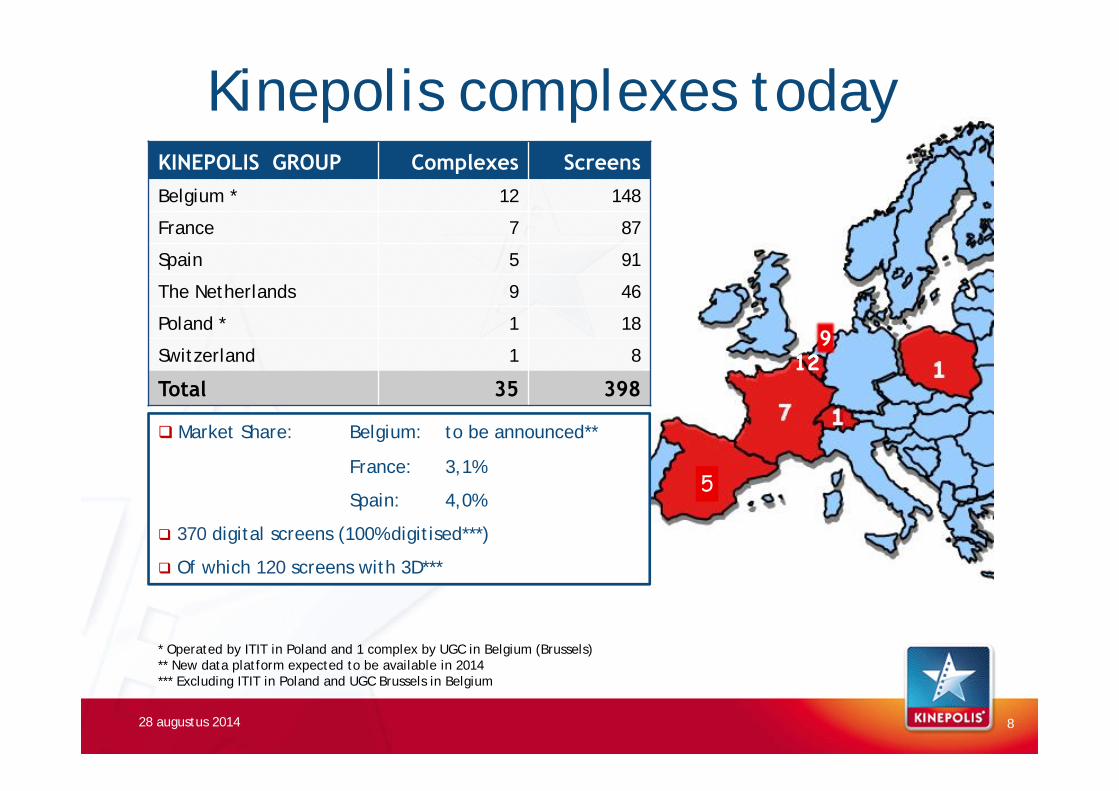
Market Share: Belgium: to be announced**
France: 3,1%
Spain: 4,0%
370 digital screens (100% digitised***)
Of which 120 screens with 3D***
Kinepolis complexes todayKINEPOLIS GROUP Complexes ScreensBelgium * 12 148
France 7 87
Spain 5 91
The Netherlands 9 46
Poland * 1 18
Switzerland 1 8
Total 35 398
28 augustus 2014
12
* Operated by ITIT in Poland and 1 complex by UGC in Belgium (Brussels) ** New data platform expected to be available in 2014*** Excluding ITIT in Poland and UGC Brussels in Belgium
8
9
5
Belgium60%
France26%
Spain 12%
SwitzerlandPoland
2%
Belgium60%
France26%
Spain 12%
SwitzerlandPoland
2%
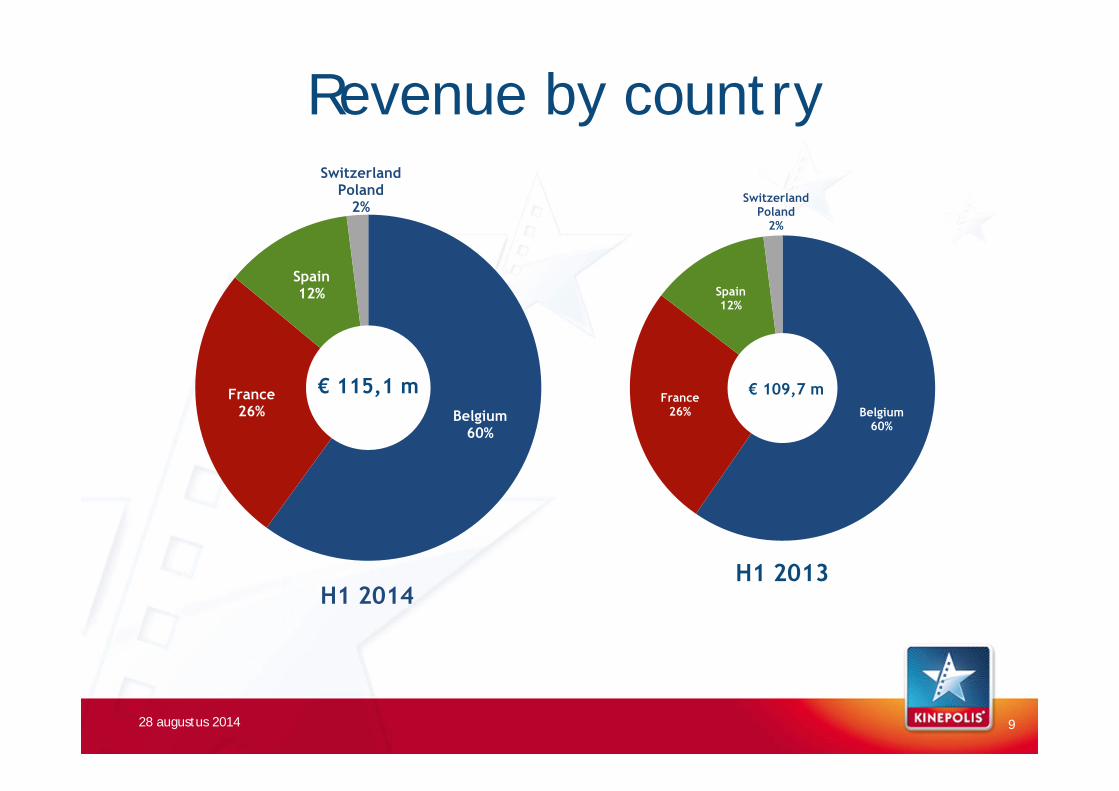
Revenue by country
28 augustus 2014
€ 115,1 m
H1 2014H1 2013
€ 109,7 m
9
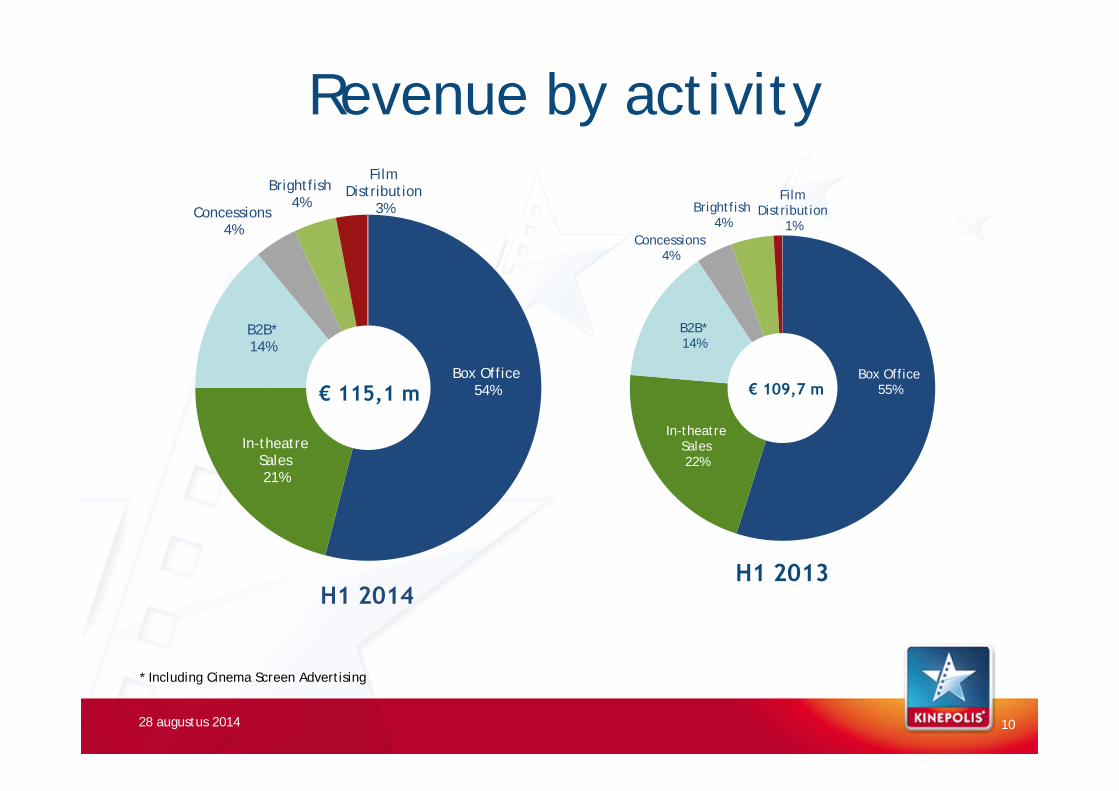
Box Office55%
In-theatre Sales22%
B2B*14%
Concessions4%
Brightfish4%
Film Distribution
1%
Box Office54%
In-theatre Sales21%
B2B*14%
Concessions4%
Brightfish4%
Film Distribution
3%
Revenue by activity
28 augustus 2014
€ 115,1 m
H1 2014H1 2013
€ 109,7 m
10
* Including Cinema Screen Advertising
11
Visitors & Movies Visitors (000’s) H1 2014 % of Tot H1 2013 % of Tot % Δ YoYBelgium 4.166 47,2% 4.051 48,4% 2,8%
France 3.064 34,7% 2.848 34,0% 7,6%
Spain 1.536 17,4% 1.398 16,7% 9,9%
Switzerland 61 0,7% 72 0,9% (15,3)%
Total 8.827 100% 8.369 100% 5,5%
28 augustus 2014
Top 5 Movies H1 2014 3D Visitors (000’s)1. Qu’est-ce qu’on a fait au
Bon Dieu354
2. The Wolf of Wall Street 326
3. Supercondriaque 299
4. Ocho Apellidos Vascos 298
5. Rio 2 ✓ 296
Top 5 1.574Weight Top 5 17,8%
Top 5 Movies H1 2013 3D Visitors (000’s)
1. Iron Man 3 ✓ 415
2. Fast and Furious 6 399
3. Django Unchained 364
4. The Croods ✓ 359
5. The Hobbit: An Unexpected Journey
✓ 240
Top 5 1.777Weight Top 5 21,2%
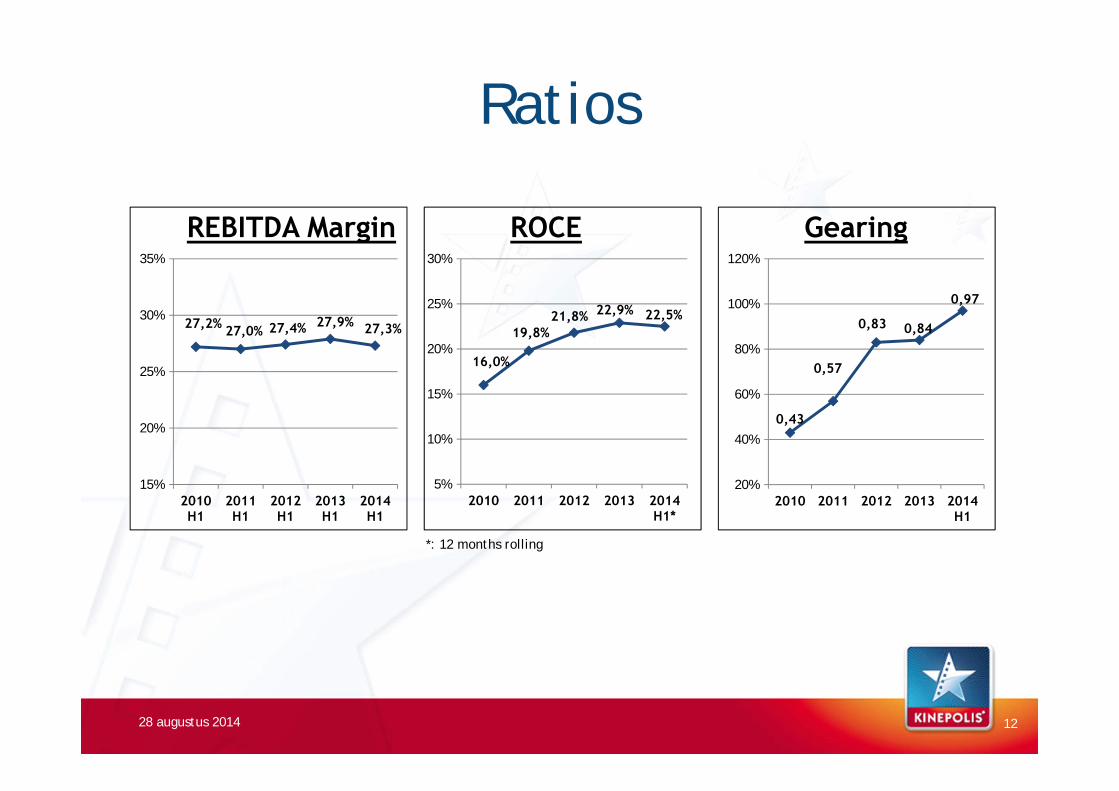
Ratios
27,2% 27,0% 27,4% 27,9% 27,3%
15%
20%
25%
30%
35%
2010H1
2011H1
2012H1
2013H1
2014H1
REBITDA Margin
16,0%
19,8%21,8% 22,9% 22,5%
5%
10%
15%
20%
25%
30%
2010 2011 2012 2013 2014H1*
ROCE
0,43
0,57
0,83 0,84
0,97
20%
40%
60%
80%
100%
120%
2010 2011 2012 2013 2014H1
Gearing
28 augustus 2014 12
*: 12 months rolling

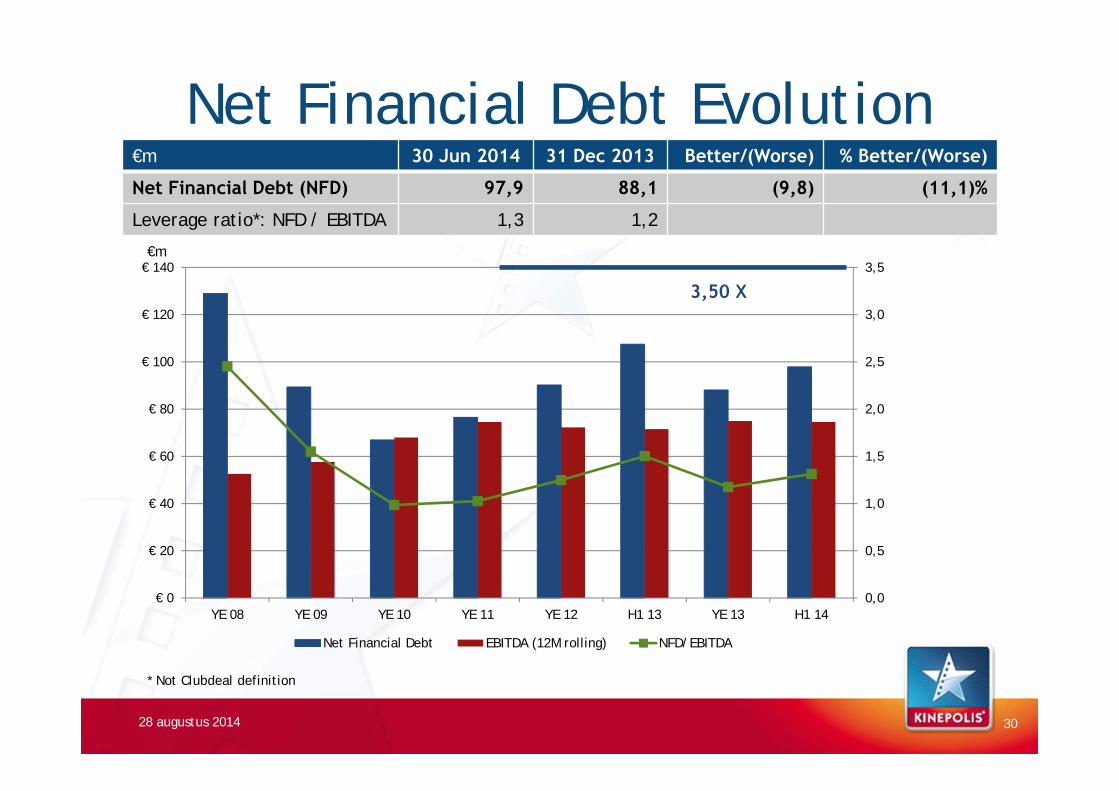
Net Financial Debt Evolution
28 augustus 2014
€m 30 Jun 2014 31 Dec 2013 Better/(Worse) % Better/(Worse)
Net Financial Debt (NFD) 97,9 88,1 (9,8) (11,1)%
Leverage ratio*: NFD / EBITDA 1,3 1,2
0,0
0,5
1,0
1,5
2,0
2,5
3,0
3,5
€ 0
€ 20
€ 40
€ 60
€ 80
€ 100
€ 120
€ 140
YE 08 YE 09 YE 10 YE 11 YE 12 H1 13 YE 13 H1 14
Net Financial Debt EBITDA (12M rolling) NFD/EBITDA
3,50 X
* Not Clubdeal definition
13
€m
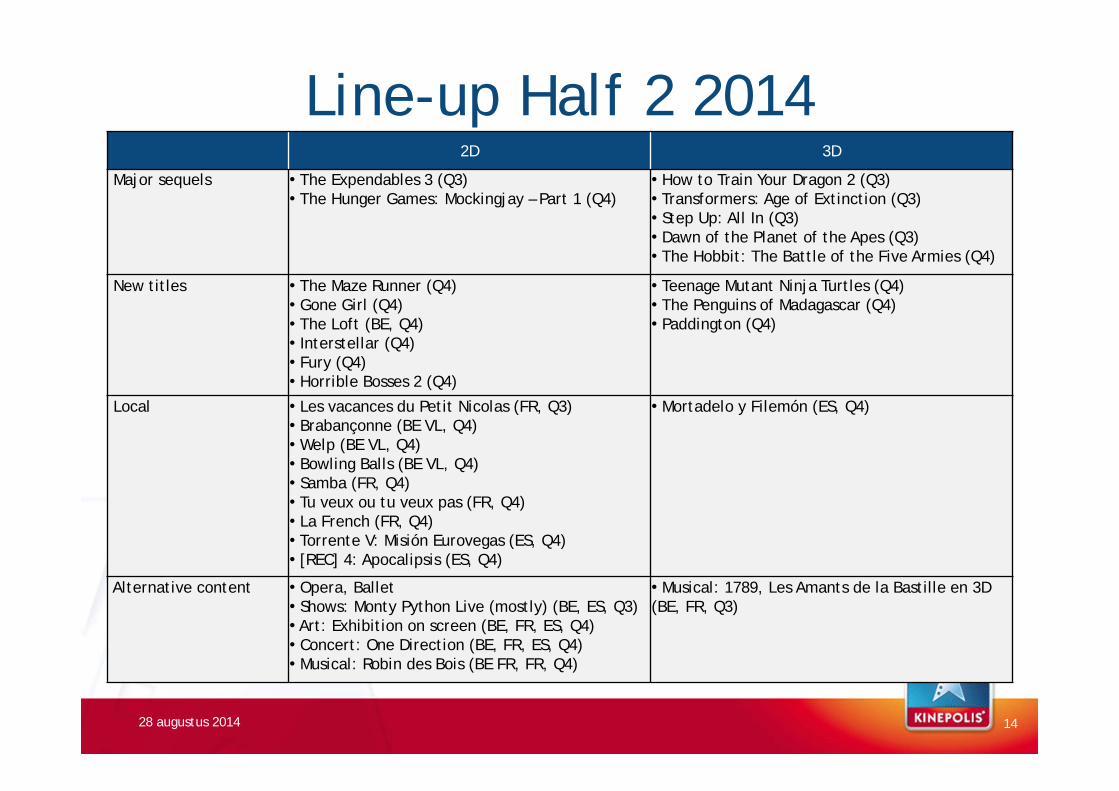
Line-up Half 2 2014
28 augustus 2014 14
2D 3D
Major sequels • The Expendables 3 (Q3)• The Hunger Games: Mockingjay – Part 1 (Q4)
• How to Train Your Dragon 2 (Q3)• Transformers: Age of Extinction (Q3)• Step Up: All In (Q3)• Dawn of the Planet of the Apes (Q3)• The Hobbit: The Battle of the Five Armies (Q4)
New titles • The Maze Runner (Q4)• Gone Girl (Q4)• The Loft (BE, Q4)• Interstellar (Q4)• Fury (Q4)• Horrible Bosses 2 (Q4)
• Teenage Mutant Ninja Turtles (Q4)• The Penguins of Madagascar (Q4)• Paddington (Q4)
Local • Les vacances du Petit Nicolas (FR, Q3)• Brabançonne (BE VL, Q4)• Welp (BE VL, Q4)• Bowling Balls (BE VL, Q4)• Samba (FR, Q4)• Tu veux ou tu veux pas (FR, Q4)• La French (FR, Q4)• Torrente V: Misión Eurovegas (ES, Q4)• [REC] 4: Apocalipsis (ES, Q4)
• Mortadelo y Filemón (ES, Q4)
Alternative content • Opera, Ballet• Shows: Monty Python Live (mostly) (BE, ES, Q3)• Art: Exhibition on screen (BE, FR, ES, Q4)• Concert: One Direction (BE, FR, ES, Q4)• Musical: Robin des Bois (BE FR, FR, Q4)
• Musical: 1789, Les Amants de la Bastille en 3D (BE, FR, Q3)
Financial Review Half 1 2014CFO, Mr Nicolas De Clercq
15
16
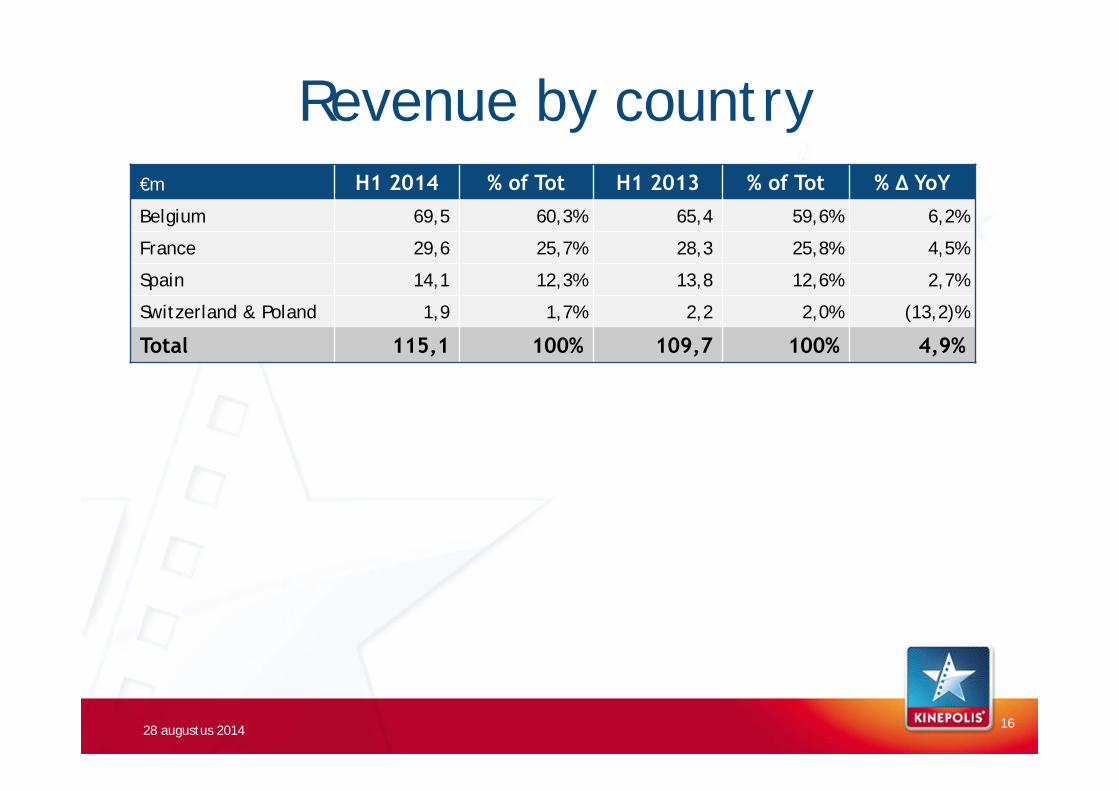
Revenue by country
28 augustus 2014
€m H1 2014 % of Tot H1 2013 % of Tot % Δ YoYBelgium 69,5 60,3% 65,4 59,6% 6,2%
France 29,6 25,7% 28,3 25,8% 4,5%
Spain 14,1 12,3% 13,8 12,6% 2,7%
Switzerland & Poland 1,9 1,7% 2,2 2,0% (13,2)%
Total 115,1 100% 109,7 100% 4,9%
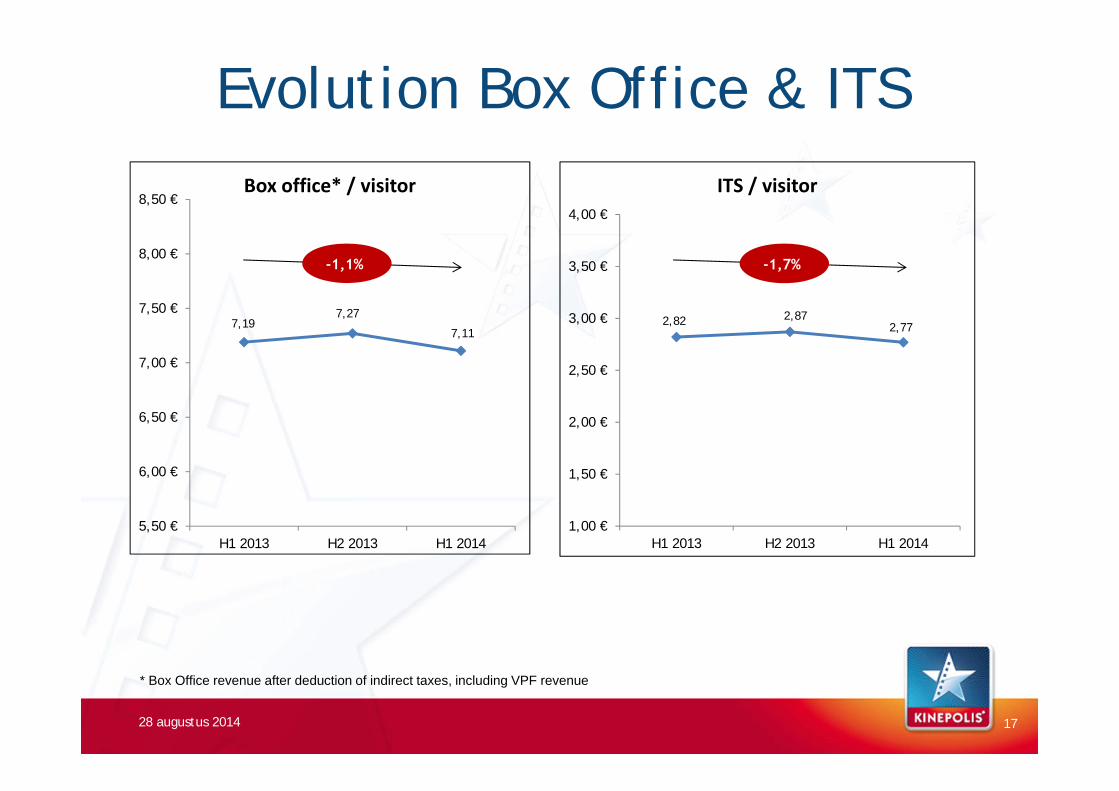
7,197,27
7,11
5,50 €
6,00 €
6,50 €
7,00 €
7,50 €
8,00 €
8,50 €
H1 2013 H2 2013 H1 2014
Box office* / visitor
-1,1%
2,82 2,872,77
1,00 €
1,50 €
2,00 €
2,50 €
3,00 €
3,50 €
4,00 €
H1 2013 H2 2013 H1 2014
ITS / visitor
-1,7%
Evolution Box Office & ITS
28 augustus 2014 17
* Box Office revenue after deduction of indirect taxes, including VPF revenue

0
4
8
12
16
20
H1 2013 H2 2013 H1 2014
Sales & Events€m
Revenue by Business (1)
28 augustus 2014
0
1
2
3
4
5
H1 2013 H2 2103 H1 2014
Screen Advertising€m
-9,8%
18
* *
* Excluding Brightfish * Excluding Brightfish
0
20
40
60
80
100
120
H1 2013 H2 2013 H1 2014
Cinema Revenue€m
8,88,4 9,8
+1,6%
Visitors
+4,1%
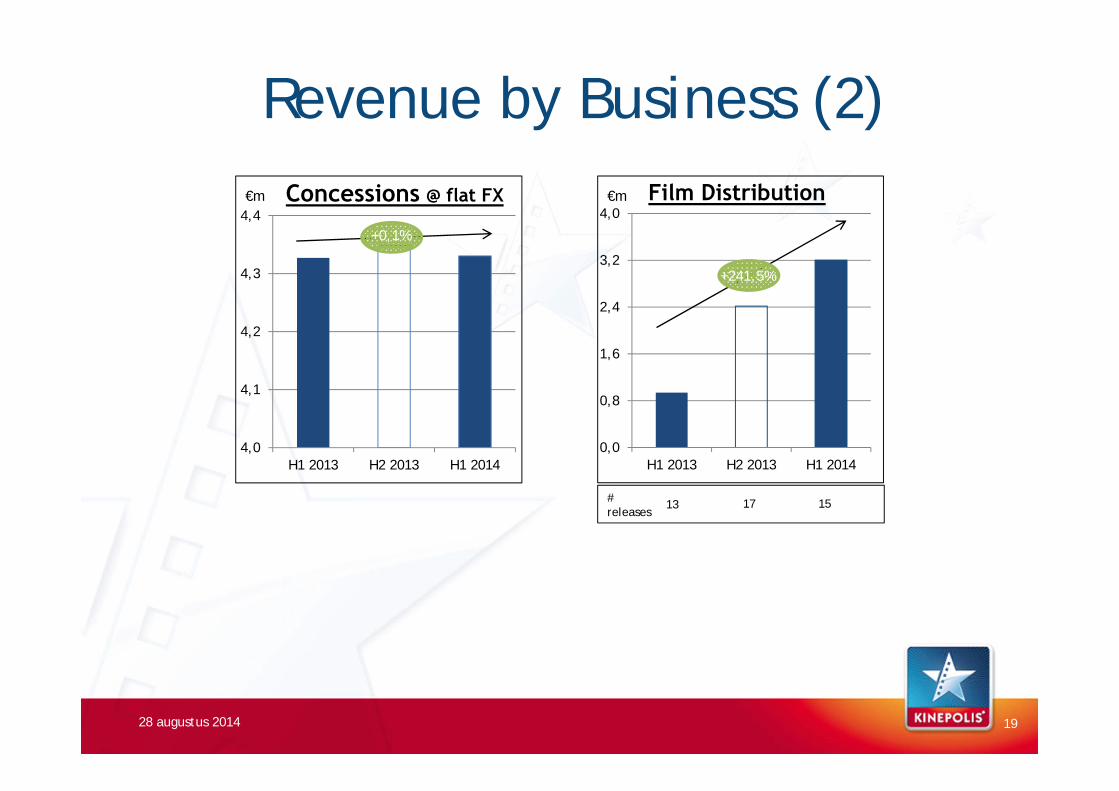
4,0
4,1
4,2
4,3
4,4
H1 2013 H2 2013 H1 2014
Concessions @ flat FX€m
Revenue by Business (2)
28 augustus 2014
0,0
0,8
1,6
2,4
3,2
4,0
H1 2013 H2 2013 H1 2014
Film Distribution€m
19
# releases
1513 17
+241,5%
+0,1%
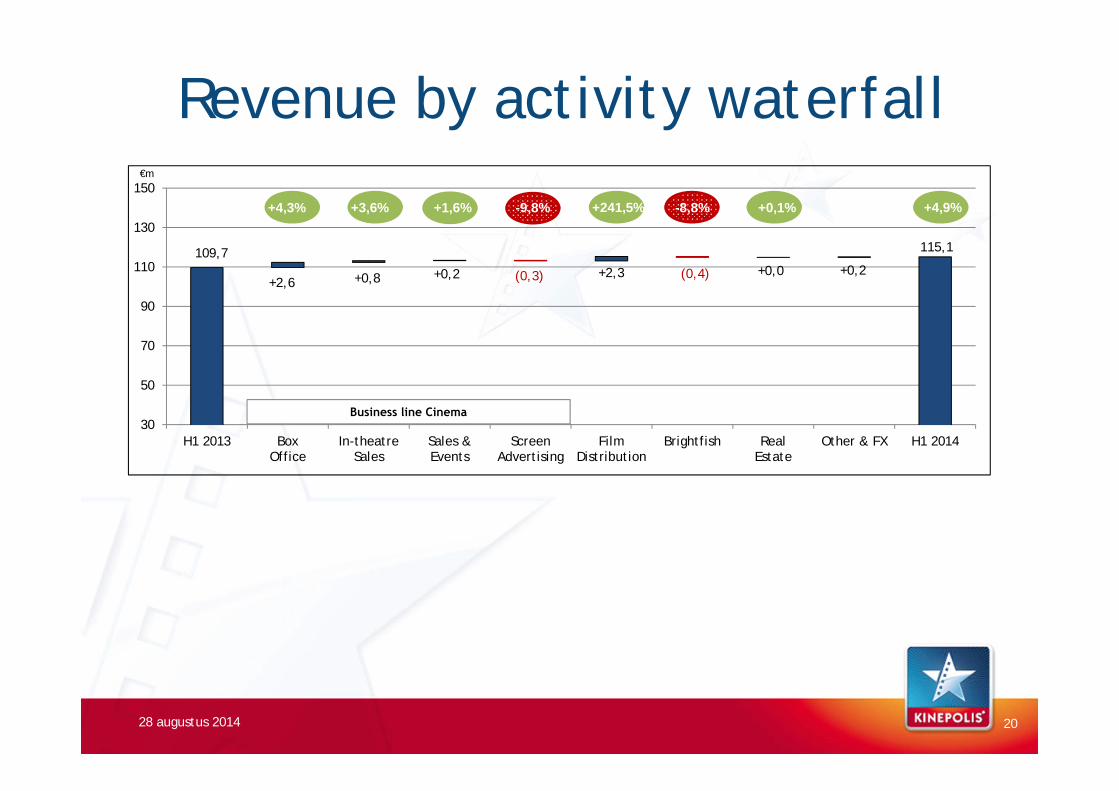
109,7
+2,6 +0,8 +0,2 (0,3) +2,3 (0,4) +0,0 +0,2
115,1
30
50
70
90
110
130
150
H1 2013 BoxOffice
In-theatreSales
Sales &Events
ScreenAdvertising
FilmDistribution
Brightfish RealEstate
Other & FX H1 2014
+x,x%
Revenue by activity waterfall
28 augustus 2014 20
Business line Cinema
+1,6% -9,8% +0,1%
€m
-8,8%+241,5% +4,9%+4,3% +3,6%
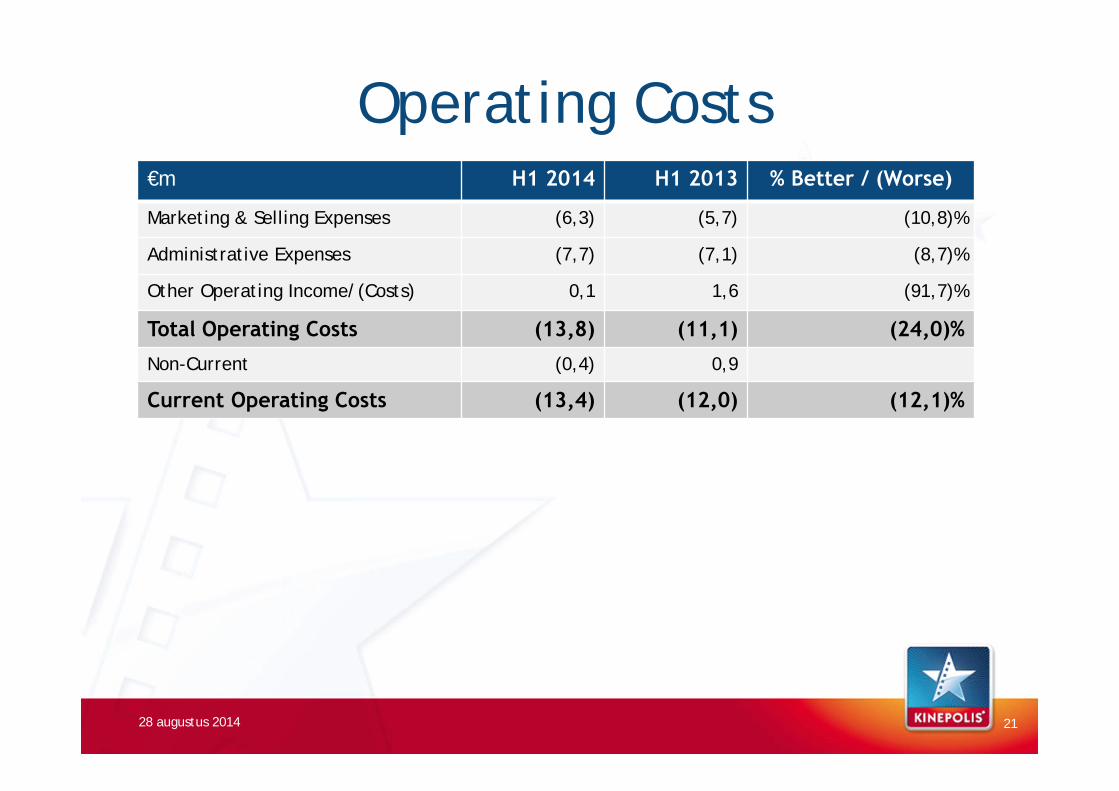
Operating Costs€m H1 2014 H1 2013 % Better / (Worse)
Marketing & Selling Expenses (6,3) (5,7) (10,8)%
Administrative Expenses (7,7) (7,1) (8,7)%
Other Operating Income/(Costs) 0,1 1,6 (91,7)%
Total Operating Costs (13,8) (11,1) (24,0)%
Non-Current (0,4) 0,9
Current Operating Costs (13,4) (12,0) (12,1)%
28 augustus 2014 21
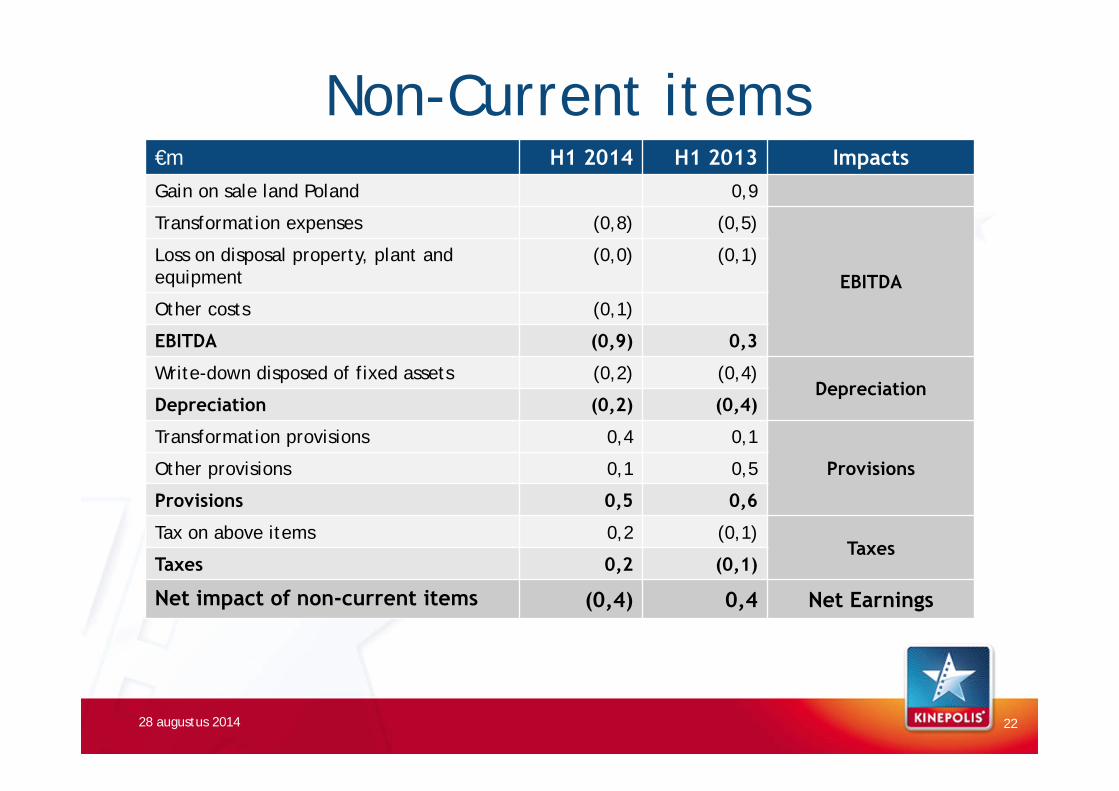
Non-Current items€m H1 2014 H1 2013 ImpactsGain on sale land Poland 0,9
Transformation expenses (0,8) (0,5)
EBITDALoss on disposal property, plant and equipment
(0,0) (0,1)
Other costs (0,1)
EBITDA (0,9) 0,3
Write-down disposed of fixed assets (0,2) (0,4)Depreciation
Depreciation (0,2) (0,4)
Transformation provisions 0,4 0,1
ProvisionsOther provisions 0,1 0,5
Provisions 0,5 0,6
Tax on above items 0,2 (0,1)Taxes
Taxes 0,2 (0,1)
Net impact of non-current items (0,4) 0,4 Net Earnings
28 augustus 2014 22
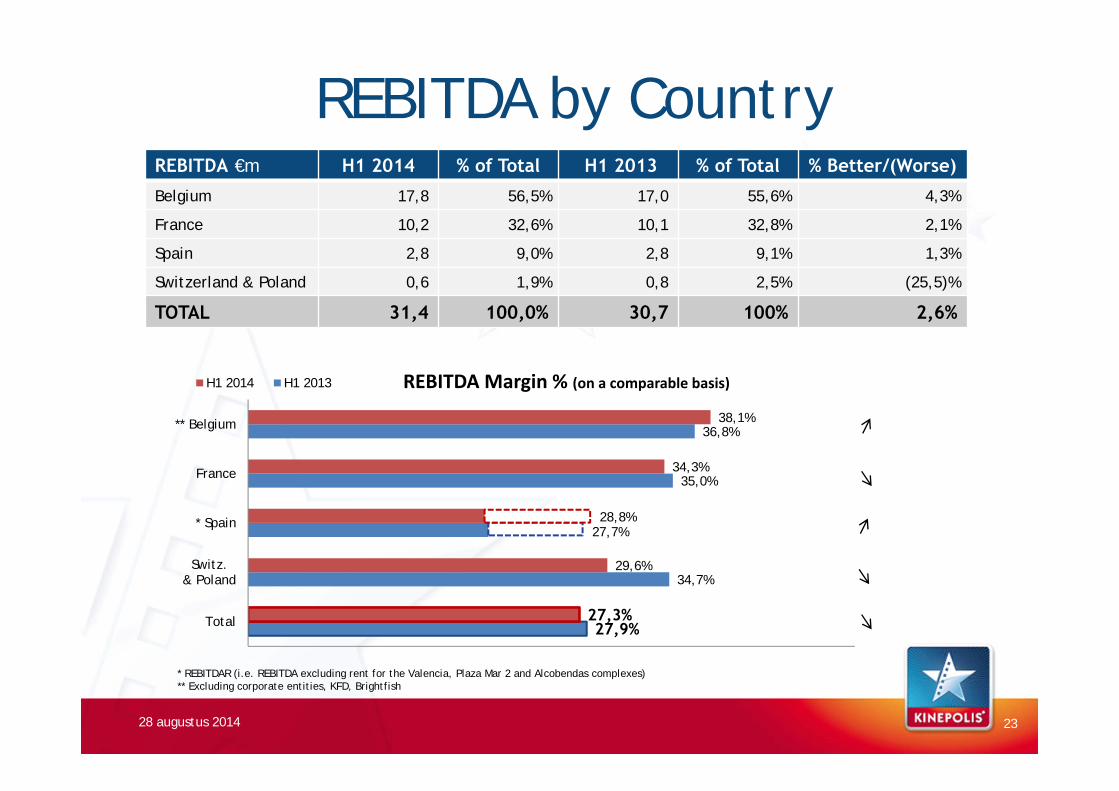
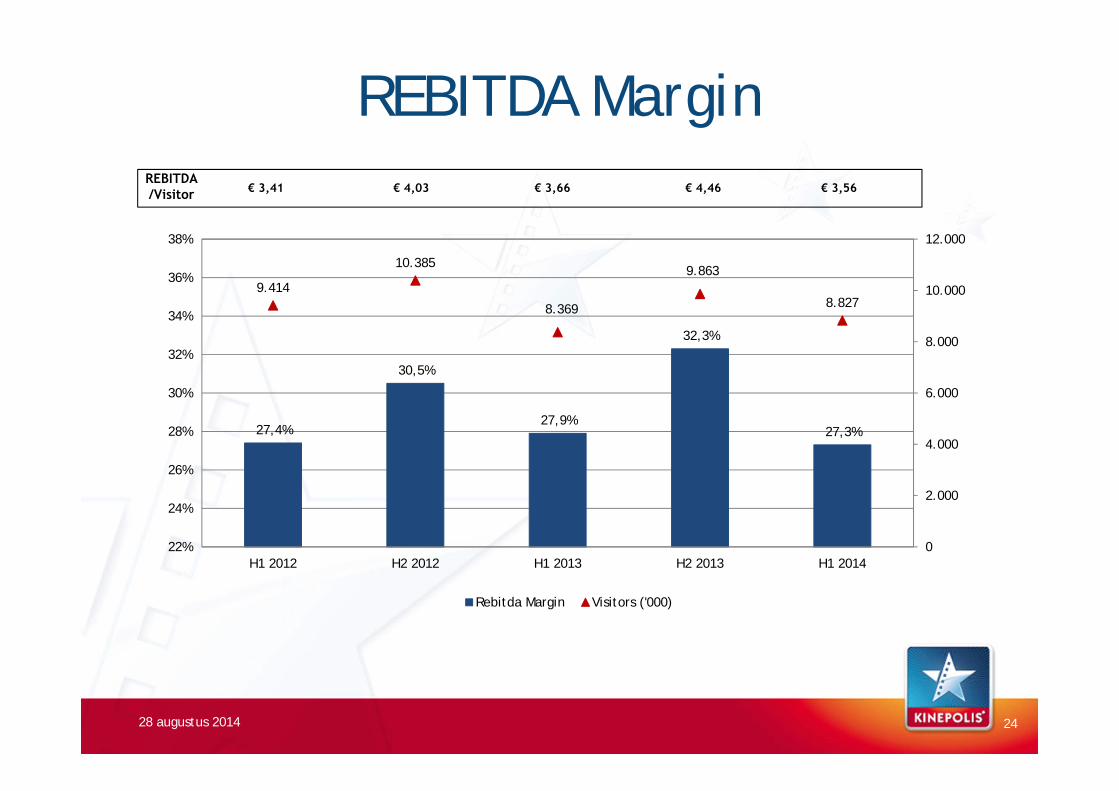
27,9%
34,7%
35,0%
36,8%
27,3%
29,6%
34,3%
38,1%
Total
Switz.& Poland
* Spain
France
** Belgium
REBITDA Margin % (on a comparable basis)H1 2014 H1 2013
REBITDA by Country
28 augustus 2014
REBITDA €m H1 2014 % of Total H1 2013 % of Total % Better/(Worse)
Belgium 17,8 56,5% 17,0 55,6% 4,3%
France 10,2 32,6% 10,1 32,8% 2,1%
Spain 2,8 9,0% 2,8 9,1% 1,3%
Switzerland & Poland 0,6 1,9% 0,8 2,5% (25,5)%
TOTAL 31,4 100,0% 30,7 100% 2,6%
* REBITDAR (i.e. REBITDA excluding rent for the Valencia, Plaza Mar 2 and Alcobendas complexes) ** Excluding corporate entities, KFD, Brightfish
23
27,7%28,8%
REBITDA Margin
28 augustus 2014 24
REBITDA/Visitor
27,4%
30,5%
27,9%
32,3%
27,3%
9.414
10.385
8.369
9.863
8.827
0
2.000
4.000
6.000
8.000
10.000
12.000
22%
24%
26%
28%
30%
32%
34%
36%
38%
H1 2012 H2 2012 H1 2013 H2 2013 H1 2014
Rebitda Margin Visitors ('000)
€ 3,66€ 4,03€ 3,41 € 3,56€ 4,46
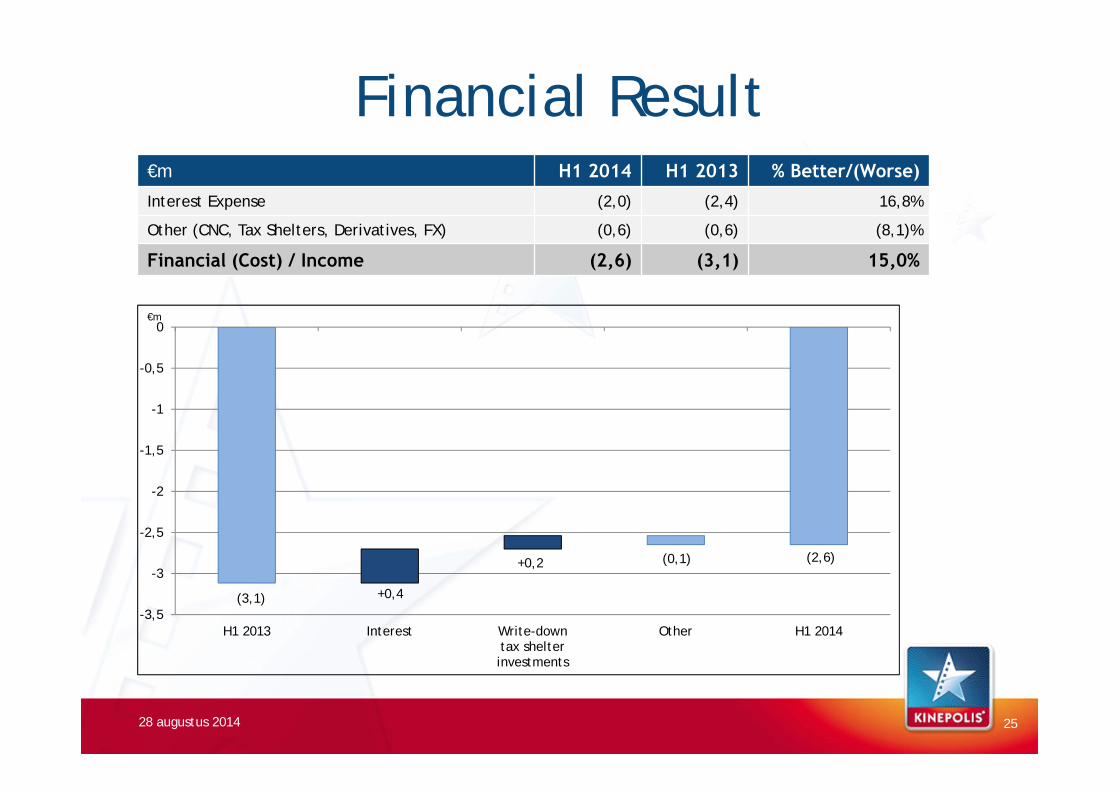
Financial Result
28 augustus 2014
€m H1 2014 H1 2013 % Better/(Worse)
Interest Expense (2,0) (2,4) 16,8%
Other (CNC, Tax Shelters, Derivatives, FX) (0,6) (0,6) (8,1)%
Financial (Cost) / Income (2,6) (3,1) 15,0%
25
(3,1) +0,4
+0,2 (0,1) (2,6)
-3,5
-3
-2,5
-2
-1,5
-1
-0,5
0
H1 2013 Interest Write-downtax shelterinvestments
Other H1 2014
€m
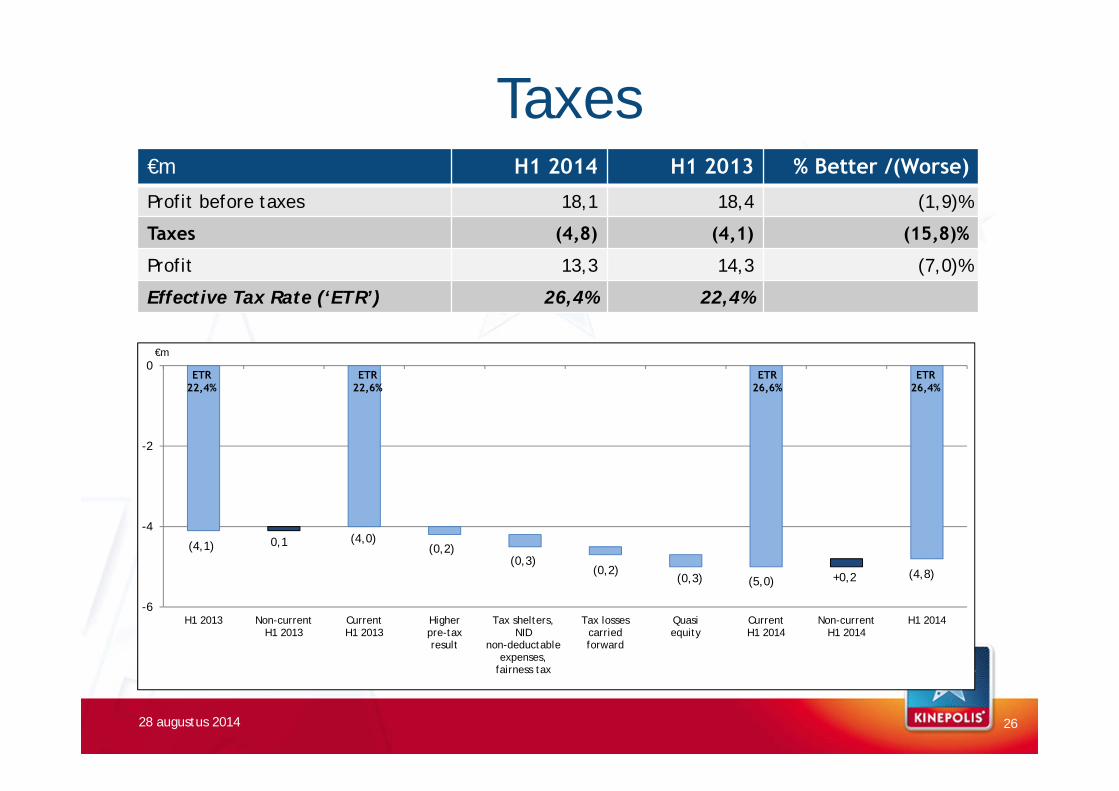
Taxes€m H1 2014 H1 2013 % Better /(Worse)
Profit before taxes 18,1 18,4 (1,9)%
Taxes (4,8) (4,1) (15,8)%
Profit 13,3 14,3 (7,0)%
Effective Tax Rate (‘ETR’) 26,4% 22,4%
28 augustus 2014 26
(4,1) 0,1 (4,0)(0,2)
(0,3)(0,2)
(0,3) (5,0) +0,2 (4,8)
-6
-4
-2
0
H1 2013 Non-currentH1 2013
CurrentH1 2013
Higherpre-taxresult
Tax shelters,NID
non-deductableexpenses,
fairness tax
Tax lossescarriedforward
Quasiequity
CurrentH1 2014
Non-currentH1 2014
H1 2014
€m
ETR22,4%
ETR22,6%
ETR26,4%
ETR26,6%

Free Cash Flow H1 2014
28 augustus 2014 27
29,5 (2,8)
(6,7)
(4,5)
(3,9)
11,6
0
5
10
15
20
25
30
35
EBITDA + OtherFinancial Result(corrected for
non-cash items)
Income TaxPaid
WorkingCapital
Movement
Capex - Maintenance InterestPaid
FCFH1 2014
€m
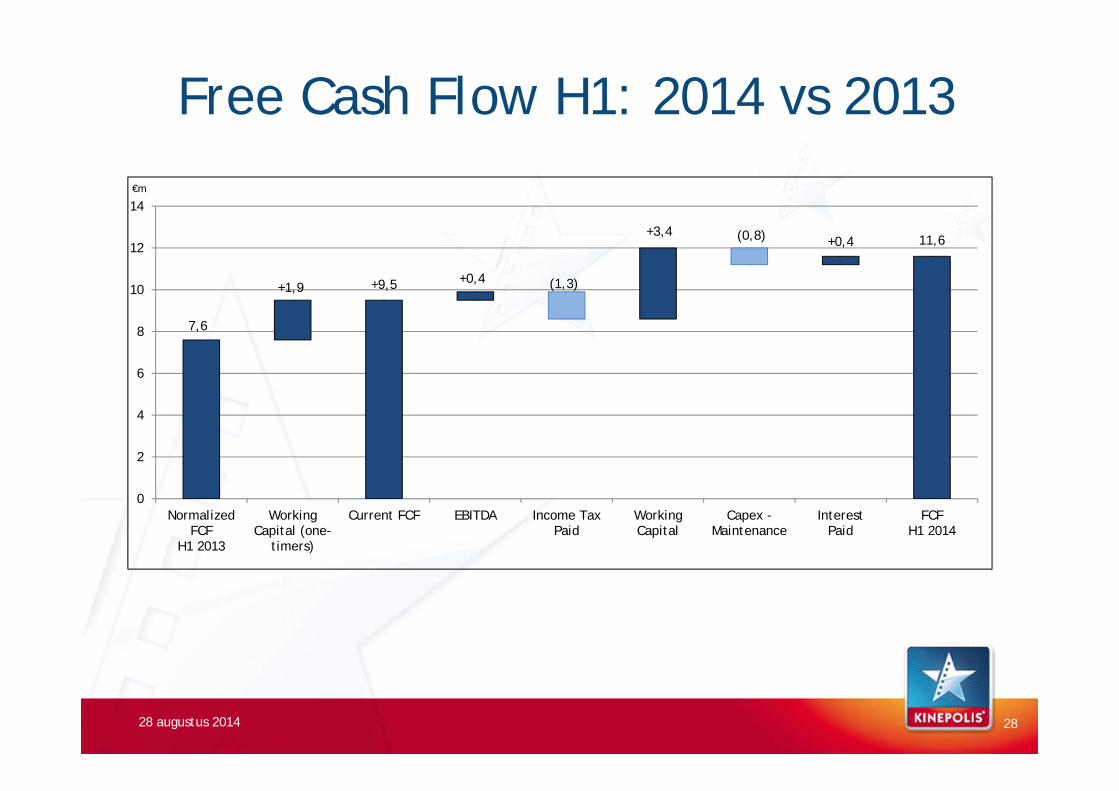
Free Cash Flow H1: 2014 vs 2013
28 augustus 2014 28
7,6
+1,9 +9,5 +0,4 (1,3)
+3,4 (0,8) +0,4 11,6
0
2
4
6
8
10
12
14
NormalizedFCF
H1 2013
WorkingCapital (one-
timers)
Current FCF EBITDA Income TaxPaid
WorkingCapital
Capex -Maintenance
InterestPaid
FCFH1 2014
€m
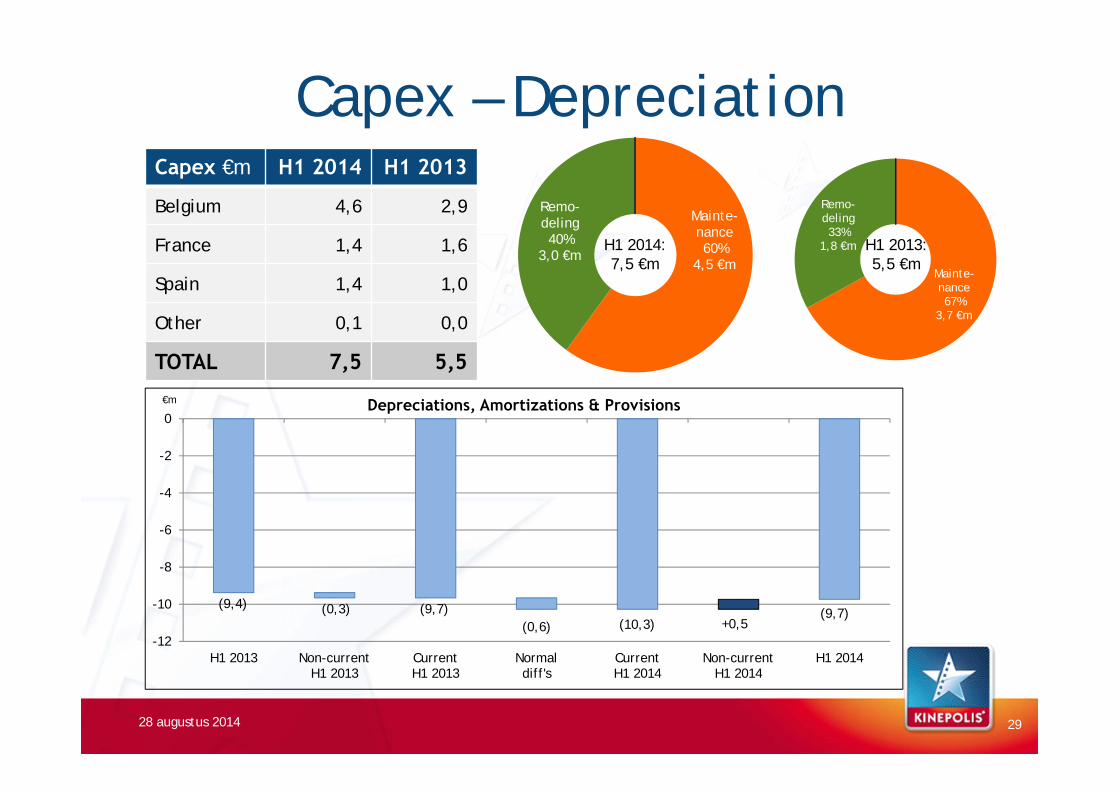
Mainte-nance67%
3,7 €m
Remo-deling33%
1,8 €m
Capex – Depreciation
28 augustus 2014
Capex €m H1 2014 H1 2013
Belgium 4,6 2,9
France 1,4 1,6
Spain 1,4 1,0
Other 0,1 0,0
TOTAL 7,5 5,5
29
H1 2013:5,5 €m
€m
(9,4) (0,3) (9,7)(0,6) (10,3) +0,5
(9,7)
-12
-10
-8
-6
-4
-2
0
H1 2013 Non-currentH1 2013
CurrentH1 2013
Normaldiff's
CurrentH1 2014
Non-currentH1 2014
H1 2014
Depreciations, Amortizations & Provisions
Mainte-nance60%
4,5 €m
Remo-deling40%
3,0 €mH1 2014:7,5 €m
Net Financial Debt Evolution
28 augustus 2014
€m 30 Jun 2014 31 Dec 2013 Better/(Worse) % Better/(Worse)
Net Financial Debt (NFD) 97,9 88,1 (9,8) (11,1)%
Leverage ratio*: NFD / EBITDA 1,3 1,2
0,0
0,5
1,0
1,5
2,0
2,5
3,0
3,5
€ 0
€ 20
€ 40
€ 60
€ 80
€ 100
€ 120
€ 140
YE 08 YE 09 YE 10 YE 11 YE 12 H1 13 YE 13 H1 14
Net Financial Debt EBITDA (12M rolling) NFD/EBITDA
3,50 X
* Not Clubdeal definition
30
€m
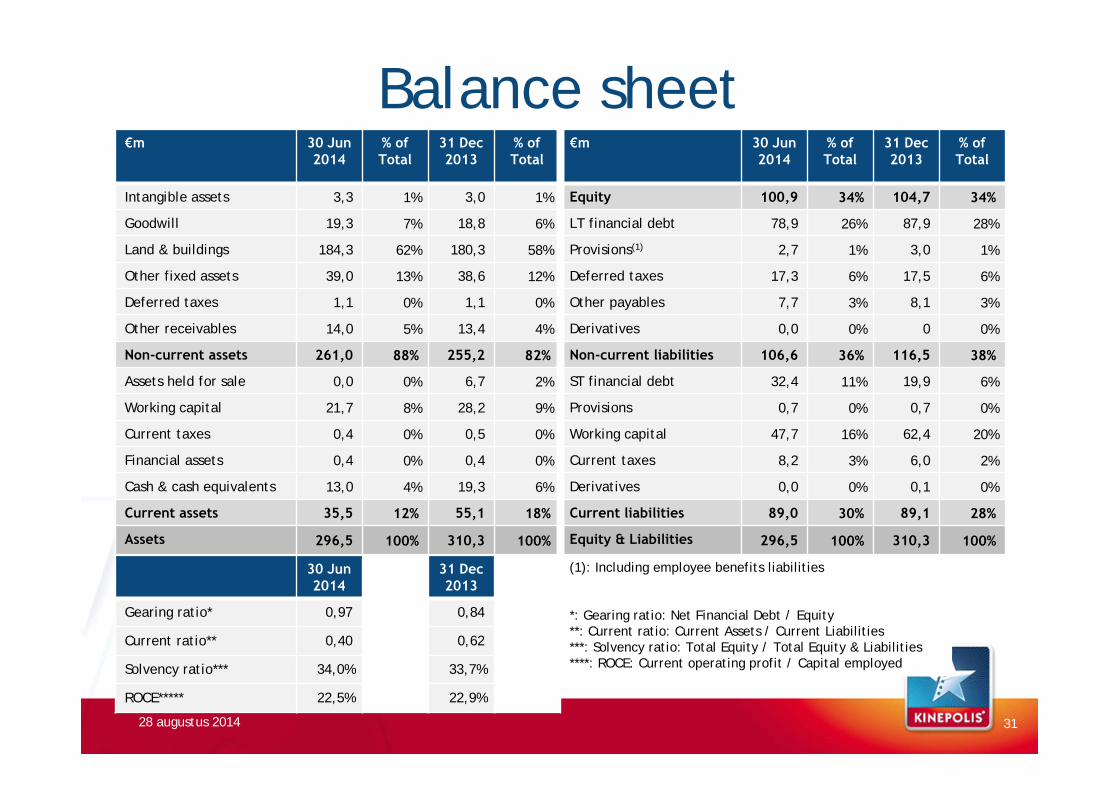
Balance sheet€m 30 Jun
2014% of Total
31 Dec2013
% of Total
€m 30 Jun2014
% of Total
31 Dec2013
% of Total
Intangible assets 3,3 1% 3,0 1% Equity 100,9 34% 104,7 34%
Goodwill 19,3 7% 18,8 6% LT financial debt 78,9 26% 87,9 28%
Land & buildings 184,3 62% 180,3 58% Provisions(1) 2,7 1% 3,0 1%
Other fixed assets 39,0 13% 38,6 12% Deferred taxes 17,3 6% 17,5 6%
Deferred taxes 1,1 0% 1,1 0% Other payables 7,7 3% 8,1 3%
Other receivables 14,0 5% 13,4 4% Derivatives 0,0 0% 0 0%
Non-current assets 261,0 88% 255,2 82% Non-current liabilities 106,6 36% 116,5 38%
Assets held for sale 0,0 0% 6,7 2% ST financial debt 32,4 11% 19,9 6%
Working capital 21,7 8% 28,2 9% Provisions 0,7 0% 0,7 0%
Current taxes 0,4 0% 0,5 0% Working capital 47,7 16% 62,4 20%
Financial assets 0,4 0% 0,4 0% Current taxes 8,2 3% 6,0 2%
Cash & cash equivalents 13,0 4% 19,3 6% Derivatives 0,0 0% 0,1 0%
Current assets 35,5 12% 55,1 18% Current liabilities 89,0 30% 89,1 28%
Assets 296,5 100% 310,3 100% Equity & Liabilities 296,5 100% 310,3 100%
28 augustus 2014 31
(1): Including employee benefits liabilities
*: Gearing ratio: Net Financial Debt / Equity**: Current ratio: Current Assets / Current Liabilities***: Solvency ratio: Total Equity / Total Equity & Liabilities****: ROCE: Current operating profit / Capital employed
30 Jun2014
31 Dec2013
Gearing ratio* 0,97 0,84
Current ratio** 0,40 0,62
Solvency ratio*** 34,0% 33,7%
ROCE***** 22,5% 22,9%

Shareholders1/07/2014 14/02/2014
# Shares % # Shares %
Total shares outstanding 27.913.270 100 % 5.582.654 100 %
28 augustus 2014
* Resulting from transparency notices received
Other* # Shares % # Shares %Axa SA 1.523.555 5,45% 304.711 5,45%
BNP Paribas Investment Partners SA 1.406.080 5,04% 281.216 5,04%
Refence Shareholders & Free Float # Shares % # Shares %Kinohold Bis and Mr. Joost Bert 12.908.050 46,24% 2.581.610 46,24%
Treasury shares (Own shares) 1.518.015 5,44% 303.603 5,44%
Free Float 13.487.205 48,32% 2.697.441 48,32%
32
Number of shares multiplied by five due to share split as from 1/07/2014
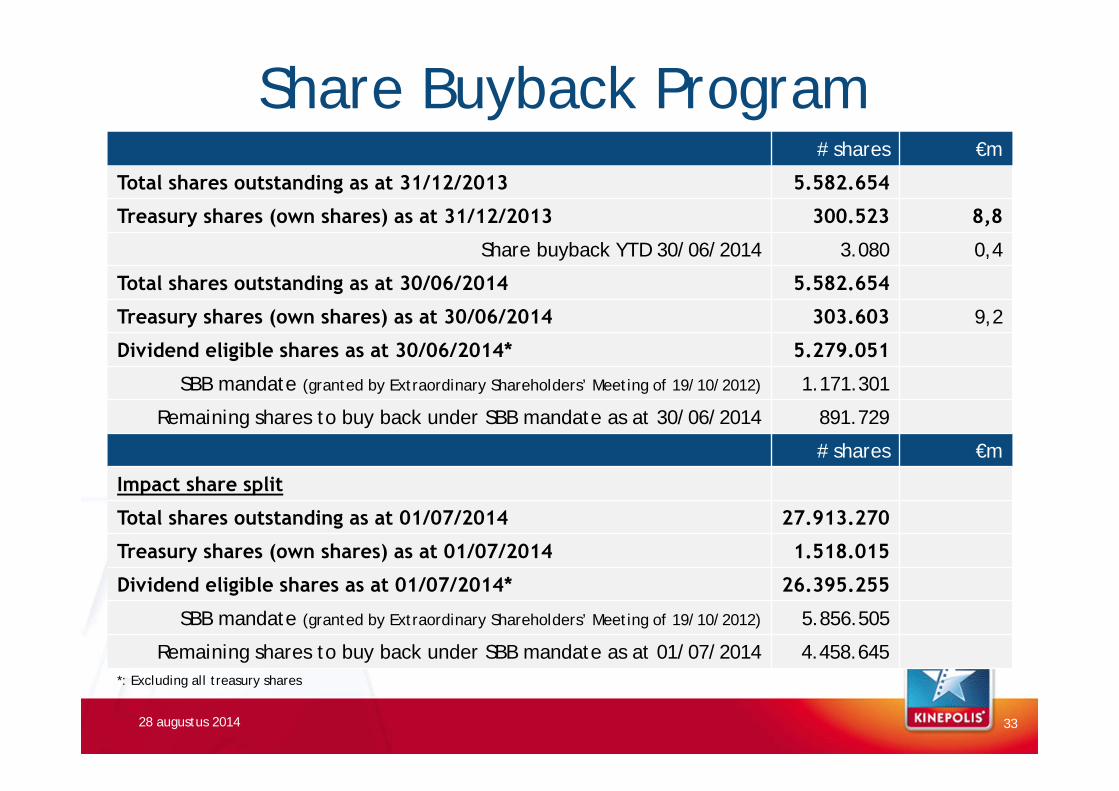
Share Buyback Program# shares €m
Total shares outstanding as at 31/12/2013 5.582.654
Treasury shares (own shares) as at 31/12/2013 300.523 8,8
Share buyback YTD 30/06/2014 3.080 0,4
Total shares outstanding as at 30/06/2014 5.582.654
Treasury shares (own shares) as at 30/06/2014 303.603 9,2
Dividend eligible shares as at 30/06/2014* 5.279.051
SBB mandate (granted by Extraordinary Shareholders’ Meeting of 19/10/2012) 1.171.301
Remaining shares to buy back under SBB mandate as at 30/06/2014 891.729
# shares €m
Impact share split
Total shares outstanding as at 01/07/2014 27.913.270
Treasury shares (own shares) as at 01/07/2014 1.518.015
Dividend eligible shares as at 01/07/2014* 26.395.255
SBB mandate (granted by Extraordinary Shareholders’ Meeting of 19/10/2012) 5.856.505
Remaining shares to buy back under SBB mandate as at 01/07/2014 4.458.645
28 augustus 2014 33
*: Excluding all treasury shares
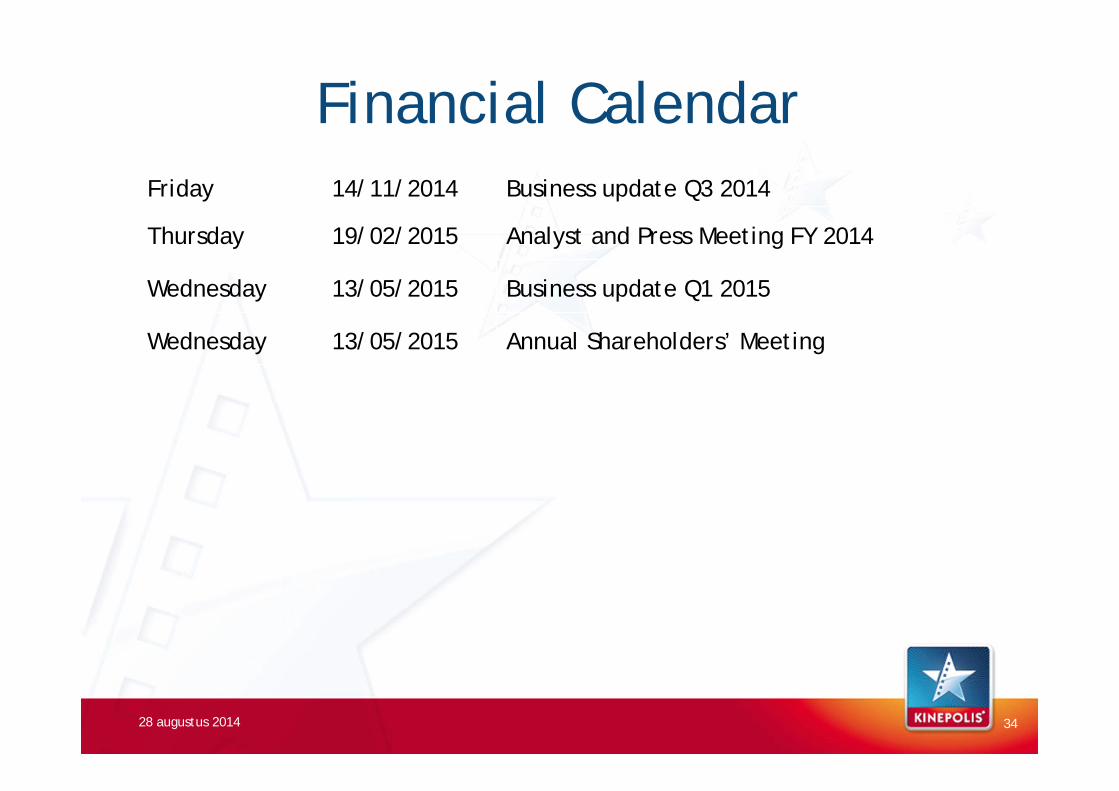
Financial Calendar
28 augustus 2014
Friday 14/11/2014 Business update Q3 2014
Thursday 19/02/2015 Analyst and Press Meeting FY 2014
Wednesday 13/05/2015 Business update Q1 2015
Wednesday 13/05/2015 Annual Shareholders’ Meeting
34

Q & A
Thank You.
28 augustus 2014 35