Presentación de PowerPoint - Gobinvestigacionsalud.gob.ec/webs/episig/wp-content/... · Plan 19th...
32
Workshop Vector distribution modeling in Geographic Information System (GIS) Quito, 19 th july 2016
Transcript of Presentación de PowerPoint - Gobinvestigacionsalud.gob.ec/webs/episig/wp-content/... · Plan 19th...
WorkshopVector distribution modeling
in Geographic Information System (GIS)
Quito, 19th july 2016
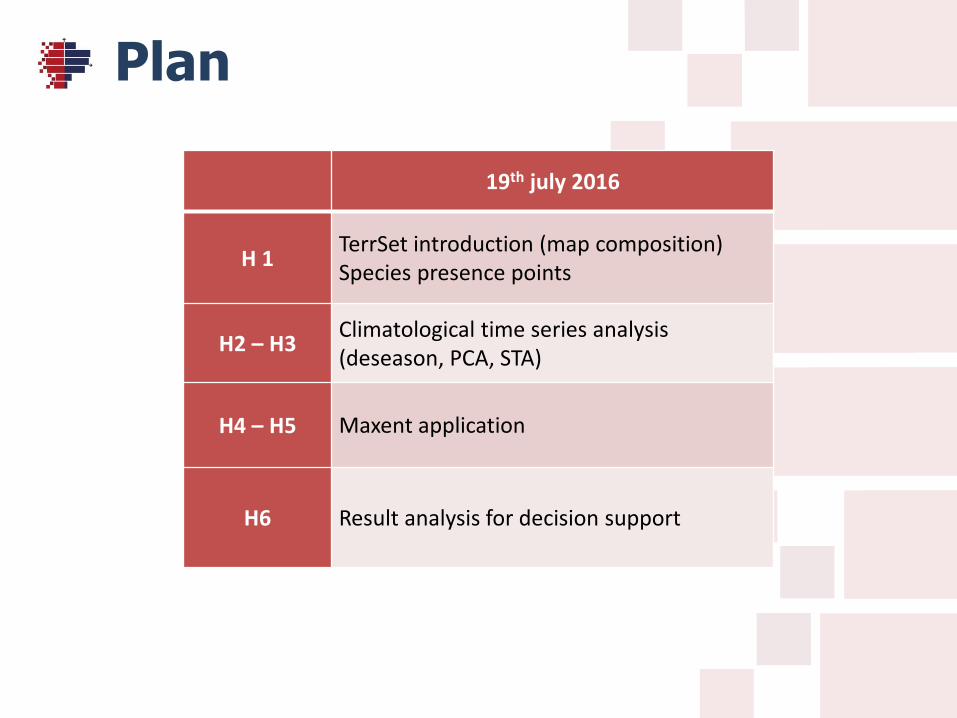
Plan
19th july 2016
H 1TerrSet introduction (map composition)Species presence points
H2 – H3Climatological time series analysis(deseason, PCA, STA)
H4 – H5 Maxent application
H6 Result analysis for decision support
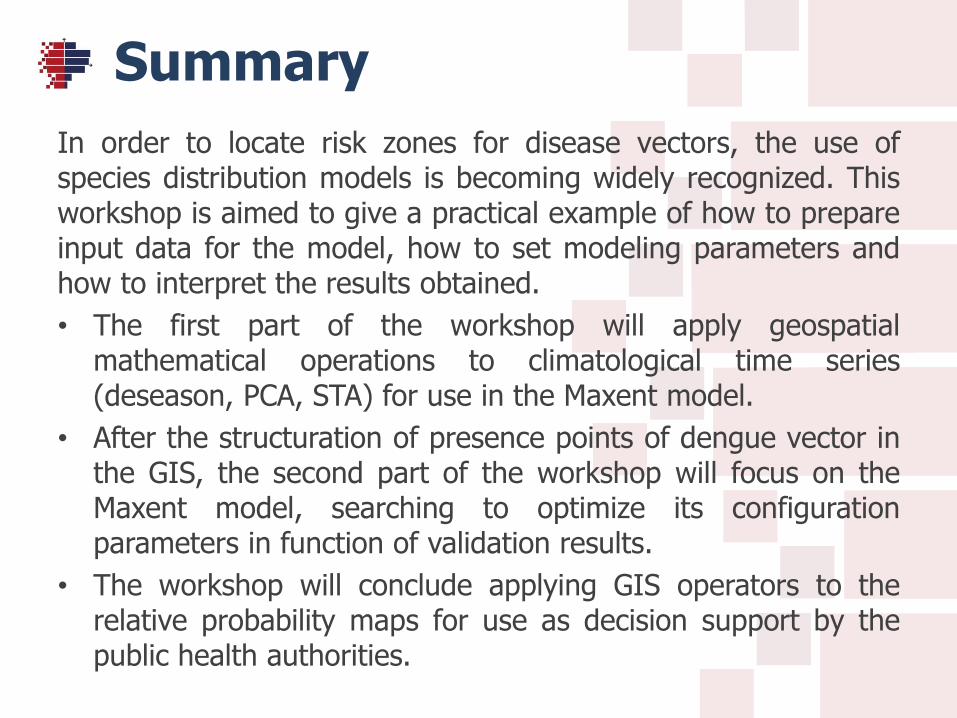
Summary
In order to locate risk zones for disease vectors, the use ofspecies distribution models is becoming widely recognized. Thisworkshop is aimed to give a practical example of how to prepareinput data for the model, how to set modeling parameters andhow to interpret the results obtained.
• The first part of the workshop will apply geospatialmathematical operations to climatological time series(deseason, PCA, STA) for use in the Maxent model.
• After the structuration of presence points of dengue vector inthe GIS, the second part of the workshop will focus on theMaxent model, searching to optimize its configurationparameters in function of validation results.
• The workshop will conclude applying GIS operators to therelative probability maps for use as decision support by thepublic health authorities.
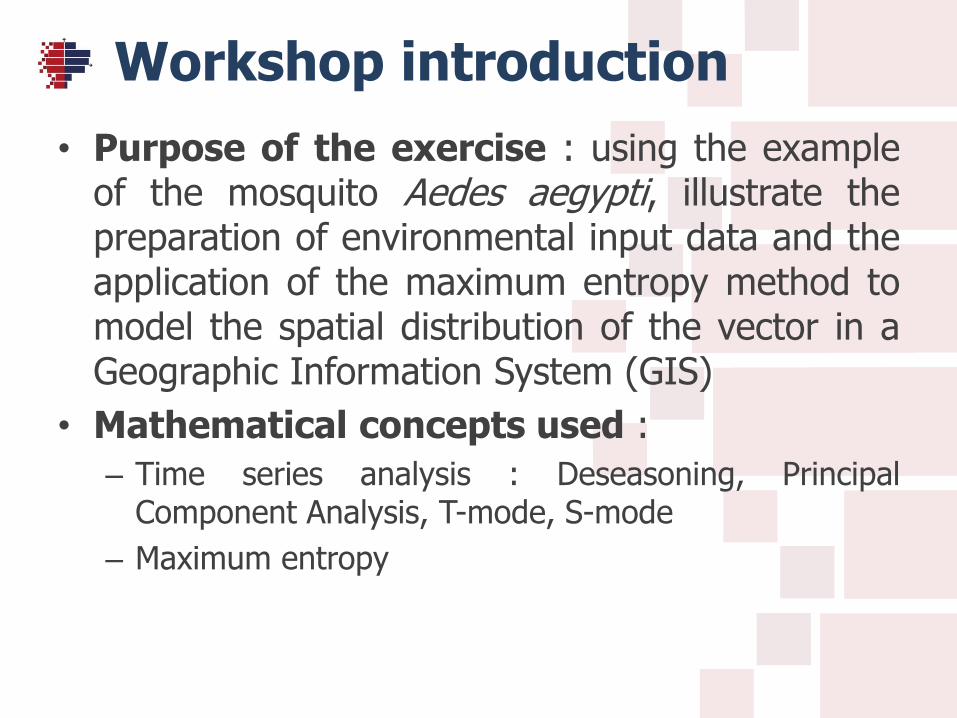
Workshop introduction
• Purpose of the exercise : using the exampleof the mosquito Aedes aegypti, illustrate thepreparation of environmental input data and theapplication of the maximum entropy method tomodel the spatial distribution of the vector in aGeographic Information System (GIS)
• Mathematical concepts used :
– Time series analysis : Deseasoning, PrincipalComponent Analysis, T-mode, S-mode
– Maximum entropy
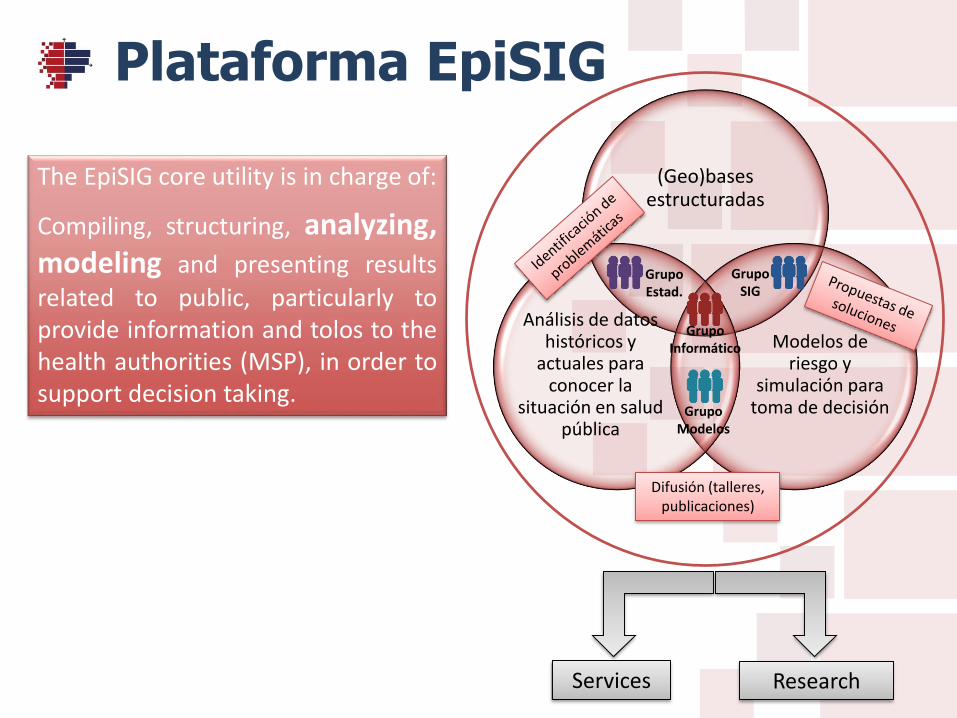
(Geo)bases estructuradas
Modelos de riesgo y
simulación para toma de decisión
Análisis de datos históricos y
actuales para conocer la
situación en salud pública
Grupo SIG
Grupo Estad.
Grupo Modelos
Grupo Informático
Difusión (talleres, publicaciones)
The EpiSIG core utility is in charge of:
Compiling, structuring, analyzing,modeling and presenting results
related to public, particularly toprovide information and tolos to thehealth authorities (MSP), in order tosupport decision taking.
Plataforma EpiSIG
Services Research

INSPI-Clark Labs agreement
• INSPI-EpiSIG = one of the 19 Resource Centers of Clark Labs in the world
https://clarklabs.org/
– Benefits :
• INSPI is provided with a TerrSet server license
• Impulse to be the reference in Ecuador for spatio-temporal modeling using TerrSet, mainly apply to health related problems
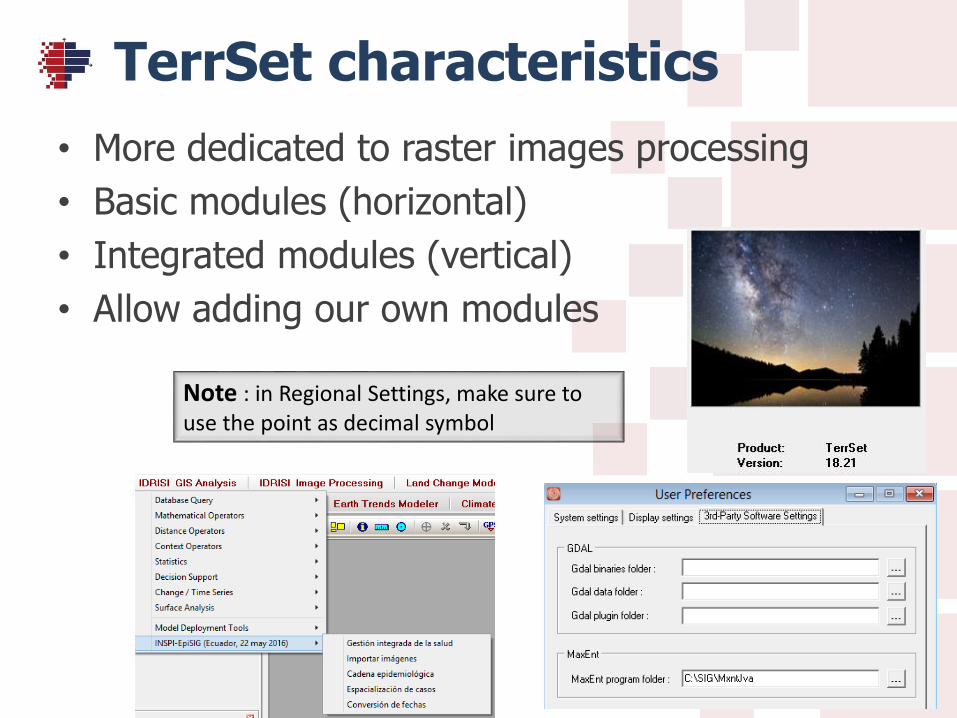
TerrSet characteristics
• More dedicated to raster images processing
• Basic modules (horizontal)
• Integrated modules (vertical)
• Allow adding our own modules
Note : in Regional Settings, make sure to use the point as decimal symbol
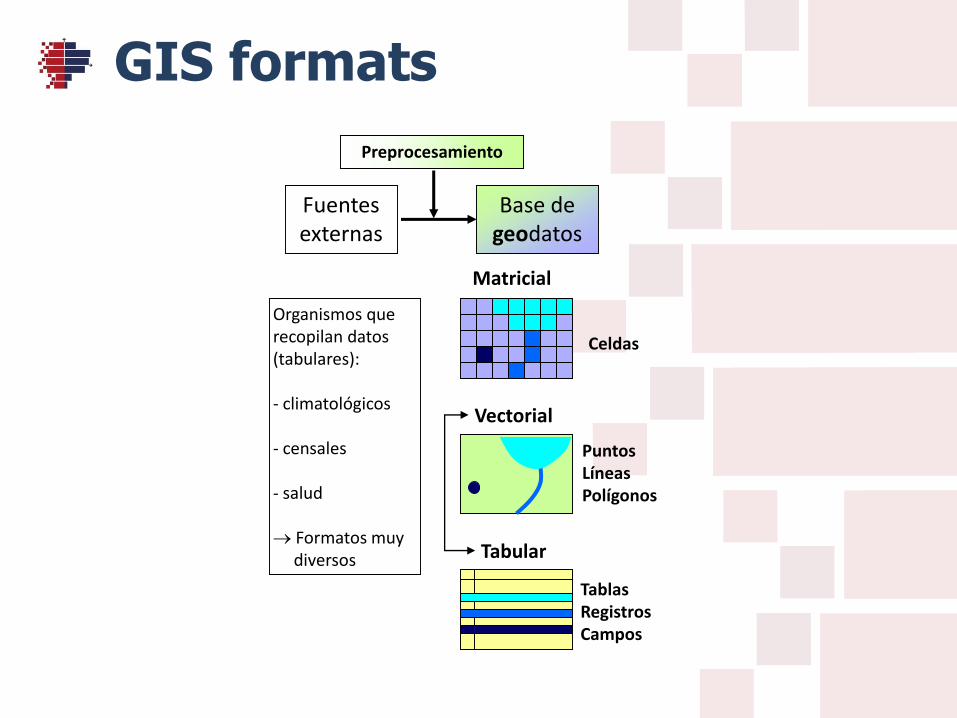
GIS formats
Fuentesexternas
Organismos que recopilan datos (tabulares):
- climatológicos
- censales
- salud
Formatos muydiversos
Matricial
Celdas
Vectorial
PuntosLíneasPolígonos
Tabular
TablasRegistrosCampos
Base degeodatos
Preprocesamiento

Vector objectsjetosvectoriales
Point – pair of coordinates x e y (x1,y1)
Line- point list
Polygon – closed line set
node
vertex
Spatial vector entities are of 3 types :

Row number(Rws)
Column number(Cls)
Xmin
Cell size
Rasterorigin 0
0
1
1+
Spatial raster entity is based on the cell or pixel unit.
Cell with special value (Flag)•Background•Missing Data
Xres = (Xmax – Xmin) / Cls
Yres = (Ymax – Ymin) / Rws
XmaxYmin
Ymax
Vectororigin
Raster format
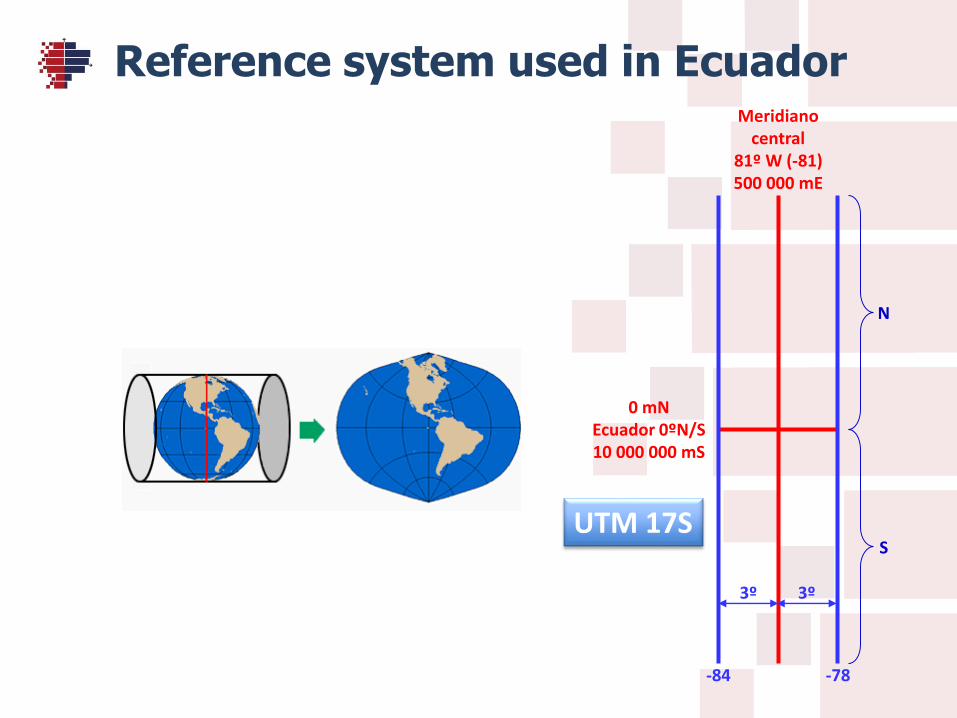
Meridianocentral
81º W (-81)500 000 mE
0 mNEcuador 0ºN/S10 000 000 mS
N
S
3º 3º
-84 -78
Reference system used in Ecuador
UTM 17S

Familiarization with TerrSet
• Exercise : prepare a map composition of theelevation of Ecuador
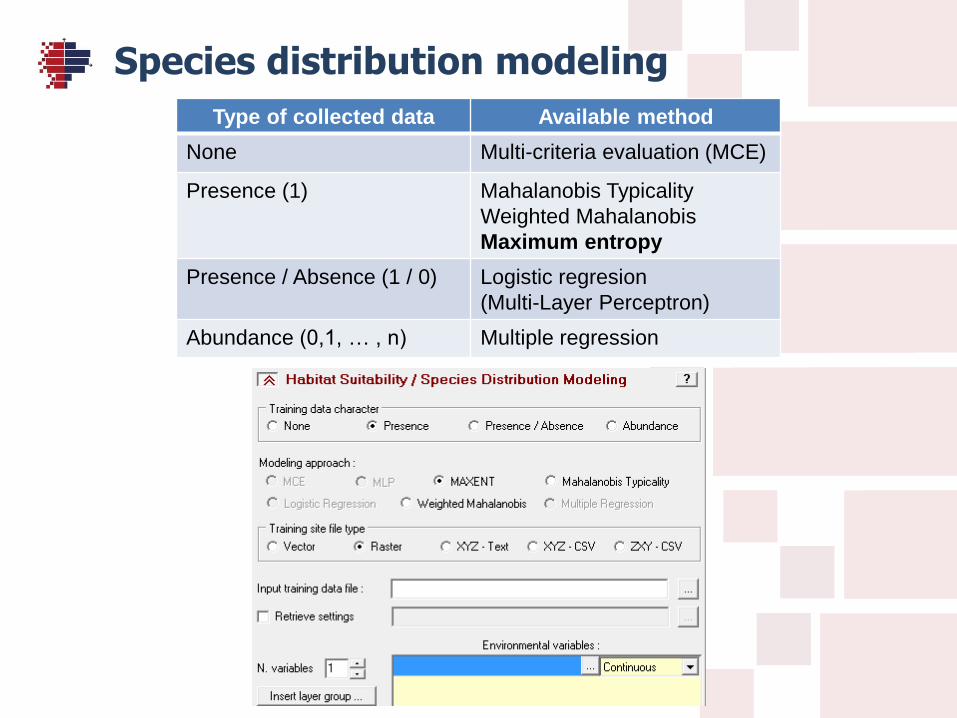
Species distribution modeling
Type of collected data Available method
None Multi-criteria evaluation (MCE)
Presence (1) Mahalanobis Typicality
Weighted Mahalanobis
Maximum entropy
Presence / Absence (1 / 0) Logistic regresion
(Multi-Layer Perceptron)
Abundance (0,1, … , n) Multiple regression

Input images
Explicativevariable
Measure unit Time Time unit Spatialresolution
Source
ElevationSRTM
m (above sea level) 2000 1 mission 1” (~30 m) http://earthexplorer.usgs.gov
PrecipitationTRMM
Intensitymm/h mm
2010-2015
Monthly 0.25°~25 km
ftp://disc2.nascom.nasa.gov/ftp/data/s4pa//TRMM_L3/TRMM_3B43/
TemperatureLST MODIS
Daily mean50×(°C+273.15)°C
2010-2015
Monthly 0.05°5 km
http://e4ftl01.cr.usgs.gov/MOLT/MOD11C3.005/
Land coverMODIS
Vegetation indexVI × 10000 [-1 1]
2010-2015
8-days 250 m http://e4ftl01.cr.usgs.gov/MOLT/MOD13Q1.005/
PopulationINEC
Densityhab/km2
2010 1 census Censustract
http://www.ecuadorencigras.Gob.ec/banco-de-información/
OvercrowdingINEC
Person / bedroom 2010 1 census Censustract
http://www.ecuadorencigras.Gob.ec/banco-de-información/
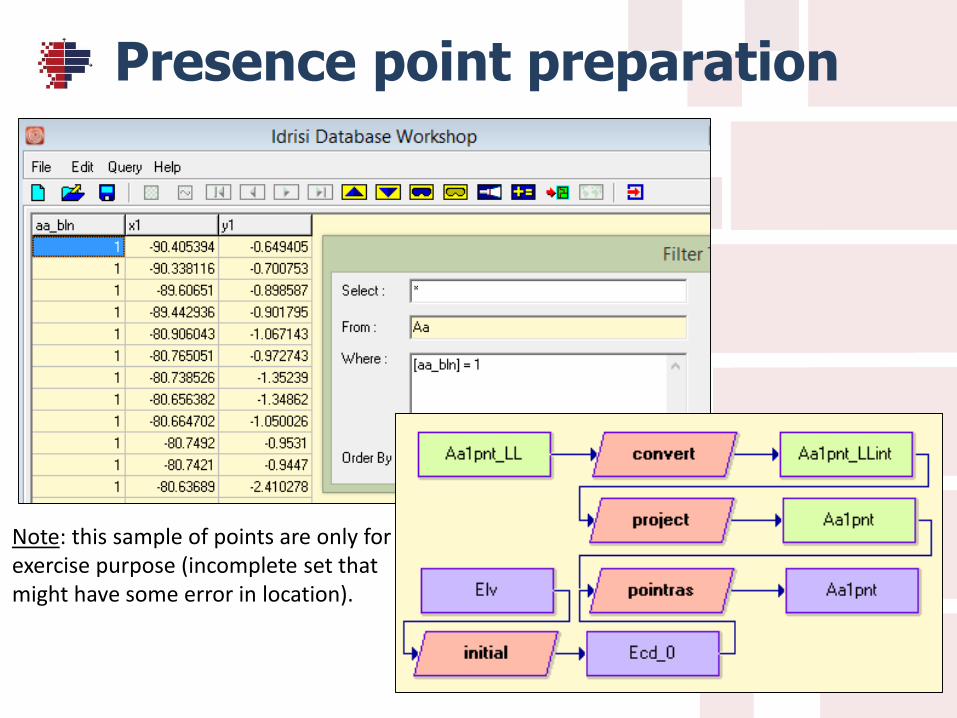
Presence point preparation
Note: this sample of points are only forexercise purpose (incomplete set thatmight have some error in location).
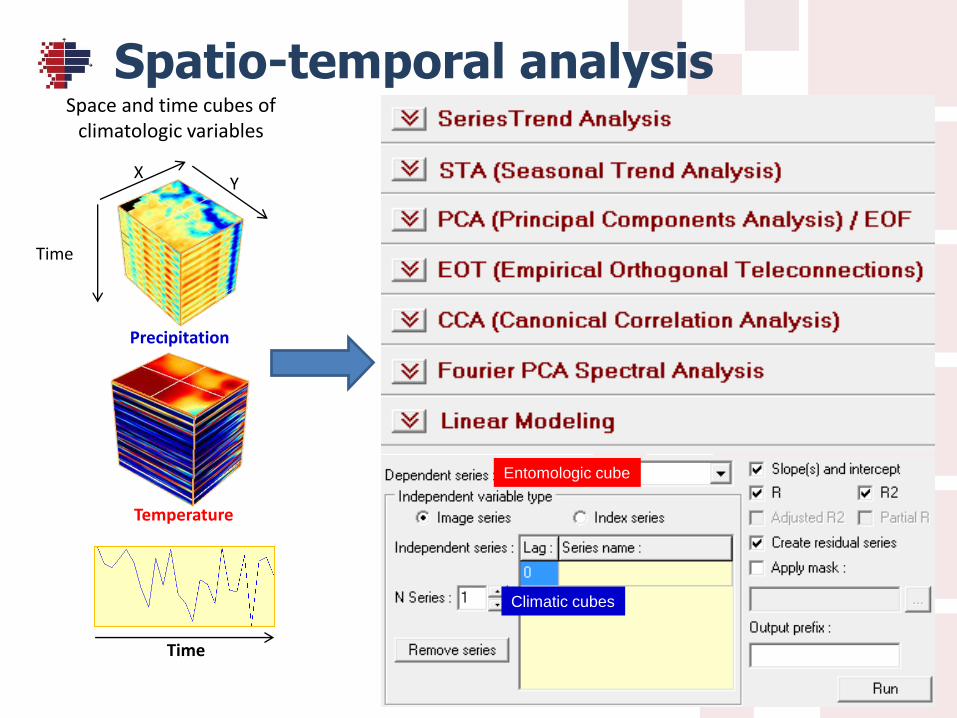
Spatio-temporal analysisSpace and time cubes of
climatologic variables
XY
Time
Precipitation
Temperature
Time
Entomologic cube
Climatic cubes

Time series analysis
Method Purpose Apply to deseasoned serie
Series Trend Analysis Interannual trend Should
STA (Seasonal Trend Analysis) Annual seasonalprogression
No
PCA (Principal ComponentsAnalysis) / EOF
Irregular but recurrent patterns in space/time
Should
EOT (Empirical OrthogonalTeleconnections)
Related patterns of variation between widely separated areas of the globe
ShouldTime-consuming
CCA (Canonical Correlation Analysis) Requires 2 series
Fourier PCA Spectral Analysis Cyclical components Should not
Linear Modeling Requires 2 series Should
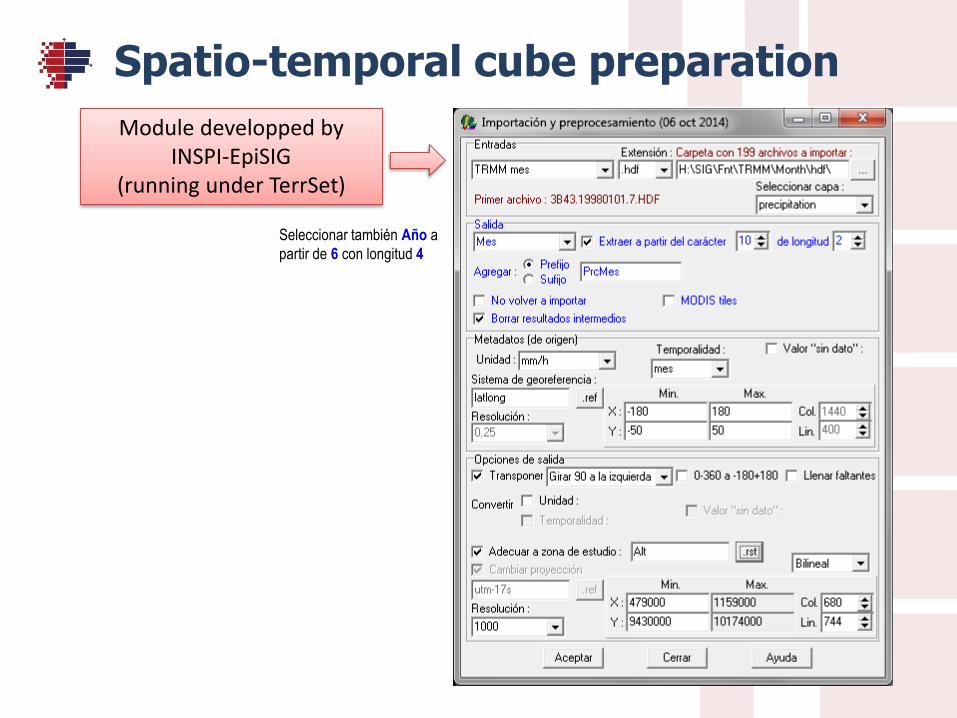
Spatio-temporal cube preparation
Seleccionar también Año a
partir de 6 con longitud 4
Module developped byINSPI-EpiSIG
(running under TerrSet)
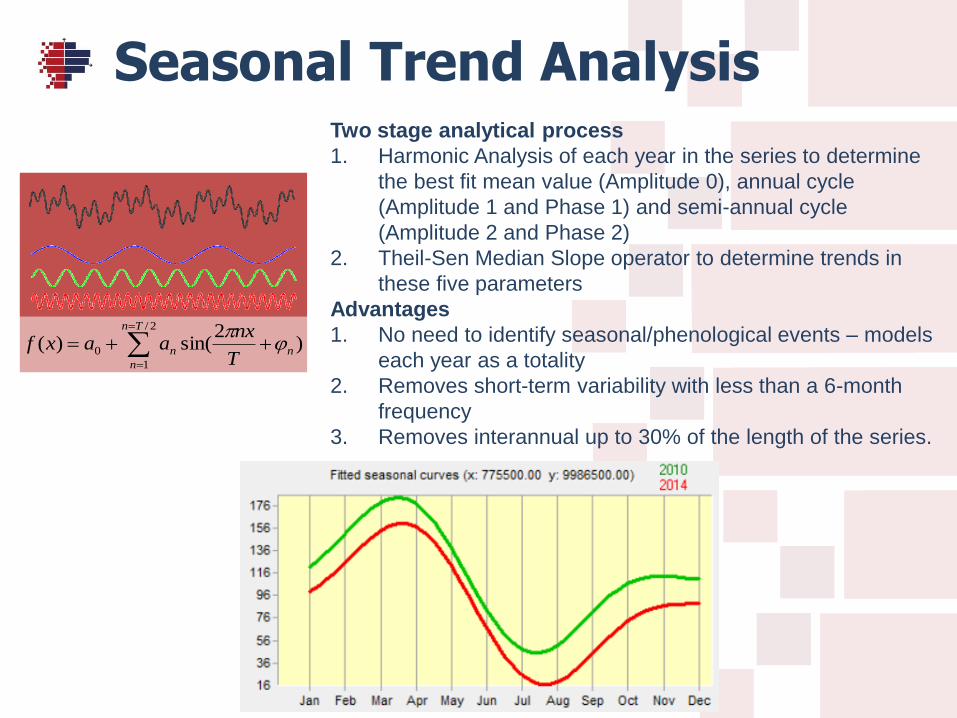
Seasonal Trend AnalysisTwo stage analytical process
1. Harmonic Analysis of each year in the series to determine
the best fit mean value (Amplitude 0), annual cycle
(Amplitude 1 and Phase 1) and semi-annual cycle
(Amplitude 2 and Phase 2)
2. Theil-Sen Median Slope operator to determine trends in
these five parameters
Advantages
1. No need to identify seasonal/phenological events – models
each year as a totality
2. Removes short-term variability with less than a 6-month
frequency
3. Removes interannual up to 30% of the length of the series.
2/
1
0 )2
sin()(Tn
n
nnT
nxaaxf

DeseasonRemoval of seasonality in a time series :calculate the deviation from the mean;standardized anomalies includes the divisionby the standard deviation.
23.78
53.78
83.78
113.78
143.78
173.78
203.78
233.78
263.78
10 A J O 11 A J O 12 A J O 13 A J O 14 A J O 15 A J O
Profile of prcProfile of prc
0.00
20.00
40.00
60.00
80.00
100.00
-20.00
-40.00
-60.00
-80.00
10 A J O 11 A J O 12 A J O 13 A J O 14 A J O 15 A J O
Profile of prc_anomProfile of prc_anom
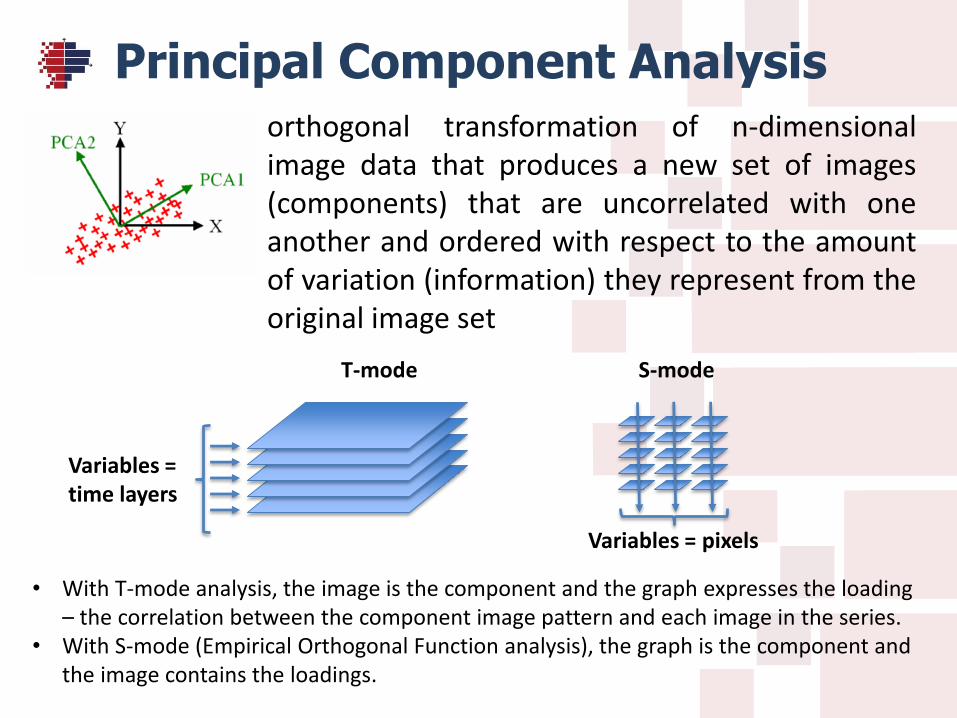
Principal Component Analysisorthogonal transformation of n-dimensionalimage data that produces a new set of images(components) that are uncorrelated with oneanother and ordered with respect to the amountof variation (information) they represent from theoriginal image set
• With T-mode analysis, the image is the component and the graph expresses the loading– the correlation between the component image pattern and each image in the series.
• With S-mode (Empirical Orthogonal Function analysis), the graph is the component and the image contains the loadings.
T-mode S-mode
Variables = time layers
Variables = pixels
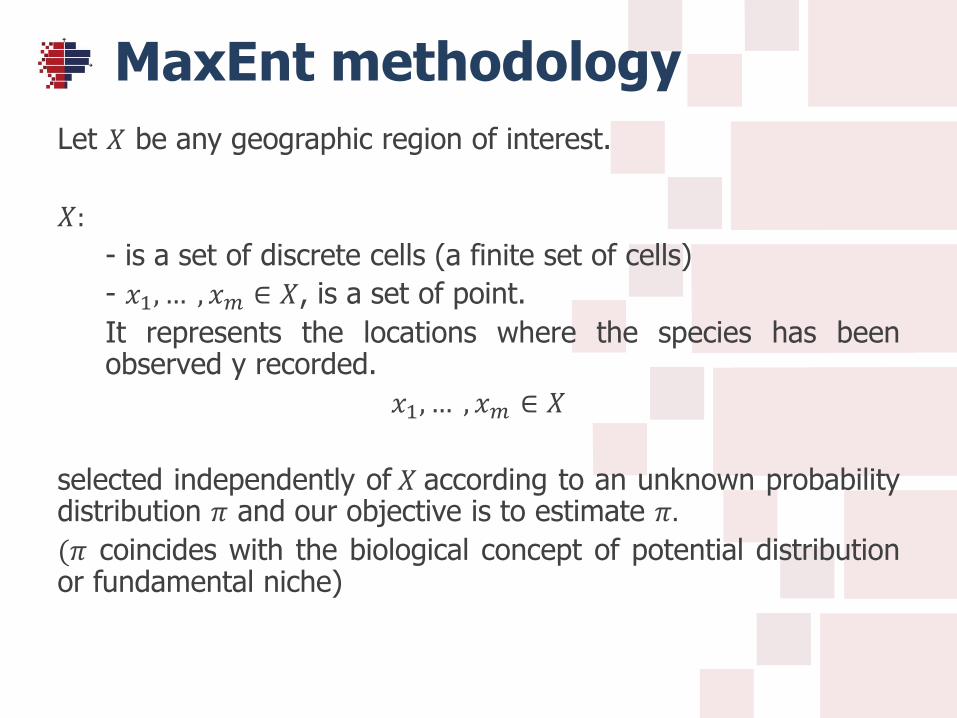
MaxEnt methodology
Let 𝑋 be any geographic region of interest.
𝑋:
- is a set of discrete cells (a finite set of cells)
- 𝑥1, … , 𝑥𝑚 ∈ 𝑋, is a set of point.
It represents the locations where the species has beenobserved y recorded.
𝑥1, … , 𝑥𝑚 ∈ 𝑋
selected independently of 𝑋 according to an unknown probabilitydistribution 𝜋 and our objective is to estimate 𝜋.
(𝜋 coincides with the biological concept of potential distributionor fundamental niche)
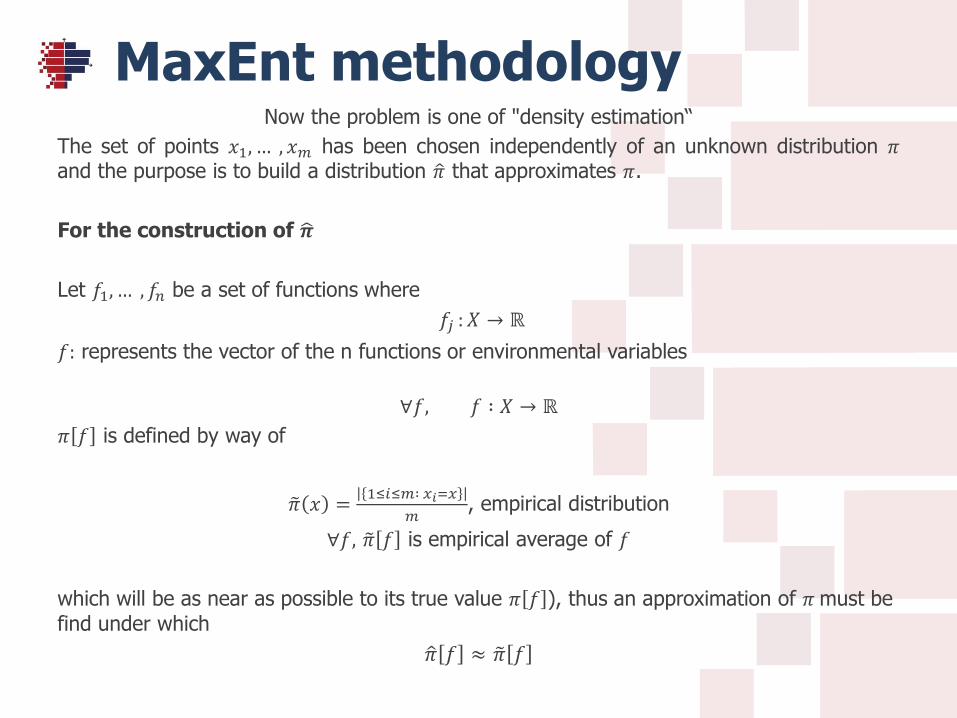
MaxEnt methodologyNow the problem is one of "density estimation“
The set of points 𝑥1, … , 𝑥𝑚 has been chosen independently of an unknown distribution 𝜋and the purpose is to build a distribution 𝜋 that approximates 𝜋.
For the construction of 𝝅
Let 𝑓1, … , 𝑓𝑛 be a set of functions where
𝑓𝑗 : 𝑋 → ℝ
𝑓: represents the vector of the n functions or environmental variables
∀𝑓, 𝑓 ∶ 𝑋 → ℝ
𝜋 𝑓 is defined by way of
𝜋 𝑥 =1≤𝑖≤𝑚∶ 𝑥𝑖=𝑥
𝑚, empirical distribution
∀𝑓, 𝜋 𝑓 is empirical average of 𝑓
which will be as near as possible to its true value 𝜋 𝑓 ), thus an approximation of 𝜋 must be
find under which
𝜋 𝑓 ≈ 𝜋 𝑓

MaxEnt methodologyThere are several distributions which satisfy these constraints.
The one with maximum entropy is chosen, it is the function which is closest to the uniform distribution.
Observe that the entropy of any distribution 𝑝 in 𝑋 is defined by:
𝐻 𝑝 = −
𝑥∈𝑋
𝑝 𝑥 ln(𝑝 𝑥 )
So the problem is:
Estimate 𝜋 by 𝜋 distribution of maximum entropy subject to the condition that
∀𝑓𝑗 , 𝜋 𝑓𝑗 ≈ 𝜋 𝑓𝑗
To solve this problem, a family of distributions functions named “Distributions Gibbs” and defined as follows is used:
𝑞𝜆 𝑥 =𝑒𝜆.𝑓(𝑥)
𝑍𝜆
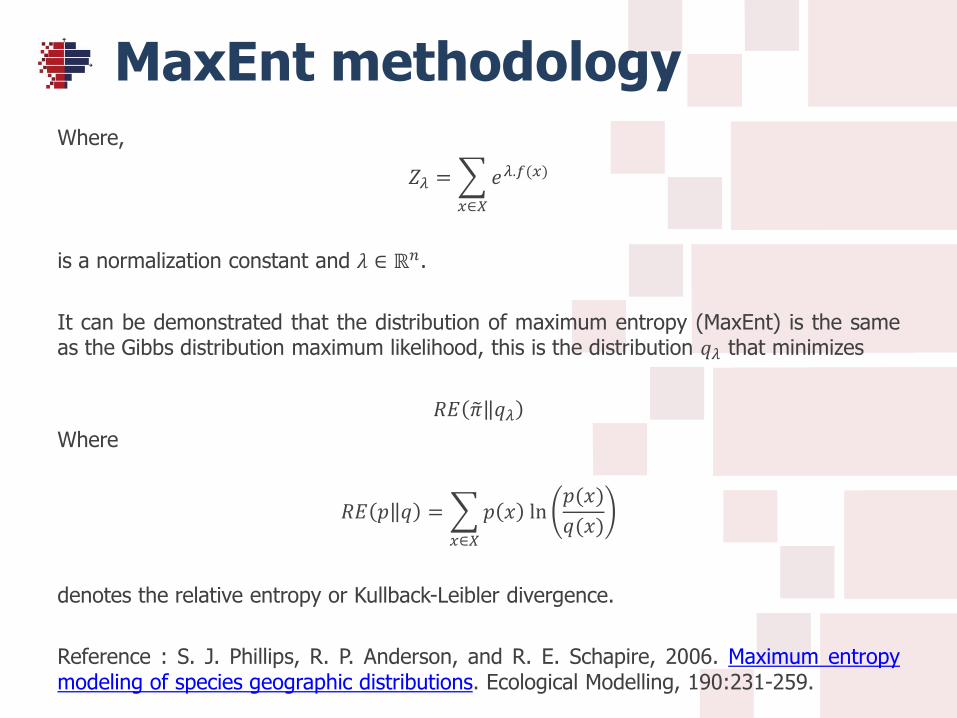
MaxEnt methodologyWhere,
𝑍𝜆 =
𝑥∈𝑋
𝑒𝜆.𝑓(𝑥)
is a normalization constant and 𝜆 ∈ ℝ𝑛.
It can be demonstrated that the distribution of maximum entropy (MaxEnt) is the sameas the Gibbs distribution maximum likelihood, this is the distribution 𝑞𝜆 that minimizes
𝑅𝐸 𝜋 𝑞𝜆
Where
𝑅𝐸 𝑝 𝑞 =
𝑥∈𝑋
𝑝 𝑥 ln𝑝(𝑥)
𝑞(𝑥)
denotes the relative entropy or Kullback-Leibler divergence.
Reference : S. J. Phillips, R. P. Anderson, and R. E. Schapire, 2006. Maximum entropymodeling of species geographic distributions. Ecological Modelling, 190:231-259.

Parameters settings
• 75% of the presence points for training, 25% forvalidation
• 10 replicates (Bootstrapping, for sensibilityanalysis)
• To improve the AUC, it was observed that it isnecessary to have a number of background pointstwice more than presence points
Notes :• explicative rasters must have Flag value (indicate -9999 if none) and Flag
description (Background);• it is highly suggested to copy all the ecplicative rasters in the same folder
and create a raster group;• MaxEnt requires Java program installed.
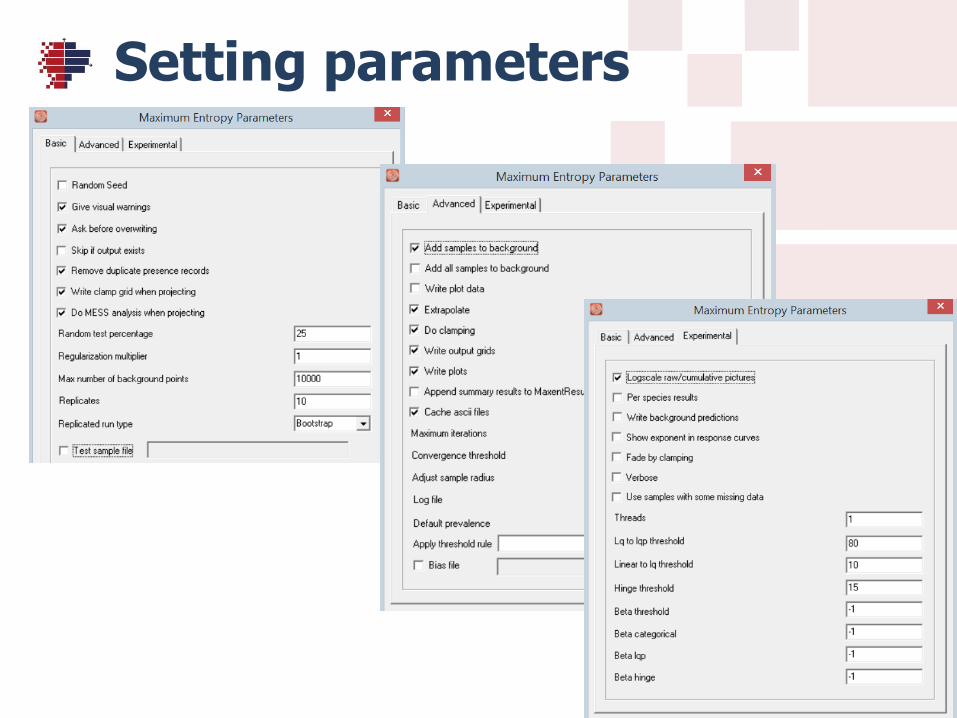
Setting parameters

Maxent settingsBasicGive visual warnings NoRandom test percentage 25Replicates 10Replicated run type Bootstrap
AdvancedWrite output grids NoApply threshold rule Equal training sensitivity and specificity
Maxent memory usage1024mb (2048mb can give error)
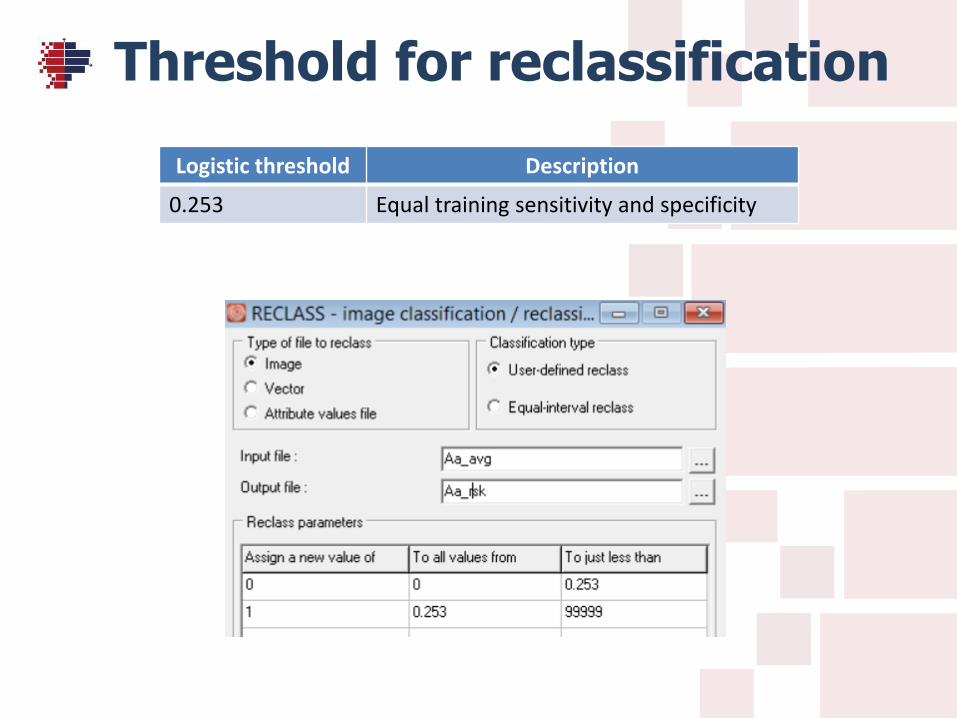
Threshold for reclassification
Logistic threshold Description
0.253 Equal training sensitivity and specificity
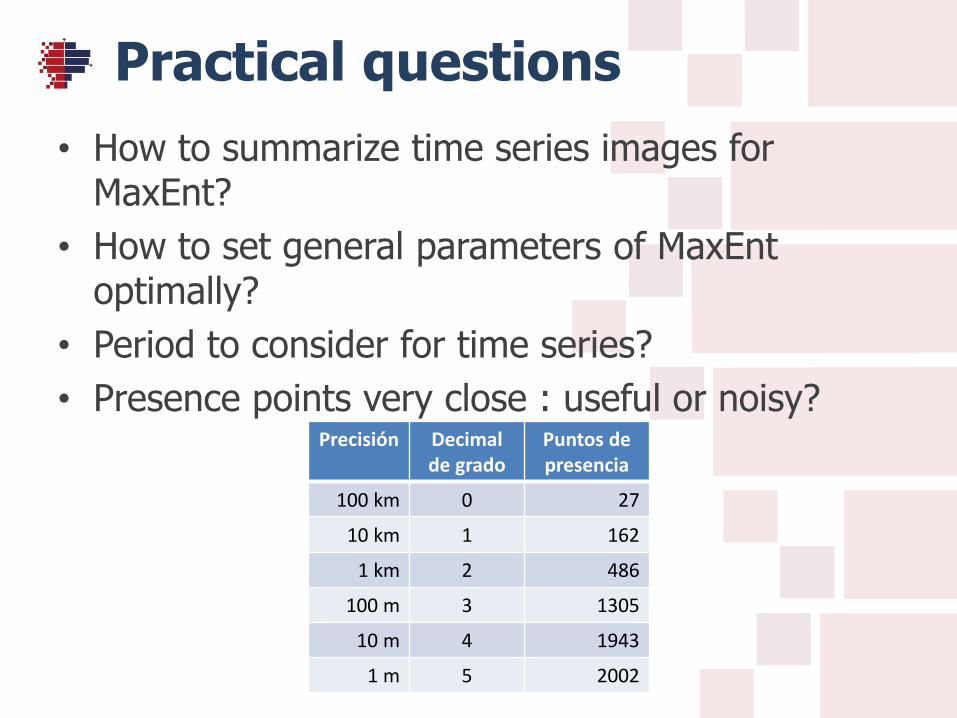
Practical questions
• How to summarize time series images forMaxEnt?
• How to set general parameters of MaxEntoptimally?
• Period to consider for time series?
• Presence points very close : useful or noisy?Precisión Decimal
de gradoPuntos de presencia
100 km 0 27
10 km 1 162
1 km 2 486
100 m 3 1305
10 m 4 1943
1 m 5 2002

For more information
• E-mails
[email protected], [email protected]
• Web site of EpiSIG
http://www.investigacionsalud.gob.ec/webs/episig/
– Request form online

http://www.investigacionsalud.gob.ec/webs/episig/taller/#taller3