Preqin Compensation and Employment Outlook Private Equity December 2011
Upload
httpbesthedgefundblogspotcomCategory
view
218download
0
8/8/2019 Preqin Private Equity Real Estate November 2010
http://slidepdf.com/reader/full/preqin-private-equity-real-estate-november-2010 1/8
What Now for Private Equity Real Estate?
November 2010
A Preqin Special Report
November 2010
A Preqin Special Report

8/8/2019 Preqin Private Equity Real Estate November 2010
http://slidepdf.com/reader/full/preqin-private-equity-real-estate-november-2010 2/8
2 Preqin Research Report © 2010 Preqin Ltd. www.preqin.com
The private equity real estate market has seen a dramatic change
in its fortunes over the past two years. Prior to 2008, fundraising
was increasing year-on-year, investors were rushing to commit to
new funds and returns were strong. The past two years, however,
have been characterized by poor performance, investor inactivity
and slow fundraising. There are some signs the market may be
improving, but in turbulent conditions, predicting when this will
happen is a difficult proposition.
Investor Attitudes
Fundraising has been slow throughout 2009 and 2010 to date,with quarterly totals ranging from $7.6 billion to $15.4 billion. In
comparison, quarterly totals ranged between $24.2 billion and
$43.8 billion during the period 2007 to Q3 2008. The primary
driver behind the slow fundraising has been investor inactivity and
caution. Preqin’s recent real estate investor survey found that just
24% of investors made a real estate fund commitment in H1 2010.
During the boom years, investors were continually receiving
returns from their existing private equity real estate investments,
which they were then re-investing in new funds. As a result of the
economic downturn, investors are receiving far fewer distributions
from their existing funds and therefore are not investing newcapital at the same rate. In many cases, investors have large
amounts of capital committed to funds that remains uncalled. For
other investors there is no urgency to commit. With uncertainty
surrounding future real estate valuations, institutions do not feel
they are missing opportunities by staying on the sidelines.
The same survey does, however, give indications of a possible
improvement in fundraising in the future. 42% of investors
surveyed are planning to make new commitments in the next 12
months, while another 19% indicated they would consider doing
so. This does not suggest that a dramatic upturn in fundraising is
imminent, but does suggest that quarterly fundraising totals will
begin to increase over the coming year.
Performance
The performance of private equity real estate funds has been
severely impacted by the economic downturn, with funds of
2006 and 2007 vintages most adversely affected. Two-thirds of
2006 vintage funds and 79% of 2007 vintage funds are currently
producing negative IRRs. Recent performance is not showingany signs of a quick reversal of fortunes, and real estate has
lagged behind other asset classes which have seen a rebound in
performance.
As Fig. 2 illustrates, recent performance for private equity real
estate funds has been mixed. 2007 vintage funds, although deep
in the red, have seen performance improve over recent quarters.
2005 vintage funds, in contrast, have seen declines in the median
IRR in recent quarters. Clearly with many funds still suffering,
fund managers will be concentrating on asset management and
restructuring debt, with the aim of turning the fortunes of their
funds around.
A Crowded Market
The aggregate target of funds in market has fallen steadily
since Q1 2009, but there are still 400 funds in market, targeting
aggregate commitments of $129 billion. Between January and
September 2010, 47 funds were abandoned or placed on hold,
highlighting that fundraising remains an extremely challenging
prospect. While for some firms fundraising has proven to be
What Now for Private Equity Real Estate?
Preqin Special Report: Private Equity Real Estate
54
73
6661
3431
27
37
20 22 21
33.9
43.842.1
20.415.214.0
8.5 10.215.4
7.6 9.0
0
10
20
30
40
50
60
70
80
Q
1 2 0 0 8
Q
2 2 0 0 8
Q
3 2 0 0 8
Q
4 2 0 0 8
Q
1 2 0 0 9
Q
2 2 0 0 9
Q
3 2 0 0 9
Q
4 2 0 0 9
Q
1 2 0 1 0
Q
2 2 0 1 0
Q
3 2 0 1 0
No. of Funds
Aggregate Capital
Raised ($bn)
Source: Preqin
Fig. 1: Quarterly Private Equity Fundraising, Q1 2008 - Q3 2010
-0.5
-0.4
-0.3
-0.2
-0.1
0
0.1
0.2
0.3
0.4
0.5
0.6
1 2 3 4 5 6 7 8 9 10
Vintage 2000
Vintage 2001
Vintage 2002
Vintage 2003
Vintage 2004
Vintage 2005
Vintage 2006
Vintage 2007
Vintage 2008
Source: Preqin
Fig. 2: J-Curves - Annual Median Net IRRs by Vintage Year
M e d i a n N e t I R R ( % )
Investment Year

8/8/2019 Preqin Private Equity Real Estate November 2010
http://slidepdf.com/reader/full/preqin-private-equity-real-estate-november-2010 3/8
3 Preqin Research Report © 2010 Preqin Ltd. www.preqin.com
impossible, there are signs for others of an improvement in
fortunes. In 2009, just 15% of funds met or exceeded their
fundraising targets, with 85% falling short. Between January and
September 2010, however, 19% of funds to close have done so
on target, while 24% have exceeded their targets.
Although it is clear that not every fund in market will be raised
successfully – the aggregate target of all funds in market is more
than two and a half times the amount of capital raised in 2009 –
the paralysis in the fundraising market that was evident a year
ago appears to be easing. Firms raising funds that fit with the
revised aims of the institutional investor community have been
successful in raising capital.
A Changing Approach
The changing nature of the real estate market has led to dramatic
shifts in the strategy preferences of institutional investors and
the strategies of funds which are being launched. The rise in theappeal of core funds has been marked, with 86% of investors
now having a preference for this type of vehicle. Fundraising for
value added vehicles has declined significantly. Value added
funds were responsible for 32% of capital raised in 2007, but
only accounted for 17% of capital raised in January to September
2010. Opportunistic strategies have seen a smaller proportional
decline. Many investors have also seen the appeal of distressed
opportunities and real estate debt. Debt funds accounted for 24%
of capital raised in January to September 2010, with distressed
funds accounting for 25%.
Dry Powder
While fundraising may be slow, this has not had a significant
impact on the amount of capital that private equity real estate
fund managers have at their disposal to make new investments.
As of September 2010, these firms had $174 billion in uncalled
capital. If real estate fund managers feel there are excellent
opportunities available (and that remains a big if), they are in a
good position to take advantage. North America-focused funds
have $98 billion of capital to call up, Asia and Rest of World-
focused funds have $39 billion and Europe-focused vehicles have
$37 billion.
It is obvious to all within the private equity real estate industry
that a return to the fundraising levels of 2006 and 2007 will not
happen quickly, if ever, but there are some encouraging signs for
fund managers. Many investors that spent much of the past two
years on the sidelines are showing signs of returning and do plan
to make new commitments in the next 12 months.
Fund managers still have $174 billion of uncalled capital available
to invest and, despite fundraising remaining slow, some strategies
are appealing to investors and capital is being raised for these
funds. While most institutions do not feel they will be adversely
affected by delaying new commitments at present, if the number
of transactions taking place picks up, fund managers call up
capital and investors receive distributions from their existing
investments, then institutions are likely to return to the market
in greater numbers. Fund managers that have adapted to thechanging attitudes of the institutional investor community and
successfully conveyed how they intend to overcome market
conditions have shown that it is possible to raise capital for new
funds.
Preqin Special Report: Private Equity Real Estate
8%4% 3% 5%
32%
26% 27%17%
49%
50%41%
29%
3%
4%
5%
25%
8%16%
24% 24%
0%
10%
20%
30%
40%
50%
60%
70%
80%
90%
100%
2007 2008 2009 Jan - Sep 2010
Debt
Distressed
Opportunistic
Value Added
Core-Plus
Source: Preqin
Fig. 3: Breakdown of Annual Capital Raised by Strategy,
2007 - September 2010
P r o p o r t i o n o f C a p i t a l R a i s e d
Data Source:
2010 Preqin Real Estate Review
The information in this research reporrt is based on datafrom The 2010 Preqin Private Equity Real Estate Review.Now in its fifth year, the Review is the most trusted guideto the PERE industry available today. This publication
includes 280 profiles of the most active investors inprivate real estate funds, profiles of more than 360profiles of the leading private equity real estate firms anddetailed analysis including examinations of investors,fundraising, performance, dry powder, placement agentsand fund terms and conditions.
For more information, including sample pages anddetails on how to order your copy, please visit:
www.preqin.com/rer

8/8/2019 Preqin Private Equity Real Estate November 2010
http://slidepdf.com/reader/full/preqin-private-equity-real-estate-november-2010 4/8
4 Preqin Research Report © 2010 Preqin Ltd. www.preqin.com
Investor Location
• Institutional investors from around the globe make private
equity real estate investments. North American institutional
investors constitute over half (55%) of all investors in the
private equity real estate asset class.
• The proportion of investors from Europe is 31%, with Asia
and Rest of World comprising 11% of investors in private
equity real estate funds.
• The percentage of investors from North America has slightlydipped from a year ago, from 58% to 55%, while the share
of European investors has increased from 31% to 34%. The
proportion of Asia and Rest of World investors in the asset
class has remained constant at 11%.
Investor Type
• The private equity real estate industry attracts commitments
from a wide range of institutional investors.
• The most numerous type of investor in the private equity real
estate asset class is public pension funds, with this group
representing 29% of investors interested in this investment
category. Some of the most prominent and established
private equity real estate investors are public pension funds.
• Private sector pension funds represent the second-largest
investor category in private equity real estate, accountingfor 14% of investors. As such, pension funds in general
dominate the make-up of private equity real estate investing,
highlighting the ability and preference of these types of
investors to engage in illiquid, long-term investments.
Institutional Investors
Preqin Special Report: Private Equity Real Estate
Source: Preqin
Fig. 4: Breakdown of Private Equity Real Estate Fund Investor
Universe by Region
Source: Preqin
Fig. 5: Breakdown of Private Equity Real Estate Fund Investor
Universe by Type

8/8/2019 Preqin Private Equity Real Estate November 2010
http://slidepdf.com/reader/full/preqin-private-equity-real-estate-november-2010 5/8
5 Preqin Research Report © 2010 Preqin Ltd. www.preqin.com
Preqin Special Report: Private Equity Real Estate
Success in Achieving Fundraising Target
• In 2007 fund managers had a high level of success in
gathering commitments from investors, with 79% of funds
meeting or exceeding their original target and 25% of funds
closing with more than 120% of their fundraising target.
• In 2008, fewer funds achieved their fundraising goals. This
trend continued in 2009, when increased investor caution
resulted in just 15% of funds meeting or exceeding their
original targets.
• 43% of funds to close between January and September 2010
met or exceeded their fundraising targets. This suggests that
the fundraising environment is showing signs of improvement
and that fund managers are now setting lower, more realistic
fundraising targets.
Current Fundraising
• A significant 60% ($47.0 billion) of the capital raised between
2009 and September 2010 was collected by 101 funds with
a primary focus on investments in North America. It is worth
noting that many of the largest funds with a primary focus on
North America will also make investments on a global basis.
• 43 funds with a primary focus on Europe closed, raising a
total of $15.8 billion, and 40 Asia and Rest of World-focused
vehicles closed on aggregate commitments of $15.0 billion.
• While fundraising has been poor throughout the market in
2010, fundraising for European funds has been particularly
challenging. Primarily Europe-focused funds raised just $1.7
billion between January and September 2010, accounting for
6% of the total capital raised. This is compared to 2009, when
European funds made up 29% of the total market.
Funds
3%5%
13%
34%
20%
15%
10%
17%
20%19%
22%
13%
6%
3%
28%
36%
21%
8%
4%3%
0%
22%
27%
8%
19%
11%
8%
5%
0%
5%
10%
15%
20%
25%
30%
35%
40%
Below
50%
50% -
79%
80% -
99%
100% 101% -
120%
121% -
150%
Above
150%
2007
2008
2009
Jan - Sep 2010
Source: Preqin
Fig. 6: Annual Breakdown of Final Close Amounts by Proportion
of Target Capital Raised, 2007 - September 2010
P r o p o r t i o n o f F u n d s
Capital Raised (% of Initial Target)
101
43 4047
15.8 15
0
20
40
60
80
100
120
North America Europe Asia and Rest
of World
No. of Funds
Aggregate CapitalRaised ($bn)
Source: Preqin
Fig. 7: Breakdown of Fundraising by Primary Regional Focus,
2009 - September 2010
8/8/2019 Preqin Private Equity Real Estate November 2010
http://slidepdf.com/reader/full/preqin-private-equity-real-estate-november-2010 6/8
6 Preqin Research Report © 2010 Preqin Ltd. www.preqin.com
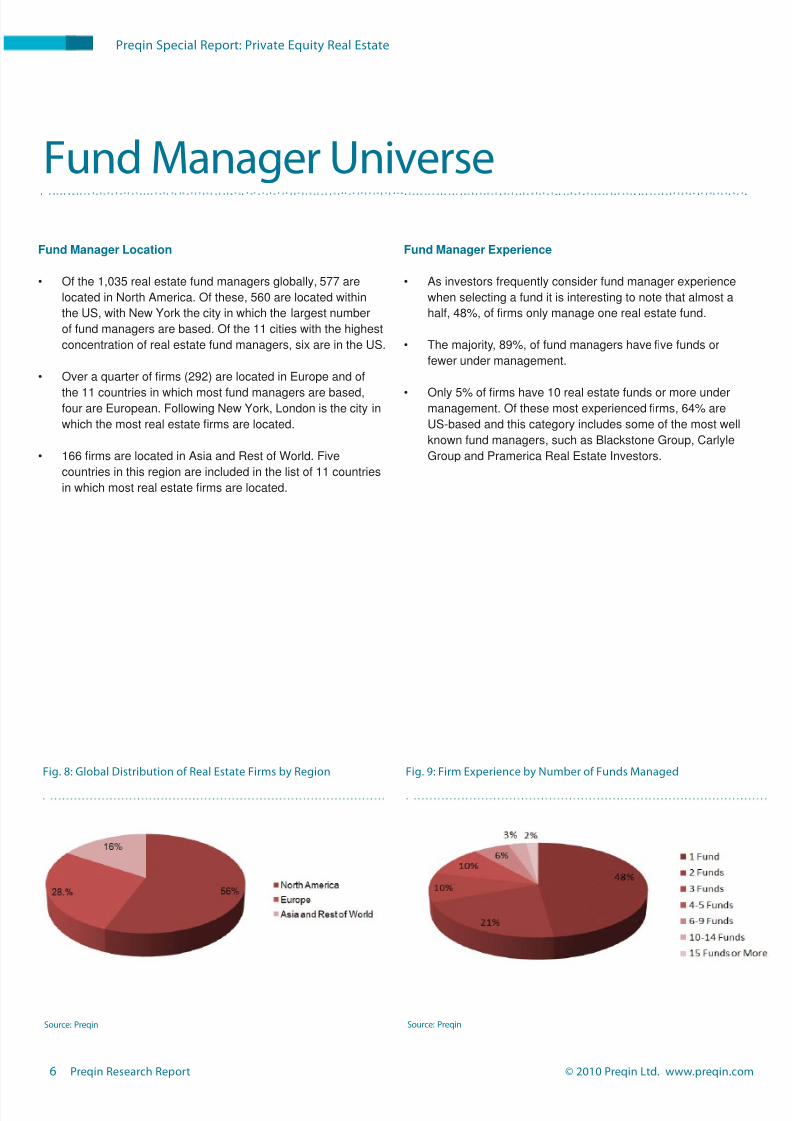
Fund Manager Location
• Of the 1,035 real estate fund managers globally, 577 are
located in North America. Of these, 560 are located within
the US, with New York the city in which the largest number
of fund managers are based. Of the 11 cities with the highest
concentration of real estate fund managers, six are in the US.
• Over a quarter of firms (292) are located in Europe and of
the 11 countries in which most fund managers are based,four are European. Following New York, London is the city in
which the most real estate firms are located.
• 166 firms are located in Asia and Rest of World. Five
countries in this region are included in the list of 11 countries
in which most real estate firms are located.
Fund Manager Experience
• As investors frequently consider fund manager experience
when selecting a fund it is interesting to note that almost a
half, 48%, of firms only manage one real estate fund.
• The majority, 89%, of fund managers have five funds or
fewer under management.
• Only 5% of firms have 10 real estate funds or more undermanagement. Of these most experienced firms, 64% are
US-based and this category includes some of the most well
known fund managers, such as Blackstone Group, Carlyle
Group and Pramerica Real Estate Investors.
Fund Manager Universe
Source: Preqin
Fig. 9: Firm Experience by Number of Funds Managed
Source: Preqin
Fig. 8: Global Distribution of Real Estate Firms by Region
Preqin Special Report: Private Equity Real Estate

8/8/2019 Preqin Private Equity Real Estate November 2010
http://slidepdf.com/reader/full/preqin-private-equity-real-estate-november-2010 7/8
7 Preqin Research Report © 2010 Preqin Ltd. www.preqin.com
The Preqin Private Equity Real Estate Review is the most widely trusted and utilized guide to the industry, with thousands of profes-sionals having benefitted from its exclusive intelligence and detailed analysis over the past five years. The Review is compiled byour dedicated Real Estate team, constantly gathering accurate and detailed profile information via direct contact with institutionsfrom around the world.
The PERE Review helps PERE professionals to leverage and add value to research resources, produce objective marketingmaterials and reports, identify relevant firms and investors, plan fundraising efforts, benchmark firms against competitors and muchmore. It is also used by property management companies, investors, advisors and consultants to further their understanding of theindustry and identify potential partnership or investment opportunities.
Key content includes:
• Detailed analysis examining the history and development of the industry, fundraising trends, performance analysis, fundmanager universe, institutional investors, service providers, fund terms and conditions and much more…
• All areas of the market covered, from small regional funds to global mega funds; separate analyses conducted for core-plus,value added, opportunistic, debt and distressed funds throughout Review…
• Profiles for 360 firms, including direct contact details, firm investment strategies, fund details and more.
• Listings for 280 investors in PERE funds, including sample investments, fund preferences and direct contact details.
• Listings for funds raised historically, funds currently raising, performance metrics for 800 funds, league tables for biggest firms…
• Plus much more…
To find out more, or to order your copy, please visit:www.preqin.com/rer
2010 Preqin Private Equity
Real Estate Review
alternative assets. intelligent data.
The 2010 PreqinPrivate Equity Real Estate Review
2010 Preqin Private Equity Real Estate Review - Chapters
1.................................................................................................. EXECUTIVE SUMMARY
2.............................................................................................................. DATA SOURCES
3........................................................HISTORY AND DEVELOPMENT OF THE MARKET
4........................................................................FUNDS CLOSED: 2009 - 2010 LISTINGS
5...............................................................................CURRENT FUNDRAISING MARKET
6........................................................................................FUNDRAISING BY STRATEGY
7..................................................................................FUNDS ON THE ROAD LISTINGS
8........................................................................................PLACEMENT AGENT REVIEW
9..............................................................FUND TERMS AND CONDITIONS OVERVIEW
10................................................................FUND TERMS AND CONDITIONS LISTINGS
11......................................................................................... FUND MANAGER OVERVIEW
12..................................................................................FUND PERFORMANCE ANALYSIS
13..................................................................................................................DRY POWDER
14..................................REGIONAL FOCUS: KEY FUNDRAISING FACTS AND FIGURES
15...............................................................................................TOP 50FUND MANAGERS
16..........................................................FUND MANAGER INVESTMENT PREFERENCES
17...........................................................................................FUND MANAGER PROFILES
18.............................................INVESTORS IN PRIVATE EQUITY REAL ESTATE FUNDS
19.................................................KEY INVESTORS IN REAL ESTATE FUNDS PROFILES
20................................................................................................................................INDEX

8/8/2019 Preqin Private Equity Real Estate November 2010
http://slidepdf.com/reader/full/preqin-private-equity-real-estate-november-2010 8/8
8 Preqin Research Report © 2010 Preqin Ltd. www.preqin.com
2010 Preqin Private Equity
Real Estate Review
Payment Details:
Credit Card
Visa
Amex Mastercard
Cheque enclosed (please make cheque payable to ‘Preqin’)
Please invoice me
Card Number:
Security Code:
Name on Card:
Expiration Date:
American Express, four digitcode printed on the front ofthe card.
Visa and Mastercard, lastthree digits printed on thesignature strip.
Shipping Details:
Name:
Address:
Firm:
Job Title:
City:
Telephone:
Post/Zip:
Country:
Email:
I would like to purchase the Preqin Private Equity Real Estate Review:
£795 + £10 Shipping
$1,345 + $40 Shipping
€955 + €25 Shipping
Single Copy:
£110 + £5 Shipping
$180 + $20 Shipping
€115 + €12 Shipping
Shipping costs will not exceed a maximum of £15 / $60 / €37 per order when all shipped to same address.If shipped to multiple addresses then full postage ratesapply for additional copies.
Additional Copies:
$300 / £175 / €185
Data Pack:
Data Pack contains all underlying data
for charts and graphs contained in thepublication. Only available alongsidepurchase of the publication.
The 2010 Preqin Private Equity Real Estate Review is the most widely trusted and utilized guide to the industry, with thousands of
professionals having benefitted from its exclusive intelligence and detailed analysis over the past five years.
Key content includes:
• Detailed analysis examining the history and development of the industry,fundraising trends, performance analysis, fund manager universe, institutionalinvestors, service providers, fund terms and conditions and much more…
• All areas of the market covered, from small regional funds to globalmega funds; separate analyses conducted for core-plus, value added,opportunistic, debt and distressed funds throughout Review…
• Profiles for 360 firms, including direct contact details, firm investmentstrategies, fund details and more.
• Listings for 280 investors in PERE funds, including sample investments, fundpreferences and direct contact details.
• Listings for funds raised historically, funds currently raising, performance
metrics for 800 funds, league tables for biggest firms…
The 2010 PreqinPrivate Equity Real Estate Review
www.preqin.com/rer
alternative assets. intelligent data.
Completed OrderForms:
Post (to Preqin):
Equitable House,47 King William Street,London, EC4R 9AF
230 Park Avenue10th Floor,New York, NY 10169
Samsung Hub3 Church StreetLevel 8Singapore 049483
Fax:
+44 (0)87 0330 5892+1 440 445 9595+65 6408 0101
Email:
Telephone:
+44 (0)20 7065 5100+1 212 808 3008+65 6408 0122