DTH Hammers & Mining Accessories by Bull Rock Drills Private Limited, Hyderabad

Mines and Money Nov. 2016
Preparing for the next mining bull market…but have we learnt the lessons of the last one?
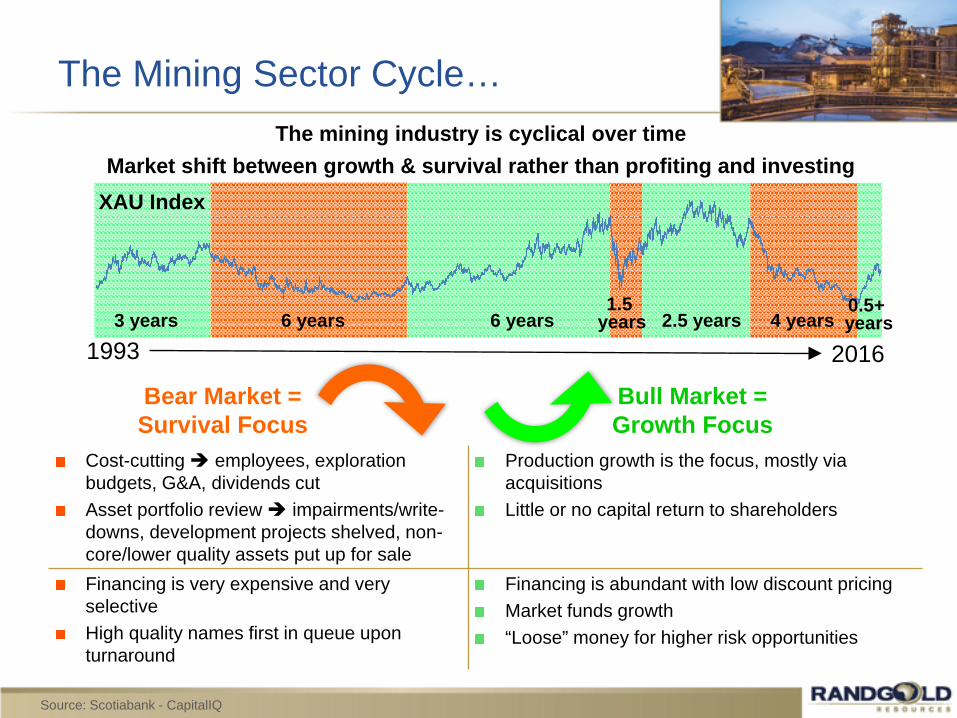
The Mining Sector Cycle…The mining industry is cyclical over time
Market shift between growth & survival rather than profiting and investing
Bull Market = Growth Focus
Bear Market = Survival Focus
Cost-cutting employees, exploration budgets, G&A, dividends cut Asset portfolio review impairments/write-downs, development projects shelved, non-core/lower quality assets put up for sale
Production growth is the focus, mostly via acquisitions Little or no capital return to shareholders
Financing is very expensive and very selective High quality names first in queue upon turnaround
Financing is abundant with low discount pricing Market funds growth“Loose” money for higher risk opportunities
3 years 6 years 6 years1.5
years 2.5 years 4 years0.5+ years
XAU Index
1993 2016
Source: Scotiabank - CapitalIQ
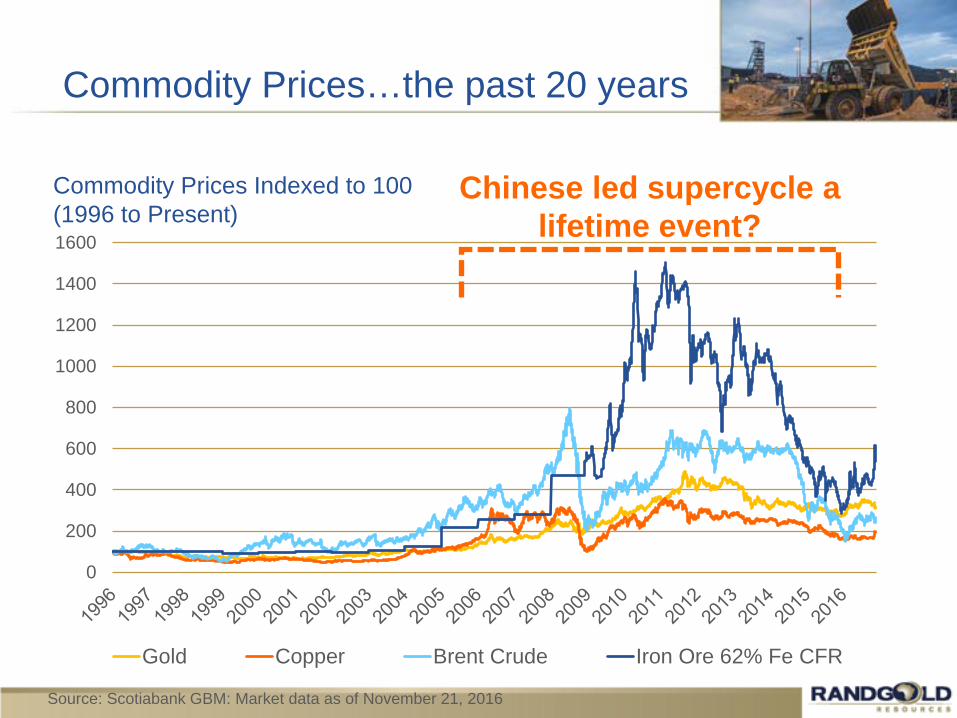
Commodity Prices…the past 20 years
0
200
400
600
800
1000
1200
1400
1600
Gold Copper Brent Crude Iron Ore 62% Fe CFR
Commodity Prices Indexed to 100 (1996 to Present)
Source: Scotiabank GBM: Market data as of November 21, 2016
Chinese led supercycle a lifetime event?

Sector Value…reckless allocation of capital results in a toxic debt pile
Source: Scotiabank - CapitalIQNote: Excludes steel producers (e.g. Nippon, POSCO, ArcelorMittal, etc.)(1) “Other” includes PGMs, uranium, lithium, coal, iron ore, diamonds and royalty companiesC
0
500
1000
1500
2000
2500
2000 2001 2002 2003 2004 2005 2006 2007 2008 2009 2010 2011 2012 2013 2014 2015 2016
Gold / Silver Diversifieds / Base Metals Other
--$100$200$300$400
2000 2002 2004 2006 2008 2010 2012 2014 Current
Market Capitalisation of mining sector
Net Debt of mining sector
$2.1T
$235B$815B
$2.4T
$690B
$935B
US$B
US$B

Financial Health…gold producers debt still high with poor debt to EBITDA ratios
Source: Scotiabank - CapIQ and company filings
US$m
0
1000
2000
3000
Barri
ckZi
jinG
oldc
orp
New
mon
tN
ewcr
est
Angl
oGol
dYa
man
aG
old
Fiel
dsKi
nros
sSi
lver
…N
ew G
old
Roy
al G
old
Agni
co…
Buen
ave…
Hec
laC
ente
rraB2
Gol
dD
etou
rH
ochs
child
Oce
anaG
…C
oeur
Prim
ero
Fres
nillo
Alam
osSi
lver
…Ta
hoe
Firs
t…Ki
rkla
nd…
Klon
dex
Pan…
Fran
co-…
SEM
AFO
Alac
erO
sisk
oIA
MG
OLD
Ran
dgol
dC
enta
min
Eldo
rado
net debt net cash~$2.9B total ~$30B total
~$18B held by top 5
0,00x1,00x2,00x3,00x
Zijin
Prim
ero
Yam
ana
New
Gol
dSi
lver
…G
oldc
orp
Roy
al G
old
Buen
ave…
Gol
d…Ba
rrick
Hec
laN
ewcr
est
Angl
oGol
dKi
nros
sD
etou
rB2
Gol
dC
ente
rraC
oeur
Hoc
hsch
ildO
cean
a…N
ewm
ont
Agni
co…
Alam
osFr
esni
lloTa
hoe
Klon
dex
Firs
t…Fr
anco
-…C
enta
min
Pan…
Ran
dgol
dIA
MG
OLD
Eldo
rado
SEM
AFO
Alac
erO
sisk
oSi
lver
…Ki
rkla
nd…
Net Debt & Net Cash Positions US$M
Net Debt to 2016E EBITDA Ratio
net cash
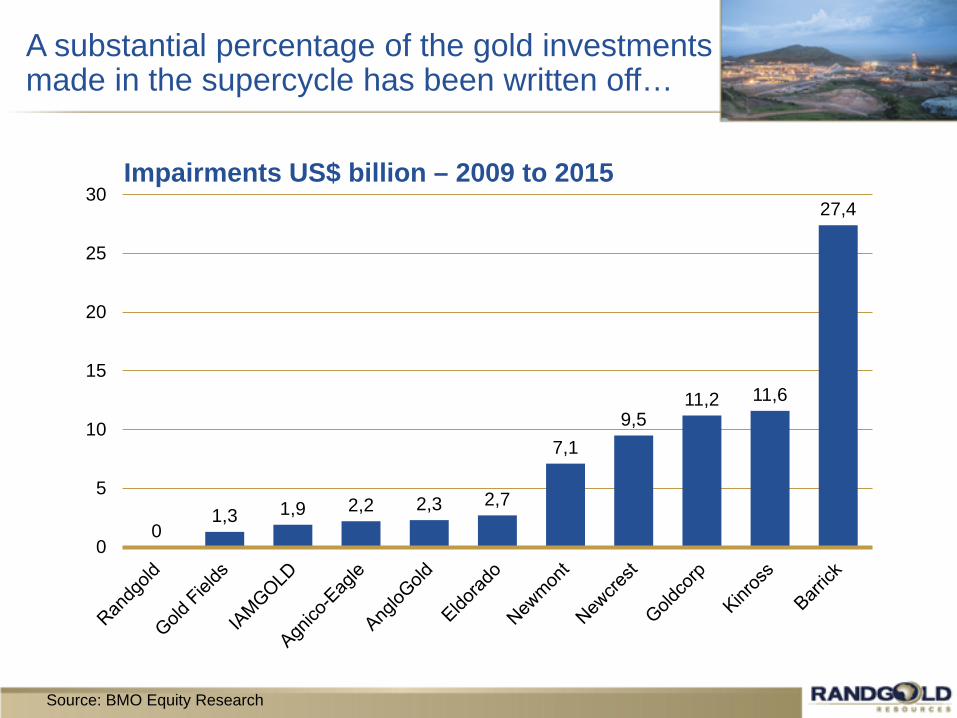
A substantial percentage of the gold investments made in the supercycle has been written off…
Source: BMO Equity Research
01,3 1,9 2,2 2,3 2,7
7,19,5
11,2 11,6
27,4
0
5
10
15
20
25
30Impairments US$ billion – 2009 to 2015

Base Metal Producers…debt and debt to EBITDA ratios higher than gold miners
Net Debt & Net Cash Positions US$M
Source: Scotiabank - CapIQ and company filings
$15,1$12,9 $12,5
$9,7 $9,4 $8,2$6,0 $5,3 $4,2 $2,7 $1,7 $1,1 $1,0 $0,4 $0,4 $0,8
Vale
BHP
Billit
on
Gle
ncor
e
Angl
oAm
eric
an
Free
port
MM
G L
imite
d
Rio
Tin
to
Veda
nta
Teck
Res
ourc
es
Sout
hern
Cop
per
Firs
tQ
uant
um
Turq
uois
e H
ill
KGH
M
Hud
Bay
Min
eral
s
Anto
faga
sta
Sout
h 32
OZ
Min
eral
s
Lund
inM
inin
g
net debt net cash$24.2 $24.2
~$1.6B total ~$138.2B total~$88.9B held by top 5
13,2x
7,9x4,4x 2,9x 2,6x 2,5x 2,5x 2,5x 2,4x 2,4x 1,8x 1,6x 1,6x 0,8x 0,8x 0,0x 0,0x 0,0x
MM
G L
imite
d
Turq
uois
e H
ill
Firs
t Qua
ntum
Veda
nta
Free
port
Hud
Bay
Min
eral
s
Sout
hern
Cop
per
Vale
Teck
Res
ourc
es
Angl
o Am
eric
an
KGH
M
BHP
Billit
on
Gle
ncor
e
Anto
faga
sta
Rio
Tin
to
Sout
h 32
OZ
Min
eral
s
Lund
in M
inin
g
net cashNet Debt to 2016E EBITDA Ratio

Senior Global Diversified and Base Metals impairment charges…
$1,2 $2,9 $3,2 $4,0$6,7
$15,8$18,0 $18,8 $20,3
$39,5
$0
$5
$10
$15
$20
$25
$30
$35
$40
$45Impairments US$ billion – 2009 to 2015
Source: BMO Equity Research

Gold mining industry has delivered no value…gold price vs Au index
0
100
200
300
400
500
600
Gold spot $/oz Phil Au Index
Rebased to 100
Gold Spot Price
Philadelphia Gold Index
Gold Spot vs Philadephia Stock Exchange Au Index
Source: Toqueville

Base Metals and Diversified…no value creation
1647,4
115,4
246,7168,1
240,8
694,3
--
500
1000
1500
2000
2500
3000
23-Nov-96 23-Nov-00 23-Nov-04 23-Nov-08 23-Nov-12 23-Nov-16
Base Metal Producer Index - Total ReturnBase Metal Producer Index - Price ReturnLME AluminiumLME CopperLME NickelLME Zinc
Base metals sector – Relative performance last 20 yearsValues indexed to 100 at 23 Nov 1996
Note: Shown in USD; Total Return Index includes reinvested dividends; LME Lead prices not available throughout entirety of period shown. 1. Base Metal Producer Index includes: Antofagasta, Boliden, First Quantum, Freeport-McMoRan, HudBay, KAZ Minerals, KGHM, Lundin Mining, Norilsk Nickel, Southern Copper. 2. Companies listed after beginning of period shown are included in index calculation following listing date.
Source: BMO Capital Markets

Exploration is not replacing the gold produced…
0
1000
2000
3000
4000
5000
6000
7000
0
20
40
60
80
100
120
140
160
180
1990
1991
1992
1993
1994
1995
1996
1997
1998
1999
2000
2001
2002
2003
2004
2005
2006
2007
2008
2009
2010
2011
2012
2013
2014
2015
Gold discoveries Moz Gold production MozExploration budgets $m Gold price $/oz
Major gold discoveries Moz US$ million US$/oz
Source: SNL Metals & Mining
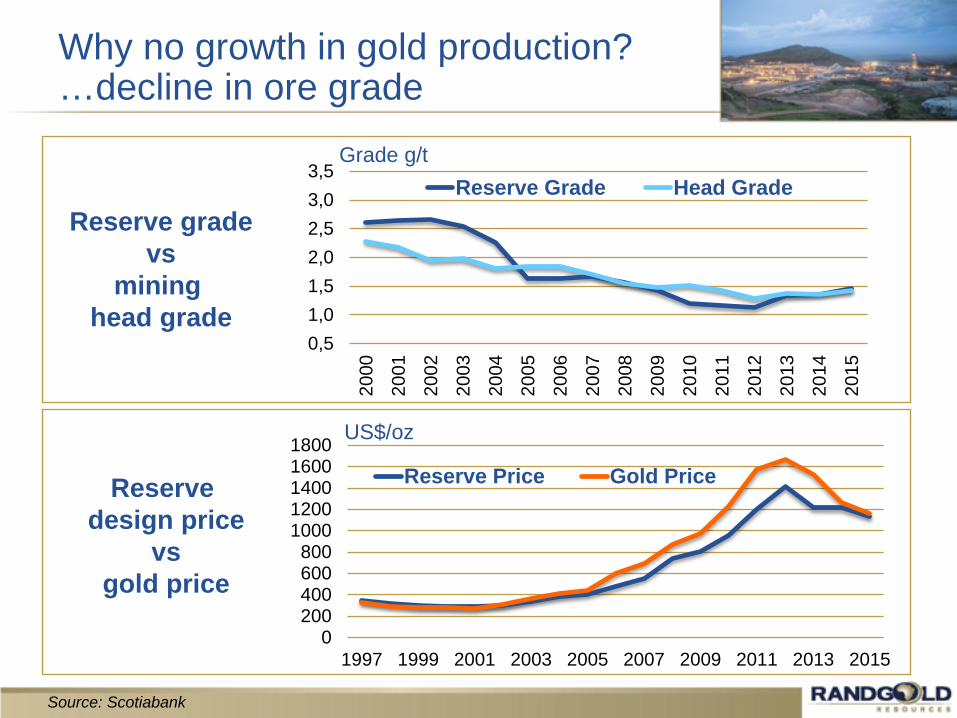
Why no growth in gold production? …decline in ore grade
Reserve gradevs
mining head grade
Reserve design price
vsgold price
Source: Scotiabank
0200400600800
10001200140016001800
1997 1999 2001 2003 2005 2007 2009 2011 2013 2015
Reserve Price Gold Price
US$/oz
0,51,01,52,02,53,03,5
2000
2001
2002
2003
2004
2005
2006
2007
2008
2009
2010
2011
2012
2013
2014
2015
Reserve Grade Head GradeGrade g/t

Gold Supply…
Source: BMO Capital Markets
0
500
1000
1500
2000
2500
3000
3500
2013 2014 2015 2016E 2017E 2018E 2019E 2020E 2021E 2022E 2023E 2024E 2025E
Rest of World China Australia USA Russia South Africa Peru Canada Mexico
Gold tonnes 1/3 decline in new gold supply

Base Metals and Bulk Commodities… reserve outlook better than gold
0
20000
40000
60000
80000
100000
2004 2005 2006 2007 2008 2009 2010 2011 2012 2013 2014 2015
Mt
World iron ore mine reserves
0
200
400
600
800
2005 2006 2007 2008 2009 2010 2011 2012 2013 2014 2015
Mt
World copper mine reserves
Source: BMO Capital Markets
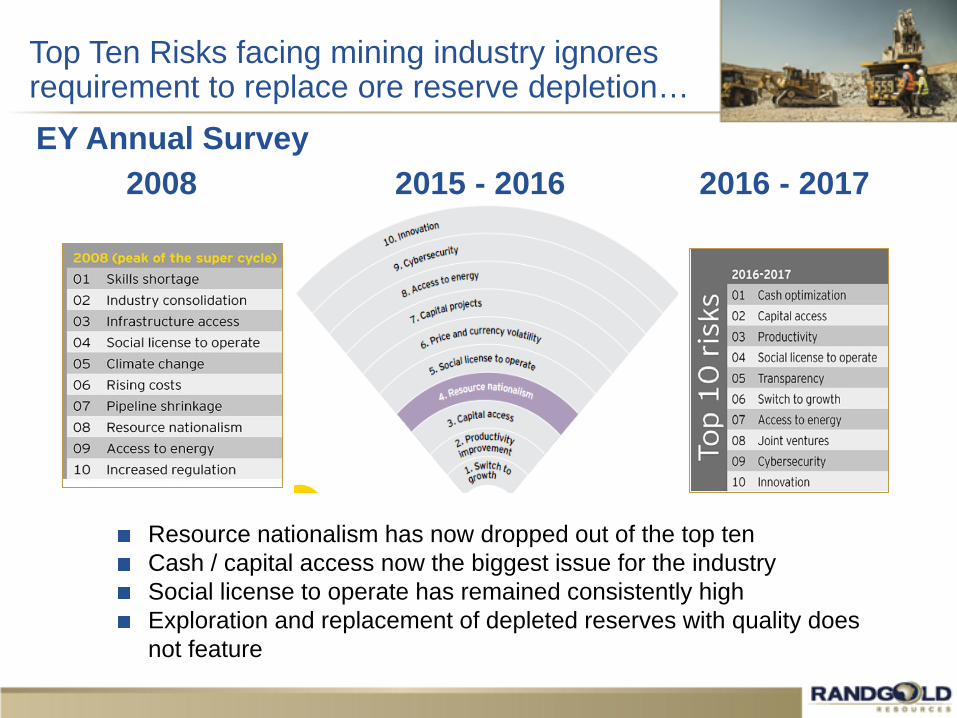
Top Ten Risks facing mining industry ignores requirement to replace ore reserve depletion…
2015 - 2016 2016 - 20172008
Resource nationalism has now dropped out of the top tenCash / capital access now the biggest issue for the industrySocial license to operate has remained consistently highExploration and replacement of depleted reserves with quality does not feature
EY Annual Survey

Growth is not the same as Profit…M&A is not synonymous with Creating Value
Valu
e
Timeexplorationdiscovery
production
development
Brownfields exploration -further discovery
Feasibility
Delivery of value
Feasibilities are about proper testwork and correct and realistic assumptions:
Geology Mine plans Metallurgy Reserves Trade-offsFinancial modelling Baseline and impact studiesSocio-economic
Environmental Investment terms and agreements
Adding value with M&A only starts here!!!!!

Start with a profitable businessManage your long term capital allocation against a realistic price forecastInvest in replacing reservesCapitalise on the peaks and invest in the troughsInvesting in people skills
How can the mining industry ensure it does better in the next bull market than the last?...
0200400600800
1000120014001600
Gold Copper Brent Crude Iron Ore 62% Fe CFR
Commodity Prices Indexed to 100 (1996 to Present)
Source: Scotiabank GBM: Market data as of November 21, 2016

Disclaimer…
Randgold reports its mineral resources and mineral reserves in accordance with the JORC 2012 code. As suchnumbers are reported to the second significant digit. They are equivalent to National Instrument 43-101. Mineralresources are reported at a cut-off grade based on a gold price of US$1 500/oz.The reporting of mineral reserves is also in accordance with Industry Guide 7. Pit optimisations are carried out at agold price of US$1 000/oz, except for Morila which is reported at US$1 300/oz. Mineral reserves are reported at acut-off grade based on US$1 000/oz gold price within the pit designs. Underground reserves are also based on agold price of US$1 000/oz. Dilution and ore loss are incorporated into the calculation of reserves.
Cautionary note to US investors: The United States Securities and Exchange Commission (the SEC) permitsmining companies, in their filings with the SEC, to disclose only proven and probable ore reserves. Randgold usescertain terms in this annual report such as ‘resources’, that the SEC does not recognise and strictly prohibits thecompany from including in its filings with the SEC. Investors are cautioned not to assume that all or any parts ofthe company’s resources will ever be converted into reserves which qualify as ‘proven and probable reserves’ forthe purposes of the SEC’s Industry Guide number 7.
CAUTIONARY NOTE REGARDING FORWARD-LOOKING STATEMENTS: Except for the historical informationcontained herein, the matters discussed in this presentation are forward-looking statements within the meaning ofSection 27A of the US Securities Act of 1933 and Section 21E of the US Securities Exchange Act of 1934, andapplicable Canadian securities legislation. Forward-looking statements include, but are not limited to, statementswith respect to the future price of gold, the estimation of mineral reserves and resources, the realisation of mineralreserve estimates, the timing and amount of estimated future production, costs of production, reservedetermination and reserve conversion rates. Generally, these forward-looking statements can be identified by theuse of forward-looking terminology such as ‘will’, ‘plans’, ‘expects’ or ‘does not expect’, ‘is expected’, ‘budget’,‘scheduled’, ‘estimates’, ‘forecasts’, ‘intends’, ‘anticipates’ or ‘does not anticipate’, or ‘believes’, or variations ofsuch words and phrases or state that certain actions, events or results ‘may’, ‘could’, ‘would’, ‘might’ or ‘will betaken’, ‘occur’ or ‘be achieved’. Assumptions upon which such forward-looking statements are based are in turnbased on factors and events that are not within the control of Randgold Resources Limited (‘Randgold’) and thereis no assurance they will prove to be correct. Forward-looking statements are subject to known and unknownrisks, uncertainties and other factors that may cause the actual results, level of activity, performance orachievements of Randgold to be materially different from those expressed or implied by such forward-lookingstatements, including but not limited to: risks related to mining operations, including political risks and instabilityand risks related to international operations, actual results of current exploration activities, conclusions ofeconomic evaluations, changes in project parameters as plans continue to be refined, as well as those factorsdiscussed in Randgold’s filings with the US Securities and Exchange Commission (the ‘SEC’). Although Randgoldhas attempted to identify important factors that could cause actual results to differ materially from those containedin forward-looking statements, there may be other factors that cause results not to be as anticipated, estimated orintended. There can be no assurance that such statements will prove to be accurate, as actual results and futureevents could differ materially from those anticipated in such statements. Accordingly, readers should not placeundue reliance on forward-looking statements. Randgold does not undertake to update any forward-lookingstatements herein, except in accordance with applicable securities laws.