PREPARED TESTIMONY OF THOMAS J. LONG - TURN · 1 PREPARED TESTIMONY OF THOMAS J. LONG ... between...
39
CPUC Docket: A.15-09-001 Exhibit Number: TURN-1 Witness: Thomas J. Long PREPARED TESTIMONY OF THOMAS J. LONG ON PG&E’S QUANTITATIVE RISK MODELS; PG&E’S DEFERRAL OF WORK BASED ON REPRIORITIZATION; AND GAS DISTRIBUTION RECORDKEEPING Submitted on Behalf of THE UTILITY REFORM NETWORK 785 Market Street, Suite 1400 San Francisco, CA 94103 Telephone: (415) 929-8876 x307 Facsimile: (415) 929-1132 E-mail: [email protected] April 29, 2016
Transcript of PREPARED TESTIMONY OF THOMAS J. LONG - TURN · 1 PREPARED TESTIMONY OF THOMAS J. LONG ... between...

CPUC Docket: A.15-09-001 Exhibit Number: TURN-1 Witness: Thomas J. Long
PREPARED TESTIMONY OF
THOMAS J. LONG
ON PG&E’S QUANTITATIVE RISK MODELS;
PG&E’S DEFERRAL OF WORK BASED ON REPRIORITIZATION; AND
GAS DISTRIBUTION RECORDKEEPING
Submitted on Behalf of
THE UTILITY REFORM NETWORK
785 Market Street, Suite 1400 San Francisco, CA 94103
Telephone: (415) 929-8876 x307
Facsimile: (415) 929-1132 E-mail: [email protected]
April 29, 2016

TABLE OF CONTENTS I. Introduction and Summary ............................................................................................. 1II. PG&E’s Quantitative Models Fall Far Short of Enabling Prioritization (Let Alone Optimization) of Risk Mitigations ............................................................................................... 2
A. Goals of Quantitative Risk Models ...................................................................... 4B. Limitations of PG&E’s Quantitative Modeling ................................................. 5C. Calculation of Risk Reduction Is Achievable Now and Should Be Required 12D. Conclusions and Recommendations .................................................................. 14
III. Concerns with PG&E’s Practice of Delaying or Deferring Work Based on Reprioritization ........................................................................................................................... 14
A. Description of the Practice ................................................................................. 14B. PG&E Needs to Show That Its Reprioritizations Are Necessary and
Reasonable; Limiting Spending to Authorized Levels Is Not a Valid Justification ......................................................................................................... 20
C. The Commission’s Identified Concerns Are Present With Respect to Much of the Deferred Work for Which PG&E is Now Requesting Funding a Second Time ...................................................................................................................... 23
D. Ratemaking Adjustments or Forecast Reductions Are Warranted for Work Deferred As a Result of Unnecessary or Unreasonable Reprioritization ...... 27
E. TURN’s Recommendations Regarding Deferred Gas Distribution Work .... 28IV. GAS DISTRIBUTION RECORDKEEPING ............................................................... 31
A. Scoping Ruling and PG&E’s Supplemental Testimony .................................. 31B. PG&E’s Supplemental Testimony Is Inconsistent With PG&E’s Response in
the Distribution Recordkeeping Investigation and Information Provided in PG&E Reports to the Commission .................................................................... 32
C. TURN’s Recommended Disallowance ............................................................... 35Appendix A .................................................................................................................................. 36

PREPARED TESTIMONY OF THOMAS J. LONG 1
2
I. Introduction and Summary 3
This testimony addresses the following three topics: (1) shortcomings and limitations of 4
PG&E’s quantitative risk models and the importance of calculating risk reduction to the 5
optimization of risk mitigations; (2) PG&E’s continued practice of deferring important work 6
based on reprioritization; and (3) the need to disallow certain capital expenditures that PG&E has 7
incurred in order to remedy inaccurate, incomplete, and unsafe gas distribution records. TURN’s 8
specific conclusions and recommendations are set forth in the body of the testimony. 9
This testimony is presented on behalf of The Utility Reform Network (“TURN”) by 10
Thomas J. Long, TURN’s Legal Director. Mr. Long has almost 30 years of experience as an 11
advocate in major energy and telecommunications proceedings at the CPUC and as a 12
Commissioner advisor. Since September 2011, Mr. Long has served as TURN’s lead attorney 13
and a TURN policy witness in several Commission proceedings relating to natural gas pipeline 14
safety, including PG&E’s 2015 Gas Transmission and Storage proceeding (A.13-12-012), 15
PG&E’s PSEP proceeding (R.11-02-019), and the now-concluded enforcement proceedings 16
against PG&E relating to the San Bruno explosion and its causes (I.12-01-007), PG&E’s 17
transmission system recordkeeping problems (I.11-02-016), and alleged class location violations 18
by PG&E (I.11-11-009) (collectively “transmission enforcement cases”). He has also led 19
TURN’s efforts in the phase of the Rate Case Plan rulemaking (R.13-11-006) devoted to 20
integrating risk analysis into general rate cases (“GRCs”), including speaking on two panels in 21
multi-day workshops relating to integrating risk assessment and mitigation models into the GRC 22
process. This phase culminated in Decision (D.) 14-12-025. Currently, he represents TURN in 23

2
the Safety Model Assessment Proceeding (“S-MAP”) (A.15-05-002 et al.), actively participating 1
in five workshops, the Risk Lexicon Working Group, and the Metrics and Reporting Working 2
Group. Most recently, he participated in the Safety and Enforcement Division (“SED”)-led 3
March 25, 2016 workshop in this proceeding concerning PG&E’s risk assessment and planning 4
process. A summary of Mr. Long’s qualifications is attached as Appendix A. 5
II. PG&E’s Quantitative Models Fall Far Short of Enabling Prioritization (Let Alone 6 Optimization) of Risk Mitigations 7
8 PG&E states that it uses risk assessment and integrated planning processes that produce 9
“risk-informed” prioritization and budgeting for the projects and programs in its GRC forecasts.1 10
“Risk-informed” is a vague term that would presumably apply to any of the methods and 11
processes PG&E has used to address safety in its GRC requests for decades and thus, in itself, 12
does not signal a major change in how GRC requests are determined. 13
However, a key development in recent years has been PG&E’s use of quantitative 14
modeling as part of its risk assessment and planning processes. The two main quantitative tools 15
PG&E used in connection with developing its forecast in this case are the Risk Evaluation Tool 16
(“RET”)2 and Risk Informed Budget Allocation (“RIBA”) scoring.3 PG&E claims that its 17
relatively new processes built around these quantitative tools “help[] to ensure that the projects 18
having the greatest impact on system safety and reliability are included in the portfolio of work 19
put forth by the core operating LOBs [lines of business].”4 In its Gas Distribution testimony, 20
PG&E claims that it engages in “portfolio-level optimization across all assets and programs,” 21
describing the goal of such optimization as “invest[ing] in [Gas Operations’] higher risks with 22
1 Ex. PG&E-2, pp. 3-1, 4-1, and 4-8. 2 Ex. PG&E-2, p. 3-3. 3 Ex. PG&E-2, p. 4-6. 4 Ex. PG&E-2, p. 4-7 (emphasis added).

3
the most effective mitigation programs given constraints including compliance obligations, 1
obligations to serve, resources, system availability, executability and cost.”5 2
Statements such as these would suggest that, with the benefit of its new quantitative 3
models, PG&E is now able to “prioritize” and “optimize” its GRC requests like never before and 4
is able to rank competing projects and programs based on their impact on system safety and 5
reliability and their effectiveness in mitigating risk. It is understandable that PG&E would want 6
to make such claims for its new models because such ranking, prioritization, and optimization is 7
precisely what is needed in GRCs, as the Commission has made clear in its decisions. 8
Unfortunately, as discussed below, PG&E’s quantitative models do not enable calculation 9
of the safety benefits or effectiveness of competing mitigations and thus cannot be said to be 10
using those models to produce a prioritized or optimized portfolio of projects and programs. 11
Thus, at this point, PG&E’s risk models are much less informative and useful to the GRC 12
process of determining the optimal portfolio of risk mitigations than PG&E’s rhetoric would lead 13
one to believe. 14
Before addressing the shortcomings of PG&E’s approach, this testimony will discuss 15
the important role that quantitative modeling can and should play in developing GRC requests 16
and the Commission’s expectations for such models.6 17
18 19 20
21
5 Ex. PG&E-3, pp. 3-9 to 3-10 (emphasis added). 6 As PG&E’s presentation shows, with respect to PG&E’s risk assessment efforts, there is considerable overlap between PG&E’s Safety Model Assessment Proceeding (S-MAP) application and this case. In fact, PG&E includes its S-MAP testimony as part of its direct showing in this case. (Ex. PG&E-2, pp. WP 3-9 to 3-36 and 4-1 to 4-16.) Just as PG&E has presented its view of the virtues of its quantitative modeling approach in both S-MAP and this case, TURN also has presented (and by this testimony is presenting) its views regarding the limitations and shortcomings of PG&E’s approach in both cases. Unlike S-MAP, which is reviewing the utilities’ risk models without reference to a specific utility rate request, this case offers an important opportunity to evaluate PG&E’s approach in the context of the requirements and expectations of a specific rate case.

4
A. Goals of Quantitative Risk Models 1 2
It is generally recognized, including by PG&E, that it is not possible to eliminate all 3
safety risks associated with the operation of an energy utility.7 The challenge then is deciding 4
which risk mitigation activities to implement with the limited resources -- particularly limited 5
ratepayer funds -- available to the utility. As the Commission stated in the decision on PG&E’s 6
last GRC: 7
Virtually everything a utility does [has] some nexus to safety and can 8 be deemed to have some safety impact, but the emphasis should be on 9 those initiatives that deliver the optimal safety improvement in relation 10 to the ratepayer dollars spent.8 11
12 In other words, a work effort cannot be justified simply by asserting that it would reduce risk. 13
The utility needs to demonstrate that it is proposing that its limited resources be used in a way 14
that would produce “optimal safety improvement in relation to the ratepayer dollars spent.”9 15
Quantitative risk modeling can be enormously useful to achieving this goal, as the 16
Commission has recognized. In D.14-12-025, the Commission set forth its objectives for 17
quantitative risk analysis, including requiring utilities in the future Risk Assessment and 18
Mitigation Phase (“RAMP”) of GRCs to present a “prioritization of risk mitigation alternatives, 19
in light of estimated mitigation costs to risk mitigation benefits (Risk Mitigated to Cost Ratio).”10 20
“Risk mitigation benefits” and “risk mitigated” are other ways of saying risk reduction. In 21
addition, D.14-12-025 requires utilities, after the conclusion of GRCs, to submit annual Risk 22
Mitigation Accountability Reports that will “compare the utility’s GRC projections of the 23
7 PG&E Response to DR TURN 46-1; Ex. PG&E-2, p. WP 3-22 (“With limited resources – PG&E cannot do everything and must decide at what point it is okay to not mitigate the risk further – tradeoff decisions must be made”). 8 D.14-08-032, p. 28. 9 D.14-08-032, p. 28. 10 SED Report at 73; D.14-12-025 at 32.

5
benefits and costs of the risk mitigation programs adopted in the GRC to the actual benefits and 1
costs, and to explain any discrepancies between the projected risk mitigation and the actual risk 2
mitigation.”11 This report effectively requires a comparison of achieved risk reductions with 3
forecasted risk reductions and therefore necessitates the calculation of risk reduction. 4
In short, quantitative models can make a critical contribution to the prioritization and 5
optimization of risk mitigation activities that a GRC requires. Calculation of risk reduction is 6
necessary to enable such prioritization and optimization. In addition, as D. 14-12-025 expects, 7
calculation of risk reduction will be a key tool to making the utility accountable for the results of 8
its spending to control and reduce risks. 9
B. Limitations of PG&E’s Quantitative Modeling 10
1. Prevents Comparison of Cost Effectiveness of Risk Mitigations 11
PG&E states for the “operational LOBs,” it uses the RIBA process to prioritize project 12
and and program expenditures.12 With respect to one LOB, gas operations, PG&E claims that it 13
used the RIBA scores included in its workpapers13 to “prioritize funding at the portfolio level for 14
the 2017 GRC forecast.”14 15
However, as PG&E acknowledges, none of the quantitative modeling it used to develop 16
the 2017 GRC forecast included calculation of risk reduction from any risk mitigations under 17
consideration in the portfolio selection process.15 As a result, PG&E’s RIBA scores do not 18
11 D.14-12-025 at 44, 46. 12 Ex. PG&E-2, p. 3-10. 13 Ex. PG&E-3, p. WP 3-20. 14 Response to TURN DR 30-16.c. 15 Response to TURN DR 46-3 (Supp O1) (The RIBA score “does not directly represent a measure of risk reduction achieved by the subject project or program.”); Ex. PG&E-2, pp. 3-10 to 3-11 (describing determining the risk reduction value of risk mitigations as a “difficult” future goal). Below, we will show that calculation of risk reduction can be done now.

6
allow the kind of prioritization of risk mitigations that the Commission has said that it wants. 1
The fundamental problem is that PG&E’s current quantitative efforts, detailed and complex as 2
they are, do not rank or prioritize competing mitigation efforts based on risk reduction per dollar 3
spent. 4
The shortcomings of RIBA in the absence of measuring risk reduction is shown by 5
PG&E’s response to a recent TURN data request. TURN asked if “the RIBA score would be the 6
same for two projects to address the exact same risk if one project were half as effective in 7
reducing the targeted risk.” PG&E responded that “the RIBA score is not a measure of risk 8
reduction” and that the scores for the two projects “may or may not” be the same.16 A scoring 9
process that does not necessarily and always give a higher score to a project that is twice as 10
effective in mitigating the targeted risk as a half-as-effective project cannot be described as 11
providing meaningful or useful information in an effort to prioritize mitigations. 12
PG&E’s Gas Distribution request in this case provides two examples in which calculation 13
of rate reduction would have been extremely useful to PG&E’s – and the Commission’s – 14
decision-making about the best use of limited ratepayer funds. 15
First, as analyzed in the accompanying testimony of John Sugar for TURN, PG&E 16
proposes to shorten the interval for leak surveys for most of its distribution assets from 5 years to 17
4 years. Mr. Sugar shows that PG&E’s other, considerable ratepayer-funded efforts in the area 18
of risk management appear to be succeeding and that PG&E has failed to demonstrate that there 19
are sufficient incremental benefits from shortening the survey interval to justify the cost.17 If 20
PG&E had calculated risk reductions for the various mitigations under consideration, it would 21
have been possible to measure the incremental benefits of shortening the risk survey interval and 22
16 Response to TURN DR 70-1. 17 Testimony of John Sugar, Section III.

7
to compare the cost-effectiveness of that particular mitigation to other risk mitigations under 1
consideration – not just in the area of gas leak management or even limited to gas distribution, 2
but even across other lines of business. 3
Second, as also discussed in Mr. Sugar’s testimony, PG&E has unwisely adopted a policy 4
of replacing gas services in response to leaks even when, in the majority of cases, the problem 5
could be effectively addressed by a much less expensive tee cap repair.18 In considering its 6
policy change, if PG&E had calculated the risk reduction that would be achieved by repairing tee 7
caps when they are the cause of the leak, and compared that calculation to the risk reduction 8
from replacing services in such situations (and if PG&E knew that such calculations would be 9
part of the record in the GRC), the relative cost effectiveness of tee cap repair would have been 10
underscored. And PG&E would have avoided an imprudent use of large amounts of ratepayer 11
money for which TURN is now recommending a permanent disallowance from rate base.19 12
2. No Prioritization of Mitigations Based on Effectiveness in Reducing 13 Risk 14
In light of PG&E’s assertion that the portfolio of projects included in its 2017 GRC 15
request have “the greatest impact on system safety and reliability,”20 one would expect that 16
PG&E ranked the projects it considered for this case based on their effectiveness in reducing 17
risk. PG&E has no such ranking. 18
To explore this issue, TURN asked PG&E, for each of major LOBs, the following 19
hypothetical: Assume PG&E wished to reduce the cost of its non-mandatory forecast spending 20
in 2017 by 25%. Which projects or programs would be eliminated or modified (e.g., reduced in 21
18 Testimony of John Sugar, Section I. 19 Testimony of John Sugar, Section I. 20 Ex. PG&E-2, p. 4-7 (emphasis added).
8
pace or scope), such that risk reduction would be maximized? And how would RET, RIBA, or 1
any other model be useful in this analysis? PG&E’s response began: 2
PG&E is unable to make the determinations requested in these questions. 3 PG&E’s methodology is not intended to reasonably calculate, or 4 maximize, risk reduction by re-sorting portfolios of projects or programs 5 in the manner that this question indicates.21 6
7
The response went on to indicate that, to answer the question, PG&E would need to “revisit its 8
entire prioritization of work across the line of business portfolio” and that RIBA scores would be 9
considered as part of that process.22 10
PG&E’s response highlights the problems that result from the failure to calculate risk 11
reduction. There is no ready way for PG&E, intervenors, or the Commission, to adjust PG&E’s 12
chosen portfolio of projects in response to a change in the budget, either up or down. Although 13
PG&E claims that it has chosen the most effective projects for reducing safety risk, PG&E 14
cannot back up that claim by a list that shows how it made that determination, or which projects 15
were at the bottom of the list and should be the first to drop out of the portfolio in the event of a 16
reduced budget. 17
Without calculating risk reduction, PG&E and other utilities are squandering a key 18
benefit of quantitative models, a benefit that (as shown above) the Commission expects such 19
models to yield. By including in their rate case presentations a prioritization of risk mitigation 20
projects based on calculation of risk reduction, utilities could provide the parties and 21
Commission an extremely useful analytic tool that could assist in speeding the resolution of rate 22
cases. 23
21 Response to TURN DR 70-15. 22 Response to TURN DR 70-15.

9
3. PG&E Chooses Its Portfolio of Projects Through an Opaque Process 1
The process by which PG&E decides which projects to propose in a rate case is not 2
transparent to the other parties or the Commission. In its testimony, PG&E summarizes its 3
Integrated Planning Process, which involves the generation of numerous and voluminous 4
documents that are considered in a series of meetings and discussions throughout the year.23 5
PG&E may find these processes useful, and TURN is willing to accept PG&E’s statements that 6
they are an improvement over PG&E’s past processes for choosing portfolios of risk mitigation 7
projects. 8
But they do not lend themselves to enabling the Commission or intervenors to gain 9
transparency into how PG&E chose its particular portfolio. As the data request responses 10
discussed above show, PG&E’s process yields no document or set of documents that shows how 11
PG&E prioritized the mitigations it was considering. At first blush, the RIBA scores would 12
seem to hold that promise, but, as shown, they have significant limitations and are just one factor 13
that PG&E considers in its extensive decisionmaking process.24 Ultimately, at the end of its 14
Integrated Planning Process, PG&E doesn’t explain for the benefit of those of us who were not 15
part of it: (1) what mitigations the company considered and rejected; (2) what criteria it used to 16
decide which mitigations to pursue; (3) and why the chosen mitigations are superior to other 17
potential mitigations. 18
A ranking of mitigations based on risk reduction per dollar spent that is presented as part 19
of the rate case showing would be a major advance in focusing the utility’s decisionmaking 20
23 Ex. PG&E-2, Chap. 4. 24 See, for example, PG&E’s response to TURN DR 48-1 (included in response to TURN DR 48-1 Supp 01), in which PG&E makes the point that RIBA scores are not the sole factor in deciding the portfolio or work in the Integrated Planning Process and that consideration is also given to other factors such as “classification of work, system constraints, resources constraints, work optimization, and financial constraints.”
10
process and improving transparency. TURN is not suggesting that utilities or the Commission 1
should slavishly adhere to such a ranking in choosing portfolios of mitigation. But transparency 2
and GRC streamlining would benefit if the utility’s showing including such a list and, as 3
necessary, explained what factor(s) caused it to deviate from the ranking. 4
4. The “Flags” that PG&E Assigns to Projects and Programs Can Be 5 Questionable 6
In PG&E’s Integrated Planning Process, a significant factor seems to be how a project or 7
program is “flagged.” Flags refer to a label that shows “other non-risk drivers of the work” and 8
show, among other things, whether PG&E views the work as required. The flags showing 9
required work categories are: Mandatory, Compliance, Work Requested by Others, and 10
Commitment. 25 11
One (including PG&E’s senior officials) might believe that a project or program that is 12
assigned a flag for one of these required categories must be performed. However, there is reason 13
to question whether activities that are so flagged are indeed required – particularly at the 14
indicated level of funding. 15
PG&E’s RIBA result tables (for Gas Distribution in this example) show the associated 16
2017 forecast amounts for the project or program in question. TURN asked PG&E to indicate 17
for each such activity that was flagged “mandatory” whether the full funding amount was 18
mandatory, and, if not, which part was non-mandatory. PG&E responded that the “RIBA 19
process does not distinguish between programs that are 100 percent mandatory and those that are 20
25 Ex. PG&E-2, pp. WP 4-4 to 4-5. A list of the flags is shown at p. WP 4-14)

11
predominantly mandatory.”26 In other words, some funding for a supposedly mandatory project 1
or program may not actually be mandatory. 2
PG&E’s response further showed that two of the programs for below ground Grade 3 3
leak survey and repair, MATs FIG and FIP, together representing $6 million in expense, were 4
wrongly labeled as mandatory.27 5
In addition, PG&E’s data request response shows that PG&E takes an expansive view of 6
what work is mandatory. Relying on the “best practices” language in PU Code Section 963, 7
PG&E seems to be of the view that any practice it considers to be a best practice is mandatory.28 8
For example, PG&E claims that accelerating the gas distribution leak survey cycle is a best 9
practice and that, therefore its proposal to shorten the leak survey cycle from five to four years is 10
mandatory.29 PG&E made this same argument in the 2014 GRC in support of a similar proposal 11
for a three-year survey cycle. The Commission disagreed with PG&E’s view, pointing out that 12
PG&E was overly focused on one aspect of other operators’ leak management programs and did 13
not consider all of the techniques and strategies operators use to detect and repair leaks.30 14
Thus, by probing just one of the flags associated with RIBA-scored projects and 15
programs for one LOB, gas distribution, TURN learned that the “mandatory” flag was 16
sometimes applied: (1) incorrectly; (2) to the full scope of work when not all of the work 17
26 Response to TURN DR 70-14.a. In a supplement to this response, PG&E stated that it attempted to quantify “the percentage” of spending on non-mandatory components within mandatory programs and was providing “additional details” in an attachment. Response to TURN DR 70-14.b Supp 01, Attachment 1. However, the attachment does not include any such percentages. However, as discussed below, it does show that some of PG&E’s mandatory designations were incorrect. 27 Response to TURN DR 70-14.b Supp 01, Attachment 1. While in PG&E’s lexicon “mandatory” means that the work must be completed within one year, PG&E states that the below ground Grade 3 leak repairs are not required to be repaired by a scheduled date. 28 As in the 2014 GRC and the 2015 GT&S case, TURN disagrees with PG&E’s legal interpretation of the import of the use of “best practices” in Section 963, but will save that legal discussion for the briefs. 29 Response to TURN DR 70-14.b Supp 01, Attachment 1 (Explanation column). 30 D.14-08-032, pp. 76-77.

12
qualified for that label; or (3) based on a dubious legal interpretation. To the extent that PG&E 1
senior officials relied on such flags in their decisionmaking (which is unknown because the 2
process is opaque), these findings call into question whether portfolio choices were made based 3
on accurate information. For example, if work that addresses relatively lower priority risks was 4
included in the portfolio based on an incorrect view that all of that work was “mandatory”, other 5
work that addressed more significant risks may have been squeezed out. 6
7 C. Calculation of Risk Reduction Is Achievable Now and Should Be Required 8
9 In the S-MAP proceeding, TURN has presented a methodology that has been used by 10
many electric utilities for many years that calculates risk reduction in a way that permits 11
meaningful comparison of any mitigations that are under consideration in any and all lines of 12
business in a utility. The methodology and implementing software were developed over a 10-13
year period, 1998-2008, with the support of the Electric Power Research Institute (“EPRI”) and 14
EPRI-member utilities, including PG&E and California’s other large energy utilities. A full 15
description of the methodology, including an explanation of ways in which it avoids problems 16
with PG&E’s quantitative models, is set forth in a white paper authored by TURN’s experts, one 17
of whom helped to develop the methodology.31 The white paper has been made part of the 18
record of the S-MAP case and is attached to this testimony as a supporting document. 19
Before TURN presented this methodology in S-MAP, PG&E had long claimed that it was 20
not able to calculate risk reduction using its quantitative models. However, after we presented 21
our methodology, PG&E admitted that risk reduction could be calculated even using PG&E’s 22
31 Intervenor Perspective Regarding an Improved Methodology to Promote Safety and Reliability of Electric and Natural Gas Service in California, prepared for the S-MAP Workshop January 25, 2016 (and revised in response to workshop comments on January 28, 2016), prepared by Charles D. Feinstein, Ph.D and Jonathan A. Lesser, Ph.D on behalf of TURN, Indicated Shippers, and Energy Producers and Users Coalition.
13
current risk models. In a data request response in this case, PG&E stated that it could use its 1
RET tool to calculate a risk reduction score for a program, by running the RET sequentially, 2
modeling the risk with, and without, the program in order to determine the risk reduction.32 The 3
existence of the EPRI-developed methodology and PG&E’s acknowledgement that RET could 4
be used to calculate risk reduction show that PG&E need not wait to begin using risk reduction 5
calculations as part of its process for choosing GRC projects and programs. 6
Now that PG&E has acknowledged that methodologies exist to calculate risk reduction, 7
PG&E presents other roadblocks: “The challenge is to obtain sufficient data -- of integrity -- and 8
have sufficiently robust models through which the calculations can be performed reasonably well 9
and provide a value that is credible, verifiable and repeatable.”33 However, if before and after 10
RET scores can be used to calculate risk reduction, PG&E needs to explain why RET and RIBA 11
would not meet the above-quoted criteria for purposes of calculating risk reduction but can be 12
advantageously used for the purpose of scoring risks and projects and programs to address those 13
risks. The “challenge” PG&E asserts applies to quantitative risk models used for any purpose. 14
If PG&E’s point is that risk reduction calculations using currently available information 15
should not be considered 100 percent reliable, TURN would not disagree, but would note that the 16
same is true of the scores that PG&E produces with its current models that rely on the same 17
available information. Even if far from perfect, using quantitative models to calculate risk 18
reduction would greatly expand the usefulness of such models in meeting the needs of the 19
Commission and the parties in choosing an optimal portfolio of risk mitigations. 20
21
32 Response to TURN DR 46-3 Supp 01. Because of problems with the RET scoring methodology discussed in the S-MAP white paper, TURN does not advocate that RET as currently formulated be used to calculate risk reduction. However, as the white paper explains, those problems could be corrected relatively easily if PG&E chose to do so. 33 Response to TURN DR 46-3 Supp 01.
14
D. Conclusions and Recommendations 1 2
Based on the foregoing, TURN offers the following conclusions and recommendations: 3
1. PG&E did not calculate risk reduction for the mitigations it considered in its Integrated 4
Planning Process. As a result and contrary to PG&E’s claims in its testimony, that process did 5
not demonstrably lead to a 2017 GRC portfolio that includes projects and programs that are the 6
“most effective mitigation programs” and “have the greatest impact on system safety.” 7
Accordingly, the portfolio of mitigations that emerged from PG&E’s planning process is not 8
entitled to deference from the Commission. 9
2. PG&E’s opaque process for choosing its portfolio of risk mitigations impedes the 10
ability of parties and the Commission to understand the basis of PG&E’s choices and does not 11
help parties or the Commission make alternative judgments about the best ways to optimize 12
limited ratepayer funds. 13
3. “Flags” on RIBA-scored projects are not necessarily reliable. 14
4. PG&E should be required to include calculation of risk reduction and risk reduction 15
per dollar spent as part of its presentation in all future cases, including its next GT&S 16
application, and should justify any deviations from rankings derived from such measures. 17
18
III. Concerns with PG&E’s Practice of Delaying or Deferring Work Based on 19 Reprioritization 20
21 A. Description of the Practice 22
23 Continuing a practice that has drawn unfavorable attention from the Commission in its 24
recent GRCs, PG&E’s request in this case includes several forecasted amounts that are 25
significantly higher than they otherwise would be to make up for work that was deferred during 26
the period prior to the test year. The basic pattern exhibited in this case is as follows: 27

15
• In the 2014 GRC, PG&E identified work that it claimed was necessary and which the 1
Commission authorized for 2014-2016. Funding for that work was included in revenue 2
requirement. 3
• PG&E decided to forego performing a significant portion of that work in 2014-2016, 4
claiming other work took higher priority. 5
• Now PG&E once again says the work in question is important and seeks funding at a 6
level that is significantly higher than it would be if PG&E had simply performed the 7
work as authorized and funded for 2014-2016. 8
PG&E’s use of this practice can be illustrated by three examples from gas distribution, in 9
which several programs were curtailed significantly in the name of reprioritization. The practice 10
was not limited to gas distribution, however. Other TURN witnesses will address other instances 11
of this practice as it relates to programs and projects that are the subject of their testimony. 12
Example #1: Replacement of Plastic (Aldyl-A) Main (MAT 14D) 13
In the 2014 GRC, PG&E made the case for the need to accelerate main replacement, 14
including plastic pipe (primarily Aldyl-A). As summarized in D.14-08-032, PG&E argued that 15
“the pace of replacement must increase, or service quality and safety will decline.”34 PG&E 16
proposed replacing 100 miles of plastic main annually.35 After noting that PG&E had three major 17
distribution pipe explosions in 2009 and 2011 that involved Aldyl-A pipe,36 the Commission 18
agreed with PG&E that acceleration of plastic main replacement was warranted and in fact 19
decided that more safety mitigation results in relation to the costs involved would be achieved by 20
authorizing an even higher level of plastic main replacement – 139 miles per year.37 21
34 D.14-08-032, p. 95. 35 Id. 36 Id., p. 97. 37 Id., p. 98.

16
However, PG&E chose to sharply curtail plastic main replacement and actually only 1
replaced just 32 miles of Aldyl-A main in 201438 and 63 miles in 2015.39 In 2016, PG&E 2
forecasts replacing 53 miles.40 3
PG&E explains in its testimony that the sharply reduced work is due in part to a lower 4
prioritization for the pipeline replacement program within the Gas Operations portfolio based on 5
an updated assessment of relative risk.41 However, as acknowledged by PG&E’s Gas 6
Distribution Pipeline Safety Report (“GDPSR”) submitted on March 30, 2015, PG&E’s claim is 7
not that it perceived plastic mains to pose a lower risk than presented in the 2014 GRC.42 In fact, 8
the GDPSR stated that main replacement “addresses a high risk relative to the overall 2014 9
portfolio.”43 The change in relative ranking is because PG&E determined that replacement of 10
services was a higher safety priority.44 11
Thus, as explained later in PG&E’s testimony, a key reason for the decision to curtail 12
plastic main replacement was because more capital dollars were being spent on service 13
replacement than was forecast in the 2014 GRC.45 In addition, PG&E states that its actual unit 14
38 Ex. PG&E-3, p. 4-22. 39 GDPSR, 2015-2, p. 56. 40 Ex. PG&E-3, p. 4-34, Table 4-7. 41 Ex. PG&E-3, p. 2-15. That discussion also blames the drop-off on the timing of the GRC decision in August 2014. However, the timing of the GRC decision, at most, could only have reduced the miles of replacement in 2014. PG&E could have tried to increase work in 2015 and 2016 to make up for the shortfall in 2014. In fact, PG&E claims that it expects total gas distribution capital spending for 2014-2016 to make up for lower than authorized spending in 2014. However, for plastic main replacement, PG&E made no such effort. 42 In fact, in 2015, PG&E calculated an increased risk related to MAT 14D plastic mains, when the estimated likelihood of failure increased to level 4 from level 3 in 2013 and 2014. This assessment of increased risk is reflected in an increase in the RIBA score from 433 in 2014 to 571 in 2015. PG&E response to TURN DR 48-1 Supp 01, which in turn explains the response to TURN DR 4-5. 43 March 30, 2015 (2014-2) GDPSR, p. 12. As required by D.11-05-018, PG&E submits these GDPSRs twice a year, one covering the first 6 months of the year and the other covering the second 6 months. This testimony will refer to the reports by year as follows: the second report in 2014 is 2014-2. 44 Mr. Sugar’s testimony addresses in detail PG&E’s development of its new service replacement policy and concludes, among other things, that: (1) with respect to the majority of service replacements covered by PG&E’s new policy, it would be more cost effective to repair the tee cap causing the leak rather than replace the entire service; and (2) PG&E’s RIBA score for service replacement failed to exclude tee cap issues from the analysis, leading to an inflated score for service replacements. Testimony of John Sugar, Section I. 45 Ex. PG&E-3, p. 4-22.

17
costs to replace main came in above the forecast unit cost in the 2014 GRC and “[a]s a result, the 1
amount of main replaced in 2014 was significantly less than proposed in the 2014 GRC.”46 2
Now, PG&E wants to resume replacement of plastic mains at approximately the same 3
100-mile per year level it requested in the 2014 GRC: 95 miles in 2017, 102 miles in 2018, and 4
108 miles in 2019.47 In support of this request, PG&E states that this program is needed to 5
mitigate risks associated with mains built with Aldyl-A plastic and similar plastic materials 6
installed before 1985, which is susceptible to cracks leading to leaks.48 PG&E asserts that it 7
needs to make “continued progress” on replacing pipelines that pose the greatest risk to system 8
safety, and plans to systematically increase the replacement rate of Aldyl-A year over year.49 9
Because there is a finite amount of pre-1985 plastic main in PG&E’s system, each mile 10
that was not replaced in 2014-2016, even though funded by ratepayers, has added to the amount 11
that needs to be addressed in 2017-2019 and later years. 12
Example # 2: High Pressure Regulator Program (MWCI 2K) 13
In the 2014 GRC, PG&E reported a 2011 finding that the majority of leaks on the gas 14
transmission system were on high pressure regulator (“HPR”) facilities and that it therefore had 15
begun an aggressive program to rebuild or replace HPRs.50 The 2014 GRC decision approved 16
PG&E’s plan to mitigate risks associated with about 1,000 s HPRs per year in each of 2014 and 17
2015.51 This work was supposed to conclude the program by the end of 2015.52 18
46 Ex. PG&E-3, p. 4-22 to 4-23. The accompanying testimony of Mr. Sugar (Section II.A) addresses the significant increase in unit costs for plastic main that PG&E has failed to explain or justify. 47 Ex. PG&E-3, p. 4-34, Table 4-7. 48 Ex. PG&E-3, p. 4-24. 49 Ex. PG&E-3, p. 4-35. 50 2014 GRC, Ex. PG&E-3 (Gas Distribution), pp. 8-23 to 8-24. 51 Ex. PG&E-3, p. 5-16. 52 GDPSR 2014-2, p. 11.

18
However, beginning in 2013, PG&E decided to significantly slow the pace of this 1
program based on a new risk assessment that assigned this program a relatively low risk score.53 2
In this risk assessment, PG&E viewed the consequences of an HPR failure as significant (serious 3
injury), but the likelihood of failure as “very remote.”54 Although this decision took place in 4
2013 and led to a reduction of work in that year,55 PG&E did not reduce its forecast in the 2014 5
GRC. 6
As a result of the decision to slow the pace, PG&E budgeted to address only 410 HPRs 7
in 2014,56 addressed only 120 units in 2015,57 and forecasts addressing 300 units in 2016.58 8
In this GRC, PG&E states that it has revised its risk assessment for this program again 9
and has come to view the risk of HPR failure as a relatively high risk because of higher estimates 10
of both the likelihood of failure and the consequences of failure.59 PG&E now forecasts 11
addressing 375 units in 2017, 405 in 2018, and 440 in 2019.60 Even though PG&E first 12
increased its risk estimates in 2014,61 PG&E decreased the units addressed in this program in 13
2015, as noted above. 14
The forecast work in 2017-2019 would not be necessary if PG&E had completed the 15
program as contemplated by its forecast that was adopted and funded in the 2014 GRC. 16
Example #3 – Valve Program (MAT 50E) 17
53 Ex. PG&E-3, p. 5-16 54 Ex. PG&E-3, p. 5-16. The 2013 score was based on a 5 for safety impact and a 1 for likelihood. PG&E response to TURN DR 48-01 Supp 01. 55 Ex. PG&E-3, p. 5-16. 56 GDPSR 2014-2, Table 10-1, p. 68. 57 GDPSR 2015-2, Table 10-1, p. 56. 58 Ex. PG&E-3, p. 5-17. 59 Ex. PG&E-3, p. 5-17. 60 Ex. PG&E-3, p. WP 5-26. 61 In 2013, the overall risk score was based on a 5 for safety impact and 1 for likelihood. In 2014, PG&E increased the assessment of risk both in terms of safety impact (6) and likelihood (2). In 2015, the overall score increased again based on assigning a 3 to likelihood, although safety impact remained at 6. Response to TURN DR 48-1 Supp 01.

19
PG&E’s valve program has two components: replacing valves that are leaking or can no 1
longer be operated and installing new valves, primarily emergency shutdown valves.62 2
The 2014 GRC decision authorized replacing and installing a total of approximately 528 3
valves per year.63 PG&E had actually sought authorization to address even more valves, but in 4
response to concerns raised by TURN and Cycla, the Commission extended the installation of 5
emergency shut-off valves from 3 to 6 years, stating that it wished to mitigate cost impacts on 6
customers and to “alleviate[] pressure on PG&E’s ability to fund competing resources and high-7
priority programs.”64 8
Notwithstanding PG&E’s push in the 2014 GRC to replace and install large numbers of 9
valves, PG&E states that few valves were actually installed. While PG&E’s testimony attributes 10
the curtailment of work in this program to reprioritization of higher priority work,65 PG&E’s 11
March 30, 2015 GDPSR states that an increase in unit costs was responsible for curtailing valve 12
replacements.66 13
In 2014, PG&E replaced and installed only 83 valves.67 In 2015, PG&E replaced and 14
installed only 81 valves,68 which is significantly less than the forecast of 118 included in 15
PG&E’s 2017 GRC testimony.69 PG&E forecasts replacing and installing 169 valves,70 a 16
forecast that is questionable considering PG&E fell far short of its 2015 forecast. 17
62 Ex. PG&E-3, p. 4-25. 63 Id. 64 D.14-08-032, p. 104. 65 Ex. PG&E-3, p. 4-25. Although PG&E claims that reprioritization of higher priority work was the reason for the curtailment, PG&E did not include this program in its list of programs that were curtailed because of a change in PG&E’s risk assessment. Response to TURN DR 48-1. 66 GDPSR, 2014-2, p. 11. With respect to new emergency shutdown valves, the GDPSR, like the 2017 testimony, attributes the curtailment to reprioritization. 67 GDPSR, 2014-2, p. 68, Table 10-1. 68 GDPSR, 2015-2, p. 56, Table 10-1. 69 Ex. PG&E-3, p. 4-39, Table 4-9 . 70 Id.
20
Now, PG&E seeks to ramp up this program again, forecasting replacement and 1
installation of 346 valves per year in 2017 to 2019.71 2
B. PG&E Needs to Show That Its Reprioritizations Are Necessary and 3 Reasonable; Limiting Spending to Authorized Levels Is Not a Valid Justification 4
5 In recent PG&E GRC decisions, the Commission has expressed concern about PG&E’s 6
practice of deferring work that was requested and authorized in previous GRCs, deferred, and 7
then re-requested in another GRC. 8
Decision 11-05-018 9
In D.11-05-018, the decision in PG&E’s 2011 GRC, the Commission went to the trouble 10
of including a full section entitled “Reprioritization and Cost Deferrals,” even though most issues 11
in the case had been resolved by a settlement approved in that decision. 12
The Commission began its discussion by acknowledging that the utility should have some 13
flexibility to reprioritize activities in order to manage its operations in a safe and reliable 14
manner.72 However, the Commission noted that not everything the utility does in the name of 15
reprioritization is “necessary or reasonable.”73 In this regard, the Commission highlighted two 16
concerns. 17
First, the utility has the responsibility to spend what is necessary to ensure safe and 18
reliable service, even if that means spending above authorized levels: “To the extent a utility 19
uses authorized cost levels as a reason for deferring activities, the Commission must be assured 20
that such deferrals are otherwise reasonable especially with respect to safe and reliable 21
service.”74 22
71 Id. 72 D.11-05-018, p. 27. 73 D.11-05-018, p. 28. 74 D.11-05-018, p. 29.

21
Second, the Commission pointed out that reprioritization, “justified or not”, undermines 1
the utility’s accountability for using ratepayer funds efficiently: “Much of what is authorized is 2
based on the utility’s depiction of its needs and associated costs. Those needs and costs are 3
tested by the GRC process. Reprioritized needs and associated costs may not be so tested and 4
may not result in the most efficient use of funds.”75 5
The Commission concluded its discussion with the following cautionary language: 6
The Commission will be critical in its evaluation of previously requested 7 activities or projects that were deferred and re-requested keeping in mind 8 that the utility has the obligation to maintain its operations and its plant 9 in the condition to provide efficient, safe and reliable service, even if that 10 condition requires more expenditures than the Commission has 11 authorized.76 12
13 14
15
16
17
Decision 14-08-013 18
In the 2014 GRC, PG&E continued its practice of deferring significant expenditures 19
based on reprioritization. In response, ORA submitted policy testimony that is largely applicable 20
to this case and that includes in its attachments to this testimony.77 21
D.14-08-013 made several adjustments to PG&E’s request to address problematic 22
deferrals of work. For example, with respect to pole inspections, the Commission made clear 23
75 D.11-05-018, p. 29. 76 D.11-05-018, p. 31. 77 A.12-11-009, Ex. DRA-7, DRA Testimony on Electric Distribution Capital Expenditures, Part 1 of 2, pp. 11-18. Even though DRA’s testimony was offered in reference to electric distribution capital expenditures, the discussion is generally applicable to any spending, capital or expense, that is deferred based on reprioritization.

22
that the emergence of other higher priority work does not, by itself, justify curtailing other work 1
of ongoing importance: 2
Even assuming that such obligations for higher priority work was of a 3 higher priority, PG&E fails to demonstrate that such obligations for 4 higher priority work forced the postponement of forecasted pole 5 inspections. PG&E voluntarily chose not to perform previously 6 forecasted pole inspections. Obligations to complete unforeseen projects 7 deemed to have a higher-priority does not explain why PG&E shouldn’t 8 (or couldn’t) also fund lower-priority projects (such as pole inspections), 9 particularly if such projects had been previously found necessary to 10 provide safe, reliable service.78 11 12
The Commission further explained that the risk of spending above authorized levels and 13
experiencing reduced earnings did not justify deferred work based on reprioritization: 14
We recognize that PG&E’s earned rate of return may have been lower as 15 a result of spending more money on pole inspections in addition to other 16 higher priority work. The risk of earning a lower return, however, does 17 not justify PG&E’s choice to allow a pole inspection backlog to develop 18 at ratepayer expense. 19 20
With respect to pole replacements, which are capital expenditures, the Commission again 21
found that PG&E had improperly deferred work based on a supposed need to reprioritize 22
spending: 23
By paying for unanticipated higher-priority expenditures out of ratepayer 24 revenues, rather than out of retained earnings, PG&E’s shareholders 25 were protected from the risk that such unanticipated spending would 26 erode profits. To provide this protection to shareholders, PG&E curtailed 27 implementation of the programs which ratepayers had funded. PG&E 28 now seeks similar funding from ratepayers in this subsequent GRC to 29 pay for a program that was curtailed. Utility spending should not be 30 driven simply by the timing of rate relief by deferring pole replacements 31 at levels based on previously adopted forecasts. Accordingly, although 32 we do not expect PG&E to implement its workload in an inflexible 33 manner, we do not believe that ratemaking should provide an incentive 34 to ration projects based upon the timing of rate cases. We thus reduce 35
78 D.14-08-032, p. 190.

23
PG&E’s test year revenue requirement to exclude the effects of capital 1 expenditures for deferred maintenance for pole replacements incurred in 2 2013, as discussed above.79 3 4
In this context, the Commission also specifically rejected the notion that authorized 5
spending levels in a GRC should serve as a cap on utility spending: “PG&E bears 6
the risk that, as a result of spending obligations, the earned rate of return may be less 7
than the authorized return. While PG&E has finite funds to meet capital and 8
operational needs, PG&E is not restricted to spending only up to the forecast adopted 9
in a GRC.”80 10
The lessons from these two decisions include the following: 11
(1) The utility has the responsibility to spend what is necessary to ensure safe and reliable 12
service, even if that means spending above authorized levels; 13
(2) The emergence of higher priority work does not, by itself, justify curtailing lower priority 14
projects, particularly if such projects had been previously found necessary to provide 15
safe, reliable service; 16
(3) The risk of spending above authorized levels and experiencing reduced earnings, by 17
itself, does not justify deferring work based on reprioritization; and 18
(4) Utilities should not ration projects based on the timing of rate cases. 19
C. The Commission’s Identified Concerns Are Present With Respect to Much of the 20 Deferred Work for Which PG&E is Now Requesting Funding a Second Time 21
22 Invoking the reprioritization rationale, PG&E has again chosen to defer work that it 23
previously indicated was important and was funded to perform. And, again, for this deferred 24
79 D.14-08-032, p. 198. 80 D.14-08-032, p. 197 (emphasis added).

24
work, PG&E is requesting funding in this GRC that is higher than it otherwise would be because 1
of the curtailed efforts. 2
As was the case in the past, PG&E deferred this reprioritized work in order to limit the 3
amount of spending in excess of authorized levels and therefore to limit the exposure of 4
shareholders to reduced earnings. In response to a TURN data request, PG&E has explained that 5
it uses reprioritization as a response when “emerging issues” arise.81 Such emerging work could 6
include new work or “unplanned costs” or even, “increases in cost estimates.”82 If such an 7
emerging issue arises, PG&E’s lines of business will first try to “fund” the emerging work 8
through reprioritization within the LOB, i.e., by curtailing previously planned work in order to 9
offset the cost of the emerging work.83 If the emerging issues cannot be funded through 10
reprioritization within the LOB, the LOB may seek enterprise-level “reserve” funds to pay for 11
the emerging work.84 Such an approach of curtailing work that has previously been found 12
necessary in order to avoid exceeding authorized spending levels runs directly counter to the 13
guidance previously provided by the Commission. 14
The Gas Distribution examples described above illustrate the unreasonableness of 15
PG&E’s deferral of work based on reprioritization. For each program, PG&E asserted in the 16
2014 GRC that the work was important and needed to be funded at the requested level. With 17
respect to Aldyl-A main, the Commission even found that PG&E should do more work. In this 18
81 Response to TURN DR 34-4.b and 34.c. See also, Ex. PG&E-2, p. 4-7. 82 Response to TURN DR 34-4.b. 83 Response to TURN DR 34-4.c. 84 Response to TURN DR 34-4.c. The use of reserve funds is another means by which authorized and ratepayer funded work deemed to be lower priority is deferred in favor of higher priority work. Response to TURN DR 19-3.b.i (reserve is generally funded by reducing expenditures on lowest priority work). As an apparent last resort, PG&E claims that, if the level of available spending, including the targeted reserve amount, is not adequate to fund the needs of the business at the targeted level of earnings, then the earnings target is reduced. Response to TURN 34.f. With respect to the deferred work that is the subject of this testimony, PG&E did not follow the approach of accepting reduced earnings, and instead curtailed certain authorized work to offset the cost of work it perceived to be of higher priority.

25
GRC, PG&E once again claims that the same work is necessary for safety and worthy of 1
funding. As PG&E states at the outset of its Gas Distribution testimony: “Our forecast 2
represents the amount of work PG&E needs to perform to safely and reliably operate our natural 3
gas facilities in a manner consistent with industry best practices.”85 4
PG&E chose to curtail these programs in 2014-2016 order to limit its spending above 5
authorized levels, which the Commission has made clear is not an acceptable reason to ask 6
ratepayers to pay again for the same work. As in the two previous GRCs, PG&E has failed to 7
show that it shouldn’t or couldn’t have continued to perform the work it deemed to be lower 8
priority, particularly when in both the 2014 GRC and this case PG&E claims the work is 9
important and needs to be done.86 10
As discussed in D.11-05-018, PG&E’s deferrals also undermine the company’s efficiency 11
incentives and its accountability for efficient spending, which is also shown by the Gas 12
Distribution examples. PG&E cut back the Aldyl-A main replacement program and other 13
programs to make room for significantly increased spending for service replacements, based on a 14
new policy that was not reviewed in the 2014 GRC. As a result, consistent with the 15
Commission’s concerns in D.11-05-018, the need for, and efficiency of, that new service 16
replacement policy was not tested before the Commission. As Mr. Sugar explains, it turns out 17
that PG&E’s new policy is not at all cost-effective because the policy results in costly 18
replacement of services when in the majority of cases a much less expensive tee cap repair will 19
85 Ex. PG&E-3, p. 1-16. 86 Of the three illustrative programs discussed above, in only the HPR program (MAT 2K) does PG&E claim that it found the program to be less important from a safety perspective. However, as shown above, that assessment was based on risk scoring for only one year, 2013. In the two succeeding years, PG&E found the risks to be higher than it estimated in 2013. The fact that PG&E did not ramp up the program again after its 2014 score significantly raised the risk assessment calls into question how responsive PG&E’s funding decisions were to its risk assessments for this program.

26
fully address the problem.87 Furthermore, as noted above, the 2014 GRC decision directed 1
PG&E to replace even more plastic main than PG&E had proposed, precisely to achieve more 2
safety mitigation with the allocated funds, a goal PG&E frustrated by severely cutting back the 3
program. 4
In this regard, it is troubling that PG&E attempts to justify its curtailment of work in part 5
based on cost increases above unit costs that were forecast and adopted in the 2014 GRC. For 6
example, PG&E states that higher than forecast unit costs for replacing main is one of the 7
reasons for curtailing Aldyl-A main replacement.88 And it appears that PG&E’s inability to 8
control cost increases was a factor in curtailing the HPR program. The 2014 forecast and 9
adopted HPR unit cost was $51.50,89 but PG&E now forecasts 2017 unit costs at $110.90 PG&E 10
says that its earlier HPR work dealt with easy lower cost solutions and future work will be more 11
difficult and more costly.91 But the 2014 adopted unit cost was to address all remaining HPRs, 12
presumably in all types of locations, so PG&E seems to be trying to spread out the work – 13
rationing the work based on timing of rate cases (to use the phrase from D.14-08-032) -- to 14
obtain higher unit costs from ratepayers than PG&E would if it simply performed the work it was 15
requested and funded to do. 16
A practice of curtailing supposedly lower priority work if authorized work comes in over 17
budget undermines the efficiency incentives that the rate case process is supposed to create. If 18
allowed with impunity, the result of such a practice would be to effectively allow the utility to do 19
87 Testimony of John Sugar, Section I. 88 Ex. PG&E-3, p. 4-22. 89 GDPSR, 2014-2, Table 10-1, p. 68. 90 Ex. PG&E-3, p. WP 5-26. 91 Ex. PG&E-3, p. 5-17.

27
less work for the authorized funding level, which saps the utility’s incentive to control costs. As 1
the Commission has explained: 2
We know in prospective year ratemaking that our adopted estimates of 3 revenues and expenses may be at variance with actual hindsight 4 experience. But we do not view this as a problem, because we are 5 extending to utility management an opportunity and incentive to find 6 ways to conduct operations for less than projected. When it can do this it 7 flows the benefit to the utility’s bottom line, which means profit. . . . 8 Keeping this incentive for utility management is the cornerstone of 9 ratemaking . . .. If ratemaking ever becomes so conceptually upside 10 down that utility management loses the economic incentive to exercise 11 its business acumen, California will be in a sad posture and will suffer 12 under utility management which is lethargic with a ‘cost plus’ 13 mentality.92 14
15 When costs between rate cases come in higher than forecast and adopted, the Commission 16
expects utilities to “respond to cost increases in some areas by striving harder to achieve savings 17
elsewhere,”93 not to put off the work until the next case and hope to be awarded more funding, at 18
a higher unit cost to do the same work the utility was already funded to perform. 19
20 D. Ratemaking Adjustments or Forecast Reductions Are Warranted for Work 21
Deferred As a Result of Unnecessary or Unreasonable Reprioritization 22 23
When the Commission finds that a utility has unreasonably deferred work and seeks in a 24
subsequent rate case to have ratepayers fund the work a second time, the Commission has not 25
hesitated to protect ratepayers by reducing the utility’s forecast to prevent double recovery. 26
A typical approach is to order a ratemaking adjustment (in an appropriate amount under 27
the facts of the case) that makes shareholders responsible for the deferred work, while making 28
clear that the Commission still expects the deferred work to be performed. For example, in 29
D.14-08-032, the Commission found that part of PG&E’s requested pole inspection forecast was 30
92 D.96-12-066, slip op., pp. 4-5, quoting D.85-03-042, 17 CPUC 2d 246, 254. 93 D.96-12-066, slip. op., p. 5.
28
made necessary by PG&E’s past failure to spend authorized funds for this work. The 1
Commission stated: 2
We conclude that timely completion of this level of inspections is 3 appropriate from an operations perspective to promote safe and reliable 4 service. For ratemaking purposes, however, we conclude that the portion 5 of 2014 forecast expense for pole inspections that exceeds the 235,000 6 pole amount constitutes deferred maintenance that should be paid for out 7 of shareholder retained earnings.94 8
9 As indicated by this example, this approach is appropriate when the Commission believes that 10
the deferred work is necessary for safe and reliable service. 11
An alternative approach is for the Commission to treat the past curtailment of work based 12
on reprioritization as an indication that the utility has failed to justify its forecast, warranting a 13
forecast reduction. Effectively, the utility’s deferral of previously authorized work undermines 14
the utility’s credibility when it requests funding the same work in the next rate case. Reducing 15
the forecast (by the appropriate amount under the facts of the case) prevents ratepayers from 16
having to pay for the work a second time.95 17
18 E. TURN’s Recommendations Regarding Deferred Gas Distribution Work 19
20 This section presents TURN’s recommendations regarding the three examples of deferred 21
Gas Distribution work discussed above. 22
Aldyl A Pipe – MAT 14D 23
As noted above, PG&E was funded to replace 139 miles per year in 2014-2016, for a 24
total of 417 miles. In 2014 and 2015, PG&E actually only replaced 95 miles,96 and, in 2016, 25
94 D.14-08-032, p. 189. 95 TURN’s recommended forecast reduction for Atmospheric Corrosion Mitigation (MWC FH) in Mr. Sugar’s accompanying testimony (Section IV.A) uses this approach in response to PG&E’s request for ratepayers to pay a second time for work that PG&E previously decided was not important enough to perform. 96 2014: Ex. PG&E-3, p. 4-22. 2015: GDPSR, 2015-2, p. 56
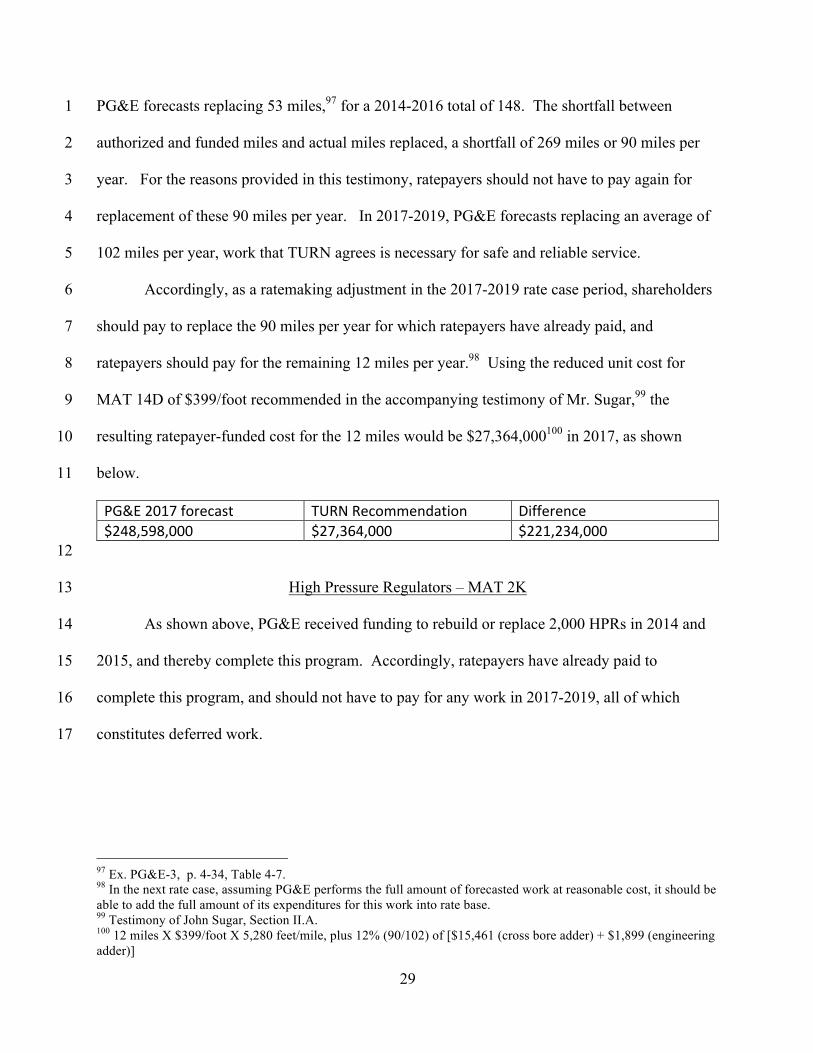
29
PG&E forecasts replacing 53 miles,97 for a 2014-2016 total of 148. The shortfall between 1
authorized and funded miles and actual miles replaced, a shortfall of 269 miles or 90 miles per 2
year. For the reasons provided in this testimony, ratepayers should not have to pay again for 3
replacement of these 90 miles per year. In 2017-2019, PG&E forecasts replacing an average of 4
102 miles per year, work that TURN agrees is necessary for safe and reliable service. 5
Accordingly, as a ratemaking adjustment in the 2017-2019 rate case period, shareholders 6
should pay to replace the 90 miles per year for which ratepayers have already paid, and 7
ratepayers should pay for the remaining 12 miles per year.98 Using the reduced unit cost for 8
MAT 14D of $399/foot recommended in the accompanying testimony of Mr. Sugar,99 the 9
resulting ratepayer-funded cost for the 12 miles would be $27,364,000100 in 2017, as shown 10
below. 11
PG&E2017forecast TURNRecommendation Difference$248,598,000 $27,364,000 $221,234,000
12
High Pressure Regulators – MAT 2K 13
As shown above, PG&E received funding to rebuild or replace 2,000 HPRs in 2014 and 14
2015, and thereby complete this program. Accordingly, ratepayers have already paid to 15
complete this program, and should not have to pay for any work in 2017-2019, all of which 16
constitutes deferred work. 17
97 Ex. PG&E-3, p. 4-34, Table 4-7. 98 In the next rate case, assuming PG&E performs the full amount of forecasted work at reasonable cost, it should be able to add the full amount of its expenditures for this work into rate base. 99 Testimony of John Sugar, Section II.A. 100 12 miles X $399/foot X 5,280 feet/mile, plus 12% (90/102) of [$15,461 (cross bore adder) + $1,899 (engineering adder)]

30
The same outcome results when one considers the shortfall of work that ratepayers have 1
already funded, but PG&E did not perform. PG&E only addressed 830 units in 2014-2016,101 2
a shortfall of 1,170, or 390 per year over the 2017-2019 period. PG&E forecasts rebuilding or 3
replacing 375 units in 2017, which is less than the amount of deferred work that ratepayers have 4
already funded. 5
Accordingly, as a ratemaking adjustment in the 2017-2019 rate case period, shareholders 6
should pay to replace the full forecast amount of work, for which ratepayers have already paid.102 7
PG&E2017forecast TURNRecommendation Difference$41,123,000 $0 $41,123,000
8
Valves – MAT 50E 9
PG&E was funded to replace and install 528 valves per year, a total of 1,584 from 2014-10
2016. PG&E only addressed 164 valves in 2014 and 2015 and forecasts addressing another 169 11
in 2016,103 for a total of 333 valves. This yields a shortfall of 1,251 valves, or 417 per year that 12
PG&E will be making up in 2017-2019 period. PG&E forecasts replacing and installing 343 13
valves per year,104 which is less than ratepayers have already funded. Ratepayers should not 14
have to pay again for this work in the 2017-2019 rate case period. 15
Accordingly, as a ratemaking adjustment in the 2017-2019 rate case period, shareholders 16
should pay to replace the full forecast amount of work, for which ratepayers have already paid.105 17
PG&E2017forecast TURNRecommendation Difference$15,679,000 $0 $15,679,000
101 410 units in 2014, 120 units in 2015, and 300 units forecast for 2016. 102 In the next rate case, assuming PG&E performs the full amount of forecasted work at reasonable cost, it should be able to add the full amount of its expenditures for this work into rate base. 103 Accepting this 2016 forecast is generous to PG&E in light of how much PG&E fell short of its 2015 forecast. 104 Ex. PG&E-3, p. 4-39. 105 In the next rate case, assuming PG&E performs the full amount of forecasted work at reasonable cost, it should be able to add the full amount of its expenditures for this work into rate base.

31
IV. GAS DISTRIBUTION RECORDKEEPING 1
A. Scoping Ruling and PG&E’s Supplemental Testimony 2 3
In the December 1, 2015 Scoping Ruling in this case, the Commission directed PG&E to 4
provide supplemental testimony that, with respect to Gas Distribution recordkeeping, required 5
PG&E to identify each project or program in this GRC and the 2014 GRC – and the associated 6
costs – that, in whole or in part, include among their purposes correction of inaccurate records, 7
supplying missing as-built information, assessing the accuracy of records of maximum allowable 8
operating pressure, or making inaccessible records accessible. For any such costs that affect the 9
revenue requirement requested in this case and that PG&E has not removed from its request, the 10
Ruling directed PG&E to explain why this outcome is just and reasonable. 11
PG&E submitted its supplemental testimony on January 22, 2016. In summary, the 12
supplemental testimony identified only four expense projects, with 2017 forecast expense 13
amounts totaling $3.4 million, that meet the Scoping Ruling’s criteria.106 In PG&E’s view, no 14
capital programs or projects met the criteria. 15
Chapter 3 of the supplemental testimony includes a discussion of the Pathfinder project, 16
which PG&E’s 2014 GRC testimony described as “a project to convert key gas distribution asset 17
and maintenance information from existing legacy and paper-based systems to the SAP and GIS 18
systems.”107 PG&E recorded $17.5 million in capital expenditures to this project in 2014108 and 19
forecast an additional $16.7 million in 2015.109 The supplemental testimony asserts that 20
Pathfinder did not meet any of the Scoping Ruling’s criteria, but included it in a list of projects 21
106 Ex. PG&E-17, pp. 1-7 to 1-8. In the relevant chapters, PG&E takes the position that it is reasonable for these amounts to be included in revenue requirement. See Chapters 2 and 4. 107 2014 GRC, Ex. PG&E-3, p. 11-12. PG&E says Pathfinder was completed in 2015. Ex. PG&E-3, p. 9-15. 108 Ex. PG&E-17, p. 3-7, Table 3-6. 109 Ex. PG&E-17, p. 3-6, Table 3-5, showing forecast from the 2014 GRC. At the time of preparing this testimony, TURN did not have the 2015 recorded spending for this project, but will update this testimony when it obtains that figure.

32
that, while not related to making inaccessible records accessible, were designed to improve the 1
accessibility of records.110 PG&E claims that correcting inaccurate was not one of the purposes 2
of Pathfinder, although “enhancing” or “correcting” the mapping data in GIS “was a small 3
portion of the functionality” of Pathfinder.111 4
B. PG&E’s Supplemental Testimony Is Inconsistent With PG&E’s Response in 5 the Distribution Recordkeeping Investigation and Information Provided in 6 PG&E Reports to the Commission 7
8 On November 20, 2014, the Commission issued OII 14-11-008 to review and determine 9
whether PG&E’s recordkeeping practices for its gas distribution system have been unsafe and in 10
violation of the law. The OII responded to six separate incidents between 2010 to 2014 creating 11
significant threats to employee and public safety. As detailed in accompanying SED 12
investigative reports, each incident resulted in the release of natural gas into the atmosphere, 13
some resulted in evacuations and service outages, and one caused an explosion that destroyed a 14
house in Carmel.112 A key cause of each of the incident was erroneous or incomplete PG&E 15
records that caused PG&E employees to be unaware of the true location or features of PG&E 16
facilities.113 The OII ordered PG&E to show cause why it should not be found to have engaged 17
in unsafe practices in violation of various laws and subjected to significant penalties. It also 18
ordered PG&E to submit a report that explained, among other things, what corrective actions 19
PG&E had already taken in response to the recordkeeping failures identified in the SED 20
investigation reports.114 21
110 Ex. PG&E-17, pp. 3-4 to 3-5. 111 Ex. PG&E-17, p. 3-11. 112 OII 14-11-008, pp. 2-7. 113 Id. 114 Id., p. 9.

33
PG&E’s December 22, 2014 Report in response to the OII, attached in full to this 1
testimony, includes a 12-page section bearing the heading: “PG&E Has Made Substantial 2
Efforts to Enhance Its Gas Distribution Recordkeeping with the Goal of Minimizing Future 3
Events Similar to the Identified Incidents.”115 One of the subheadings in that section is 4
“Accuracy Improvements.”116 That subsection begins: “PG&E has undertaken substantial efforts 5
to improve the accuracy of its gas distribution asset data so that PG&E’s asset management 6
systems incorporate the best and most complete available information.”117 Under a subsequent 7
heading, “The Gas Distribution GIS Makes Asset Information More Accurate and Accessible,” 8
PG&E highlighted the Pathfinder project: 9
PG&E is currently implementing a gas distribution geographic 10 information system (‘GD GIS’) as part of its multi-year, multi-million 11 dollar Pathfinder project, which is a foundational effort to make the 12 information that PG&E collects, stores, and manages in relation to its gas 13 distribution pipeline system and its related business processes more 14 accurate, complete, and accessible.118 15
16
Thus, according to PG&E’s OII response, Pathfinder was a “foundational effort” to 17
increase the accuracy, completeness, and accessibility of PG&E’s records and a key 18
demonstration of PG&E’s “substantial efforts” to improve the accuracy of its records. It would 19
appear that, when PG&E was trying to avoid significant penalties, PG&E was willing to admit 20
what it denies here – that an important purpose of the Pathfinder project was to enable the 21
correction of inaccurate and incomplete records of the type that caused the incidents on which 22
the OII was based. 23
115 PG&E’s Initial Report in Response to OII, I.14-11-008, December 22, 2014, p. 5. 116 Id., p. 6. 117 Id. (emphasis added). 118 Id. (emphasis added).

34
PG&E’s GDPSRs provide further evidence that the GD GIS implemented via Pathfinder 1
has served the purpose of improving the accuracy of PG&E’s records, as described in PG&E’s 2
OII response. 3
In the GDPSRs, PG&E is required, in each six-month reporting period, to “identify and 4
explain any discrepancies found with pipeline records and report if no records exist.” PG&E 5
describes the list it provides in response to this requirement as including: “when active facilities 6
are not mapped; the facilities are on the map but not in the field; or when other inaccuracies are 7
found in PG&E’s maps.”119 PG&E has reported huge numbers of discrepancies in these reports. 8
For example, PG&E listed 345 specific discrepancies in 2014-1,120 390 in 2014-2,121 510 in 9
2015-1,122 and 2,611 in 2015-2.123 In these reports, many of the listed discrepancies are for such 10
potentially dangerous situations as “Facilities in field not on map,” and other include equally 11
dangerous problems such as “Facilities shown in wrong location” and “Wrong size/type of 12
equipment.” 13
In the 2015-2 report, PG&E explains the dramatic increase in the number of reported 14
discrepancies because of a changed method that provides a “more accurate volume and analysis 15
of completed mapping corrections,”124 suggesting previous reports may not even have captured 16
all discrepancies. PG&E attributed this improved method to using data from the GIS and SAP 17
systems that were developed in the Pathfinder project.125 18
These reports show that PG&E’s efforts to improve the accuracy of its records described 19
in its OII response, including the Pathfinder project, were clearly necessary and have found a 20
119 See, e.g., GDPSR, 2014-1, p. 53. 120 Id., Table 13b-1. 121 GDPSR, 2015-1, p. 84, Supplemental Table 13B-1. 122 Id., p. 72, Table 13B-1. 123 GDPSR, 2015-2, p. 67, Table 13B-1. 124 Id., p. 66. 125 Id..

35
very large number of problems with PG&E’s records, many of which, if not corrected, would put 1
employee and public safety at risk. 2
C. TURN’s Recommended Disallowance 3 4
Contrary to PG&E’s assertions in its supplemental testimony, the Pathfinder project was 5
clearly a key effort by PG&E to remedy its past mismanagement of its gas distribution records – 6
mismanagement that put employee and public safety at risk. As the Commission has repeatedly 7
held, ratepayers should not be required to pay the costs that are necessary to remedy a utility’s 8
imprudence. 9
Recognizing that improving the accuracy of PG&E’s troubled records was probably not 10
the sole purpose of the Pathfinder project, TURN recommends that 50% of PG&E’s 2014 and 11
2015 capital spending be disallowed, as follows. 12
2014 2015126Expenditures $17,530,000 $16,690,00050%Disallowance ($8,765,000) ($8,345,000)
13
This concludes my testimony. 14
126 As previously noted, the 2015 expenditures shown are based on PG&E’s 2014 GRC forecast. TURN will update its recommendation based on 2015 recorded spending once it obtains that information.
36
Appendix A
STATEMENT OF QUALIFICATIONS OF THOMAS J. LONG
Mr. Long is TURN’s Legal Director. He has practiced before, or been employed by, the
California Public Utilities Commission for almost 30 years and, in that period, has been
involved, as an advocate or Commissioner advisor, in numerous important CPUC proceedings in
the energy and telecommunications sectors. Since rejoining TURN in September 2011, Mr.
Long has served as TURN’s lead attorney in several Commission proceedings relating to gas
pipeline safety, including PG&E’s 2015 Gas Transmission and Storage application (A.13-12-
012), PG&E’s Pipeline Safety Enhancement Plan (“PSEP”) proceeding (R.11-02-019), the
Sempra Utilities PSEP proceeding (A.11-11-002), and the enforcement proceedings against
PG&E relating to the San Bruno explosion and its causes (I.12-01-007), PG&E’s recordkeeping
problems (I.11-02-016), and alleged class location violations by PG&E (I.11-11-009). In
addition, he has led TURN’s efforts in the phase of the Rate Case Plan rulemaking (R.13-11-
006) devoted to integrating risk analysis into general rate cases (“GRCs”), including speaking on
two panels in multi-day workshops relating to integrating risk assessment and mitigation models
into the GRC process. This phase culminated in Decision (D.) 14-12-025. Currently, he
represents TURN in the Safety Model Assessment Proceeding (“S-MAP”) (A.15-05-002 et al.),
actively participating in five workshops, the Risk Lexicon Working Group, and the Metrics and
Reporting Working Group.
Other energy cases in which Mr. Long has participated include the Diablo Canyon
prudence review, PG&E’s Cornerstone application, the Commission’s investigation into the
2003 PG&E Mission Substation fire, the Community Choice Aggregation (“CCA”) rulemaking,

37
PG&E’s 2011 and 2014 general rate cases, the 2012 Sempra general rate case, and Southern
California Edison’s 2011 rate design proceeding.
Prior to re-joining TURN as its Legal Director in September 2011, he served as a Deputy
City Attorney for the City and County of San Francisco (“CCSF”) for over six years. There,
among other duties, he represented CCSF in proceedings before the CPUC and advised the
City’s Public Utilities Commission on its efforts to implement a CCA program. From 2001
through 2004, he served as a policy and legal advisor to CPUC President/Commissioner Loretta
Lynch. Before that, he was TURN’s Senior Telecommunications Attorney from 1990 through
2000. Mr. Long began his legal career as a Litigation Attorney for the law firm of Morrison &
Foerster from 1986 to 1989, after serving as Law Clerk to United States District Court Judge
Rudi M. Brewster.
Mr. Long earned his B.A. with High Honors in Economics and Political Science from
Swarthmore College and his J.D. cum laude from New York University School of Law.