
PREPARED FOR Metropolitan Planning Authority · Final Report October 2014 Retail and Economic...
87
Retail and Economic Assessment for PSP74 and PSP75 (Sunbury Township) PREPARED FOR Metropolitan Planning Authority Final Report October 2014 Hill PDA
Transcript of PREPARED FOR Metropolitan Planning Authority · Final Report October 2014 Retail and Economic...

Retail and Economic Assessment for PSP74 and PSP75 (Sunbury Township)
PREPARED FOR
Metropolitan Planning Authority
Final Report October 2014
Hill PDA

ABN 52 003 963 755
Sydney
Level 3, 234 George Street
Sydney NSW 2000
GPO Box 2748 Sydney NSW 2001
t. +61 2 9252 8777
f. +61 2 9252 6077
Melbourne
Suite 114, 838 Collins Street
Docklands VIC 3008
GPO Box 3424 Melbourne VIC 3001
t. +61 3 9629 1842
f. +61 3 9629 6315
www.hillpda.com
Liability limited by a scheme approved under the Professional Standards Legislation
Cover Page Map by MPA (as modified)
Retail and Economic Assessment PSP74 and PSP75
M14037 P a g e 3 | 87
CONTENTS
1. INTRODUCTION ............................................................................................................... 5
1.1 Background .................................................................................................................... 5
1.2 Purpose ......................................................................................................................... 5
1.3 Interpretation and Qualifications .................................................................................... 6
1.4 Report Structure............................................................................................................. 7
2. STUDY AREA CONTEXT................................................................................................... 8
2.1 Study Area ..................................................................................................................... 8
2.2 Development Cells ......................................................................................................... 9
3. POLICY AND STRATEGY BASE ....................................................................................... 12
3.1 Sunbury / Diggers Rest Growth Corridor Plan ............................................................. 12
3.2 Plan Melbourne, Metropolitan Planning Strategy ......................................................... 13
3.3 Hume Local Planning Policy Framework ..................................................................... 14
3.4 Sunbury HIGAP Spatial Strategy ................................................................................. 15
3.5 Diggers Rest Precinct Structure Plan........................................................................... 17
3.6 Other Research............................................................................................................ 18
3.7 Development Controls ................................................................................................. 19
4. ECONOMIC AND SOCIAL CONTEXT ................................................................................. 21
4.1 Socio- Demographic Profile and Trends ...................................................................... 22
4.2 Households and Dwellings ........................................................................................... 24
4.3 Resident Employment Profile ....................................................................................... 27
4.4 Economic Structure ...................................................................................................... 30
4.5 Sunbury Containment Metrics ...................................................................................... 32
5. LAND USE AND FLOORSPACE CONTEXT ........................................................................ 34
5.1 Activity Centres ............................................................................................................ 34
5.2 Industrial Land Supply ................................................................................................. 36
5.3 Proposed Developments .............................................................................................. 38
6. FUTURE ECONOMIC CONDITIONS ................................................................................... 39
6.1 Method ......................................................................................................................... 39
6.2 Existing Conditions ...................................................................................................... 39
6.3 Full Development Capacity Estimate ........................................................................... 40
6.4 Potential Stages ........................................................................................................... 42
6.5 Retail Hierarchy and Floorspace .................................................................................. 43
6.6 Office and Community Facility Floorspace................................................................... 46
6.7 Showroom Uses ........................................................................................................... 47
6.8 Industrial Land Needs .................................................................................................. 48
6.9 Other Activities ............................................................................................................. 51
7. POTENTIAL ECONOMIC PLAN ........................................................................................ 52
8. DESCRIBING THE ELEMENTS AND ISSUES ....................................................................... 57
8.1 Economic Plan Elements ............................................................................................. 57
8.2 Location and Design Issues ......................................................................................... 65

Retail and Economic Assessment PSP74 and PSP75
M14037 P a g e 4 | 87
9. SUNBURY SOUTH PSP ................................................................................................. 69
10. LANCEFIELD ROAD PSP ............................................................................................... 72
11. CONCLUSION ............................................................................................................... 75
12. IMPLEMENTATION ......................................................................................................... 77
APPENDICES .......................................................................................................................... 78
Appendix 1 - Study Area Images............................................................................................. 78
Appendix 2 – Greater Sunbury Retail Thresholds Model ........................................................ 83
Appendix 3 – Selected Ratios ................................................................................................. 86

Retail and Economic Assessment PSP74 and PSP75
M14037 P a g e 5 | 87
1. INTRODUCTION
1.1 BACKGROUND
Sunbury is planned to be expanded over time in line with the state government’s Growth Corridor Plan and
reflecting Hume City Council’s aspirations expressed in the HIGAP strategy. The township is expected to
grow to around 120,000 residents in the future.
Key objectives of planning strategies for Sunbury include:
Establish a high level of self-containment in the town over time, with respect to jobs and services;
and
Establish a clear hierarchy of activity anchored by the Sunbury Town Centre as the primary centre in
the region.
Achievement of these objectives will require the delivery of a range of retail, commercial, community and
industrial activities to provide a mix of integrated activities, services and jobs. The future would provide
residents with a diverse and deep pool of jobs and services in the local area.
The two PSPs that are being developed form a package of five PSPs for Sunbury. The current PSPs 74 and
75 will release a significant amount of land for development, estimated to be 850 hectares in the south and
700 hectares in the east, potentially yielding over 45,000 additional residents subject to ultimate land yield,
dwelling mix and household composition. The southern precinct is especially strategic from an economic
perspective given its location along Sunbury Road and its planned future connection with the proposed Outer
Metropolitan Ring Road.
1.2 PURPOSE
The purpose of the project as nominated in the project brief is as follows:
Establish the required retail floor space and employment floor space potential within the two PSPs
and provide advice on any implications for surrounding, planned or existing town centres.
Recommend the preferred location for retail centre/s and other job creating land uses; and any
locationally responsive design and siting requirements for new centres (particularly having regard for
future transport infrastructure).
Recommend the floorspace required for local convenience, local and major town centres.
Identify the types of retail and commercial (office) uses that would be accommodated in the town
centres (including the proposed Commercial-Residential mixed use precinct on Vineyard Road in
Sunbury South).
Recommended land areas for employment uses by broad classification types.

Retail and Economic Assessment PSP74 and PSP75
M14037 P a g e 6 | 87
This report builds on previous work undertaken for the study area which includes the Growth Areas Authority
Growth Corridor Plan and Hume City Council’s Sunbury HIGAP strategy.
1.3 INTERPRETATION AND QUALIFICATIONS
The economic guidance shown in this report is indicative with respect to size and location of land uses in the
PSP areas. Information for activities outside of the PSP areas is shown to frame the recommendations for the
PSP areas and is not intended as detailed planning guidance for those areas.
Other specific qualifications are noted below.
Retail and Other Floorspace and Site Area Data – The information shown in this report provides a
guide to future possibilities to inform planning strategies and decisions – as opposed to being a
definitive and final assessment. The information provides an order of magnitude guide based on
information known at the time or report preparation. In reality some centres may be bigger and
some smaller than shown. The detail of such variations is contingent of the final outcome of local
area catchment characteristics including population yields and road networks. More detailed
analysis should be undertaken for each potential centre as more information becomes available in
the planning process.
Community Infrastructure Assessment - This report does not provide a comprehensive assessment
of community infrastructure needs in the PSP areas. Community infrastructure is assessed at a
broad level to identify potential land and job implications for centres. It is understood the
Metropolitan Planning Authority will undertake a separate and more detailed assessment of
community infrastructure as part of the planning process. This work will include scoping of a
proposed major health and tertiary education precinct in Greater Sunbury, which is not assessed in
detail in this report.
Possible Changes - Matters that may impact on the directions of this report include refined
information on development cells, population yields, infrastructure connections and retail and other
business development trends.
Business Trends – This report takes into account how retail and other businesses are configured in
terms of property and land space at the current time and applies this information to future conditions.
This however may change in the future and if so revision to the analysis would be required.
Best Estimate and Target Scenarios - Two guidance scenarios are shown in this report. One is a
best estimate, which reflects possible conditions at full development based on ratios and estimates
as shown in this report. The other is a target scenario which provides a guide to the additional non-
retail uses that would be required above base conditions to achieve a 1 job per household outcome.
This is an aspirational scenario which is provided to inform the planning process.
Areas Outside of the PSP Areas - This report is focused on PSP areas 75 and 75 but also includes
an indicative assessment of all areas within Greater Sunbury for the purposes of guiding the PSP
planning areas only. Separate planning and evaluation processes are needed to determine and
confirm possible changes in existing and other areas of Greater Sunbury.
Retail and Economic Assessment PSP74 and PSP75
M14037 P a g e 7 | 87
Proposed Locations for Centres and Employment Land Uses - The identified locations for centres
and employment land uses shown in the report are indicative only. This report shows recommended
role of centres and activities but specific size and location details is intended to be determined in
more detailed processes that consider road networks, other infrastructure connections, topography
and terrain, land ownership and other relevant matters. These matters must be holistically
considered having regard to the recommendations of this report before decisions are made.
1.4 REPORT STRUCTURE
This report is structured as follows:
Section 2 - Study Area Context – This section provides an introduction to the study area location
context.
Section 3 – Policy and Strategy Base - This section provides a summary of the policy, strategy and
research base relevant to the area.
Section 4 - Economic and Social Context – This section provides an overview of existing economic
and social conditions in the study area and identifies potential future job needs in the area as it
develops over time.
Section 5 - Land Use and Floorspace Context – This section profiles existing economic land uses
and the hierarchy of activities in the study area and profiles the PSP growth areas from an economic
planning perspective.
Section 6 - Future Economic Conditions – This section documents the modelling and assumptions
used in the analysis.
Section 7 – Potential Economic Plan – This section identifies the broad options for the study area
having regarding to a best estimate scenario and a high growth target scenario.
Section 8 – Describing the Elements and Issues – This section describes elements of the economic
plan and discusses land take, location and design issues.
Section 9 - Sunbury South PSP – This section identifies a preferred economic structure for the
Sunbury South PSP area.
Section 10 - Lancefield Road PSP – This section identifies a preferred economic structure for the
Lancefield Road PSP area.
Section 11 Conclusions – This section documents the conclusions of the report.
Section 12 – Implementation – The PSP implementation considerations that relate to this report are
summarised in this section.

Retail and Economic Assessment PSP74 and PSP75
M14037 P a g e 8 | 87
2. STUDY AREA CONTEXT
2.1 STUDY AREA
This report is focused on two growth areas knows as Sunbury South PSP 74 and Lancefield Road PSP 75 as
shown in Figure 1 below
Sunbury South has a gross area of 1,822 hectares (ha) and has very good road connections to Melbourne
and the Sunbury Town Centre via Sunbury Road (which connects to the Tullamarine Freeway and Town
Centre) and the Vineyard Road to Calder Freeway connection. The Sunbury Rail Line (which has electric
suburban services to the Sunbury Town Centre) cuts through the western portion of the area.
Lancefield Road has a gross area of 1,109ha and is located on the Lancefield Road corridor to the north-east
and includes the country rail line (V-Line services beyond the Sunbury Town Centre). East-west road
connections from this area to the Town Centre are limited at present.
Figure 1 - Study Area
Source: Metropolitan Planning Authority (2013)
Both precincts are predominantly rural in nature. Low density rural residential uses are located in parts of the
area and extractive industries are located in Sunbury South east of Sunbury Road..

Retail and Economic Assessment PSP74 and PSP75
M14037 P a g e 9 | 87
The project brief identifies key features relevant to the future planning and development of the two PSP areas
as follows:
Jacksons Creek and Emu Creek corridors (in both PSPs) and tributaries, notably Harpers Creek , will
shape development patterns;
Redstone Hill in Sunbury South and other areas have steep slopes;
An extractive industry operation is located in Sunbury South; and
Sunbury Sewerage Treatment Plant is located immediately outside of Sunbury South and may have
an impact on development within that precinct.
Appendix 1 provides a sample of study area images that show the landscape that will be developed.
2.2 DEVELOPMENT CELLS
For the purpose of this project, the two PSP areas and the broader urban region (called Greater Sunbury)
have been divided into development cells for assessment purposes. Many of the future economic activities
that will be generated in the area will be population driven and as such small area population assessment is
required.
The two PSP areas are divided into three areas each and other areas are defined based on planning
boundaries and natural catchments as follows:
Sunbury South (SS) 1
Sunbury South (SS) 2
Sunbury South (SS) 3
Lancefield Road (LR) 1
Lancefield Road (LR) 2
Lancefield Road (LR) 3
Sunbury Township
Diggers Rest
Sunbury West
Sunbury North

Retail and Economic Assessment PSP74 and PSP75
M14037 P a g e 10 | 87
Figure 2 - Selected Development Cells in Greater Sunbury

Retail and Economic Assessment PSP74 and PSP75
M14037 P a g e 11 | 87
Figure 3 - Existing Zoning of Selected Development Cells in Greater Sunbury

Retail and Economic Assessment PSP74 and PSP75
M14037 P a g e 12 | 87
3. POLICY AND STRATEGY BASE
3.1 SUNBURY / DIGGERS REST GROWTH CORRIDOR PLAN
The Sunbury / Diggers Rest Growth Corridor Plan sets out the broad planning framework for Greater Sunbury.
Key features of the plan are:
Reinforcement of Sunbury Town Centre as the Principal Activity Centre in the region;
Provision of a future Major Town Centre in Sunbury South on the west side of Sunbury Road;
Provision of a future mixed business / residential precinct in Sunbury South between Vineyard Road
and the rail line (nominally 110ha for TODs, office and business services);
Provision of a new industrial precinct in Sunbury South on the east side of Sunbury Road (100ha
gross industrial land);
Future road connections in the north and south of Sunbury, including road creek crossings and a
potential long term Emu Creek crossing connection near Gellies Road to connect areas; and
Two potential future railway stations are identified in concept plans, one in the Lancefield Road PSP
and one in the Sunbury South PSP.
See Figure 4 below for a spatial representation of these concepts.
The Growth Corridor Plan emphasises the desire to improve the range of local jobs and services in the area
whilst strengthening the role of Sunbury Town Centre. The Town Centre will be supported by a new
distribution of sub-regional and local scale services within the township featured by a new Major Town Centre
on Sunbury Road.
The Growth Corridor Plan indicates that Sunbury / Diggers Rest has the capacity to provide between 10,000
and 15,000 new jobs when it is fully developed.
The preservation of the semi-rural and natural setting of the township is a key planning direction.

Retail and Economic Assessment PSP74 and PSP75
M14037 P a g e 13 | 87
Figure 4 - Sunbury / Diggers Rest Growth Corridor Plan
Source: Growth Areas Authority (2012) Growth Corridor Plans: Managing Melbourne’s Growth
3.2 PLAN MELBOURNE, METROPOLITAN PLANNING STRATEGY
The Metropolitan Planning Strategy (Plan Melbourne) was released in 2014. Plan Melbourne will guide the
city’s growth to 2050 with strategies nominated to house, employ, and move more people around the
metropolitan area and beyond.
The strategy sets in place a Metropolitan Structure Plan that is defined by a range of economic principles and
activities which includes activity centres, transport links and gateways and industrial / employment areas.
Sunbury is nominated to accommodate activity centres. The purpose of such centres is “to provide access to
a wide range of goods and services in centres that are planned and managed by local government. The
centres will have jobs and vibrant local economies. Some will serve larger subregional catchments.”
A concept that is introduced in Plan Melbourne is the vision of 20-minute neighbourhoods. The 20-minute
neighbourhood is about having access to a range of local services and facilities ideally within 20 minutes of
home.
Melbourne Airport is nominated as a key transport and employment hub in the northern region. This strategic
asset will be protected from incompatible land uses but adjacent complementary uses will be encouraged.

Retail and Economic Assessment PSP74 and PSP75
M14037 P a g e 14 | 87
The northern and western regions of Melbourne have significant industrial land stocks and these will be
protected and expanded for further economic development and employment growth.
A major element of Plan Melbourne and other strategic work being undertaken by state agencies is the
planned future development of the Outer Metropolitan Ring Road (OMR). The alignment for that link is south
of Sunbury and north of Melbourne Airport. Construction of that link would significantly enhance accessibility
to and from Sunbury to other economic and urban areas and is likely to accelerate development in the
township.
3.3 HUME LOCAL PLANNING POLICY FRAMEWORK
The Local Planning Policy Framework (LPPF) acknowledges that Hume City Council has a strong employment
base which is largely based on industry and Melbourne Airport related activity.
Sunbury, Broadmeadows, Gladstone Park and Roxburgh Park are recognised as major centres of the
municipality and Council is committed to supporting further development of these centres.
An objective of the LPPF is to ensure that the future growth of Sunbury is contained within the confines of the
Jackson Creek Valley and that the identity of the town’s rural and country style is retained. The strategies are
to consolidate and intensify land uses within designated urban areas, encourage orderly expansion of urban
development extending outwards from the Town Centre and through protection of Sunbury’s heritage and
wineries.
Other specific directions in relation to Sunbury are:
The Sunbury Town Centre is nominated as the primary retail and commercial centre in the Sunbury
Region and services predominantly a convenience shopping role. The objective of the Sunbury
Town Centre is to support the orderly growth and development and maintain the historic ‘rural town’
character.
Retain and enhance office, institutional, civic and community related activities along Macedon Street;
Retain land south of MacDougall Road (between Vineyard Road and the Railway line) for a future
employment area;
Develop a dense network of convenience based activity centres characterised by a large number of
neighbourhood activity centres (anchored by supermarkets) which serve new communities;
Ensure growth areas within the Sunbury and Hume Growth corridors are planned appropriately to
ensure retail is provided in a timely manner;
Encourage bulky goods and homemaker centres along Vineyard Road in Sunbury;
The neighbourhood shopping centres local policy indicates that neighbourhood centres typically
have 1,500sqm of floorspace and have defined catchments of up to 5,000 persons.

Retail and Economic Assessment PSP74 and PSP75
M14037 P a g e 15 | 87
3.4 SUNBURY HIGAP SPATIAL STRATEGY
The Hume Integrated Growth Area Plan (HIGAP) for Sunbury is a strategy which aims to manage growth over
the next 30 years. HIGAP for Sunbury states that the township has been identified by the state government for
major growth. It is forecast that the population will grow to over 100,000 persons. Relevant strategic objectives
for Sunbury are to:
Ensure Sunbury remains separate yet retains its rural feel whilst still being well connected to
Melbourne by high quality transport and technology networks;
Encourage use and development in surrounding non-urban areas that supports and complements
the urban area;
Increase the number and diversity of jobs within Sunbury; and
Intensify activity in the Town Centre and create new supporting activity centres.
Sunbury HIGAP stipulates that the Sunbury Town Centre will remain the Primary Activity Centre. It indicates
that the second largest centre in Sunbury will be the new Major Activity Centre (MAC) located on Sunbury
Road. A series of Neighbourhood Activity Centres (NAC) and Local Activity Centres (LAC) will also be
developed, primarily in the new development areas.
Other points of interest regarding activity centres in Sunbury include:
NACs are to be based around a large supermarket with a small range of uses like cafes, restaurants,
specialty food shops, real estate agents, small scale offices and medical facilities;
A multi-purpose community centre, primary school and active sporting facility will also be generally
located within or adjoining NACs;
Medium or higher density housing will also be developed in and on the edge of NACs, especially
those near train stations;
The largest of the NACs will be located in the north east of Sunbury adjacent to a future planned
train station. This will also be a favoured location for a future hospital and university / TAFE;
A bulky goods centre comprising 50,000sqm will be provided on the eastern side of Vineyard Road
near the Calder Freeway;
A future employment area is nominated for Sunbury South on the east side of Vineyard Road;
The former Victoria University site is nominated for higher education; and
Major new road connections are required for the overall urban area to be integrated.
Figure 5 shows Hume City Council’s growth strategy for Sunbury.

Retail and Economic Assessment PSP74 and PSP75
M14037 P a g e 16 | 87
Figure 5 - Hume City Council’s Preferred Future Spatial Structure for Sunbury
Source: Hume City Council (2012) Sunbury HIGAP Spatial Strategy

Retail and Economic Assessment PSP74 and PSP75
M14037 P a g e 17 | 87
3.5 DIGGERS REST PRECINCT STRUCTURE PLAN
The Diggers Rest Precinct Structure Plan (PSP) was prepared by the Growth Areas Authority in 2012. The
PSP will form the basis for the future development of the area over time.
The PSP estimates the area will accommodate approximately 11,970 residents at full development. The main
economic features of the PSP are:
A neighbourhood activity centre with up to 6,000sqm retail floorspace;
27.5ha of employment land in the south; and
Community facilities and a school.
Refer to Figure 6 below for details.
The planned activity centre (called Local Town Centre) must be located generally in accordance with the
location shown in Figure 6 below and comprise:
A maximum of one full line supermarket and supporting specialty stores;
Cafe, restaurant and take-away premises;
Commercial premises which could include such uses as office, medical, showroom, home office and
child care uses;
Mixed uses which may include home/office and the provision of retail, commercial and/or residential
use; and
Community facilities.

Retail and Economic Assessment PSP74 and PSP75
M14037 P a g e 18 | 87
Figure 6 - Diggers Rest Precinct Structure Plan
Source: Growth Areas Authority (2012) Diggers Rest Precinct Structre Plan
3.6 OTHER RESEARCH
Other research material was reviewed for this report including other economic reports prepared on behalf of
various agencies and stakeholders. This includes the Essential Economics Growth Corridor Plans Report
which was commissioned by the former Growth Areas Authority to provide advice on activity centre and
employment planning in the growth areas.
That report suggests that Melbourne’s North (Sunbury) may achieve the employment outcomes shown in
Table 1 below.
Sunbury Potential Employment Distribution Table 1 -
Type Low High
Activity Centre (25-30%) 5,500-6,500 9,000-10,500
Employment (40-45%) 9,000-10,000 14,000-16,000
Community (25-30%) 5,500-6,500 9,000-10,500
Total 22,000 35,000
Source: Essential Economics (2011) Growth Corridor Plans: Activity Centre and Employment Planning
The report indicates that Sunbury should be able to accommodate one or two Major Town Centres (MTC), and
a number of smaller Local Town Centres (LTC) with total floorspace expected to range between 120,000sqm
and 220,000sqm. The following Table 2 summarises the broad estimate of floorspace potential.

Retail and Economic Assessment PSP74 and PSP75
M14037 P a g e 19 | 87
Broad Estimate of Floorspace Provision in Sunbury (sqm) Table 2 -
Centre Type Low High
Retail Provision
PTC 0 0
MTC 55,000 110,000
LTC 28,000 42,000
Total 83,000 152,000
Non Retail Provision
PTC 0 0
MTC 25,000 50,000
LTC 12,000 18,000
Total 37,000 68,000
Total Commercial Space
PTC 0 0
MTC 80,000 160,000
LTC 40,000 60,000
Total 120,000 220,000
Source: Essential Economics (2011) Growth Corridor Plans: Activity Centre and Employment Planning
3.7 DEVELOPMENT CONTROLS
Planning zones in Victoria were reformed in 2013. This includes changes to commercial and industrial zones
and residential zones. The zone reforms aim to simplify requirements, allow a broader range of activities and
improve the range of zones to better manage growth.
For commercial and industrial zones, a key objective of the reform program was to enable greater investment
flexibility within selected zones. Of relevance to this study, the following Table 3 summarises the revised
commercial and industrial development controls.

Retail and Economic Assessment PSP74 and PSP75
M14037 P a g e 20 | 87
Summary of Commercial and Industrial Zones Table 3 - Commercial
Previous Zone New Zone Zone Purpose Key Features
Business 1 Zone
Business 2 Zone
Business 5 Zone
Commercial 1 Zone To promote vibrant mixed use commercial centres for retail, office, business, entertainment and community uses, as well as residential uses at densities complementary to the role and scale of the commercial centre.
Supermarket permitted without permit.
30 metre buffer for sensitive uses from industry and warehouses that do not require a permit.
Floor area restrictions are removed and provide business flexibility by reducing the need for approvals.
Business 3 Zone
Business 4 Zone
Commercial 2 Zone To develop commercial areas for offices and appropriate manufacturing and industrial and limited retail uses that does not affect the safety and amenity of adjacent, more sensitive uses.
Small scale supermarket up to 1,800sqm without permit.
All accommodation (excluding caretaker’s home, residential motel/hotel) to be prohibited.
30 metre buffer for sensitive uses from industry and warehouses that do not require a permit.
Floor area restrictions for office and some retail uses will be removed in many instances to create new opportunities for office and retail growth.
Industrial
Zone Zone Purpose Key Features
Industrial 1 Zone To provide for the manufacturing industry, the storage and distribution of goods and associated uses in a manner that does not affect the safety and amenity of local communities.
Removal of default floor space area restrictions for office.
Industrial 2 Zone To provide for the manufacturing industry, the storage and distribution of goods and associated facilities in a manner that does not affect the safety and amenity of local communities.
Removal of default floor space area restrictions for office.
Industrial 3 Zone To provide for industries and associated uses in specific areas where special consideration of the nature and impacts of industrial uses is required or to avoid inter industry conflict and to allow limited retailing in appropriate locations.
Removal of default floor space area restrictions for office.
Allowance for small scale supermarket up to 1,800sqm with 500sqm of associated shops.
Allow for commercial opportunities and competition.
Source: Reformed Zones for Victoria Fact Sheet, New Residential/Commercial/Industrial Zones, July 2013
Source: Department of Planning and Community Development, Zone Descriptions

Retail and Economic Assessment PSP74 and PSP75
M14037 P a g e 21 | 87
4. ECONOMIC AND SOCIAL CONTEXT This section profiles selected socio-demographic, economic and employment metrics relating to Sunbury and
the region for context purposes. The analysis is provided to better understand current conditions and trends
which are likely to impact on demand for retail, commercial and industrial land in Sunbury.
To that end, the ABS Sunbury Statistical Area (SA) 3 has been benchmarked against Melbourne’s North West
Region and Greater Melbourne where possible. The North West Region is shown in Figure 7 below
(comprising Hume and parts of surrounding municipalities).
Figure 7 - Data Areas
Source: MapInfo and Hill PDA (2014)

Retail and Economic Assessment PSP74 and PSP75
M14037 P a g e 22 | 87
4.1 SOCIO- DEMOGRAPHIC PROFILE AND TRENDS
Population
The population of Sunbury SA3 has increased at a rapid rate between 2001 and 2011 from 30,508 to 38,012
persons. The rate of growth during this period was 2.2%pa and this rate is expected to accelerate over time
to 2.9%pa, which would be higher than the comparison areas and about double the metropolitan growth rate
to 2031. By 2031 Sunbury SA3 is expected to accommodate around 67,200 people.
Historic and Forecast Population (2001-2031) Table 4 -
Area Historic Forecast Annual Average Change
2001 2006 2011 2016 2021 2026 2031 2001-2011 2011-2031
Sunbury SA3 30,508 34,721 38,012 41,261 47,012 55,989 67,152 2.2% 2.9%
Hume LGA 135,147 152,797 174,290 192,647 218,313 248,316 280,892 2.6% 2.4%
Melb. North West SA4 280,196 299,857 331,282 370,280 407,512 446,864 488,857 1.7% 2.0%
Greater Melbourne 3,500,249 3,760,760 4,169,366 4,518,213 4,845,955 5,157,957 5,453,712 1.8% 1.4%
Source: ERP Publication 3218.0, Victoria in the Future 2012, Forecast .id & Hill PDA (2014)
Figure 8 - Historic and Projected Average Annual Population Growth Rate Comparison (2001-2031)
Source: ERP Publication 3218.0, Victoria in the Future 2012, Forecast .id & Hill PDA (2014)
Age Distribution
An analysis of the age distribution of residents at 2011 shows that there are few significant differences, with
the most notable contrast being a marginally higher proportion of residents aged 45 to 59 years in the Sunbury
SA3 (refer to the following Figure 9).
0.0%
0.5%
1.0%
1.5%
2.0%
2.5%
3.0%
3.5%
4.0%
2001-2006 2006-2011 2011-2016 2016-2021 2021-2026 2026-2031
Sunbury SA3 Hume LGA Melbourne North West SA4 Greater Melbourne

Retail and Economic Assessment PSP74 and PSP75
M14037 P a g e 23 | 87
Figure 9 - Age Distribution Comparison (2011)
Source: ABS Census, Basic Community Profiles: Hume LGA, Melbourne North West Region, Greater Melbourne SD (2011)
Education
The 2011 profile data on education shows that the Sunbury SA3 population is vocationally oriented, and has a
relatively low share of university educated residents compared to the metropolitan area as a whole (see Figure
10). The skills profile of the area is however increasing, as shown in Figure 11.
Figure 10 - Comparison: Non-School Qualifications (2011)
Source: ABS Census, Basic Community Profiles (2011)
0-14 15-29 30-44 45-59 60-74 75+
Sunbury SA3 21.0% 20.8% 21.0% 21.4% 11.2% 4.5%
Hume LGA 22.7% 22.6% 22.0% 19.0% 10.1% 3.5%
Melb. North West 20.7% 20.8% 21.7% 18.9% 11.9% 6.1%
Greater Melb. 18.5% 21.8% 22.5% 19.0% 12.0% 6.2%
0.0%
5.0%
10.0%
15.0%
20.0%
25.0%
Sunbury SA3 Hume LGA Melb. North West Greater Melb.
0.0%
5.0%
10.0%
15.0%
20.0%
25.0%
Postgraduate DegreeLevel
Graduate Diploma andGraduate Certificate
Level
Bachelor Degree Level Advanced Diploma andDiploma Level
Certificate Level
Sunbury SA3 Hume LGA Melb. North West Greater Melb.

Retail and Economic Assessment PSP74 and PSP75
M14037 P a g e 24 | 87
Figure 11 - Sunbury SA3: Non-School Qualifications (2001-2011)
Source: ABS Census, Sunbury SA3 Time Series Profile (2011)
4.2 HOUSEHOLDS AND DWELLINGS
Household Structure
Household structure data shows that all comparison areas have a high proportion of family households (Figure
12). Over the period 2001 to 2011, the Sunbury SA3 experienced a steady rise in the proportion of lone
person households (Figure 13), which is a general trend across all areas.
Figure 12 - Sunbury SA3: Household Structure (2011)
Source: ABS Census, Basic Community Profiles (2011)
0.0%
5.0%
10.0%
15.0%
20.0%
25.0%
Postgraduate DegreeLevel
Graduate Diploma andGraduate Certificate
Level
Bachelor Degree Level Advanced Diploma andDiploma Level
Certificate Level:
2001 2006 2011
0.0%
10.0%
20.0%
30.0%
40.0%
50.0%
60.0%
70.0%
80.0%
90.0%
Family Households Lone Person Households Group Households
Sunbury SA3 Hume LGA Melb North West SA4 Greater Melb

Retail and Economic Assessment PSP74 and PSP75
M14037 P a g e 25 | 87
Figure 13 - Sunbury SA3: Household Structure (2001-2011)
Source: ABS Census, Sunbury SA3 Time Series Profile (2011)
Family Type
The comparison of family type distributions shows a high proportion of couple families with children in the
comparison areas followed by couple families without children (Figure 14). The latter family type is growing
fastest followed by lone parent families (Figure 15).
Figure 14 - Comparison: Family Type (2011)
Source: ABS Census, Basic Community Profiles (2011)
0.0%
10.0%
20.0%
30.0%
40.0%
50.0%
60.0%
70.0%
80.0%
90.0%
Family Households Lone Person Households Group Households Other Housholds
2001 2006 2011
0.0%
10.0%
20.0%
30.0%
40.0%
50.0%
60.0%
Couple family w. children Couple family w/o children One parent family Other family
Sunbury SA3 Hume LGA Melb. North West SA4 Greater Melb.

Retail and Economic Assessment PSP74 and PSP75
M14037 P a g e 26 | 87
Figure 15 - Sunbury SA3: Family Type (2001-2011)
Source: ABS Census, Sunbury SA3: Time Series Profile (2011)
Dwelling Type
In terms of dwelling stock, a stand-out feature of Sunbury SA3 is a relatively high share of separate houses
(Figure 16) and relatively little change in this profile in the decade to 2011 (Figure 17). Over 9 in 10 dwellings
in the area are separate houses.
Figure 16 - Comparison: Dwelling Type (2011)
Source: ABS Census, Basic Community Profiles (2011)
0.0%
10.0%
20.0%
30.0%
40.0%
50.0%
60.0%
70.0%
Couple family w. children Couple family w/o children One parent family Other family
2001 2006 2011
0.0%
10.0%
20.0%
30.0%
40.0%
50.0%
60.0%
70.0%
80.0%
90.0%
100.0%
Separate house Townhouse Flat-Unit-Apartment Other dwelling Not stated
Sunbury SA3 Hume LGA Melb. North West SA4 Greater Melb.

Retail and Economic Assessment PSP74 and PSP75
M14037 P a g e 27 | 87
Figure 17 - Sunbury SA3: Dwelling Type (2001 - 2011)
Source: ABS Census, Sunbury SA3 Time Series Profile (2011)
4.3 RESIDENT EMPLOYMENT PROFILE
Over the period 2006 to 2011 the number of employed residents in the Sunbury SA3 increased by around
2,070 from 16,570 to 18,640 (+12.5%). At 2011, working residents were most commonly employed in retail
trade (11.5%) and construction (11%).
This number of working residents employed in manufacturing and information media and telecommunications
declined over the data period shown.
Resident employment grew most strongly in construction (+492 residents workers) and health care and social
assistance (+406 persons). Proportionally, strongest growth was experienced in electricity, gas, water and
waste services, arts and recreation services and construction.
Proportion of Resident Workforce by Industry (2006-2011) Table 5 -
Sunbury SA3 Hume LGA Melbourne North West SA4 Greater Melbourne
2006 2011 Change 2006 2011 Change 2006 2011 Change 2006 2011 Chan
ge
Number of Working Residents 16,566 18,636 2,070 61,130 70,889 9,759 121,691 138,565 16,874 1,703,1
08 1,920,9
48 217,8
40
Agriculture, forestry and fishing 0.5% 0.5% -0.9% 0.4% 0.3% -19% 0.5% 0.4% -14% 0.6% 0.5% -13%
Mining 0.2% 0.2% -8.6% 0.1% 0.1% 10% 0.1% 0.2% 24% 0.2% 0.2% 30%
Manufacturing 11.1% 9.3% -16.3% 17.5% 14.0% -20% 14.7% 11.9% -19% 12.9% 10.8% -16%
Electricity, gas, water and waste services
0.7% 1.1% 63.2% 0.6% 1.0% 54% 0.6% 1.0% 49% 0.7% 1.0% 33%
Construction 9.4% 11.0% 16.9% 8.2% 10.0% 22% 8.4% 9.8% 17% 7.3% 8.1% 11%
Wholesale trade 4.4% 4.0% -9.2% 5.0% 4.5% -11% 4.9% 4.4% -12% 5.5% 5.0% -10%
Retail trade 12.0% 11.4% -4.6% 11.7% 11.1% -6% 11.5% 10.7% -7% 11.4% 10.6% -7%
Accommodation and food services 5.5% 5.4% -1.0% 5.9% 5.9% 1% 5.6% 5.8% 5% 5.6% 5.9% 5%
Transport, postal and warehousing 11.0% 10.8% -1.9% 10.0% 10.2% 2% 8.8% 8.8% 0% 4.7% 4.8% 2%
Information media and telecommunications
1.6% 1.3% -20.3% 1.5% 1.4% -8% 1.7% 1.6% -5% 2.5% 2.3% -9%
Financial and insurance services 3.4% 3.6% 3.2% 3.5% 3.6% 3% 4.0% 4.1% 4% 4.7% 4.8% 2%
0.0%
10.0%
20.0%
30.0%
40.0%
50.0%
60.0%
70.0%
80.0%
90.0%
100.0%
Separate house Townhouse Flat-Unit-Apartment Other dwelling Not stated
2001 2006 2011

Retail and Economic Assessment PSP74 and PSP75
M14037 P a g e 28 | 87
Rental, hiring and real estate services
1.6% 1.7% 3.7% 1.3% 1.3% 1% 1.4% 1.4% 2% 1.5% 1.5% 2%
Professional, scientific and technical services
4.3% 4.8% 12.3% 3.8% 4.3% 12% 5.0% 5.6% 11% 8.2% 8.9% 8%
Administrative and support services 3.2% 3.1% -3.6% 3.4% 3.6% 5% 3.5% 3.5% 2% 3.5% 3.5% -1%
Public administration and safety 7.5% 7.2% -5.1% 5.6% 5.4% -2% 5.8% 5.8% 1% 4.9% 5.1% 3%
Education and training 6.7% 7.1% 5.3% 5.4% 6.0% 11% 6.7% 7.2% 7% 7.6% 7.9% 4%
Health care and social assistance 9.1% 10.3% 12.8% 7.9% 9.2% 17% 8.5% 9.6% 13% 10.0% 11.1% 10%
Arts and recreation services 1.2% 1.6% 31.3% 1.1% 1.2% 11% 1.3% 1.5% 13% 1.7% 1.8% 9%
Other services 3.8% 3.7% -1.3% 3.8% 3.9% 2% 3.9% 3.8% -2% 3.6% 3.6% 0%
Inadequately described / not stated 2.6% 1.9% -26.8% 3.3% 3.0% -9% 3.1% 2.8% -10% 2.7% 2.5% -7%
Total 100.0% 100.0% 100.0% 100.0% 100.0% 100.0% 100.0% 100.0%
Source: ABS Census, Time Series Profiles (2011)
Figure 18 - Working Residents: Employment by Industry Profile (2006-2011)
Source: ABS Census, Time Series Profiles (2011)
Labour Force Occupation
Greater Melbourne has a high proportion of employed residents that are highly skilled. In contrast, Sunbury
SA3 has a relatively even skills profile including high shares of technical and clerical working residents (Figure
19).
Over the period 2001 to 2011 there was no significant change in occupations of Sunbury SA3 residents apart
from continual growth in community and personal service workers (Figure 20).
0.0%
2.0%
4.0%
6.0%
8.0%
10.0%
12.0%
14.0%
16.0%
18.0%
20.0%
Sunbury SA3 2006 Sunbury SA3 2011 Hume LGA 2006 Hume LGA 2011
Melb. North West SA4 2006 Melb. North West SA4 2011 Greater Melb. 2006 Greater Melb. 2011

Retail and Economic Assessment PSP74 and PSP75
M14037 P a g e 29 | 87
Figure 19 - Comparison: Occupation (2011)
Source: ABS Census, Basic Community Profiles (2011)
Figure 20 - Sunbury SA3: Occupation (2001 - 2011)
Source: ABS Census, Sunbury SA3 Time Series Profile (2011)
0.0%
5.0%
10.0%
15.0%
20.0%
25.0%
Managers Professionals Technicians &Trade Workers
Community &PersonalServicesWorkers
Clerical andAdministrative
Workers
Sales Workers MachineryOperators &
Drivers
Labourers
Sunbury SA3 Hume LGA Melb. North West SA4 Greater Melb.
0.0%
2.0%
4.0%
6.0%
8.0%
10.0%
12.0%
14.0%
16.0%
18.0%
20.0%
Managers Professionals Technicians andtrades
workers(b)
Community andpersonal service
workers
Clerical andadministrative
workers
Sales workers Machineryoperators and
drivers
Labourers
2001 2006 2011

Retail and Economic Assessment PSP74 and PSP75
M14037 P a g e 30 | 87
4.4 ECONOMIC STRUCTURE
Jobs in the Area
In 2011, the Sunbury SA3 had 6,290 jobs in the area. A comparison with 2006 data is not directly available
due to changes in geographic boundaries between 2006 and 2011, however at 2006 the Hume – Sunbury
Statistical Local Area (SLA) had approximately 6,020 jobs. If these areas are compared however, the growth
rate in jobs is 0.9% pa. The metropolitan growth rate was 2.5% pa.
At 2011 the biggest employment generating industry within the Sunbury SA3 was retail trade (22% or 1,365
jobs), followed by education and training (13%) and health care and social assistance (11%) (refer to Table 6).
These sectors are population-driven, which more or less follow the size and composition of the local
population.
The distribution of jobs in the LGA differs from Sunbury SA3 by having a strong industrial land economy,
defined by 23% or 16,660 jobs in manufacturing, followed by transport, postal and warehousing (20% or
14,410 jobs) and construction (7% or 5,260 jobs).
Place of Work: Employment by Industry Profile (2006-2011) Table 6 -
Sunbury SA3 Hume LGA Melbourne North West SA4 Greater Melbourne
2006* 2011 Change 2006 2011 Change 2006* 2011 Change 2006 2011 Change
Number of Jobs 6,024 6,290 266 64,580 71,835 7,255 na 112,863 na 1.549m 1.756m 206,660
Agriculture, forestry and fishing 1.5% 1.2% -15% 0.3% 0.3% -17% 0.3% 0.5% 48% 0.5% 0.5% 7%
Mining 0.2% 0.0% -100% 0.1% 0.1% 24% 0.1% 0.1% 22% 0.2% 0.2% -20%
Manufacturing 3.5% 3.6% 3% 28.1% 23.2% -18% 28.1% 21.0% -25% 11.3% 13.5% 20%
Electricity, gas, water and waste services
0.3% 2.2% 650% 0.7% 1.3% 79% 0.7% 1.0% 30% 1.0% 0.8% -25%
Construction 8.6% 10.2% 18% 5.5% 7.3% 34% 5.5% 8.3% 51% 6.2% 5.4% -12%
Wholesale trade 1.8% 1.4% -23% 6.5% 5.8% -11% 6.5% 5.7% -11% 5.3% 5.8% 11%
Retail trade 21.9% 21.7% -1% 9.2% 8.9% -3% 9.2% 10.7% 17% 10.9% 11.8% 8%
Accommodation and food services 9.2% 8.5% -8% 5.0% 5.1% 2% 5.0% 5.0% 0% 5.9% 5.7% -4%
Transport, postal and warehousing 4.2% 3.8% -9% 18.9% 20.1% 6% 18.9% 15.3% -19% 4.8% 4.7% -3%
Information media and telecommunications
0.8% 0.6% -30% 0.9% 0.8% -17% 0.9% 0.8% -11% 2.4% 2.6% 10%
Financial and insurance services 1.9% 1.8% -3% 0.8% 1.0% 21% 0.8% 1.5% 80% 5.2% 5.1% 0%
Rental, hiring and real estate services
1.9% 1.8% -8% 1.3% 1.3% 2% 1.3% 1.3% -1% 1.6% 1.5% -4%
Professional, scientific and technical services
3.8% 4.8% 27% 1.7% 2.1% 22% 1.7% 2.7% 57% 9.5% 8.8% -7%
Administrative and support services 2.2% 2.3% 4% 2.2% 2.5% 14% 2.2% 2.4% 8% 3.2% 3.3% 1%
Public administration and safety 6.1% 4.1% -33% 4.6% 4.9% 6% 4.6% 4.8% 4% 5.4% 5.3% -3%
Education and training 14.0% 12.8% -9% 6.1% 6.4% 5% 6.1% 7.5% 23% 8.4% 8.0% -5%
Health care and social assistance 10.6% 11.3% 7% 4.1% 4.6% 13% 4.1% 6.1% 50% 11.5% 10.4% -10%
Arts and recreation services 1.5% 1.6% 9% 0.5% 0.5% 9% 0.5% 0.8% 58% 1.9% 1.7% -10%
Other services 4.7% 5.4% 16% 2.6% 2.8% 9% 2.6% 3.5% 39% 3.7% 3.7% 1%
Inadequately described / not stated 1.2% 0.7% -42% 1.0% 1.1% 9% 1.0% 1.1% 7% 1.2% 1.2% 1%
Total 100.0% 100.0% 100.0% 100.0% 100.0% 100.0% 100.0% 100.0%
Source: ABS Census, Working Population Profiles (2011)
* Data not available at an SA3 and SA4 level for 2006 so similar geographic areas were used at 2006 including the Hume – Sunbury SLA and Statistical Subdivisions (South Loddon and Hume City).

Retail and Economic Assessment PSP74 and PSP75
M14037 P a g e 31 | 87
Figure 21 - Place of Work: Employment by Industry Profile (2006-2011)
Source: ABS Working Population Profiles (2006-2011)
Hume’s Labour Force Region
At 2011, Hume LGA is a net importer of workers, with more jobs available in the LGA (71,840 jobs) than there
are working residents (70,890 working residents).
Based on journey to work (JTW) data analysis undertaken by the Department of Transport, the following
Figure 22 shows that 33% of Hume LGA working residents also work in the LGA. The remainder travel to a
number of other locations for employment including neighbouring LGAs (17%) including Melton, Macedon
Ranges, Mitchell, Whittlesea, Moreland and Brimbank, the Melbourne CBD (13%) and other metropolitan
LGAs (24%).
In contrast an analysis of workers in the LGA shows that 36% travel from surrounding LGAs, 29% from other
metropolitan LGAs and just 3% from regional centres (refer to the following figures).
0.0%
5.0%
10.0%
15.0%
20.0%
25.0%
30.0%
Sunbury SA3 2006 Sunbury SA3 2011 Hume LGA 2006 Hume LGA 2011
Melb. North West SA4 2006 Melb. North West SA4 2011 Greater Melb. 2006 Greater Melb. 2011

Retail and Economic Assessment PSP74 and PSP75
M14037 P a g e 32 | 87
Figure 22 - Hume LGA: Work Journeys To and From Hume (2011)
Source: ABS Census, Time Series Profiles (2011)
4.5 SUNBURY CONTAINMENT METRICS
Sunbury has undergone and will continue to experience significant population growth over the period to 2031
and beyond. This strong growth will drive demand for a range of goods and services, in particular housing,
retail, education, health and community services.
The area’s jobs to population and dwelling ratios are summarised in Table 7 below. This shows that the area
is a typical outer suburban area in terms of job provision and that it will be challenging to grow jobs to make up
for the existing gap between jobs and dwellings and also to keep pace with expected population and dwelling
growth.
The general policy is to strive for one job per dwelling in growth areas.
In broad terms Sunbury would need to add around 6,800 jobs now – or more than double the 2011 count of
local jobs - to achieve the target. By 2031 the jobs growth need is around 23,200 and by a nominal full
development population of around 120,000 the jobs growth need is around 48,000 above existing conditions.
Selected Metrics Table 7 -
Indicator 2011 2031 Full
Development
Population 38,012 67,152 120,000
Working Residents 18,636
Dwellings 13,111 23,156 48,000
Jobs 6,290
Jobs to Dwelling Ratio 0.48
Jobs Growth Need to Achieve at Target 1:1 +6,821 +16,866 +41,710
Total Job Need 13,111 23,156 48,000
Retail and Economic Assessment PSP74 and PSP75
M14037 P a g e 33 | 87
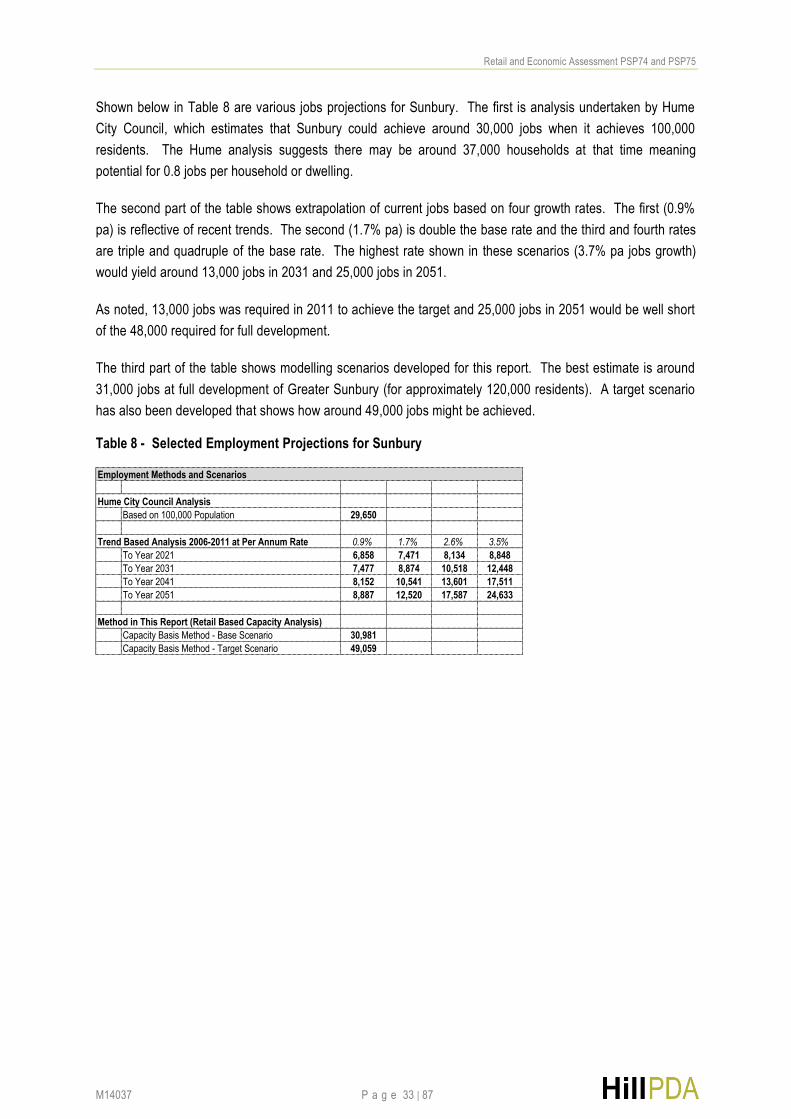
Shown below in Table 8 are various jobs projections for Sunbury. The first is analysis undertaken by Hume
City Council, which estimates that Sunbury could achieve around 30,000 jobs when it achieves 100,000
residents. The Hume analysis suggests there may be around 37,000 households at that time meaning
potential for 0.8 jobs per household or dwelling.
The second part of the table shows extrapolation of current jobs based on four growth rates. The first (0.9%
pa) is reflective of recent trends. The second (1.7% pa) is double the base rate and the third and fourth rates
are triple and quadruple of the base rate. The highest rate shown in these scenarios (3.7% pa jobs growth)
would yield around 13,000 jobs in 2031 and 25,000 jobs in 2051.
As noted, 13,000 jobs was required in 2011 to achieve the target and 25,000 jobs in 2051 would be well short
of the 48,000 required for full development.
The third part of the table shows modelling scenarios developed for this report. The best estimate is around
31,000 jobs at full development of Greater Sunbury (for approximately 120,000 residents). A target scenario
has also been developed that shows how around 49,000 jobs might be achieved.
Selected Employment Projections for Sunbury Table 8 -
Based on 100,000 Population 29,650
0.9% 1.7% 2.6% 3.5%
To Year 2021 6,858 7,471 8,134 8,848
To Year 2031 7,477 8,874 10,518 12,448
To Year 2041 8,152 10,541 13,601 17,511
To Year 2051 8,887 12,520 17,587 24,633
Capacity Basis Method - Base Scenario 30,981
Capacity Basis Method - Target Scenario 49,059
Employment Methods and Scenarios
Hume City Council Analysis
Trend Based Analysis 2006-2011 at Per Annum Rate
Method in This Report (Retail Based Capacity Analysis)

Retail and Economic Assessment PSP74 and PSP75
M14037 P a g e 34 | 87
5. LAND USE AND FLOORSPACE CONTEXT
5.1 ACTIVITY CENTRES
Plan Melbourne sets out a metropolitan hierarchy of activity centres. The hierarchy is shown in Table 9 below
including an interpretation of relevant centres and activities.
Activity Centres Hierarchy and Relevant Centres and Activities Table 9 - Typology Characteristics Centres Commercial & Community
Uses (including Health Care, Education, Office)
Expanded Central City To allow the continued location and growth of knowledge-intensive and high skilled firms in the Central City while continuing to be a major area for tourism, retail, residential, entertainment, sporting and cultural activities.
CBD Southbank Docklands
Sunbury Education and Health: Former Victoria
University – Sunbury Campus Site
Sunbury Day Hospital (Western Health)
Sunbury Community Hospital
Sunbury Private Hospital
Sunbury Corporate Centre
Sunbury Business Park
Metropolitan Activity Centre To maximise access to goods and services in a limited number of major centres with good public transport networks. These centres will play a major service delivery role, including government health, justice and education services, providing a diverse range of jobs, activities and housing for a subregional catchment.
Broadmeadows Dandenong Footscray Fountain Gate / Narre
Warren Epping Sunshine Ringwood Box Hill Frankston
Activity Centre To provide access to a wide range of goods and services in centres that are planned and managed by local government. The centres will have jobs and vibrant local economies. Some will serve larger subregional catchments.
Hume: Sunbury Town Centre Donnybrook Town
Centre (planned) Roxburgh Park
Shopping Centre Craigieburn Town
Centre Gladstone Park
Shopping Centre Mickleham Town
Centre (planned) Sunbury South Town
Centre (planned)
Neighbourhood Centres
To provide neighbourhood access to local goods and services.
Hume: Gap Road Centre
(Sunbury) Campbellfield Plaza Craigieburn East Meadow Heights Greenvale Westmeadows Village Dallas Olsen Place Tullamarine Upfield Shopping
Centre Hometead Place
Source: Plan Melbourne (2014) & HillPDA (2014)

Retail and Economic Assessment PSP74 and PSP75
M14037 P a g e 35 | 87
Hume City Council’s current planning scheme hierarchy is based on the previous metropolitan strategy,
Melbourne 2030. This is substantially similar to the Plan Melbourne version as follows:
Central Activity Area;
Principal Activity Centres (Broadmeadows);
Major Activity Centres (including Sunbury Town Centre);
Neighbourhood Activity Centres (including Gap Road Sunbury); and
Specialised Activity Centre (Melbourne Airport).
A stock take of existing centres relevant to Sunbury and their profile is provided in Table 10 below. Sunbury is
somewhat unique at this time by accommodating almost all retail and commercial activity within the Town
Centre. The only other notable nodes are the Gap Road Neighbourhood Activity Centre, Goonawarra Local
Centre and the bulky goods precinct along the Vineyard Road corridor.
Local and Competing Centres Table 10 - Centre Anchors Retail
(sqm) Total Centre
Area (sqm) Description
Sunbury Town Centre
Sunbury Town Centre 60,000 Estimated total floorspace in Sunbury Town Centre is approximately 60,000sqm (retail and 31,000sqm non-retail)
Sunbury Square Shopping Centre
Coles 4,077 11,107 Located at 2-28 Evans Street, Sunbury. It had a MAT of $60m and an annual visitation of 2.3m in 2013. Includes 45 specialty stores.
Best and Less 1,170
First Choice Liquor 900
Safeway Est. 3,000 na Located at 25-47 Horne Street, Sunbury.
Sunbury Terrace Shopping Centre
Harris Scarfe 2,500 3,055 Located at 92-102 Evans Street, Sunbury. Comprises 6 specialty stores.
Other in Sunbury
Gap Road NAC Aldi Food Store 2,900 Located at 112-126 Gap Road, Sunbury
Goonawarra LTC
Local shops and community
services
<2,000 5,000 Junction of Sunningdale Avenue and Francis Boulevard
Vineyard Road Bulky Goods Precinct
Bunnings, Masters, others
na na Vineyard Road and adjacent streets, Sunbury
Other Regional Centres
Water Gardens Big W 8,698 138,559 located at 399 Melton Highway, Taylor Lakes. It had a MAT of $392.4m and 11.4m visitations in 2013. Includes 174 specialty stores.
Woolworths 8,542
Target 7,132
Coles 3,715
Broadmeadows Shopping Centre
Target 7,569 59,969 Located at 1099-1169 Pascoe Vale Road, Broadmeadows. It had a MAT of $272.8m and 8.8m visitations in 2013. It includes 174 specialty stores.
Big W 7,567
Safeway 3,723
Coles 3,441
Aldi 1,618
Best and Less 1,091
JB Hi Fi 1,082
First Choice Liquor 1,029
Source: Property Council of Australia Shopping Centre Directory (2013) & HillPDA (2014)

Retail and Economic Assessment PSP74 and PSP75
M14037 P a g e 36 | 87
5.2 INDUSTRIAL LAND SUPPLY
Sunbury currently accommodates 64.4ha of industrial land of which approximately 36.8ha is occupied. The
area is used for a range of light or service industry uses, bulky goods retail and trade supplies. Sunbury is not
a major industrial node in Melbourne and it is not planned to be established as one in the future.
The following Figure 23 shows the location of major industrial nodes in the metropolitan area and the relative
low stock of industrial land in Sunbury. Sunbury is however located between two of Melbou rne’s most
significant industrial nodes: west and north nodes.
Figure 23 - Industrial Land in Melbourne
Source: DTPLI, Urban Development Program (2013)
The Urban Development Program (UDP) by the Department of Planning (DTPLI) monitors supply and
absorption of industrial land in metropolitan Melbourne. The following data shows UDP industrial land data at
2013.
The 2013 UDP data indicates that there is 25,654ha of industrial land in metropolitan Melbourne, of which
7,222ha (28%) is vacant. The Northern Subregion, which includes Banyule, Darebin, Whittlesea, Moreland,
Nillumbik and Hume LGAs accounted for approximately 18% of all industrial land in Melbourne, representing
4,674ha of land. Hume LGA provided 2,954ha of industrial land (equivalent to 63% of the Northern Subregion
total), of which 1,121 or 38% was available for development.

Retail and Economic Assessment PSP74 and PSP75
M14037 P a g e 37 | 87
Industrial Land Supply by Region (2013) Table 11 -
Occupied
(ha) Vacant (ha) Total (ha)
% of Metro.
Melbourne
Western Subregion 4,797 2,797 37% 7,594 29.6%
Northern Subregion 3,235 1,439 31% 4,674 18.2%
Eastern Subregion 2,499 195 7% 2,694 10.5%
Southern Subregion 6,918 2,742 28% 9,660 37.6%
Central Subregion 984 49 5% 1,033 4.0%
Total Metropolitan Melbourne 18,433 7,222 28% 25,654 100.0%
Source: DTPLI, Urban Development Program (2013) and Hill PDA (2014)
Northern and Western Region Industrial Land Supply (2013) Table 12 -
Occupied
(ha) Vacant (ha) Total (ha)
% of Northern
Subregion
Banyule 115 3 3% 118 2.5%
Darebin 291 15 5% 307 6.6%
Moreland 266 13 5% 279 6.0%
Nillumbik 30 0.0 0% 30 0.6%
Whittlesea 700 286 29% 986 21.1%
Hume 1,883 1,121 38% 2,954 63.2%
Northern Region 3,235 1,439 31% 4,674 100.0%
Brimbank 1,640 486 23% 2,126 28.0%
Hobsons Bay 1,226 411 25% 1,637 21.6%
Melton 377 929 71% 1,306 17.2%
Moonee Valley 55 1 2% 56 0.7%
Wyndham 1,499 969 39% 2,468 32.5%
Western Region 4,797 2,796 37% 7,593 100.0%
Source: DTPLI, Urban Development Program (2013) and Hill PDA (2014)
Estimated existing and proposed future industrial and related employment land supply in Sunbury is
summarised in Table 13 below.
Existing and Proposed Industrial and Related Employment Land in Sunbury Table 13 -
Occupied
(ha) Vacant (ha) Total (ha)
Existing
IN3Z 36.8 27.6 43% 64.4
B4Z 7.6 0.0 0% 7.6
Total Existing 44.4 27.6 38% 72.0
Proposed
Diggers Rest Industrial 27.5
Sunbury South Industrial 100.0
Commercial Mixed Use 110.0
Total Proposed 237.5

Retail and Economic Assessment PSP74 and PSP75
M14037 P a g e 38 | 87
5.3 PROPOSED DEVELOPMENTS
An investigation into the development pipeline in Sunbury indicates two large scale residential developments,
comprising the Racecourse Road Mixed Use Development and Rosenthal Residential Estate, both of which
propose neighbourhood activity centres. A small neighbourhood centre is also proposed on Bellview Drive
and Outlook Way.
In addition to these proposals, there are two bulky goods retail centres investments being constructed in
Sunbury with scheduled completion by mid 2014. These are the development of a Masters store and
development of a new Bunnings store (replacing an existing facility). Refer to Table 14 below for details.
Development Pipeline in Sunbury (2014) Table 14 - Project Type of
development (retail, office etc)
Project Details Approx. Value
Expected Completion
Status
Jacksons Hill Estate Neighbourhood Activity Centre Lot 13 Bellview Dr And Outlook Wy, Sunbury
Retail Development of a mixed use Neighbourhood Activity Centre
Site is approximately 13,321sqm
$50m Early 2016 Submit Proposals for Development
Rosenthal Residential Estate
100 Vineyard Rd, Sunbury
Residential 1284 lot residential subdivision $38.5m Mid 2019 Subdivision Application
Racecourse Road Mixed Use Development
275 Racecourse Rd, Sunbury
Residential & Retail
6 star rated energy efficient homes, will comprise a mixture of semi-rural, sub urban and urban living housing
Will include a small scale neighbourhood retail centre.
$20m Late 2016 Rezoning Application
Bunnings Warehouse Sunbury
95 Vineyard Rd, Sunbury
Retail – Bulky Goods
Situated in Sunbury Business Park. Construction of a Bunning’s Warehouse
$15.3m Mid 2014 Commenced
Construction
Masters Home Improvements Sunbury Business Park
105 Vineyard Rd, Sunbury
Retail – Bulky Goods
Construction of a Masters Home Improvements Store
$10m Mid 2014 Commenced
Construction
Source: Cordell Connect (2014) & HillPDA (2014)
Retail and Economic Assessment PSP74 and PSP75
M14037 P a g e 39 | 87
6. FUTURE ECONOMIC CONDITIONS
6.1 METHOD
The approach taken to identify a potential future economic plan is to:
Identify a potential activity centre hierarchy based on a retail thresholds model developed for
Sunbury;
Assess the potential for associated activities and jobs to locate in centres co-located with retail
activity, namely office and community service uses; and
Assess industrial and related commercial development potential based on modelling methods.
The method uses a nominal ‘full development’ population capacity estimate as the basis for the analysis. This
enables the end state to be understood. Various stages leading up to the planning horizon can be identified
up to the end state as required.
The approach considers Greater Sunbury overall so as to understand the two PSP areas in context. More
detail on the PSP areas is provided later in this report.
6.2 EXISTING CONDITIONS
The potential for Sunbury and the PSP areas to capture jobs will depend on:
The population size and composition of the area, including the skills profile of the area; and
The economic structure and attributes of Sunbury and its potential to perform roles in the economy.
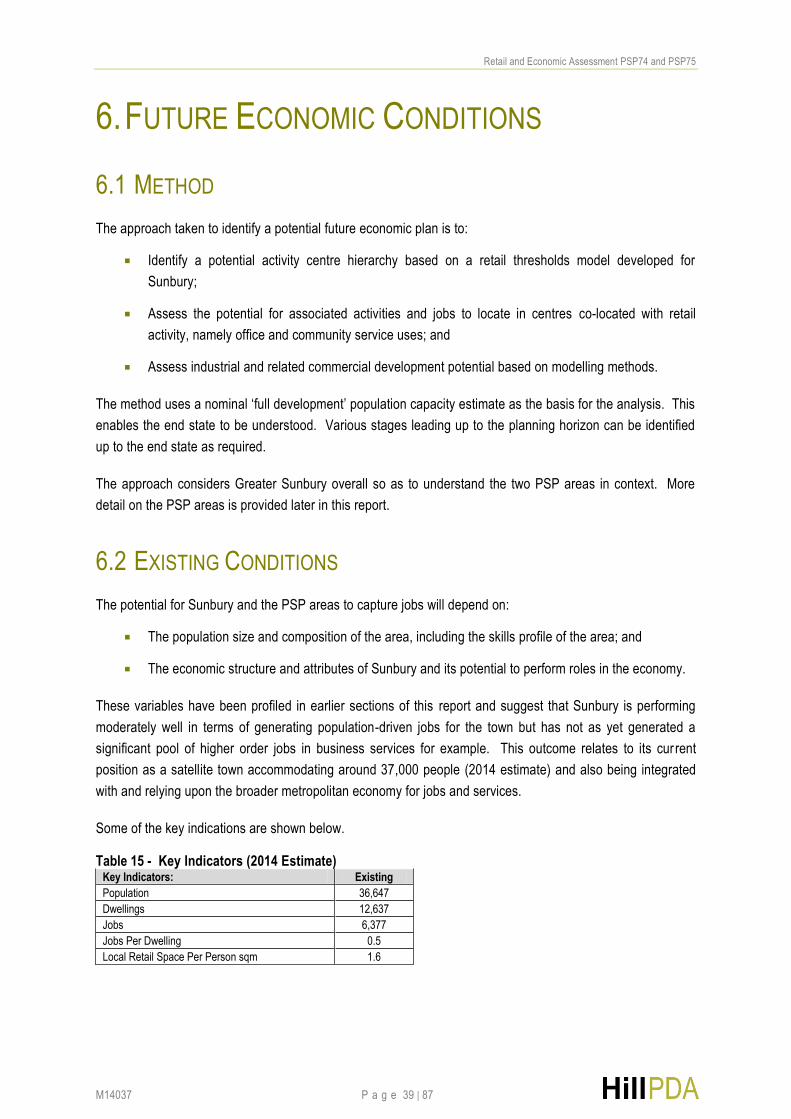
These variables have been profiled in earlier sections of this report and suggest that Sunbury is performing
moderately well in terms of generating population-driven jobs for the town but has not as yet generated a
significant pool of higher order jobs in business services for example. This outcome relates to its current
position as a satellite town accommodating around 37,000 people (2014 estimate) and also being integrated
with and relying upon the broader metropolitan economy for jobs and services.
Some of the key indications are shown below.
Key Indicators (2014 Estimate) Table 15 - Key Indicators: Existing
Population 36,647
Dwellings 12,637
Jobs 6,377
Jobs Per Dwelling 0.5
Local Retail Space Per Person sqm 1.6

Retail and Economic Assessment PSP74 and PSP75
M14037 P a g e 40 | 87
6.3 FULL DEVELOPMENT CAPACITY ESTIMATE
The future economic plan for the area can take a growth trajectory especially as the population breaks through
population thresholds and is thus able to support more economic activity. A long term high growth scenario is
shown in the following Table 16. This shows a long term future outcome around 120,000 people in Greater
Sunbury. In this report this population outcome is considered ‘full development’ for which an economic plan is
developed.
The capacity estimate is based on development cells as shown in Figures 2 and 3 of this report.
The method to derive the population estimates was as follows.
GIS Mapinfo analysis was undertaken to determine land area by zone type in each cell. This was
used to estimate gross area and net developable area (NDA) in each cell.
The NDA was divided into predominantly residential land versus predominantly employment land.
The division was based on zoning information or strategic planning information where possible.
The existing count of dwellings was estimated for each cell based on count of dwelling lots and
checked by reference to ABS Census information.
The full development dwelling estimate was derived by applying assumed future dwelling densities
to the residential land area of each cell. This takes into account existing conditions and land uses.
For residential land the average density is assumed to be between 13.5 and 15 dwellings per
hectare of net residential land in the PSP areas subject to this report. Lower densities are applied to
other areas based on observations and planning frameworks.
The population capacity was calculated from the number of dwellings by applying 2.5 persons per
dwelling at full development.
Other assumptions are shown in the table and in the notes to the table.
It should be noted that this approach provides an estimate based on the method and assumptions used.
There is a risk to the recommendations and the planning process should this scale not be achieved or if it is
over-achieved. Based on information reviewed for this report, it is felt that the full development estimate
shown in this report may be at the high end of a reasonable range.
Another factor worth noting is timing of development. Sunbury currently has around 37,000 residents and may
have around 68,000 residents by 2031. The achievement of 120,000 residents is therefore likely to be a very
long term proposition based on the best information available at the time of report writing.

Retail and Economic Assessment PSP74 and PSP75
M14037 P a g e 41 | 87
Estimated Long Term Full Development Conditions Table 16 -
Development Cell
Gross Area
(GA)
Existing
Dwellings
(2011)
Population
Capacity at
Dwelling Size
(p/d)
ha ha % of GA ha % of NDA ha % of NDA no. no. d/ha 2.5
Sunbury South
SS1 542.1 458.5 84.6% 98.1 21.4% 360.4 78.6% 5 1,471 15.0 3,678
SS2 1,139.0 636.3 55.9% 540.9 85.0% 95.4 15.0% 43 8,113 15.0 20,282
SS3 108.2 108.2 100.0% 92.0 85.0% 16.2 15.0% 13 1,380 15.0 3,449
Total Sunbury South 1,789.3 1,203.0 67.2% 730.9 60.8% 472.1 39.2% 61 10,964 15.0 27,409
Lancefield Road
LR1 434.1 170.6 39.3% 145.0 85.0% 25.6 15.0% 1 2,175 15.0 5,438
LR2 147.9 124.0 83.8% 105.4 85.0% 18.6 15.0% 38 1,581 15.0 3,953
LR3 483.7 361.0 74.6% 306.9 85.0% 54.2 15.0% 6 4,603 15.0 11,507
Total Lancefield Road 1,065.7 655.6 61.5% 557.3 85.0% 98.3 15.0% 45 8,359 15.0 20,897
Other Areas
Township (Existing) 2,715.0 2,317.6 85.4% 1,833.2 79.1% 421.5 18.2% 11,560 14,666 8.0 36,664
Sunbury West 362.8 295.9 81.6% 251.5 85.0% 44.4 15.0% 66 3,396 13.5 8,489
Sunbury North 849.6 481.6 56.7% 409.4 85.0% 72.2 15.0% 23 5,527 13.5 13,817
Diggers Rest 543.1 451.4 83.1% 415.9 92.1% 35.6 7.9% 882 5,614 13.5 14,035
Total Other Areas 4,470.5 3,546.6 79.3% 2,910.0 82.1% 573.7 16.2% 12,531 29,202 10.0 73,006
Total Greater Sunbury 7,325.6 5,405.2 73.8% 4,198.2 77.7% 1,144.1 21.2% 12,637 48,525 11.6 121,312
Assumptions
NDA is based on urban development zones including UGZ
Residential area is current residential zones plus % (as shown) of UGZ / developable area
Employment and Other Uses area is current employment zones plus % (as shown) of UGZ / developable area
SS1's Special Use Zone is assumed to be for employment purposes
Net Developable Area (NDA) Residential NDA
Employment and Other Uses
NDA
Residential Development
Capacity at Density (d/ha)

Retail and Economic Assessment PSP74 and PSP75
M14037 P a g e 42 | 87
6.4 POTENTIAL STAGES
For the development capacity and timing uncertainty reasons noted above, it is recommended that the
planning process adopt recommendations based on thresholds of development as follows.
Stage 1 – approximately 70,000 residents. This accords with the population scenario for Sunbury
according to the Growth Corridor Plan.
Stage 2 – approximately 100,000 residents. This accords with the population scenario for Sunbury
according to Hume City Council analysis.
Stage 3 – full development of approximately 120,000 residents. This accords with the population
capacity scenario derived for this report.
Information on likely timing of development by cell is not available. As such, an assumed roll out of
development was made and this is shown in Table 17 below. Other scenarios are possible,
Assumed Population by Development Cell and Stage Table 17 -
Development Cell Population at Stage 1
Population at Stage 2
Population at Stage 3
Sunbury South
SS1 1,655 3,311 3,678
SS2 9,127 18,254 20,282
SS3 1,552 3,104 3,449
Total Sunbury South 12,334 24,668 27,409
Lancefield Road
LR1 2,447 4,894 5,438
LR2 1,779 3,557 3,953
LR3 5,178 10,356 11,507
Total Lancefield Road 9,404 18,808 20,897
Other Areas
Township (Existing) 36,664 36,664 36,664
Sunbury West 4,245 8,489 8,489
Sunbury North 102 205 13,817
Diggers Rest 7,018 14,035 14,035
Total Other Areas 48,029 59,393 73,006
Total Greater Sunbury 69,767 102,869 121,312

Retail and Economic Assessment PSP74 and PSP75
M14037 P a g e 43 | 87
6.5 RETAIL HIERARCHY AND FLOORSPACE
In order to understand the demand for retail floorspace in Sunbury, it is first necessary to calculate the
quantum of retail expenditure generated by residents. Household expenditure used in the estimation of retail
floorspace demand was sourced from:
ABS Household Expenditure Survey (HES) 2003-04 (updated to 2014) which provides household
expenditure by broad commodity type by household income quintile; and
Marketinfo 2012 data which is generated by combining and updating data from the ABS Census and
the ABS HES using “microsimulation modelling techniques”.
The following table identifies expenditure per capita for Sunbury (suburb) residents by retail store type. At
2014, Sunbury residents spent approximately $13,830 per person on retail goods and services. Almost a third
(32%) of all retail expenditure from Sunbury residents is outlaid on supermarket and grocery store retailing,
followed by bulky goods retailing (18%) and other personal and household goods retailing (12%).
Sunbury Expenditure per Capita by Retail Store Type (2014) Table 18 -
Retail Store Type
2014
$ / capita %
Supermarkets & Grocery Stores 4,437 32.1%
Specialty Food Stores 935 6.8%
Fast-Food Stores 828 6.0%
Restaurants, Hotels and Clubs* 1,047 7.6%
Department Stores 919 6.6%
Apparel Stores 1,114 8.1%
Bulky Goods Stores 2,467 17.8%
Other Personal & Household Goods Retailing 1,705 12.3%
Selected Personal Services** 382 2.8%
Total 13,834 100%
Source: MarketInfo 2012 and HillPDA (2014)
The next step in the model is to identify retail distribution variables for different levels in the retail hierarchy.
Typically, in existing and new urban areas a network of activity centres is delivered that are broadly classified
according to not only the total quantum of retail floorspace but also the key anchor retail tenants at the centre.
As identified in Table 19 below, in the case of Greater Sunbury activity can be broadly designated across core
centre types, including:
Regional: Regional centres contain a wide variety of retail goods and services, along with office
based uses and are focal points for the community. The retail mix generally includes a department
store, discount department stores (DDS’), supermarkets, a broad range of specialty store retailing
(generally comprising household goods, clothing / footwear and retail services) and cafes /
restaurants. Regional centres can vary in size markedly but the average is around 70,000sqm
generating $455m in turnover.

Retail and Economic Assessment PSP74 and PSP75
M14037 P a g e 44 | 87
Sub-Regional: Comprises a significant quantum of retail floorspace, typically being anchored by at
least one DDS, full-line supermarkets and complemented by around 40-80 specialty stores offering
household goods, clothing / footwear and retail services. Sub-regional centres generally have an
average size of 25,000sqm generating $188m in turnover.
Large Neighbourhood: Large neighbourhood centres generally accommodate between 5,000-
10,000sqm of retail floorspace and are anchored by at least one full-line supermarket that is
complemented by a range of specialty store retailing (typically 20-40 stores) which predominantly
provides for convenience goods, retail services, café / restaurant space and a limited range of
discretionary retailing. The average is 7,000sqm generating $60m in turnover.
Small Neighbourhood: Small neighbourhood centres generally cater to a walkable catchment,
providing for day-to-day or convenience retailing. These centres can typically contain up to
5,000sqm of retail floorspace and are anchored by a smaller format supermarket or large grocery
store. They have a limited range of specialty store retailing (no more than 20 stores) which tend to
be focused on retail service provision (e.g. hair dresser, laundromat, clothing alterations / repairs)
and take-away food / cafes. The average is 3,500sqm generating $30m in turnover.
Bulky Goods: These centres contain larger format retail stores that are presented in showroom type
facilities offering “big box” retailing such as furniture, hardware, sporting / camping goods,
automotive parts and homewares / manchester. Standalone bulky goods centres are generally
located on arterial road or highway locations beyond traditional activity centres due to the
importance of private vehicle visibility and access for purchases. There is a wide variety in centre
sizes with some smaller bulky goods centres containing just one or two stores, however typically
these centres accommodate 40,000sqm of retail floorspace generating $140m in turnover.
Potential Retail Hierarchy Typology Table 19 - Centre Type Typical Retail Store Composition Retail Store Floorspace
per Store Average Retail Floorspace
Regional 1 department store 2-3 discount department stores 2-3 supermarkets 4-5 mini majors 80 – 150 specialties
10,000 – 20,000sqm 6,000 – 10,000sqm 3,000 – 4,500sqm* 400 – 800sqm 80 -100sqm
70,000sqm average
Sub-Regional 1-2 discount department stores 2-3 supermarkets 3-4 mini-majors 40 - 80 specialty stores
6,000 – 10,000sqm 3,000 – 4,500sqm 400 – 800sqm 80 -100sqm
25,000sqm average
Large Neighbourhood
1 full-line supermarket 1 small supermarket 20 – 40 specialty stores
3,000 – 4,500sqm 1,500 – 2,500sqm 80 -100sqm
7,000sqm average
Small Neighbourhood
1 large grocery store / small supermarket <20 specialty stores
500 – 1,000sqm 80 -100sqm
3,500sqm average
Bulky Goods Large format retail stores 2,000 – 12,000sqm 40,000sqm average
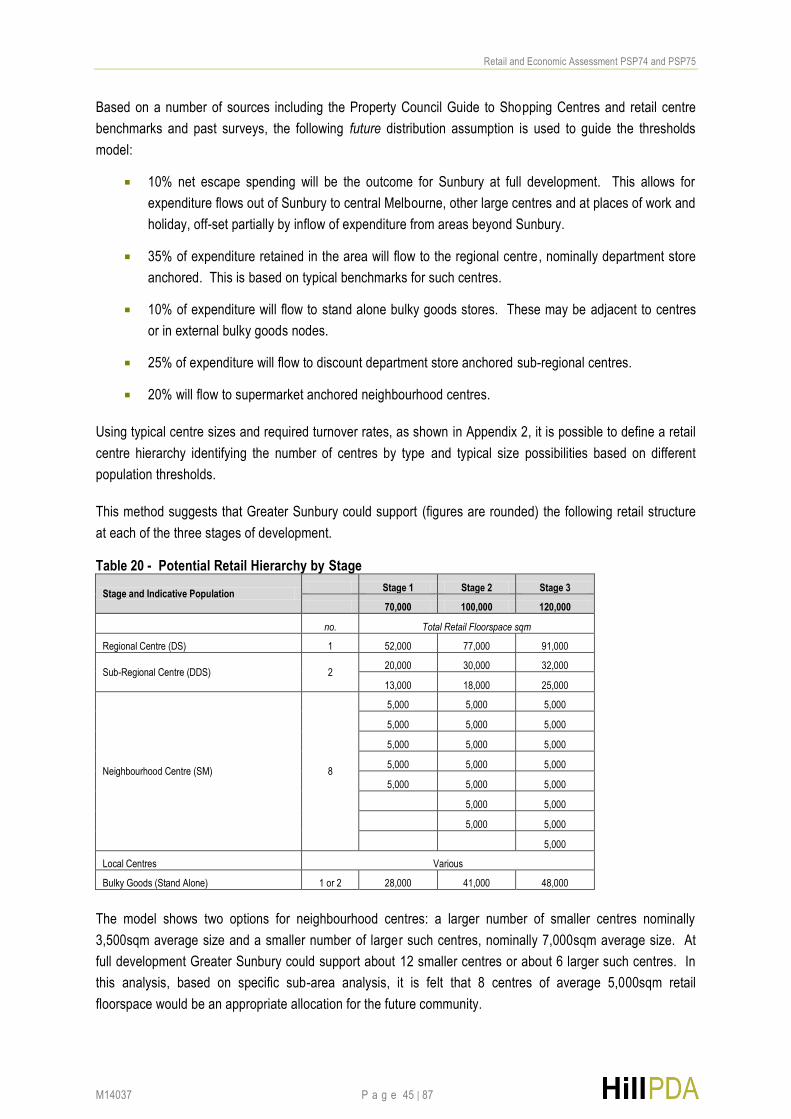
Retail and Economic Assessment PSP74 and PSP75
M14037 P a g e 45 | 87
Based on a number of sources including the Property Council Guide to Shopping Centres and retail centre
benchmarks and past surveys, the following future distribution assumption is used to guide the thresholds
model:
10% net escape spending will be the outcome for Sunbury at full development. This allows for
expenditure flows out of Sunbury to central Melbourne, other large centres and at places of work and
holiday, off-set partially by inflow of expenditure from areas beyond Sunbury.
35% of expenditure retained in the area will flow to the regional centre, nominally department store
anchored. This is based on typical benchmarks for such centres.
10% of expenditure will flow to stand alone bulky goods stores. These may be adjacent to centres
or in external bulky goods nodes.
25% of expenditure will flow to discount department store anchored sub-regional centres.
20% will flow to supermarket anchored neighbourhood centres.
Using typical centre sizes and required turnover rates, as shown in Appendix 2, it is possible to define a retail
centre hierarchy identifying the number of centres by type and typical size possibilities based on different
population thresholds.
This method suggests that Greater Sunbury could support (figures are rounded) the following retail structure
at each of the three stages of development.
Potential Retail Hierarchy by Stage Table 20 -
Stage and Indicative Population Stage 1 Stage 2 Stage 3
70,000 100,000 120,000
no. Total Retail Floorspace sqm
Regional Centre (DS) 1 52,000 77,000 91,000
Sub-Regional Centre (DDS) 2 20,000 30,000 32,000
13,000 18,000 25,000
Neighbourhood Centre (SM) 8
5,000 5,000 5,000
5,000 5,000 5,000
5,000 5,000 5,000
5,000 5,000 5,000
5,000 5,000 5,000
5,000 5,000
5,000 5,000
5,000
Local Centres Various
Bulky Goods (Stand Alone) 1 or 2 28,000 41,000 48,000
The model shows two options for neighbourhood centres: a larger number of smaller centres nominally
3,500sqm average size and a smaller number of larger such centres, nominally 7,000sqm average size. At
full development Greater Sunbury could support about 12 smaller centres or about 6 larger such centres. In
this analysis, based on specific sub-area analysis, it is felt that 8 centres of average 5,000sqm retail
floorspace would be an appropriate allocation for the future community.

Retail and Economic Assessment PSP74 and PSP75
M14037 P a g e 46 | 87
The actual floorspace of each supermarket centre in the PSP areas may be higher or lower than the nominal
5,000sqm guide based on specific local area catchment conditions, which are not yet determined. This detail
can be assessed following design of the areas and identification of more detailed catchment conditions and
dwelling and population yields.
In addition to those centres, a number of smaller local centres, which could accommodate a small
supermarket or grocery store and some speciality stores, could also be provided. These are identified at a
broad level for the PSP areas later in this report. Again, specific sizing depends on local area conditions.
6.6 OFFICE AND COMMUNITY FACILITY FLOORSPACE
In order to identify potential demand for non-retail floorspace in centres, defined as office and community
facilities floorspace, it has been assumed that non-retail facility space would make up a share of total
floorspace within centres. The shares vary by centre type in the hierarchy and are based on observations for
centres in other locations and cross-checked with reference to job projections and other data.
As noted in Section 1.3 above, this report does not provide a comprehensive assessment of community
infrastructure needs in the PSP areas. Community infrastructure is assessed at a broad level to identify
potential land and job implications for centres.
The PCA Guide to Shopping Centres provides a land use profile of single owner retail facilities. For
neighbourhood centres, the typical attributes are overall size of 5,100sqm with retail the dominant use. Office
space averages only approximately 300sqm, or around 6% of centre area. Such office uses are typically local
catchment based activities such as tax agents, solicitors and real estate services. ‘Other’ uses also occupy a
similar amount of space (around 300sqm on average) in neighbourhood centres. The average size of
tenancies is about 100sqm each.
Profile data for larger sub-regional centres was also reviewed. Interestingly, for these larger centres office
and other uses is not much greater than neighbourhood centres, at around 600sqm. Other uses typically
comprise tavern, medical centre, amusement parlour, childcare centre, hotel, restaurant, gymnasium,
community centre, cinema, social club, education centre, bowling alley and similar other uses.
Data for multi-owner CBD or strip retail centres is more difficult to obtain. Nevertheless, in such settings the
mix of uses is greater, with more non-retail activity typically present.
Other assumptions are provided by work undertaken by Essential Economics as part of the Growth Corridor
Plans: Activity Centre and Employment Planning report which noted that “a range of data sources have been
reviewed to understand the typical provision of commercial office and other uses at large activity
centres…These datasets show that non-retail provision in higher-order retail centres can vary considerably,
from just 10-15% in a stand-alone, single-ownership centre, to 50% or more in a multi-ownership, main street
style centre (and particularly where the centre has evolved over time)”.1
1 Source: Growth Corridor Plans: Activity Centre and Employment Planning, Essential Economics (2011)

Retail and Economic Assessment PSP74 and PSP75
M14037 P a g e 47 | 87
It is understood that in work undertaken by Essential Economics for the former Growth Areas Authority (GAA)
in relation to the Hume and Casey-Cardinia growth areas, an allocation of 15% was provided for non-retail
floorspace within neighbourhood centres.2
The baseline benchmarks used in this analysis to cater for office and community facility activity, jobs and
floorspace within activity centres are shown in Table 21 below.
Two scenarios are provided:
Base conditions, which represents typical suburban conditions; and
Target scenario, which shows a more optimistic outcome which would help achieve the target 1 job
per dwelling.
Non-Retail Uses as a Ratio to Retail Floorspace Within Activity Centres Table 21 -
Use
Base Scenario Target Scenario
Office Community Total Non-Retail
Office Community Total Non-Retail
Regional 25% 25% 50% 125% 125% 250%
Sub-Regional 20% 10% 30% 100% 50% 150%
Neighbourhood 12.50% 7.50% 20% 62.50% 37.50% 100%
Bulky Goods - - - - - -
Additional office and community facility activity would occur outside of activity centres, and the job modelling
undertaken for this report makes an additional allowance for such dispersed jobs.
6.7 SHOWROOM USES
Showrooms and motor vehicle retailing and services has not been included as part of the retail demand
projections given these uses tend to locate in showroom clusters beyond the bounds of activity centres. At
the 2011 Census, there were approximately 18,660 jobs in Victoria in this sector, equivalent to a ratio of 297
residents per job (based on 2011 Estimated Resident Population for Victoria).
At full population capacity in Greater Sunbury, this would translate to 429 jobs in this sector. The City of
Melbourne Census of Land Use and Employment (CLUE) has identified that within showroom sectors, for
every job there is 88sqm of floorspace. Greater Sunbury may therefore require approximately 36,000sqm of
showroom / motor vehicle related floorspace at full development.
2 Source: Growth Corridor Plans: Activity Centre and Employment Planning, Essential Economics (2011)

Retail and Economic Assessment PSP74 and PSP75
M14037 P a g e 48 | 87
Allowance for Main Road Showroom Uses Table 22 -
Source: ABS Publication 3218.0 Estimated Resident Population, ABS Census Working Population Profile Victoria, City of Melbourne Census of Land Use and Employment
6.8 INDUSTRIAL LAND NEEDS
The potential demand for industrial land in Greater Sunbury has been estimated based on the application of
existing rates of occupied industrial land per person (PPOH). As the following Table 23 shows, there are
currently 1,027 residents per occupied industrial hectare in Greater Sunbury. A comparison with broader
areas shows that this ratio is significantly higher than the rate in the Hume LGA (99 persons PPOH), the
Northern Region (261 PPOH) and Western Region (147 PPOH) and across the whole of metropolitan
Melbourne (230 PPOH).
Occupied Industrial Land to Resident Ratios Table 23 -
Area
Industrial Emphasis Indicator
Occupied Industrial
Hectares (ha) (2012-2013)
Data Area Population (2012-2013)
Persons Per Occupied Industrial
Hectare (ha) (PPOH)
Sunbury 36.8 37,726 1,027
Hume 1,833 182,105 99
Northern Region 3,235 845,269 261
Western Region 4,797 704,802 147
Total Metropolitan Melbourne 18,433 4,241,284 230
Note: It should be noted that the industrial land ratio is a guide. Occupied land would also include some non-core industrial uses utilising industrial
land such as large format retail and some commercial uses.
Table 24 shows potential demand for industrial land based on different PPOH scenarios. This shows that
applying the current PPOH ratio for Sunbury would result in demand for around 118ha of industrial land at full
residential development capacity. Application of the existing Northern Region PPOH ratio to future potential
resident population would yield demand for 464ha of industrial land.
The decision to aim for a share of future industrial land is in large part a policy decision for Sunbury given it is
not a major industrial node at the current time. This analysis assumes that industrial land in Sunbury will
continue to perform a local role, and not seek to service Melbourne‘s broader regional or metropolitan needs.
Retail trade Total Jobs in
Victoria
Victoria
Estimated
Resident
Population 2011
Residents /
Job
Full Capacity
Population
Jobs at Full
Capacity
CLUE
Employment
Ratio
Total
Floorspace
Requirement
(sqm)
Motor vehicle and motor vehicle parts retailing 18,655 5,537,817 296.9 121,312 409 88 35,962

Retail and Economic Assessment PSP74 and PSP75
M14037 P a g e 49 | 87
Total Occupied Industrial Demand Based on Population and PPOH Ratios (ha) Table 24 -
The total planned provision of industrial land in Greater Sunbury is approximately 192ha, as shown in Table
25. The stock is based on core industrial land defined by existing zoned industrial land, along with approved
land as part of the Diggers Rest PSP and proposed provision in the Sunbury Growth Corridor Plans.
This provision (192ha) is sufficient to meet the baseline need of the town in the future (118ha).
Total Industrial Supply (Occupied, Vacant and Planned) Table 25 -
Area Industrial Land
Sunbury (Occupied and Vacant) ha 64.4
Diggers Rent (Planned by Approved PSP) ha 27.5
Indicative Sunbury Provision in Growth Corridor Plan 100.0
Total (ha) 191.9
Note: This stock does not count proposed mixed use commercial land and bulky goods land.
Shown below is an estimate of the current profile of industrial activity in Sunbury. This is based on allocating
jobs by industry sector to industrial sub-sectors and applying ratios for floorspace and site area based on
typical sub-sector characteristics. This is an estimate only and suggests the land profile as shown in Table
26.
Existing Industrial Activity Profile in Sunbury Table 26 - Jobs Floorspace Business Site Area Industrial Area
Manufacturing 231 17.2% 21,381 12.1% 3.1 9.7% 3.6 9.9%
Freight Oriented 328 24.5% 72,160 41.0% 17.7 54.6% 19.3 52.4%
Service Industry 644 48.0% 66,010 37.5% 8.1 25.0% 10.0 27.1%
Utilities 138 10.3% 16,560 9.4% 3.5 10.7% 3.9 10.6%
Total Industrial 1,341 100.0% 176,111 100.0% 32.4 100.0% 36.8 100.0%
Future conditions may not replicate current conditions, as the industrial economy of Sunbury grows and
changes.
For the purpose of providing guidance to the PSP process, it is assumed that the Sunbury industrial land
profile will change and move towards the current metropolitan Melbourne industrial land profile. This takes
into account the existing role of Sunbury and the likelihood that change will converge to the metropolitan
profile, which is more mature and diverse. The mid-point between the current Sunbury profile and current
metropolitan profile is adopted as the future composition of industrial activity in the area for planning
purposes. This is shown in Figure 27 below.
40,000 70,000 100,000 121,312
Scenario 1 Sunbury Average 1,027 39 68 97 118
Scenario 3 - Northern Region Average 261 153 268 383 464
Scenario 4 - Metropolitan Average 230 174 304 435 527
AreaPPOH
Population

Retail and Economic Assessment PSP74 and PSP75
M14037 P a g e 50 | 87
Adopted Future Industrial Activity Profile in Sunbury Table 27 -
2011 Sunbury Profile
2011 Metro Profile
Adopted Profile
% % %
Manufacturing 9.9% 19.9% 14.9%
Freight Oriented 52.4% 66.3% 59.3%
Service Industry 27.1% 10.7% 18.9%
Utilities 10.6% 3.2% 6.9%
Total Industrial 100.0% 100.0% 100.0%
The next step in the process is to determine need for land by type of activity. This is shown below for two land
take scenarios – one for Sunbury based need of 118ha (as calculated above) and one for the planned
provision of 192ha.
Potential Industrial Land Provision Sceanrios Table 28 -
Adopted Profile
Assumed Average Lot Size and Number of
Lots
% ha sqm no.
Base Need - 118ha
Manufacturing 14.9% 17.6 2,000 88
Freight Oriented 59.3% 70.0 5,000 140
Service Industry 18.9% 22.3 1,000 223
Utilities 6.9% 8.1 5,000 16
Total Industrial 100.0% 118.0 467
Planned Provision - 192ha
Manufacturing 14.9% 28.6 2,000 143
Freight Oriented 59.3% 113.9 5,000 228
Service Industry 18.9% 36.2 1,000 362
Utilities 6.9% 13.2 5,000 26
Total Industrial 100.0% 191.9 759
The base need scenario (118ha) suggests a need for around 470 lots configured as shown in the table above.
The planned 192ha scenario requires around 760 lots. The average lot size is approximately 2,500sqm.
For the planned provision scenario, this approach suggests the following land use allocation:
About 29 hectares could be allocated for manufacturing activity nominally comprising 143 lots of
average size average 2,000sqm;
About 114 hectares could be allocated to freight oriented industrial uses nominally comprising 228
lots of average size 5,000sqm;
About 36 hectares could be allocated to service industry uses nominally comprising 362 lots of
average size 1,000sqm; and
About 13 hectares could be allocated to utility and miscellaneous uses nominally comprising 26 lots
of average size 5,000sqm;

Retail and Economic Assessment PSP74 and PSP75
M14037 P a g e 51 | 87
6.9 OTHER ACTIVITIES
Other economic activities included in the analysis are:
Local Shop Nodes;
Home Based Business; and
Other Activities.
Local shop nodes comprise around 500 – 2,500sqm of retail space – say 1,500sqm average - located in ‘gaps’
in the retail hierarchy. The potential allocation of these is identified later in this report.
Home based business could comprise business services, personal services, retail / wholesale trading
businesses or light industrial type businesses.
Other activities refers to jobs not captured in the categories noted above and could include schools, higher
education, child care facilities and community services that are spread across urban areas.
The modelling utilises job density (jobs per sqm of floorspace) and site coverage ratio assumptions. Appendix
3 shows assumptions used for the above matters.

Retail and Economic Assessment PSP74 and PSP75
M14037 P a g e 52 | 87
7. POTENTIAL ECONOMIC PLAN The potential full development economic plan is shown in the graphic below as Figure 24 and in the following
Table 31. The economic plan has the following economic elements noted as A to J.
Activity Type Specific Centre / Location
A Existing Regional Activity Centre A1 Sunbury Town Centre
B Potential Sub-Regional Activity Centre B1 Potential Sunbury South SRAC
B2 Potential Lancefield Road SRAC
C Existing Neighbourhood Activity Centre C1 Gap Road Aldi Centre
C2 Goonawarra Local Centre
D Proposed Neighbourhood Activity Centre D1 Proposed Racecourse Road NAC
D2 Proposed Elizabeth Avenue NAC
D3 Proposed Diggers Rest NAC
E Potential Neighbourhood Activity Centre E1 Potential Lancefield Road NAC
E2 Potential Sunbury South NAC
E3 Potential Sunbury West NAC
E4 Potential Sunbury North NAC
F Existing Industrial / Employment Area F1 Existing Sunbury Industrial / Employment Area
G Proposed Industrial / Employment Area G1 Proposed Sunbury South Employment Area
G2 Potential Bulky Goods (including Existing)
G3 Potential Showroom / Motor Vehicle Uses
G4 Proposed Diggers Rest Employment Area
H Local Shop Nodes Some Locations Shown (in and around PSP Areas)
I Home Based Business Locations Not Shown
J Other Activities Locations Not Shown
D3 Proposed Diggers Rest NAC

Retail and Economic Assessment PSP74 and PSP75
M14037 P a g e 53 | 87
Note that this economic plan relates to full development and is one scenario and others may apply.
Potential details of each element are shown in the data table (Table 31).
The best estimate outcome for jobs is approximately 31,000 jobs in relation to 49,000 dwellings, generating a
ratio of 0.64 jobs per dwelling. Details are shown in Table 29 below.
Key Indicators - Best Estimate Scenario at Full Development Table 29 - Key Indicators: Existing Potential
Population 36,647 121,312
Dwellings 12,637 48,525
Jobs 6,306 30,981
Jobs Per Dwelling 0.50 0.64
Local Retail Space Per Person sqm 1.6 2.0
Achievement of 1 job per dwelling requires office and community service based jobs to be higher than shown
in the base estimate. Retail is not able to deliver significantly more jobs beyond the best estimate as a
relatively high provision rate is included in the model. This also assumes industrial activity is retained to meet
local demand.
A scenario to meet the aspirational target of 1 job per dwelling is shown in Tables 30 and 32. Under such a
scenario the economic plan does not necessarily change but rather centres and economic nodes get bigger by
attracting more office and commercial uses to achieve the target.
One way of achieving this target is as follows:
Office uses to be 125% of retail floorspace in the regional centre, 100% of retail in sub-regional
centres and 63% of retail in neighbourhood centres;
Community service uses to be 125% of retail floorspace in the regional centre, 50% of retail in sub-
regional centres and 38% of retail in neighbourhood centres; and
Other dispersed jobs would increase as well to help achieve the target.
Key Indicators - Target Scenario at Full Development Table 30 -
Key Indicators: Existing Potential
Population 36,647 121,312
Dwellings 12,637 48,525
Jobs 6,306 49,059
Jobs Per Dwelling 0.50 1.01
Local Retail Space Per Person sqm 1.6 2.0

Retail and Economic Assessment PSP74 and PSP75
M14037 P a g e 54 | 87
Figure 24 - Potential Full Development Economic Plan (Indicative Locations Shown)

Retail and Economic Assessment PSP74 and PSP75
M14037 P a g e 55 | 87
Potential Full Development Economic Plan Scenario 1 (Best Estimate) Table 31 -
Note: The figures in this table are for the purpose of assisting with planning the size and location of activities in PSP 74 and 75; all figures are indicative.
Specific Centre / Location Site Area
Floorspace
(All
Activities)
Estimated
Jobs
Retail
Floorspace
Major Bulky
Goods
Office
Floorspace
Community
Services
Floorspace
Industrial
Floorspace
Showroom
Floorspace
Total
Floorspace
Estimated
Jobs
Site Area at
Convent.
Density
(0.4:1.0)
Site Area at
Urban
Density
(0.8:1.0)
ha sqm no. sqm sqm sqm sqm sqm sqm sqm no. ha ha
A Existing Regional Activity Centre A1 Sunbury Town Centre 33.5 55,000 2,200 91,000 0 22,750 22,750 0 0 136,500 4,929 34.1 17.1
B1 Potential Sunbury South SRAC - - - 32,000 0 6,400 3,200 0 0 41,600 1,493 10.4 5.2
B2 Potential Lancefield Road SRAC - - - 25,000 0 5,000 2,500 0 0 32,500 1,167 8.1 4.1
C1 Gap Road Aldi Centre 0.8 2,600 52 5,000 0 625 375 0 0 6,000 210 1.5 0.8
C2 Goonawarra Local Centre 1.5 5,000 90 2,000 0 250 150 0 0 2,400 84 0.6 0.3
D1 Proposed Racecourse Road NAC - - - 5,000 0 625 375 0 0 6,000 210 1.5 0.8
D2 Proposed Elizabeth Drive NAC - - - 5,000 0 625 375 0 0 6,000 210 1.5 0.8
D3 Proposed Diggers Rest NAC - - - 5,000 0 625 375 0 0 6,000 210 1.5 0.8
E1 Potential Lancefield Road NAC - - - 5,000 0 625 375 0 0 6,000 210 1.5 0.8
E2 Potential Sunbury South NAC - - - 5,000 0 625 375 0 0 6,000 210 1.5 0.8
E3 Potential Sunbury West NAC - - - 5,000 0 625 375 0 0 6,000 210 1.5 0.8
E4 Potential Sunbury North NAC - - - 5,000 0 625 375 0 0 6,000 210 1.5 0.8
F Existing Industrial / Employment Area F1 Existing Sunbury Industrial / Employment Area 64.5 147,200 1,840 0 0 0 0 257,800 0 257,800 3,223 64.5 64.5
G1 Proposed Sunbury South Employment Area - - - 0 0 0 0 400,000 0 400,000 5,000 100.0 100.0
G2 Potential Bulky Goods (including Existing) - - - 0 48,000 0 0 0 0 48,000 960 12.0 6.0
G3 Potential Showroom / Motor Vehicle Uses - - - 0 0 0 0 0 35,962 35,962 409 9.0 4.5
G4 Proposed Diggers Rest Employment Area - - - 0 0 0 0 110,000 110,000 1,375 27.5 27.5
H Local Shop Nodes Locations Not Shown - - - 6,000 0 0 0 0 0 6,000 200 1.5 0.8
I Home Based Business Locations Not Shown - - 632 0 0 0 0 0 0 - 2,426 - -
J Other Activities Locations Not Shown - - 1,492 0 0 0 0 0 0 - 8,032 - -
TOTAL - - 6,306 196,000 48,000 39,400 31,600 767,800 35,962 1,118,762 30,981 279.7 235.8
C Existing Neighbourhood Activity Centre
Activity Type
Potential Future Conditions ScenarioExisting Conditions
Proposed Industrial / Employment AreaG
Potential Sub-Regional Activity CentreB
Proposed Neighbourhood Activity CentreD
Potential Neighbourhood Activity CentreE

Retail and Economic Assessment PSP74 and PSP75
M14037 P a g e 56 | 87
Potential Full Development Economic Plan Scenario 2 (Target) Table 32 -
Note: The figures in this table are for the purpose of assisting with planning the size and location of activities in PSP 74 and 75; all figures are indicative.
Specific Centre / Location Site Area
Floorspace
(All
Activities)
Estimated
Jobs
Retail
Floorspace
Major Bulky
Goods
Office
Floorspace
Community
Services
Floorspace
Industrial
Floorspace
Showroom
Floorspace
Total
Floorspace
Estimated
Jobs
Site Area at
Convent.
Density
(0.4:1.0)
Site Area at
Urban
Density
(0.8:1.0)
ha sqm no. sqm sqm sqm sqm sqm sqm sqm no. ha ha
A Existing Regional Activity Centre A1 Sunbury Town Centre 33.5 55,000 2,200 91,000 0 113,750 113,750 0 0 318,500 12,513 79.6 39.8
B1 Potential Sunbury South SRAC - - - 32,000 0 32,000 16,000 0 0 80,000 3,200 20.0 10.0
B2 Potential Lancefield Road SRAC - - - 25,000 0 25,000 12,500 0 0 62,500 2,500 15.6 7.8
C1 Gap Road Aldi Centre 0.8 2,600 52 5,000 0 3,125 1,875 0 0 10,000 385 2.5 1.3
C2 Goonawarra Local Centre 1.5 5,000 90 2,000 0 1,250 750 0 0 4,000 154 1.0 0.5
D1 Proposed Racecourse Road NAC - - - 5,000 0 3,125 1,875 0 0 10,000 385 2.5 1.3
D2 Proposed Elizabeth Drive NAC - - - 5,000 0 3,125 1,875 0 0 10,000 385 2.5 1.3
D3 Proposed Diggers Rest NAC - - - 5,000 0 3,125 1,875 0 0 10,000 385 2.5 1.3
E1 Potential Lancefield Road NAC - - - 5,000 0 3,125 1,875 0 0 10,000 385 2.5 1.3
E2 Potential Sunbury South NAC - - - 5,000 0 3,125 1,875 0 0 10,000 385 2.5 1.3
E3 Potential Sunbury West NAC - - - 5,000 0 3,125 1,875 0 0 10,000 385 2.5 1.3
E4 Potential Sunbury North NAC - - - 5,000 0 3,125 1,875 0 0 10,000 385 2.5 1.3
F Existing Industrial / Employment Area F1 Existing Sunbury Industrial / Employment Area 64.5 147,200 1,840 0 0 0 0 257,800 0 257,800 3,223 64.5 64.5
G1 Proposed Sunbury South Employment Area - - - 0 0 0 0 400,000 0 400,000 5,000 100.0 100.0
G2 Potential Bulky Goods (including Existing) - - - 0 48,000 0 0 0 0 48,000 960 12.0 6.0
G3 Potential Showroom / Motor Vehicle Uses - - - 0 0 0 0 0 35,962 35,962 409 9.0 4.5
G4 Proposed Diggers Rest Employment Area - - - 0 0 0 0 110,000 110,000 1,375 27.5 27.5
H Local Shop Nodes Locations Not Shown - - - 6,000 0 0 0 0 0 6,000 200 1.5 0.8
I Home Based Business Locations Not Shown - - 632 0 0 0 0 0 0 - 2,426 - -
J Other Activities Locations Not Shown - - 1,492 0 0 0 0 0 0 - 14,017 - -
TOTAL - - 6,306 196,000 48,000 197,000 158,000 767,800 35,962 1,402,762 49,059 350.7 271.3
D Proposed Neighbourhood Activity Centre
Existing Conditions Potential Future Conditions Scenario
Activity Type
B Potential Sub-Regional Activity Centre
C Existing Neighbourhood Activity Centre
E Potential Neighbourhood Activity Centre
G Proposed Industrial / Employment Area
Retail and Economic Assessment PSP74 and PSP75
M14037 P a g e 57 | 87
8. DESCRIBING THE ELEMENTS AND ISSUES
8.1 ECONOMIC PLAN ELEMENTS
A - Existing Regional Activity Centre
A1 Sunbury Town Centre
For Sunbury Town Centre to achieve the role under this plan it would need to accommodate in the order of
136,000sqm (best estimate) to around 319,000sqm (target) floorspace.
Land take could range from as low as 17 hectares (best estimate growth at urban density scenario) to as
much as 80 hectares (target growth at conventional density scenario). The best estimate growth at
conventional density scenario requires around 34 hectares.
Sunbury, with a population around 120,000, could support a regional retail centre around 91,000sqm (retail) in
size, with an additional 45,000sqm of office and community service space (best estimate).
Alternatives -
The main alternatives for consideration are that Sunbury Town Centre does not grow to this size due to
development and / or land constraints and as such regional demand:
Is released in another centre or centres in the town; or
Is not captured in Sunbury.
If the demand is captured in Sunbury, the most likely alternative location is the proposed Sunbury South
centre, which is located at a strategic position near the junction of Sunbury Road and Lancefield Road and
between the main population mass of the town on one of the two connections to Melbourne. The Sunbury
Road corridor is planned to also connect to the future Outer Metropolitan Ring Road.
Retail Staging –
The staging of the core retail space in the regional centre is market driven but based on retail benchmarks the
allocation could be as shown in Table 33 below.

Retail and Economic Assessment PSP74 and PSP75
M14037 P a g e 58 | 87
Potential Retail Staging, Sunbury Town Centre Table 33 -
Stage and Indicative Population Stage 1 Stage 2 Stage 3
70,000 100,000 120,000
Total Retail Floorspace sqm
Regional Centre (DS) 52,000 77,000 91,000
It is noted that Hume City Council has undertaken work that shows a higher potential provision of retail space
in the Town Centre based on existing stock of space plus potential future growth.
The above estimate of 91,000sqm (and stages leading to that figure) relates to effective retail space that is
occupied and trades at industry averages, in this case $6,500 / sqm pa.
Main street and CBD centres (with multiple ownership) like the existing Sunbury Town Centre often contain
floorspace beyond benchmark figures as more space is used at lower trading levels and offered at a lower
rent. As new space is added to the centre some former core retail space becomes low rent space. This
means that more low rent seeking retailers and non-core retail uses have greater potential to locate in the
centre. This is good for economic development, jobs growth and business formation.
This pattern needs to be taken into account when interpreting retail demand analysis. The analysis shown in
this report quotes floorspace potential for Sunbury Town Centre using benchmark figures, and does not
assess in any detail the potential for low rent seeking businesses in addition to core retail space.
Nevertheless, the point here is that 91,000sqm of core retail space is the estimate for Sunbury Town Centre
with a population around 120,000. Other space may be provided in addition to that for a range of related
uses.
B - Potential Sub-Regional Activity Centre
B1 Potential Sunbury South SRAC
Sunbury, with a full development population around 120,000, could support a regional retail centre and two
sub-regional centres.
The Sunbury South centre is nominated in the Growth Corridor Plan as a Major Town Centre and could be
developed as the second largest activity node in Greater Sunbury, nominally with 32,000sqm retail and around
42,000sqm total size (best estimate) at full development. Appendix 2 describes how the retail space figure
was derived.
For Sunbury to achieve the 1 job per dwelling target, this centre would need to play a role and delivering
additional office and community uses, potentially being around 80,000sqm in size (but retail remaining at
32,000sqm).
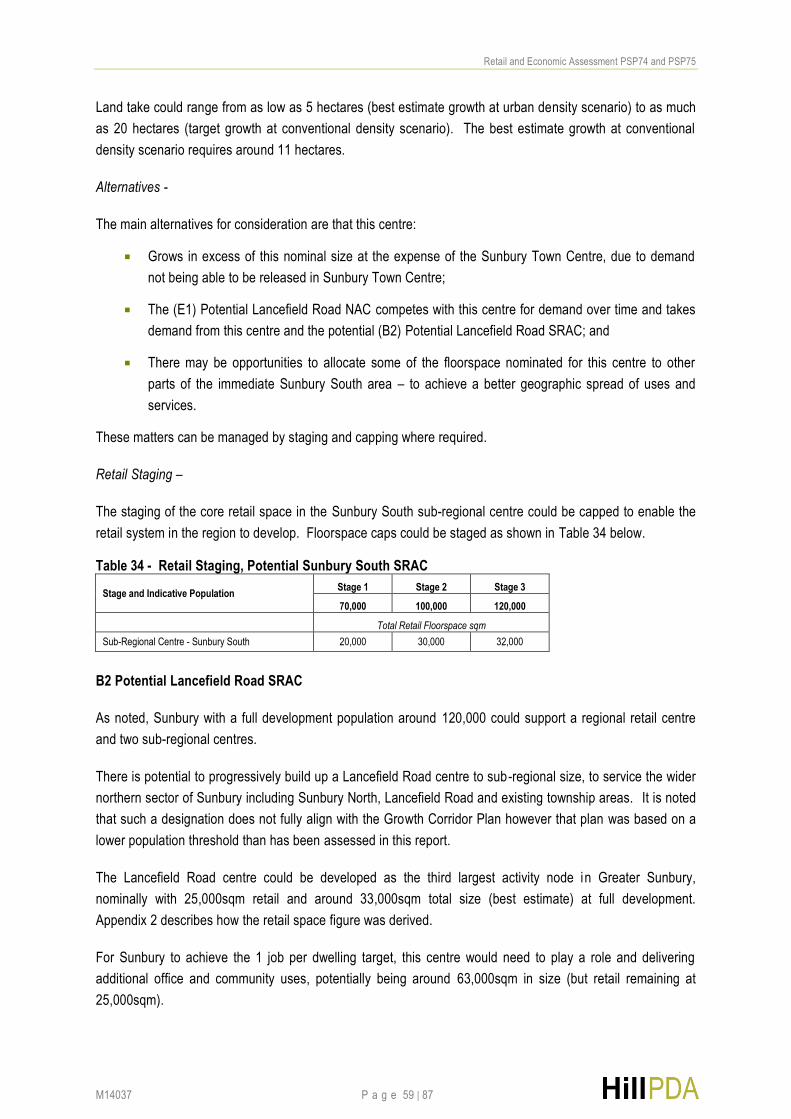
Retail and Economic Assessment PSP74 and PSP75
M14037 P a g e 59 | 87
Land take could range from as low as 5 hectares (best estimate growth at urban density scenario) to as much
as 20 hectares (target growth at conventional density scenario). The best estimate growth at conventional
density scenario requires around 11 hectares.
Alternatives -
The main alternatives for consideration are that this centre:
Grows in excess of this nominal size at the expense of the Sunbury Town Centre, due to demand
not being able to be released in Sunbury Town Centre;
The (E1) Potential Lancefield Road NAC competes with this centre for demand over time and takes
demand from this centre and the potential (B2) Potential Lancefield Road SRAC; and
There may be opportunities to allocate some of the floorspace nominated for this centre to other
parts of the immediate Sunbury South area – to achieve a better geographic spread of uses and
services.
These matters can be managed by staging and capping where required.
Retail Staging –
The staging of the core retail space in the Sunbury South sub-regional centre could be capped to enable the
retail system in the region to develop. Floorspace caps could be staged as shown in Table 34 below.
Retail Staging, Potential Sunbury South SRAC Table 34 -
Stage and Indicative Population Stage 1 Stage 2 Stage 3
70,000 100,000 120,000
Total Retail Floorspace sqm
Sub-Regional Centre - Sunbury South 20,000 30,000 32,000
B2 Potential Lancefield Road SRAC
As noted, Sunbury with a full development population around 120,000 could support a regional retail centre
and two sub-regional centres.
There is potential to progressively build up a Lancefield Road centre to sub-regional size, to service the wider
northern sector of Sunbury including Sunbury North, Lancefield Road and existing township areas. It is noted
that such a designation does not fully align with the Growth Corridor Plan however that plan was based on a
lower population threshold than has been assessed in this report.
The Lancefield Road centre could be developed as the third largest activity node in Greater Sunbury,
nominally with 25,000sqm retail and around 33,000sqm total size (best estimate) at full development.
Appendix 2 describes how the retail space figure was derived.
For Sunbury to achieve the 1 job per dwelling target, this centre would need to play a role and delivering
additional office and community uses, potentially being around 63,000sqm in size (but retail remaining at
25,000sqm).
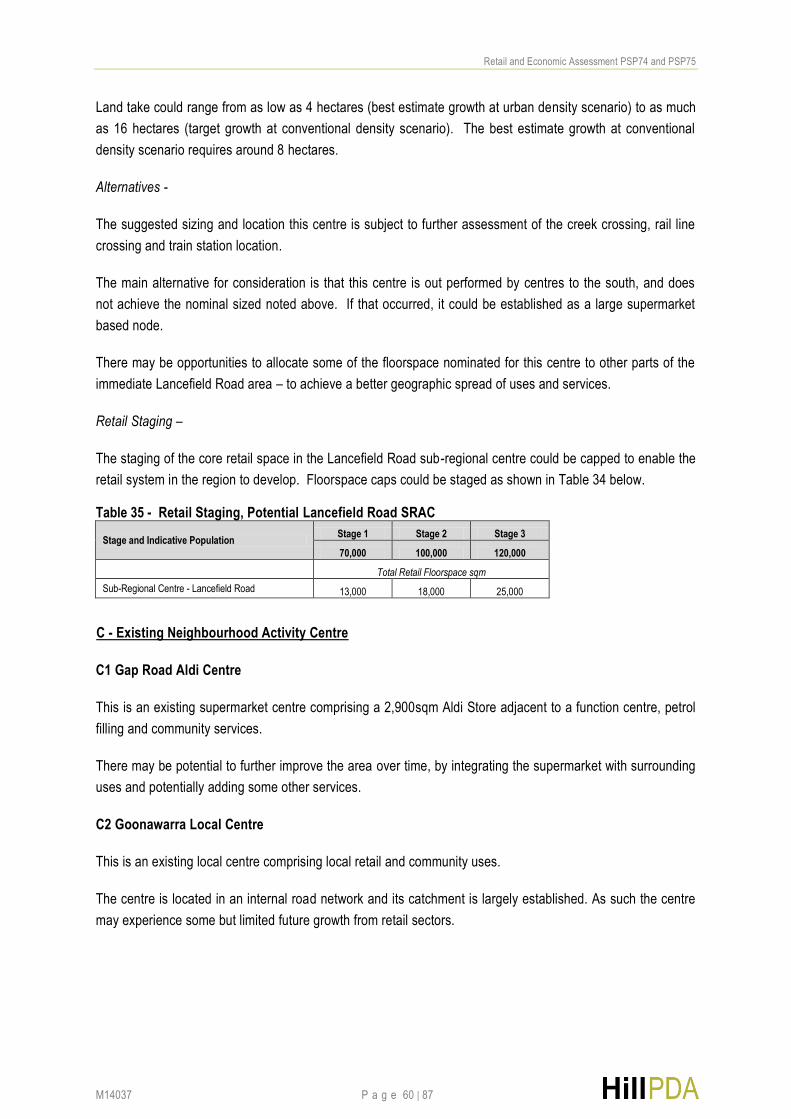
Retail and Economic Assessment PSP74 and PSP75
M14037 P a g e 60 | 87
Land take could range from as low as 4 hectares (best estimate growth at urban density scenario) to as much
as 16 hectares (target growth at conventional density scenario). The best estimate growth at conventional
density scenario requires around 8 hectares.
Alternatives -
The suggested sizing and location this centre is subject to further assessment of the creek crossing, rail line
crossing and train station location.
The main alternative for consideration is that this centre is out performed by centres to the south, and does
not achieve the nominal sized noted above. If that occurred, it could be established as a large supermarket
based node.
There may be opportunities to allocate some of the floorspace nominated for this centre to other parts of the
immediate Lancefield Road area – to achieve a better geographic spread of uses and services.
Retail Staging –
The staging of the core retail space in the Lancefield Road sub-regional centre could be capped to enable the
retail system in the region to develop. Floorspace caps could be staged as shown in Table 34 below.
Retail Staging, Potential Lancefield Road SRAC Table 35 -
Stage and Indicative Population Stage 1 Stage 2 Stage 3
70,000 100,000 120,000
Total Retail Floorspace sqm
Sub-Regional Centre - Lancefield Road 13,000 18,000 25,000
C - Existing Neighbourhood Activity Centre
C1 Gap Road Aldi Centre
This is an existing supermarket centre comprising a 2,900sqm Aldi Store adjacent to a function centre, petrol
filling and community services.
There may be potential to further improve the area over time, by integrating the supermarket with surrounding
uses and potentially adding some other services.
C2 Goonawarra Local Centre
This is an existing local centre comprising local retail and community uses.
The centre is located in an internal road network and its catchment is largely established. As such the centre
may experience some but limited future growth from retail sectors.
Retail and Economic Assessment PSP74 and PSP75
M14037 P a g e 61 | 87
D - Proposed Neighbourhood Activity Centre
D1 Proposed Racecourse Road NAC
This centre is proposed by a proponent to be a neighbourhood activity centre anchored by a supermarket
along with supporting speciality retail, local offices and community services. This potential is subject to
catchment development and more detailed planning.
D2 Proposed Elizabeth Drive NAC
This centre is proposed by a proponent to be a neighbourhood activity centre anchored by a supermarket
along with supporting speciality retail, local offices and community services. This potential is subject to
catchment development and more detailed planning.
D3 Proposed Diggers Rest NAC
This centre is planned as part of the Digger Rest PSP to be a neighbourhood activity centre anchored by a
supermarket along with supporting speciality retail, local offices and community services. The nominal size is
around 6,000sqm retail plus other uses.
E - Potential Neighbourhood Activity Centre
E1 Potential Lancefield Road NAC
This centre could be a neighbourhood activity centre anchored by a supermarket along with supporting
speciality retail, local offices and community services. The nominal size could be around 6,000sqm total. The
retail provision could be around 5,000sqm. Site area need may be around 1.5ha using conventional density
assumptions. This potential is subject to catchment development and more detailed planning.
Alternatives –
A consideration regarding this centre is timing of delivery in relation to the potential Sunbury South SRAC and
the potential Lancefield Road SRAC.
It is possible that this centre may lay claim to expand beyond the nominal size suggested here if its catchment
develops earlier than the two sub-regional catchments.
Early provision can be facilitated within reason but only up to the indicative size nominated in this report.
E2 Potential Sunbury South NAC
This centre could be a neighbourhood activity centre anchored by a supermarket along with supporting
speciality retail, local offices and community services. The nominal size could be around 6,000sqm total. The
retail provision could be around 5,000sqm. Site area need may be around 1.5ha using conventional density
assumptions. This potential is subject to catchment development and more detailed planning.

Retail and Economic Assessment PSP74 and PSP75
M14037 P a g e 62 | 87
Alternatives –
The optimal location of E2 is subject to further assessment of terrain, buffers, drainage, future potential railway
station locations, creek crossing and railway line crossing.
E3 Potential Sunbury West NAC
This centre could be a neighbourhood activity centre anchored by a supermarket along with supporting
speciality retail, local offices and community services. The nominal size could be around 6,000sqm total
(5,000sqm retail). This potential is subject to catchment development and more detailed planning.
E4 Potential Sunbury North NAC
This centre could be a neighbourhood activity centre anchored by a supermarket along with supporting
speciality retail, local offices and community services. The nominal size could be around 6,000sqm total
(5,000sqm retail). This potential is subject to catchment development and more detailed planning.
F - Existing Industrial / Employment Area
F1 Existing Sunbury Industrial / Employment Area
This area comprises 64.5ha of which 36.8ha is deemed developed. The uses in the area include light industry
and bulky goods and showroom uses. The area is a light industrial area that services the Greater Sunbury
area.
This area could continue in this role for the long term, and play a part is delivering services and jobs to the
region.
Alternatives –
There may be a case to consider exploring re-use of some industrial land areas close to the Sunbury Town
Centre for activity centre uses in the longer term.
This may be feasible after new industrial and bulky goods areas are developed and capacity exists for
businesses to relocate. This could free up land for activity centre development close to the Town Centre and
train station.
Note however it is beyond the scope of this study to determine which sites around the town centre would be
suitable for reallocation or when. By retaining the planned scenario quantum of land in the PSP areas, this
would enable flexibility for this more detailed exploration of the reallocation of existing sites around the town
centre to be realised.

Retail and Economic Assessment PSP74 and PSP75
M14037 P a g e 63 | 87
G - Proposed Industrial / Employment Area
G1 Proposed Sunbury South Employment Area
This area is proposed to accommodate 100ha of industrial or employment land in Sunbury South on the east
side of Sunbury Road. The area will have good access to planned linkages to the planned Outer Metropolitan
Ring Road.
The planned scenario identifies a total of 192 hectares of industrial land which includes 100ha in this location.
Based on the analysis in this report this is considered appropriate.
In terms of structure of the area, there is merit in utilising the Sunbury Road frontage for showroom or bulky
goods retail uses (see discussion for G2 and G3 below) and facilitating core industrial activity within the non-
road frontage part of the precinct.
G2 Potential Bulky Goods (including Existing)
The full development scenario provides for around 48,000sqm of stand-alone bulky goods retail in Sunbury.
This relates to demand for the Greater Sunbury area and outside of other activity centres.
The land take for this activity is 12ha (best estimate at conventional density). At urban density the land take is
6ha.
This activity can be associated with retail centre uses and industrial or employment area uses. Some of the
activity can be expected to gravitate to an activity centre whereas some would gravi tate to industrial or
employment areas.
A potential model is for larger format and showroom style developments to locate along main road corridors
whereas higher density based activity to located within activity centres,
Alternatives -
The main consideration is location for this activity. Two potential locations are identified for designation as
specialised bulky goods and showroom precincts (i.e. non-centres based) in this assessment:
Land south of the existing industrial zoned land on Vineyard Road; and
Utilisation of the Sunbury Road frontage (east side) along the front of the proposed employment
precinct and potentially extending north along the road frontage to be adjacent to and integrated with
the potential Sunbury South SRAC.
There is merit in facilitating both precincts to stimulate choice and market competition.

Retail and Economic Assessment PSP74 and PSP75
M14037 P a g e 64 | 87
G3 Potential Showroom / Motor Vehicle Uses
The full development scenario provides for around 36,000sqm of showroom (mainly motor vehicle related)
activity in Greater Sunbury in addition to bulky goods retail.
The land take for this activity is 9ha (best estimate at conventional density). At urban density the land take is
5ha.
This activity can be associated with bulky goods and employment area uses:
Alternatives -
Like bulky goods, the two potential locations are:
Continuation of the existing Vineyard Road bulky goods / employment cluster to the south; and
Utilisation of the Sunbury Road frontage (east side) along the front of the proposed employment
precinct and potentially extending north along the road frontage to be adjacent to and integrated with
the potential Sunbury South SRAC.
There is merit in facilitating both precincts to stimulate choice and market competition.
G4 Proposed Diggers Rest Employment Area
This area has been nominated in the Diggers Rest PSP to focus on small / light industry and related
commercial uses covering 27.5 hectares.
H - Local Shop Nodes
Local shop nodes comprise around 500 – 2,500sqm of retail space – say 1,500sqm average - located in ‘gaps’
in the retail hierarchy. The provision of such facilities should be encouraged where possible.
Such nodes should be capped in size so as not to compromise the planned neighbourhood activity centre
system. Some locations are shown on the economic plan.
I - Home Based Business
Home based business could comprise business services, personal services, retail / wholesale trading
businesses or light industrial type businesses. The operation of such businesses should be encouraged
where possible. Potential locations are all residential areas.
J - Other Activities
This defines jobs not captured in the categories noted above and could include schools, higher education,
child care facilities and community services that are spread across urban areas.

Retail and Economic Assessment PSP74 and PSP75
M14037 P a g e 65 | 87
There is potential to re-use the former university site in Sunbury as a mixed use urban village incorporating an
activity centre. The area has historic buildings and sweeping views across Sunbury and beyond. It offers a
unique development opportunity for the town. The concept could be education and business activities
integrated with high density housing and retail and entertainment uses in an integrated urban village. The
area could have small business and creative industry spaces and be a generator of new job outcomes in the
area.
8.2 LOCATION AND DESIGN ISSUES
The main location and design issues that have been identified are as follows:
The location requirements for the B1 Potential Sunbury South SRAC and relationship to employment
land;
The location requirements for B2 Potential Lancefield Road SRAC and location in relation to
Lancefield Road and a potential future rail station;
The allocation of land and uses in the employment areas and proposed mixed use employment area
along Vineyard Road and relationship to Sunbury Town Centre; and
The location of the E2 Potential Sunbury South NAC.
Location and Design - B1 Potential Sunbury South SRAC
The Growth Corridor Plan nominates this centre for a location on the west side of Sunbury Road. This
position is supported by this report.
The position of the centre is nominally shown in this report. The centre could be moved up or down Sunbury
Road to some extent. Key considerations are as follows.
Distance from the Sunbury Town Centre – It is important to ensure that a good separation is made
between the main centres so catchments do no unnecessarily overlap. A mid-point location along
the Sunbury South frontage and at least 4 kilometres from the Town Centre is nominally shown in
this report. Furthermore, this area is generally flat as opposed to hilly terrain further north.
Internal Collector Road Capacity - The design of the centre should be structured around an internal
connector road that links through the middle of the Sunbury South cell 2 through to cell 3 (potentially
linking the potential NAC in Sunbury South) and to Vineyard Road. This concept is shown in
Precinct Structure Plan Guidelines (see Figure 25 below). This link should serve the cells and link
residential areas in Sunbury South to the proposed centre via the road. Similarly, a link into cell 1 of
Sunbury South would also be desirable to more or less connect with the link road. Without such
links, the catchment may be insufficient to support the centre of the size nominated in this report.
Land Use Configuration - The centre could have frontage onto Sunbury Road for exposure reasons,
which would benefit some main road seeking businesses (see below). However most pedestrian
focused activity should be positioned along the internal connector link so as to promote a high
amenity pedestrian environment. The centre should be fully integrated and offer the capacity for

Retail and Economic Assessment PSP74 and PSP75
M14037 P a g e 66 | 87
customers to park in zones and walk to numerous businesses without having to drive for multiple
purposes.
Surrounding Land Uses – Higher density housing is an appropriate supporting land use that could be
delivered around and within the centre.
Relationship to Industrial Uses – This centre would not have any significant functional relationship
with, or need to be located near, the proposed industrial area in Sunbury South. The uses and
activities are effectively separate.
Main Road Business Uses – The Sunbury Road frontage on both the east and west sides could be
designed to accommodate main road business uses. The uses could include offices, showrooms
and bulky goods retail uses. Such uses could bleed into the frontage of the proposed industrial area
and take advantage of the main road location.
Figure 25 - Precinct Structure Plan Guidance for Centre Location
Source: MPA
Location and Design - B2 Potential Lancefield Road SRAC
A similar model for this sub-regional centre is proposed in this report. The centre could be structured around
an east-west internal connector link from Lancefield Road and be structured along that link but with frontage to
Lancefield Road and elongated to connect with a future rail station. The distance between Lancefield Road
and the rail line is approximately 600 metres.
Key considerations are as follows.
Distance from the Sunbury Town Centre - As discussed above, the nominal location is at least 4
kilometres from the Town Centre.
Internal Collector Road Capacity - The centre will require east-west links to be established through
all three cells of this PSP area to ensure the catchment is sufficient to support the centre of the size
nominated in this report. This centre will also draw from northern and southern trade along the
existing Lancefield Road corridor.

Retail and Economic Assessment PSP74 and PSP75
M14037 P a g e 67 | 87
Land Use Configuration - This centre could have frontage onto Lancefield Road for exposure
reasons, which would benefit some main road seeking businesses. However most pedestrian
focused activity can be positioned along the internal east-west connector link – near but not
necessarily on Lancefield Road - so as to promote a high amenity pedestrian environment. The rail
station can also be utilised for community uses, offices and some associated retail ac tivity. The core
retail offer could be positioned off the Lancefield Road junction. The rationale for this approach is
based on the fact that road networks mainly define retail activity.
Surrounding Land Uses – Higher density housing is an appropriate supporting land use that could be
delivered around and within the centre.
Main Road Business Uses – The Lancefield Road frontage could also be designed to accommodate
main road business uses like offices, showrooms and bulky goods retail uses. This could also
include the east side.
Further Assessment – As noted above, the suggested sizing and location this centre is subject to
further assessment of the creek crossing, rail line crossing and train station location.
Location and Design – Industrial and Mixed Use Areas
The total planned allocation of industrial, bulky goods and mixed use employment land (outside of activity
centres) is shown in Table 13 of this report as 238ha. Of this sum, about 110ha is earmarked for the
proposed mixed use precinct along the Vineyard Road corridor.
Potential of Mixed Use Employment Areas – The Vineyard Road area is nominated to accommodate
commercial / office and other employment uses in the Growth Corridor Plan. This report also
suggests that a similar type of precinct be considered for the Sunbury Road frontage near the
proposed sub-regional activity centre and along the Sunbury South industrial area frontage. This
report calculates that in total Greater Sunbury mat need only 33ha of such land between the two
precincts. This was calculated as follows:
o About 21ha of land will be absorbed outside of activity centres for bulky goods and
showroom uses;
o Office floorspace will be around 195,000sqm at the high end (or target scenario) and this
may consume around 24ha of land (at a 0.8 site coverage ratio);
o Office activity is assumed to be able to be accommodated within activity centres however
the reality is some will be located out of centre. Assuming half is located out of centre it
would mean that up to 12ha office may seek an out of centre location is Sunbury;
o Therefore the total out of centre mixed use allocation is 33ha for office, bulky goods and
showroom uses; and
o This means that the 110ha allocation for the Vineyard Road precinct should be re-
examined, with potentially only a portion being required for employment uses.
Potential Re-use of Industrial Land Near the Sunbury Town Centre - Of the proposed future
industrial land component, about 74ha is above the base Greater Sunbury need (i.e. 192ha planned
Retail and Economic Assessment PSP74 and PSP75
M14037 P a g e 68 | 87
versus 118ha base need). There is scope to investigate whether some land (within this 74ha
margin) can be better utilised for other economic and activity centre uses in particular land near the
Sunbury Town Centre.
Suggested Profile of Industrial Land - The suggested profile of industrial land is shown earlier in this
report – refer to Table 28 for details.
Location and Design - E2 Potential Sunbury South NAC
A consideration regarding this centre is location. The centre could be located either on the east or west side
of the rail line.
Either option is possible however a west side position would require a good connection to the east side given
the bulk of the nominal catchment is located to the east. Another consideration is use of the land between the
rail line and Vineyard Road. As noted above, this section of land may in full or part be used for employment
purposes.
As the primary purpose of this centre is to serve a residential catchment, which is mainly on the east side of
the rail line, it is recommended that this centre be positioned on the east side of the rail line and potentially
integrated with a future passenger rail station. As noted above, the optimal location of E2 is subject to further
assessment of terrain, buffers, drainage, future potential railway station locations, creek crossing and railway
line crossing matters.

Retail and Economic Assessment PSP74 and PSP75
M14037 P a g e 69 | 87
9. SUNBURY SOUTH PSP The recommended economic plan for the Sunbury South PSP is as follows. This is designed to fit the overall
Greater Sunbury economic structure as shown earlier in this report.
Figure 26 shows an indicative spatial concept for the economic plan.
The main features are:
Potential Sunbury South SRAC – located on the west side of Sunbury Road;
Potential Sunbury South NAC – located on the east side of the rail line in the growth area;
Proposed Sunbury South Employment Area – as shown in the Growth Corridor Plan on the east side
of Sunbury Road;
Potential Bulky Goods - potentially on both the Sunbury Road and Vineyard Road corridors;
Potential Showroom / Motor Vehicle Uses – potentially on both the Sunbury Road and Vineyard
Road corridors;
Local Shop Nodes – potentially 4 nodes located in gaps of the activity centre system outside of the 1
kilometre zone of planned centres;
Home Based Business; and
Other Activities - such as schools, child care facilities and other services.
Table 36 shows the details for each element of the economic plan. This provides rounded estimates for
floorspace, jobs and site area – and where necessary ranges - based on the analysis shown in the previous
report sections.
This plan is indicative and subject to the qualifications and assumptions noted throughout this report.

Retail and Economic Assessment PSP74 and PSP75
M14037 P a g e 70 | 87
Figure 26 - Sunbury South PSP Economic Plan (Indicative Locations Shown)
Note: This plan is indicative and has been developed for the purpose of assisting with planning the size and location of activities in the PSP area.

Retail and Economic Assessment PSP74 and PSP75
M14037 P a g e 71 | 87
Sunbury South PSP Economic Plan at Full Development Table 36 -
Note: Retail floorspace caps required for retail floorspace.
Note: This plan is indicative and has been developed for the purpose of assisting with planning the size and location of activities in the PSP area.
Specific Centre / LocationRetail
Floorspace
Major Bulky
Goods
Office
Floorspace
Community
Services
Floorspace
Industrial
Floorspace
Showroom
Floorspace
Total
Floorspace
(Rounded)
Estimated Jobs
(Rounded)
Site Area
Estimate
sqm sqm sqm sqm sqm sqm sqm no. ha
1-2 discount department stores 6,000 – 10,000sqm
2-3 supermarkets 3,000 – 4,500sqm
3-4 mini-majors 400 – 800sqm
40 - 80 specialty stores 80 -100sqm
1 full-line supermarket 3,000 – 4,500sqm
1 mini major 400-800sqm
20 specialty stores 80 -100sqm
G1 Proposed Sunbury South Employment AreaLocal Shop
PotentialConvenience Stores 80-400sqm
Potentially on
Sunbury Road
Frontage
Subject to
DemandNA 400,000
Potentially on
Sunbury Road
Frontage
400,000 5,000 100
G2 Potential Bulky Goods (including Existing)Local Shop
PotentialConvenience Stores 80-400sqm 48,000
Subject to
DemandNA
Subject to
Demand
Subject to
Demand48,000 960 12
G3 Potential Showroom / Motor Vehicle UsesLocal Shop
PotentialConvenience Stores 80-400sqm
Subject to
Demand
Subject to
DemandNA
Subject to
Demand36,000 36,000 400 9
1 grocery store / small
supermarket
1,500sqm major
approx.
<10 specialty stores 80 -100sqm
Home Based Business - - - - - - - 550 -
Other Activities - - - - -
Non Centres
Based
Education and
Other Services
- - 3,000 to 3,700 -
NA1,500 / Node
(approx.)140 0.5 / Node
NA 6,000 to10,000 200 to 4001.5 (range 0.8 to
2.5)
NA
NA5,000E2 Potential Sunbury South NAC 600 to 3,200 350 to 1,900 NA
Local Shop Nodes 4 Nodes NASubject to
Demand
Subject to
Demand
Potential Future Conditions Scenario
Indicative Retail Profile
32,000B1 Potential Sunbury South SRACSubject to
Demand6,400 to 32,000 41,000 to 80,000 1,500 to 3,200
10 (range 5 to
20)
Guide Only
3,200 to 16,000 NASubject to
Demand

Retail and Economic Assessment PSP74 and PSP75
M14037 P a g e 72 | 87
10. LANCEFIELD ROAD PSP The recommended economic plan for the Lancefield Road PSP is as follows. This is designed to fit the overall
Greater Sunbury economic structure as shown earlier in this report.
Figure 27 shows an indicative spatial concept for the economic plan.
The main features are:
Potential Lancefield Road SRAC – located on the west side of Lancefield Road between the
Lancefield Road frontage connecting to a rail station;
Potential Lancefield Road NAC – located on the east side of Lancefield Road;
Local Shop Nodes – potentially 1 node located in a gap of the activity centre system outside of the 1
kilometre zone of planned centres;
Home Based Business; and
Other Activities - such as schools, child care facilities and other services.
Table 36 shows the details for each element of the economic plan. This provides rounded estimates for
floorspace, jobs and site area – and where necessary ranges - based on the analysis shown in the previous
report sections.
This plan is indicative and subject to the qualifications and assumptions noted throughout this report.

Retail and Economic Assessment PSP74 and PSP75
M14037 P a g e 73 | 87
Figure 27 - Lancefield Road PSP Economic Plan (Indicative Locations Shown)
Note: This plan is indicative and has been developed for the purpose of assisting with planning the size and location of activities in the PSP area.

Retail and Economic Assessment PSP74 and PSP75
M14037 P a g e 74 | 87
Lancefield Road PSP Economic Plan at Full Development Table 37 -
Note: Retail floorspace caps required for retail floorspace.
Note: This plan is indicative and has been developed for the purpose of assisting with planning the size and location of activities in the PSP area.
Specific Centre / LocationRetail
Floorspace
Major Bulky
Goods
Office
Floorspace
Community
Services
Floorspace
Industrial
Floorspace
Showroom
Floorspace
Total
Floorspace
(Rounded)
Estimated Jobs
(Rounded)
Site Area
Estimate
sqm sqm sqm sqm sqm sqm sqm no. ha
1-2 discount department stores 6,000 – 10,000sqm
2-3 supermarkets 3,000 – 4,500sqm
3-4 mini-majors 400 – 800sqm
40 - 80 specialty stores 80 -100sqm
1 full-line supermarket 3,000 – 4,500sqm
1 mini major 400-800sqm
20 specialty stores 80 -100sqm
1 grocery store / small
supermarket
1,500sqm major
approx.
<10 specialty stores 80 -100sqm
Home Based Business - - - - - - - 400 -
Other Activities - - - - -
Non Centres
Based
Education and
Other Services
- - 600 to 1,300 -
NA NA 1,800 (approx.) 60 0.5
NA NA 6,000 to 10,000 200 to 4001.5 (range 0.8 to
2.5)
Local Shop Nodes 1 Node NASubject to
Demand
Subject to
Demand
NASubject to
Demand32,000 to 63,000 1,100 to 2,500 8 (range 4 to 16)
E1 Potential Lancefield Road NAC 5,000 NA 600 to 3,200 350 to 1,900
Potential Future Conditions Scenario
Indicative Retail Profile
Guide Only
B2 Potential Lancefield Road SRAC 25,000Subject to
Demand5,000 to 25,000 2,500 to 12,500

Retail and Economic Assessment PSP74 and PSP75
M14037 P a g e 75 | 87
11. CONCLUSION This report provides an economic plan for the Sunbury South PSP area and Lancefield Road PSP area in the
context of Greater Sunbury. The economic plan has the following economic elements noted as A to J.
Activity Type Specific Centre / Location
A Existing Regional Activity Centre A1 Sunbury Town Centre
B Potential Sub-Regional Activity Centre B1 Potential Sunbury South SRAC
B2 Potential Lancefield Road SRAC
C Existing Neighbourhood Activity Centre C1 Gap Road Aldi Centre
C2 Goonawarra Local Centre
D Proposed Neighbourhood Activity Centre D1 Proposed Racecourse Road NAC
D2 Proposed Elizabeth Avenue NAC
D3 Proposed Diggers Rest NAC
E Potential Neighbourhood Activity Centre E1 Potential Lancefield Road NAC
E2 Potential Sunbury South NAC
E3 Potential Sunbury West NAC
E4 Potential Sunbury North NAC
F Existing Industrial / Employment Area F1 Existing Sunbury Industrial / Employment Area
G Proposed Industrial / Employment Area G1 Proposed Sunbury South Employment Area
G2 Potential Bulky Goods (including Existing)
G3 Potential Showroom / Motor Vehicle Uses
G4 Proposed Diggers Rest Employment Area
H Local Shop Nodes Some Locations Shown (in and around PSP Areas)
I Home Based Business Locations Not Shown
J Other Activities Locations Not Shown
D3 Proposed Diggers Rest NAC
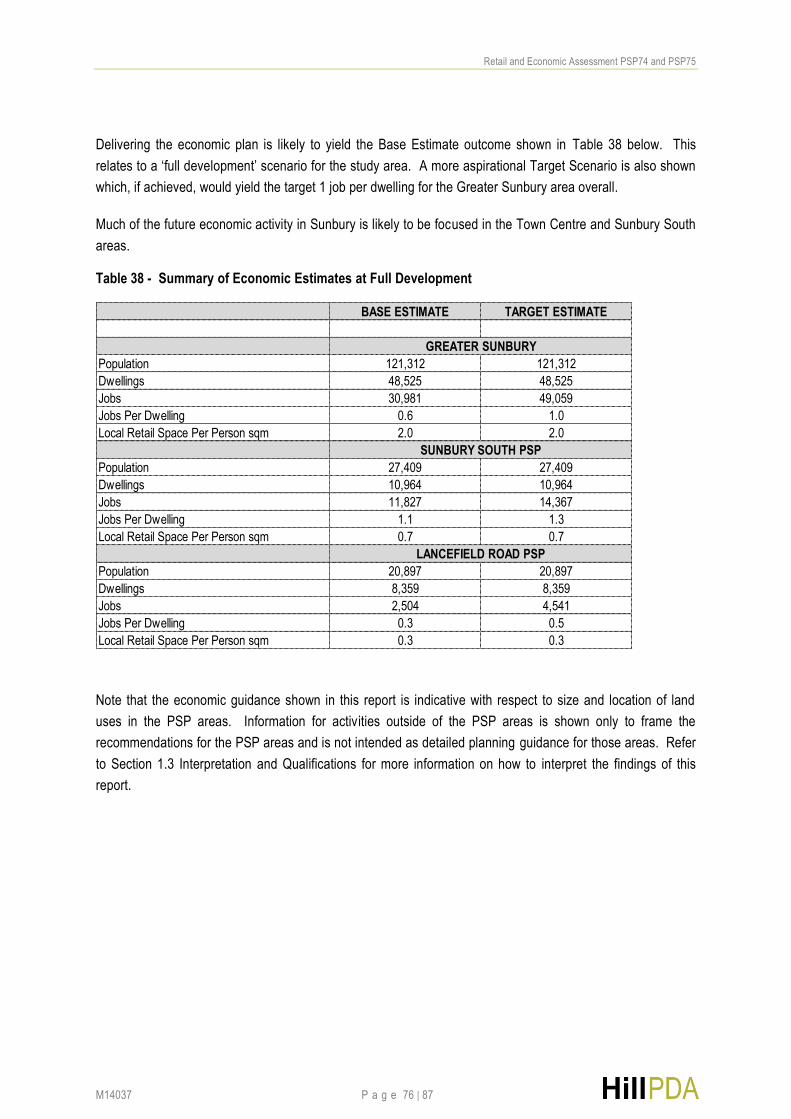
Retail and Economic Assessment PSP74 and PSP75
M14037 P a g e 76 | 87
Delivering the economic plan is likely to yield the Base Estimate outcome shown in Table 38 below. This
relates to a ‘full development’ scenario for the study area. A more aspirational Target Scenario is also shown
which, if achieved, would yield the target 1 job per dwelling for the Greater Sunbury area overall.
Much of the future economic activity in Sunbury is likely to be focused in the Town Centre and Sunbury South
areas.
Summary of Economic Estimates at Full Development Table 38 -
Note that the economic guidance shown in this report is indicative with respect to size and location of land
uses in the PSP areas. Information for activities outside of the PSP areas is shown only to frame the
recommendations for the PSP areas and is not intended as detailed planning guidance for those areas. Refer
to Section 1.3 Interpretation and Qualifications for more information on how to interpret the findings of this
report.
BASE ESTIMATE TARGET ESTIMATE
Population 121,312 121,312
Dwellings 48,525 48,525
Jobs 30,981 49,059
Jobs Per Dwelling 0.6 1.0
Local Retail Space Per Person sqm 2.0 2.0
Population 27,409 27,409
Dwellings 10,964 10,964
Jobs 11,827 14,367
Jobs Per Dwelling 1.1 1.3
Local Retail Space Per Person sqm 0.7 0.7
Population 20,897 20,897
Dwellings 8,359 8,359
Jobs 2,504 4,541
Jobs Per Dwelling 0.3 0.5
Local Retail Space Per Person sqm 0.3 0.3
GREATER SUNBURY
SUNBURY SOUTH PSP
LANCEFIELD ROAD PSP

Retail and Economic Assessment PSP74 and PSP75
M14037 P a g e 77 | 87
12. IMPLEMENTATION This report identifies the suggested economic plan for the two PSP areas subject to this report. Important
implementation considerations are noted below.
It is recommended that the Target Scenario shown in this report be used to guide the planning process. This
scenario strives to achieve 1 job per dwelling in the long term.
This report shows one way of striving for this target. Planning agencies should work with developers and
businesses to strive for the target, Alternative directions (to those shown in this report) should be considered
where necessary.
The economic plan in this report works to a full development scenario of 120,000 residents. There are
however development capacity and timing uncertainty risks associated with this population yield and this plan.
It is therefore recommended that the planning process adopt recommendations based on thresholds of
development as follows.
Stage 1 – approximately 70,000 residents.
Stage 2 – approximately 100,000 residents.
Stage 3 – full development of approximately 120,000 residents.
The activity centre system is integral to the delivery of the economic plan. It is therefore recommended that
retail floorspace caps be used for all centres in the hierarchy (excluding the Sunbury Town Centre) so as to
give effect to the intended hierarchy in this plan. The caps should be based on the stages noted above, and
thus the initial caps should be linked to achieve a population threshold of 70,000 residents. Changes to caps
should be considered when the threshold population is achieved.
This report has concluded that there is capacity to review the quantum of land allocation for industrial and
mixed use employment uses along the Vineyard Road Corridor. The future direction of that area should be re-
examined, with potentially only a portion being required for employment uses.
Many of the recommendations in this report are based on estimates of land, dwelling and population yield.
There is capacity to refine recommendations and directions as more information on those elements becomes
available. It is recommended that this refinement process be undertaken as the planning process evolves.

Retail and Economic Assessment PSP74 and PSP75
M14037 P a g e 78 | 87
APPENDICES
APPENDIX 1 - STUDY AREA IMAGES
Sunbury South
Towards the proposed employment area, the land on either side of Sunbury Road is relatively flat. Land
begins to undulate and appears to be steep towards Jacksons Creek. East of Sunbury Road is similar and
becomes undulating towards the quarry.

Retail and Economic Assessment PSP74 and PSP75
M14037 P a g e 79 | 87
Lancefield Road
The topography on both sides of Lancefield Road is relatively flat. The western side of Lancefield road has
notable amounts of detached residential housing up until Rawes Road.

Retail and Economic Assessment PSP74 and PSP75
M14037 P a g e 80 | 87
Sunbury
The images below show the type of retail space available on Evans Street in Sunbury. The quality and layout
of shops are typical and comprise a mixture of cafes, restaurants and shopfront retail. The train station is also
located off Evans Street.

Retail and Economic Assessment PSP74 and PSP75
M14037 P a g e 81 | 87
Industrial Precinct
The industrial area accommodates car yards and bulky goods on Vineyard Road and Horne Street. Users of
the bulky goods area includes AutoBahn, Beaurepairs, PJ Pet Warehouse. There is some newly developed
bulky goods / retail establishments adjacent to the petrol station on Horne Street. The area is predominantly
developed however there are some vacant sites available.

Retail and Economic Assessment PSP74 and PSP75
M14037 P a g e 82 | 87
Former University
The former university site is elevated in comparison to the rest of Sunbury. As shown in the panoramic photo
below, the elevation provides the area with sweeping views across the landscape. There are some new
townhouse developments on Heights Road which benefits from such views. The university precinct
accommodates heritage buildings.

Retail and Economic Assessment PSP74 and PSP75
M14037 P a g e 83 | 87
APPENDIX 2 – GREATER SUNBURY RETAIL THRESHOLDS MODEL
Basis for Sub-Regional and Neighbourhood Centre Size Guidance
Potential Sunbury South Sub-Regional Activity Centre
At full development, this centre is assumed to capture:
100% of sub-regional level space generated from within the three Sunbury South cells, being approximately 12,700sqm;
100% of sub-regional level space generated from within Diggers Reset, being approximately 6,500sqm;
60% of sub-regional level space generated from within the Township area, being approximately 10,200sqm; and
50% of sub-regional level space generated from within Sunbury West, being approximately 2,000sqm.
OR
Average Centre Size na 70,000 40,000 25,000 3,500 7,000
Average RTD $6,500 $6,500 $3,500 $7,500 $8,500 $8,500 $8,500
Average Required Turnover na $455,000,000 $140,000,000 $187,500,000 $29,750,000 $59,500,000
Average Retail Expenditure Per Capita $13,834
Percent Capture of Retail Expenditure 100% 10% 35% 10% 25% 20% 20% 20%
Population Households
Total
Expenditure Turnover Floorspace Turnover
No. of Centres
of Average Size Floorspace Turnover
No. of Centres
of Average Size Floorspace Turnover
No. of Centres
of Average Size Floorspace Turnover
No. of Centres
of Average Size Floorspace Turnover
No. of Centres
of Average Size Floorspace
Total
Floorspace
Generated from
Area Across
Retail System FSPP
2.9
Sunbury South
SS1 3,678 1,268 $50,886,640 $5,088,664 783 $17,810,324 0.04 2,740 $5,088,664 0.04 1,454 $12,721,660 0.07 1,696 $10,177,328 0.34 1,197 $10,177,328 0.17 1,197 7,870 2.1
SS2 20,282 6,994 $280,582,053 $28,058,205 4,317 $98,203,718 0.22 15,108 $28,058,205 0.20 8,017 $70,145,513 0.37 9,353 $56,116,411 1.89 6,602 $56,116,411 0.94 6,602 43,396 2.1
SS3 3,449 1,189 $47,711,737 $4,771,174 734 $16,699,108 0.04 2,569 $4,771,174 0.03 1,363 $11,927,934 0.06 1,590 $9,542,347 0.32 1,123 $9,542,347 0.16 1,123 7,379 2.1
Total Sunbury South 27,409 9,451 $379,180,429 $37,918,043 5,834 $132,713,150 0.29 20,417 $37,918,043 0.27 10,834 $94,795,107 0.51 12,639 $75,836,086 2.55 8,922 $75,836,086 1.27 8,922 58,646 2.1
Lancefield Road 0
LR1 5,438 1,875 $75,227,563 $7,522,756 1,157 $26,329,647 0.06 4,051 $7,522,756 0.05 2,149 $18,806,891 0.10 2,508 $15,045,513 0.51 1,770 $15,045,513 0.25 1,770 11,635 2.1
LR2 3,953 1,363 $54,678,885 $5,467,889 841 $19,137,610 0.04 2,944 $5,467,889 0.04 1,562 $13,669,721 0.07 1,823 $10,935,777 0.37 1,287 $10,935,777 0.18 1,287 8,457 2.1
LR3 11,507 3,968 $159,186,109 $15,918,611 2,449 $55,715,138 0.12 8,572 $15,918,611 0.11 4,548 $39,796,527 0.21 5,306 $31,837,222 1.07 3,746 $31,837,222 0.54 3,746 24,621 2.1
Total Lancefield Road 20,897 7,206 $289,092,557 $28,909,256 4,448 $101,182,395 0.22 15,567 $28,909,256 0.21 8,260 $72,273,139 0.39 9,636 $57,818,511 1.94 6,802 $57,818,511 0.97 6,802 44,712 2.1
Other Areas 0
Township (Existing) 36,664 12,643 $507,208,157 $50,720,816 7,803 $177,522,855 0.39 27,311 $50,720,816 0.36 14,492 $126,802,039 0.68 16,907 $101,441,631 3.41 11,934 $101,441,631 1.70 11,934 78,447 2.1
Sunbury West 8,489 2,927 $117,443,631 $11,744,363 1,807 $41,105,271 0.09 6,324 $11,744,363 0.08 3,356 $29,360,908 0.16 3,915 $23,488,726 0.79 2,763 $23,488,726 0.39 2,763 18,164 2.1
Sunbury North 13,817 4,764 $191,145,035 $19,114,504 2,941 $66,900,762 0.15 10,292 $19,114,504 0.14 5,461 $47,786,259 0.25 6,372 $38,229,007 1.29 4,498 $38,229,007 0.64 4,498 29,563 2.1
Diggers Rest 14,035 4,840 $194,162,127 $19,416,213 2,987 $67,956,744 0.15 10,455 $19,416,213 0.14 5,547 $48,540,532 0.26 6,472 $38,832,425 1.31 4,569 $38,832,425 0.65 4,569 30,030 2.1
Total Other Areas 73,006 25,174 $1,009,958,950 $100,995,895 15,538 $353,485,632 0.78 54,382 $100,995,895 0.72 28,856 $252,489,737 1.35 33,665 $201,991,790 6.79 23,764 $201,991,790 3.39 23,764 156,205 2.1
0
Total Greater Sunbury 121,312 41,832 $1,678,231,936 $167,823,194 25,819 $587,381,177 1.29 90,366 $167,823,194 1.20 47,949 $419,557,984 2.24 55,941 $335,646,387 11.28 39,488 $335,646,387 5.64 39,488 259,564 2.1
TotalExternal Regional Centre (DS) Sub-Regional Centre (DDS) Small Neighbourhood Centre (SM) Large Neighbourhood Centre (SM)Bulky Goods

Retail and Economic Assessment PSP74 and PSP75
M14037 P a g e 84 | 87
The total is rounded to 32,000sqm sub-regional space at full development.
It should be noted that in reality there will be sub-regional escape from all of the nominated areas noted above and there will be sub-regional capture from other areas,
including from the south. On balance however the numbers shown here provide a guide to the base level of space that can be supported from the local area to the
nearest centre in the hierarchy.
Potential Lancefield Road Sub-Regional Activity Centre
At full development, this centre is assumed to capture:
100% of sub-regional level space generated from within the three Lancefield Road cells, being approximately 9,600sqm;
100% of sub-regional level space generated from within Sunbury North, being approximately 6,400sqm;
40% of sub-regional level space generated from within the Township area, being approximately 6,800sqm; and
50% of sub-regional level space generated from within Sunbury West, being approximately 2,000sqm.
The sub-total of the Lancefield Road cells and Sunbury North is approximately 16,000sqm of sub-regional space. In order for the centre to be bigger, it would need to
draw from the Township and Sunbury West as noted above this is contingent on road and bridge connections. The additional supportable sub-regional space from the
Township and Sunbury West is approximately 8,800sqm. The total is rounded to 25,000sqm sub-regional space at full development assuming development of
connections.
It should be noted that in reality there will be sub-regional escape from all of the nominated areas noted above and there will be sub-regional capture from other areas,
including from the north outside of the study area such as from Macedon Ranges. On balance however the numbers shown here provide a guide to the base level of
space that can be supported from the local area to the nearest centre in the hierarchy.

Retail and Economic Assessment PSP74 and PSP75
M14037 P a g e 85 | 87
Neighbourhood Centres
The floorspace allocated to neighbourhood centres is apportioned across potential locations based on average neighbourhood centre sizes. In reality some may be bigger
and some smaller than shown. The detail of such variations is contingent of the final outcome of local area catchment charac teristics including population yields and road
networks. More detailed analysis should be undertaken for each potential centre as more information becomes available in the planning process.

Retail and Economic Assessment PSP74 and PSP75
M14037 P a g e 86 | 87
APPENDIX 3 – SELECTED RATIOS
Adopted Floorspace Ratios (SQM / Job)
Retail 30
Bulky Goods Retail 50
Office 20
Community Services 30
Industrial 80
Showroom 88
Adopted Site Coverage Ratios (Floorspace as a % of Site Area)
Conventional 40.0%
Urban 80.0%
Other Assumptions
Local Shop Nodes Capture of Retail Space 2.0%
Home Based Business per Dwelling 5.0%
Other Jobs Not Counted in Economic Plan 35.0%

Retail and Economic Assessment PSP74 and PSP75
M14037 P a g e 87 | 87
DISCLAIMER
1. This report is for the confidential use only of the party to whom it is addressed ("Client") for the specific
purposes to which it refers and has been based on, and takes into account, the Client’s specific instructions. It
is not intended to be relied on by any third party who, subject to paragraph 3, must make their own enquiries in
relation to the issues with which this report deals.
2. Hill PDA makes no representations as to the appropriateness, accuracy or completeness of this report for the
purpose of any party other than the Client ("Recipient"). Hill PDA disclaims all liability to any Recipient for any
loss, error or other consequence which may arise as a result of the Recipient acting, relying upon or using the
whole or part of this report's contents.
3. This report must not be disclosed to any Recipient or reproduced in whole or in part, for any purpose not
directly connected to the project for which Hill PDA was engaged to prepare the report, without the prior written
approval of Hill PDA. In the event that a Recipient wishes to rely upon this report, the Recipient must inform Hill
PDA who may, in its sole discretion and on specified terms, provide its consent.
4. This report and its attached appendices are based on estimates, assumptions and information provided by the
Client or sourced and referenced from external sources by Hill PDA. While we endeavour to check these
estimates, assumptions and information, no warranty is given in relation to their reliability, feasibility, accuracy
or reasonableness. Hill PDA presents these estimates and assumptions as a basis for the Client’s
interpretation and analysis. With respect to forecasts, Hill PDA does not present them as results that will
actually be achieved. Hill PDA relies upon the interpretation of the Client to judge for itself the likelihood of
whether these projections can be achieved or not.
5. Due care has been taken to prepare the attached financial models from available information at the time of
writing, however no responsibility can be or is accepted for errors or inaccuracies that may have occurred
either with the programming or the resultant financial projections and their assumptions.
6. This report does not constitute a valuation of any property or interest in property. In preparing this report Hill
PDA has relied upon information concerning the subject property and/or proposed development provided by the
Client and Hill PDA has not independently verified this information except where noted in this report.
7. In relation to any valuation which is undertaken for a Managed Investment Scheme (as defined by the
Managed Investments Act 1998) or for any lender that is subject to the provisions of the Managed Investments
Act, the following clause applies:
This valuation is prepared on the assumption that the lender or addressee as referred to in this valuation report
(and no other) may rely on the valuation for mortgage finance purposes and the lender has complied with its
own lending guidelines as well as prudent finance industry lending practices, and has considered all prudent
aspects of credit risk for any potential borrower, including the borrower’s ability to service and repay any
mortgage loan. Further, the valuation is prepared on the assumption that the lender is providing mortgage
financing at a conservative and prudent loan to value ratio.