Prepared For By - KWG...
68
NI43-101 Technical Report – Koper Lake Project i National Instrument 43-101Technical Report Koper Lake Project McFauld’s Lake Area, Ontario, Canada Porcupine Mining Division, NTS 43D16 Geology Technical Report Prepared For KWG Resources Inc. By Alan Aubut P.Geo. August 29, 2013 PO Box 304, Nipigon, Ontario, P0T 2J0 Tel: (807) 887-2300 Email: [email protected]
Transcript of Prepared For By - KWG...

NI43-101 Technical Report – Koper Lake Project
i
National Instrument 43-101Technical Report
Koper Lake Project McFauld’s Lake Area, Ontario, Canada
Porcupine Mining Division, NTS 43D16
Geology Technical Report
Prepared For
KWG Resources Inc.
By
Alan Aubut P.Geo.
August 29, 2013
PO Box 304, Nipigon, Ontario, P0T 2J0 Tel: (807) 887-2300 Email: [email protected]

NI43-101 Technical Report – Koper Lake Project
ii

NI43-101 Technical Report – Koper Lake Project
iii
Table of Contents
Table of Contents ....................................................................................................................... iii
List of Figures .............................................................................................................................. v
List of Tables .............................................................................................................................. vi
1. Summary..............................................................................................................................1
1.1. Cautionary Note ............................................................................................................2
2. Introduction .........................................................................................................................3
3. Reliance on Other Experts ....................................................................................................3
4. Property Description and Location .......................................................................................3
4.1. Property History and Underlying Agreements ...............................................................3
4.2. Parties to the Agreements ............................................................................................7
5. Accessibility, Climate, Local Resources, Infrastructure and Physiography .............................8
5.1. Accessibility ..................................................................................................................8
5.2. Climate .........................................................................................................................8
5.3. Local resources .............................................................................................................8
5.4. Infrastructure ................................................................................................................9
5.5. Physiography ................................................................................................................9
6. History ...............................................................................................................................10
6.1. General .......................................................................................................................10
6.2. Discovery history.........................................................................................................11
7. Geological Setting and Mineralization ................................................................................12
7.1. Regional geology .........................................................................................................12
7.1.1. Precambrian Basement Complex .........................................................................12
7.1.2. Paleozoic Platform Rocks .....................................................................................13
7.1.3. Quaternary Cover ................................................................................................13
7.2. Local Geology ..............................................................................................................13
7.2.1. Volcanics ..............................................................................................................14
7.2.2. Ultramafic Rocks ..................................................................................................14
7.2.3. Felsic Intrusive Rocks ...........................................................................................14
7.2.4. Faulting ................................................................................................................14
7.3 Mineralisation .............................................................................................................15
7.3.1 Chromite Mineralization ......................................................................................15
8. Deposit Types ....................................................................................................................15
9. Exploration.........................................................................................................................15
10. Drilling ...............................................................................................................................19
10.1 2008 and 2010 Drilling ................................................................................................19
10.2 2013 Drilling ................................................................................................................19
11. Sample Preparation, Analyses and Security ........................................................................20
11.1. QA/QC Procedure .......................................................................................................20
12. Data Verification ................................................................................................................22
13. Mineral Processing and Metallurgical Testing ....................................................................22

NI43-101 Technical Report – Koper Lake Project
iv
14. Mineral Resource and Mineral Reserve Estimates ..............................................................23
14.1. Mineral Resource Estimation ......................................................................................23
14.1.1. Resource Estimation Methodology ......................................................................23
14.1.1.1. Software Used and Data Validation ...............................................................23
14.1.1.2. Geological Domains ......................................................................................23
14.1.1.3. Drill Hole Database .......................................................................................24
14.1.1.4. Sample Selection...........................................................................................25
14.1.1.5. Compositing ..................................................................................................26
14.1.1.6. Exploratory Data Analysis .............................................................................26
14.1.1.7 Unfolding ......................................................................................................27
14.1.1.8 Grade Variography ........................................................................................28
14.1.1.9 Block Size Determination ..............................................................................28
14.1.1.10 Nearest Neighbour Block Model ...................................................................29
14.1.1.11 Ordinary Kriging Block Model ........................................................................30
14.1.1.12 Block Model Validation .................................................................................30
14.1.1.13 Model Verification ........................................................................................31
14.2. Mineral Resource Reporting ........................................................................................31
14.2.1. Resource Classification – Koper Lake Project chromite deposit ............................31
14.2.2. Risks and Opportunities .......................................................................................33
14.2.2.1. Risks..............................................................................................................33
14.2.2.2. Opportunities ...............................................................................................33
15. Mineral Reserve Estimates .................................................................................................33
16. Mining Methods.................................................................................................................33
17. Recovery Methods .............................................................................................................33
18. Project Infrastructure .........................................................................................................33
19. Market Studies and Contracts ............................................................................................33
20. Environmental Studies, Permitting and Social or Community Impact .................................34
21. Capital and Operating Costs ...............................................................................................34
22. Economic Analysis ..............................................................................................................34
23. Adjacent Properties ...........................................................................................................35
23.1. Noront Eagle 1, Eagle 2 and Blackbird deposits ...........................................................35
23.2. Big Daddy Chromite Deposit .......................................................................................36
23.3. Black Creek Chromite Deposit .....................................................................................36
23.4. Black Thor and Black Label Chromite Deposits ............................................................36
24. Other Relevant Data and Information ................................................................................37
25. Interpretation and Conclusions ..........................................................................................37
26. Recommendations .............................................................................................................38
27. References .........................................................................................................................39
Certificate of Qualifications .......................................................................................................41
Appendix 1 – Summary of Diamond Drilling ..............................................................................42
Appendix 2 – Exploratory Data Analysis ....................................................................................46
Histograms ............................................................................................................................46
Scatter Plots ..........................................................................................................................47
Appendix 3 – OK Search Parameters Used .................................................................................48

NI43-101 Technical Report – Koper Lake Project
v
Appendix 4 – Block Model Plans and Sections ...........................................................................49
NN Models Sample Plan views – Koper Lake Project chromite deposit ..................................49
-250 Elev. ...........................................................................................................................49
-500 Elev. ...........................................................................................................................49
-750 Elev. ...........................................................................................................................50
-1000 Elev. .........................................................................................................................50
OK Models: Sample Plan views - – Koper Lake Project chromite deposit ...............................51
-250 Elev. ...........................................................................................................................51
-500 Elev. ...........................................................................................................................51
-750 Elev. ...........................................................................................................................52
-1000 Elev. .........................................................................................................................52
NN Model – N-S Sample Sections ...........................................................................................53
– Koper Lake Project chromite deposit ...............................................................................53
Section 547450E Section 547550E ...............................................................................53
Section 547650E Section 547750E ...............................................................................54
Section 547850E Section 547950E ...............................................................................55
OK Models - N-S Sample Sections ..........................................................................................56
– Koper Lake Project chromite deposit ...............................................................................56
Section 547450E Section 547550E ...............................................................................56
Section 547650E Section 547750E ...............................................................................57
Section 547850E Section 547950E ...............................................................................58
Appendix 5 - Model Validation ..................................................................................................59
Swath Plots - Cr2O3 ...............................................................................................................59
UCSA 59
UCSB 59
UCSC 60
Appendix 6 – Resource Classification Definitions .......................................................................61
Inferred Mineral Resource .....................................................................................................61
Indicated Mineral Resource ...................................................................................................61
Measured Mineral Resource ..................................................................................................62
List of Figures
Figure 1 Map showing the location of the Koper Lake Project. ....................................................4
Figure 2 Claim map of the McFaulds's Lake Area (©Intierra Pty Ltd. 2013). .................................5
Figure 3 KWG-Bold Option Agreement Property Map (purple) as of August 18, 2013. .................6
Figure 4 Geological map of the Superior Province showing tectonic domains ...........................12
Figure 5 Map showing the Total Field Magnetic survey flown by Fugro in 2003.........................16
Figure 6 Map showing Channel 3 – Z off – AEM survey flown by AeroQuest in 2007. ................17
Figure 7 Map showing the Total Field Magnetic survey flown by AeroQuest in 2007. ................17
Figure 8 Map showing the Residual Bouguer Gravity survey completed in 2013 by Geosig. ......18

NI43-101 Technical Report – Koper Lake Project
vi
Figure 9 Comparison of Niton XRF readings and Lab Results for hole FN-10-25 (Armstrong,
2013).........................................................................................................................................21
Figure 10 Comparison of Niton XRF readings and Lab Results for hole FN-10-26 (Armstrong,
2013).........................................................................................................................................21
Figure 11 Isometric view of the Koper Lake Project geological domain used.............................24
Figure 12 Histogram of sample length. ....................................................................................25
Figure 13 Histogram of Cr2O3 for Koper Lake Project ................................................................27
Figure 14 Cr2O3 Tonnage-Grade curves for the Koper Lake Project chromite deposit. ...............32
Figure 15 Location of Koper Lake ProjectDeposit and adjacent discoveries. ..............................34
Figure 16 Plan of Koper Lake Project Diamond Drilling. .............................................................42
Figure 17 Sample cross section (547750E) for the Koper Lake Project. The orange line is a slice
through the mineral envelope used to select samples. ..............................................................43
List of Tables
Table 1 Claim status of the Koper Lake Project property (as of July 10, 2013). .............................4
Table 2 Summary Univariate Statistics.......................................................................................27
Table 3 Variogram Model Parameters. ......................................................................................29
Table 4 Sample file, Nearest Neighbour and OK model summary statistics. ...............................30
Table 5 Summary of Classification of In-Situ Resources, at different cut-offs, for the Koper Lake
Project chromite deposit ...........................................................................................................31
Table 6 Summary of Classification of In-Situ Resources for other chromite deposits in the area.
.................................................................................................................................................37
Table 7 Proposed Budget for Infill and Exploration drilling on the Koper Lake Project ...............38
Table 8 Drill Hole Collar Locations ............................................................................................44
NI43-101 Technical Report – Koper Lake Project
1
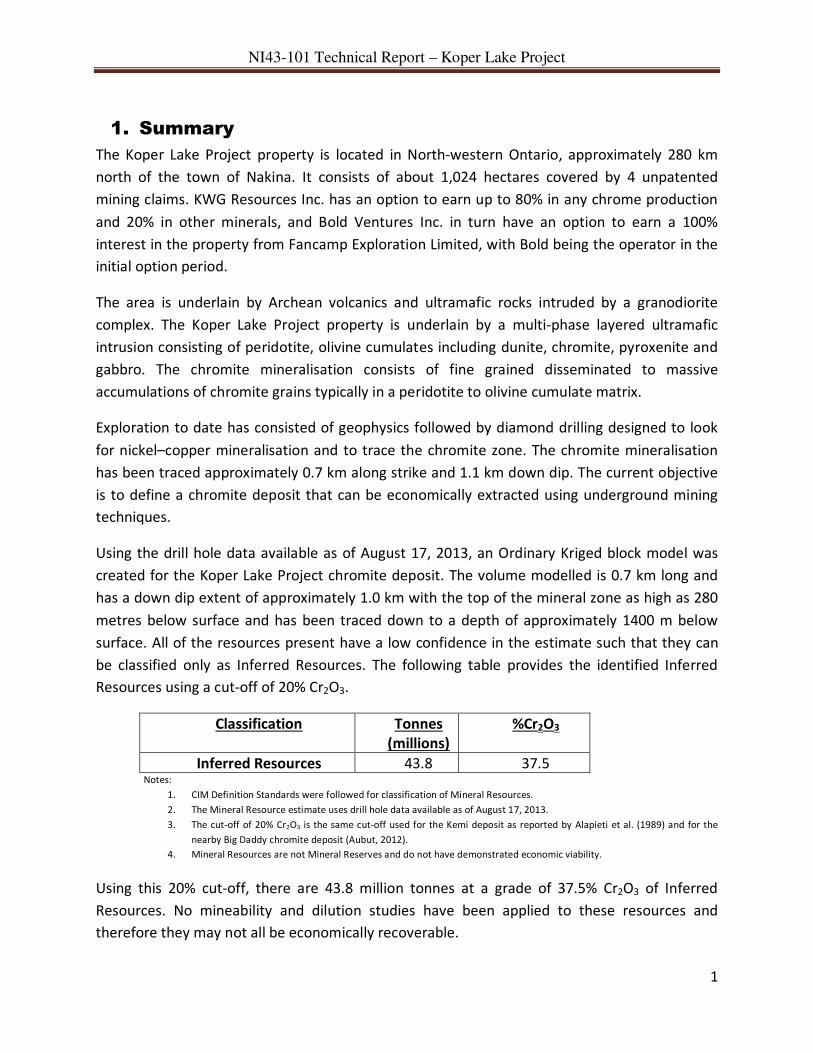
1. Summary
The Koper Lake Project property is located in North-western Ontario, approximately 280 km
north of the town of Nakina. It consists of about 1,024 hectares covered by 4 unpatented
mining claims. KWG Resources Inc. has an option to earn up to 80% in any chrome production
and 20% in other minerals, and Bold Ventures Inc. in turn have an option to earn a 100%
interest in the property from Fancamp Exploration Limited, with Bold being the operator in the
initial option period.
The area is underlain by Archean volcanics and ultramafic rocks intruded by a granodiorite
complex. The Koper Lake Project property is underlain by a multi-phase layered ultramafic
intrusion consisting of peridotite, olivine cumulates including dunite, chromite, pyroxenite and
gabbro. The chromite mineralisation consists of fine grained disseminated to massive
accumulations of chromite grains typically in a peridotite to olivine cumulate matrix.
Exploration to date has consisted of geophysics followed by diamond drilling designed to look
for nickel–copper mineralisation and to trace the chromite zone. The chromite mineralisation
has been traced approximately 0.7 km along strike and 1.1 km down dip. The current objective
is to define a chromite deposit that can be economically extracted using underground mining
techniques.
Using the drill hole data available as of August 17, 2013, an Ordinary Kriged block model was
created for the Koper Lake Project chromite deposit. The volume modelled is 0.7 km long and
has a down dip extent of approximately 1.0 km with the top of the mineral zone as high as 280
metres below surface and has been traced down to a depth of approximately 1400 m below
surface. All of the resources present have a low confidence in the estimate such that they can
be classified only as Inferred Resources. The following table provides the identified Inferred
Resources using a cut-off of 20% Cr2O3.
Classification Tonnes
(millions)
%Cr2O3
Inferred Resources 43.8 37.5 Notes:
1. CIM Definition Standards were followed for classification of Mineral Resources.
2. The Mineral Resource estimate uses drill hole data available as of August 17, 2013.
3. The cut-off of 20% Cr2O3 is the same cut-off used for the Kemi deposit as reported by Alapieti et al. (1989) and for the
nearby Big Daddy chromite deposit (Aubut, 2012).
4. Mineral Resources are not Mineral Reserves and do not have demonstrated economic viability.
Using this 20% cut-off, there are 43.8 million tonnes at a grade of 37.5% Cr2O3 of Inferred
Resources. No mineability and dilution studies have been applied to these resources and
therefore they may not all be economically recoverable.
NI43-101 Technical Report – Koper Lake Project
2
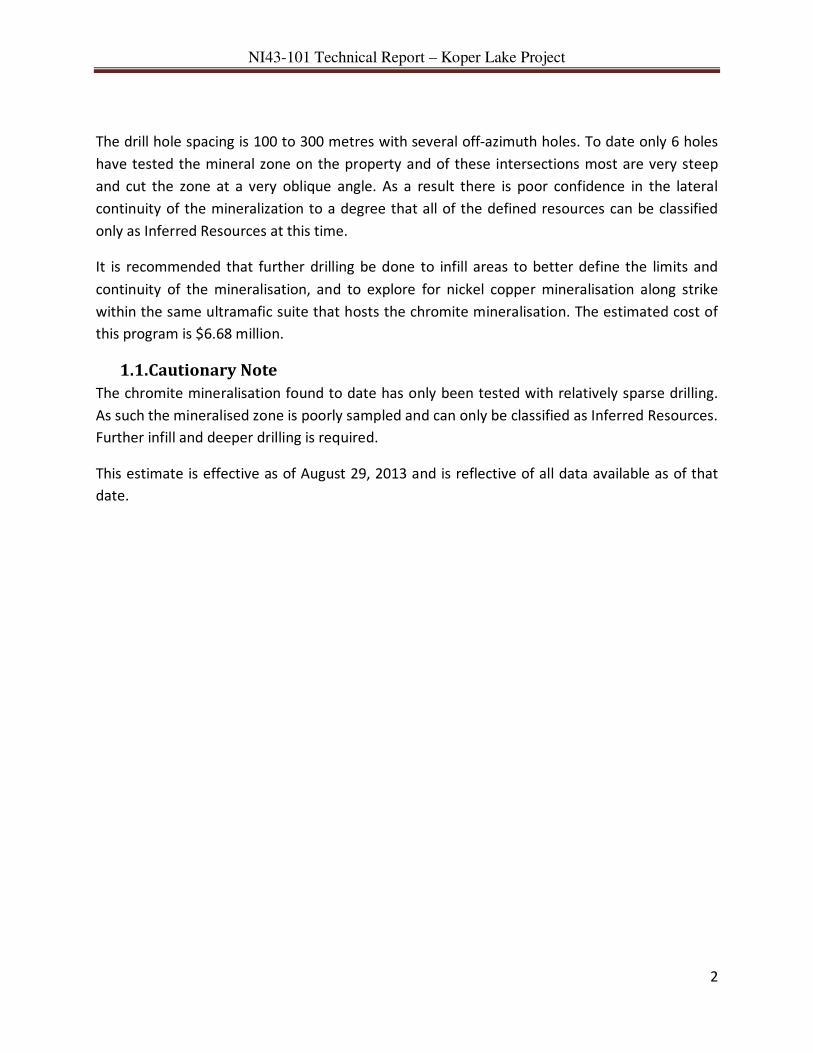
The drill hole spacing is 100 to 300 metres with several off-azimuth holes. To date only 6 holes
have tested the mineral zone on the property and of these intersections most are very steep
and cut the zone at a very oblique angle. As a result there is poor confidence in the lateral
continuity of the mineralization to a degree that all of the defined resources can be classified
only as Inferred Resources at this time.
It is recommended that further drilling be done to infill areas to better define the limits and
continuity of the mineralisation, and to explore for nickel copper mineralisation along strike
within the same ultramafic suite that hosts the chromite mineralisation. The estimated cost of
this program is $6.68 million.
1.1. Cautionary Note
The chromite mineralisation found to date has only been tested with relatively sparse drilling.
As such the mineralised zone is poorly sampled and can only be classified as Inferred Resources.
Further infill and deeper drilling is required.
This estimate is effective as of August 29, 2013 and is reflective of all data available as of that
date.

NI43-101 Technical Report – Koper Lake Project
3
2. Introduction
The Koper Lake Project property is currently under option agreement between KWG Resources
Inc. (KWG) and Bold Ventures Inc. (Bold) with Bold as the current project operator.
The purpose of this report is to document and summarise known information, determine an
appropriate genetic model to help guide future exploration and to present recommendations
for future work.
Sibley Basin Group Geological Consulting Services Ltd. (SBG) was retained by Mr. Maurice
Lavigne, Vice President of Exploration and Development for KWG Resources inc. to prepare this
report detailing work done to date on the Koper Lake Project property.
Bold, as project operator, compiled and supplied the drill hole data set with final drill hole
validation by SBG. Alan Aubut, P.Geo., on behalf of SBG, had previously visited the project area
in 2009. Digital files with which to generate a drill hole database file, including all assays, were
provided by Bold.
3. Reliance on Other Experts
This report has been prepared using public documents, and documents supplied by KWG
Resources Inc. While reasonable care has been taken in preparing this document there is no
guarantee as to the accuracy or completeness of the supporting documentation used, all of
which are listing in the References section.
4. Property Description and Location
The Koper Lake Project is located on a property held under an option agreement between KWG
Resources Inc. and Bold Ventures Inc., who are currently operators. The property is situated in
the Porcupine Mining Division in area BMA 527861 (G-4306) and is located approximately 80km
east of the community of Webequie (see Figure 1). The property consists of 4 unpatented
mining claims totalling 64 units covering approximately 1,024 ha (see Figures 2 and 3). The
claim locations are “as staked” and are based on GPS-derived locations of claim posts. The
current status of all the claims is presented in Table 1.
4.1. Property History and Underlying Agreements
• Claims 3012254, 3012255, 3012257 and 3012258 (Koper Lake Project) were recorded by
Richard Nemis, on April 22, 2003.

NI43-101 Technical Report – Koper Lake Project
4
Figure 1 Map showing the location of the Koper Lake Project.
• On June 28, 2003 Richard Nemis agreed to sell a 100% interest in the Koper Lake Project
to Fancamp Exploration Ltd. (Fancamp) for $7,200 with the vendor retaining a 2% net
smelter royalty (NSR). Fancamp has the right to purchase half of the NSR, or 1%, prior to
commencement of production from the claims, by paying $1,000,000 to the vendor.
Claim
NumberArea Recording Date Claim Due Date Status
Percent
Option
Work
Required
Total
Applied
Total
Reserve
Claim
Bank
Claim
UnitsArea
3012257 BMA 526 862 2003-Apr-22 2015-Apr-22 A 100% $6,400 $64,000 $23,310 $0 16 256
3012258 BMA 526 862 2003-Apr-22 2015-Apr-22 A 100% $6,400 $64,000 $1,890,066 $0 16 256
3012254 BMA 527 862 2003-Apr-22 2015-Apr-22 A 100% $6,400 $64,000 $185,463 $0 16 256
3012255 BMA 527 862 2003-Apr-22 2015-Apr-22 A 100% $6,400 $64,000 $223,737 $0 16 256
Total 64 1024
Table 1 Claim status of the Koper Lake Project property (as of July 10, 2013).
• On January 30, 2005 Probe Mines Limited agreed to option the property from Fancamp.
They drilled one hole (FC1) in 2006 to a final depth of 171 metres. No mineralisation of
note was intersected and the option was subsequently terminated.
Koper Lake Project

NI43-101 Technical Report – Koper Lake Project
5
Figure 1 Claim map of the McFaulds's Lake Area (©Intierra Pty Ltd. 2013).
On May 7, 2012 Bold Ventures Inc. (Bold) entered into an earn-in option agreement
with Fancamp. Bold had the option to earn-in up to 60% in the Koper Lake Project. The
Agreement called for Bold to make option payments totalling $1,500,000 and to incur
exploration expenditures on the property of at least $8,000,000 over a 3 year period.
Upon fulfilling these optional terms, Bold will earn a 50% interest in the property and a
joint venture will be formed. A further 10% interest may be earned by Bold at any time
Koper Lake
Project

NI43-101 Technical Report – Koper Lake Project
6
by delivery of a positive feasibility study and by making a payment of $700,000 in cash
and/or stock at the option of Bold.
Figure 2 KWG-Bold Option Agreement Property Map (purple) as of August 18, 2013.
• On January 7, 2013, Bold announced it had reached a revised agreement with Fancamp
that now gives Bold the option to earn up to a 100% working interest in the property.
The Agreement amends the terms of the Earn-In Option Agreement announced in May
7, 2012 to provide that once Bold has earned its 60% interest in the Koper Lake Project,
it will then have two options for a period of 90 days following the date it earns its 60%
interest. First, it can earn a further 20% interest in the Property by paying Fancamp
$15,000,000 payable in equal installments over three years with half of the amount
payable in cash and the balance payable, at Bold’s option, through the issuance of
common shares of Bold at the market price at the time the shares are issued with

NI43-101 Technical Report – Koper Lake Project
7
Fancamp retaining a carried interest (the “Carried Interest”) in the Koper Lake Project.
If the first option is exercised, Bold would then have the additional option to acquire
from Fancamp the Carried Interest in exchange for a Gross Metal Royalty (“GMR”)
payable to Fancamp resulting in Bold holding a 100% interest in the Koper Lake Project.
Fancamp would then be entitled to be paid 2% of the total revenue from the sale of all
metals and mineral products from the Property from the commencement of
Commercial Production. Once all of the capital costs to bring the Koper Lake Project to
the production stage have been repaid entirely, the GMR may be scaled up to a
maximum of 4% of the total revenue from the sale of all metals and mineral products
from the Property depending upon the price of product sold from the Property.
• On February 4, 2013, Bold announced that it had signed an agreement with KWG
Resources Inc. (KWG) to option its interests in the Koper Lake Project to KWG. Under the
terms of the Agreement, Bold will act as Operator of the initial exploration programs
which are to be funded by KWG. KWG can acquire an 80% interest in chromite
produced from the Koper Lake Project by funding 100% of the costs to a feasibility study
leaving Bold and its co-venturer with a 20% carried interest, pro rata. For nickel and
other non-chromite minerals identified during the exploration programs, the parties
have agreed to form a joint venture in which KWG would have a 20% participating
interest and Bold and its co-venturer would have an 80% participating interest, pro rata.
KWG will have a right of first refusal to purchase all ores or concentrates produced by
such joint venture whenever its interest in the joint venture exceeds 50%.
Bold also signed an agreement with 2282726 Ontario Limited (“Bold’s Co-Venturer”), a
subsidiary of Dundee Corporation, who can earn a 33-1/3% interest in Bold’s Ring of Fire
(ROF) activities around the area of Bold’s Ring of Fire claims in Ontario (the “Bold ROF
Project”) by funding $2.5 million of exploration work, over $2.0 million of which has
been expended to date. Once Bold’s Co-Venturer earns its 33-1/3% interest, a joint
venture will be formed between Bold’s Co-Venturer and Bold giving Bold’s Co-Venturer
the right to participate for up to 33-1/3% in Bold’s ROF Project by funding its portion of
the project’s budgets. The Koper Lake Project is within the Bold ROF Project.
4.2. Parties to the Agreements
Fancamp Exploration Ltd. is a junior exploration company listed on the TSX Venture exchange
under the trading symbol of “FNC”.

NI43-101 Technical Report – Koper Lake Project
8
Bold Ventures Inc. is a junior exploration company listed on the TSX Venture exchange under
the trading symbol of “BOL”.
2282726 Ontario Limited is a subsidiary of Dundee Corporation, a publicly traded asset
management company listed on the Toronto Stock Exchange under the symbol "DC.A".
KWG Resources Inc. is a junior exploration company listed on the TSX Venture exchange under
the trading symbol of “KWG”.
5. Accessibility, Climate, Local Resources, Infrastructure
and Physiography
5.1. Accessibility
Access to the property is by charter air service, available from Nakina, 280 km to the south, or
Pickle Lake, 295 km to the west-southwest. Access for surface exploration activities such as
diamond drilling is by helicopter in the spring, summer and fall. During the winter access is
possible using tracked vehicles, including snowmobiles.
During the summer the majority of rivers and creeks in the area are navigable by canoe and/or
small motor boats.
The closest all weather road is at Nakina, however there is a winter road system that services
the native communities of Marten Falls, Webequie, Eabametoong Neskantaga (Lansdowne
House), Fort Albany, and Attawapiskat. It is possible that this system can be extended to
provide access to the McFauld’s Lake area.
5.2. Climate
The climate of the James Bay Lowlands area is dominantly a typical continental climate with
extreme temperature fluctuations from the winter to summer seasons. But during the summer
months this can be moderated by the maritime effects of James and Hudson Bays. Environment
Canada records (http://climate.weatheroffice.gc.ca/climateData/canada_e.html) show that
summer temperatures range between 10°C and 35°C, with a mean temperature of 13°C in July.
Winter temperatures usually range between -10°C and -55°C with an average January
temperature of -23°C. Lakes typically freeze-up in mid-October and break-up is usually in mid-
April. The region usually receives approximately 610 mm of precipitation per year, with about
1/3 originating as snow during the winter months. On a yearly basis the area averages about
160 days of precipitation per year.
5.3. Local resources
Other than stands of timber there are no local resources available on or near the property.

NI43-101 Technical Report – Koper Lake Project
9
All equipment and supplies have to be air-lifted and directed through the nearby First Nation
communities such as Webequie and Marten Falls. The nearest native community is Webequie.
It has a well maintained all season runway, a hospital, a public school, mail and telephone
service, as well as a community store and a hotel. Webequie is also accessible during the
winter months by a winter road.
5.4. Infrastructure
Currently there is no infrastructure in the immediate project area. The closest all weather road
is at Nakina, and there is a winter road system that services the nearby First Nation
communities of Marten Falls, Webequie, Eabametoong Neskantaga (Lansdowne House), Fort
Albany, and Attawapiskat. It is possible that this system can be extended to provide access to
the McFauld’s Lake area. All of the local First Nation communities are serviced by air and have
all weather air strips. Power to these First Nation communities is provided by diesel generators
while Nakina is connected to the Ontario hydro-electric power grid. Nakina is also the closest
terminal on the Canadian National Railway (CNR) system.
5.5. Physiography
The project area is located along the western margin of the James Bay Lowlands of Northern
Ontario within the Tundra Transition Zone consisting primarily of string bog and muskeg
whereby the water table is very near the surface. Average elevation is approximately 170 m
above mean sea level. The property area is predominantly flat muskeg with poor drainage due
to the lack of relief. Glacial features are abundant in the area and consist of till deposits,
eskers, and drumlins, all of which are typically overlain by marine clays from the Hudson Bay
transgression. Currently, the region is still undergoing postglacial uplift at a rate of about 0.4
cm per year (Riley, 2003). The project area is located between the drainage basins of the
Attawapiskat and Muketei Rivers. The Muketei River is a tributary of the larger Attawapiskat
River that flows eastward into James Bay.
The bog areas consist primarily of sphagnum moss and sedge in various states of
decomposition. The southern portion of the property is partially covered by forested areas.
Trees are primarily black and white spruce (Picea glauca and mariana), tamarack (Larix laricina),
and jack pine (Pinus banksiana) with minor amounts of trembling aspen (Populus tremuloides),
balsam poplar (Populus balsamifera) and white birch (Betula papyrifera). In the northern
portion of the property, trees are restricted to narrow bands along rivers and creeks and on
well drained raised beaches. Willows (Salix) and alders (Alnus) are present along creeks and in
poorly drained areas.

NI43-101 Technical Report – Koper Lake Project
10
6. History
6.1. General
The first geological investigation of the James Bay Lowlands and the McFauld’s Lake area was
by Robert Bell of the Geological Survey of Canada (GSC). He and his crew traversed and mapped
the shores of the Attawapiskat River from James Bay and past the McFauld’s Lake area (Bell,
1887). Subsequently, in 1906 and between 1940 and 1965, the GSC and the Ontario
Department of Mines (ODM) initiated further regional geological programs aimed at
determining the petroleum potential of the Hudson Bay and James Bay sedimentary basins, and
determining the potential for hydrocarbons in the Moose River Basin area.
Prior to the 1990’s, the James Bay lowlands were sparsely explored. The few companies doing
exploration in the area included Consolidated African Selection Trust (Armstrong et al., 2008)
and Monopros Ltd., the Canadian exploration division of Anglo-American DeBeers. Most of the
active exploration at that time was restricted to the region near Nakina where access is
facilitated by road and train.
Modern day exploration in the McFauld’s Lake area only began in the early 1990’s as a result of
diamond exploration. In 1989 Monopros Ltd. began exploration near the Attawapiskat
kimberlites, which resulted in the discovery of the Victor pipe. The Spider/KWG joint venture
resulted in the discovery of the Good Friday and MacFayden kimberlites in the Attawapiskat
cluster, as well as the 5 Kyle kimberlites (Thomas, 2004). This activity led the way for other
diamond exploration companies, i.e., Canabrava Diamond Corporation, Condor Diamond Corp.,
Dumont Nickel Inc., Dia Bras Exploration Inc., Greenstone Exploration Company Ltd., and
Navigator Exploration Corp.
In the early 2000’s copper mineralization was discovered by DeBeers Canada Inc. in the
McFauld’s Lake area. This discovery prompted the first staking rush and was subsequently drill
defined by Spider/KWG and named the McFauld’s No. 1 volcanogenic massive sulphides (VMS)
deposit. Further copper mineralization was found at the McFauld’s No. 3 VMS deposit (Gowans
and Murahwi, 2009).
The discovery of the Eagle One nickel massive sulphide deposit by Noront Resources in 2007
resulted in a second staking rush. Over the next two years the Black Bird, Black Creek, Big
Daddy, Black Thor and Black Label chromite deposits were found as well as the Thunderbird
vanadium deposit.
Richard Nemis arranged to have claims staked in the McFaulds Lake area, including the ones
that make up the Koper Lake Project and then optioned the claims to Fancamp. In 2010
Fancamp intersected massive chromite in holes FN-10-25 and FN-10-26. Fancamp then

NI43-101 Technical Report – Koper Lake Project
11
optioned the claims to Bold Resources in 2012. Bold signed an option agreement with KWG in
early 2013.
6.2. Discovery history
In April of 2003 John der Weduwen staked claims 3012254, 3012255, 3012257 and 3012258
and then transferred 100% to Richard Nemis who then optioned the claims to Fancamp
Exploration Ltd. (Fancamp). Fancamp completed the following work over the property between
2003 and 2012:
• In 2003 Fancamp participated in a regional Geotem magnetic and EM survey flown by
Fugro Airborne Surveys. A total of 102 line kilomoters were flown over the property as part of
this survey (Hogg, 2003).
• In 2004 several ground magnetic and horizontal loop EM surveys were completed in the
area with portions of two of the grids extending onto the Fancamp property. Grid 1 consisting
of lines at 200 metre intervals and totalling 11 km on the property; and Grid J consisting of lines
at 100 metre intervals with 6.2 km on the property (Hogg, 2005).
• In 2006 Fancamp optioned the property to Probe Mines limited who then drilled one
hole, FC-01, to a final depth of 171 metres. No mineralisation of note was encountered and the
option was dropped.
• In 2007 a larger, more regional helicopter-borne AeroTEM magnetic and EM survey was
flown by Aeroquest. A total of 186 line kilometres were flown over the property (Hogg, 2008).
• During 2008 Fancamp drilled 12 diamond drill holes totalling 3,555 metres. In addition,
Noront Resources drilled one hole that extended onto the Fancamp property (NOT-08-40) that
ended in massive chromite. Of these holes 5, including the Noront hole, were surveyed using
downhole IP (JVX, 2009).
• During 2010 Fancamp drilled an additional 28 holes totalling 8,314 metres including
holes FN-10-25 and 26 that intersected significant chromite intervals at depth.
• In early 2013 Geosig completed 48.9 line kilometres of ground magnetic and gravity
surveys over portions of the property (Geosig, 2013). Bold Ventures, as operator, drilled 9 holes
totalling 6,379 metres testing various targets including the chromite zone discovered in 2010.

NI43-101 Technical Report – Koper Lake Project
12
7. Geological Setting and Mineralization
7.1. Regional geology
The James Bay Lowlands regional geology can be subdivided into the following domains:
Precambrian Basement Complex, Paleozoic platform rocks, and Quaternary cover.
7.1.1. Precambrian Basement Complex
The Koper Lake Project property is located within the eastern portion of the Molson Lake
Domain (MLD) of the Western Superior Province of the Canadian Shield (see Figure 4). Age
dating has shown that there are two distinct assemblages: the Hayes River assemblage with an
age of about 2.8 Ga, and the Oxford Lake assemblage with dates of about 2.7 Ga. Numerous
mafic intrusions have been documented in the domain, such as the Big Trout Lake intrusion
(Percival, 2007).
Figure 4 Geological map of the Superior Province showing tectonic domains
The domain is also intruded by numerous plutons of tonalitic, granodioritic, and granitic
compositions.

NI43-101 Technical Report – Koper Lake Project
13
In the McFauld’s Lake area of the James Bay lowlands there is very poor outcrop exposure. As a
result an aeromagnetic compilation and geological interpretation map was completed by Stott
in 2007. Important geological features observed by Stott (2007) are:
• West- and northwest-trending faults show evidence of right-lateral transcurrent
displacement.
• Northeast-trending faults show left-lateral displacement.
• In the northern half of the Hudson Bay lowlands area Archean rocks are overprinted by
the Trans-Hudson Orogen (ca. 2.0 – 1.8 Ga).
• Greenstone belts of the Uchi domain and Oxford-Stull domain merge under the James
Bay Lowlands.
• The Sachigo subprovince contains a core terrain, i.e., the North Caribou Terrain and
“linear granite-greenstone” domains on the south and north flanks, that record outward
growth throughout the Neoarchean.
• Major dextral transcurrent faults mark the boundary between the Island Lake and
Molson Lake domains.
• Proterozoic (1.822 and 1.100 Ga) carbonatitic complexes intruded and reactivated these
faults.
• The area has undergone a doming event. Uplifted lithologies include a regional scale
granodioritic gneissic complex to the NW of the property.
7.1.2. Paleozoic Platform Rocks
The Paleozoic Platform rocks of the James Bay Lowlands consist primarily of upper Ordovician
age (450 Ma to 438 Ma) sedimentary rocks. The sedimentary pile thickens significantly to
greater than 100 m to the east and north of the property but is only intermittently present in
the immediate property area. It is comprised mainly of poorly consolidated basal sandstone
and mudstone overlain by muddy dolomites and limestones.
7.1.3. Quaternary Cover
The area is mantled by a thin, but persistent, layer of glacial and periglacial till and clay
deposits.
7.2. Local Geology
Because of the limited bedrock exposure not much can be directly inferred about the geology
of the Koper Lake Project property. The overburden varies in thickness from about 3m to 10m.
It consists of a mixture of glacial outwash with abundant gravel to cobble sized pieces of
unconsolidated tan coloured fossiliferous limestone, granitic rocks, as well as minor ultramafic
rocks.

NI43-101 Technical Report – Koper Lake Project
14
Most of the property geology can be indirectly inferred from the recent diamond drilling
campaign and geophysical surveys. From these sources, it is interpreted that the property is
underlain by: volcanics, ultramafic rocks and late felsic intrusive rocks.
7.2.1. Volcanics
Volcanic lithologies present are typical of most greenstone belts of the Superior Province. They
consist of foliated mafic to felsic volcanic flows and pyroclasitic units, with intercalated schist,
gabbro, iron-formation, and greywacke.
7.2.2. Ultramafic Rocks
The volcanics are intruded by an ultramafic complex consisting primarily of dunite, peridotite,
chromitite, pyroxenite, gabbro, leucogabbro, and gabbronorite. These lithologies are variably
altered, primarily in the form of serpentinization of olivine with talc, tremolite, chlorite,
kammererite, stichtite, and magnetite also being present.
The geological package is vertical or dips very steeply towards the SE. In part it is fully
overturned and dips steeply to the NW.
The Koper Lake Project property hosts the southwestern extension of the ultramafic suite that
is best defined on the Cliffs Chromite North property to the northeast. There we have a lower
cycle consisting dominantly of peridotite with minor accumulations of olivine adcumulate and
chromite. The next cycle stratigraphically higher in the sequence shows more differentiation
with appreciable enrichment of chromite. The third cycle has a basal zone of significant
chromite enrichment. Overlaying the chromite-rich portions of the complex is a pyroxenite unit
that drilling indicates has eroded away portions of the upper chromite horizon. The pyroxenite
horizon is overlain by olivine adcumulates, peridotite and gabbro. The ultramafic complex host
to the chromite mineralisation is up to 500 metres thick and has been traced for over 15
kilometres along strike.
7.2.3. Felsic Intrusive Rocks
Felsic intrusive rocks, intersected in drilling on the north side of the Koper Lake property, are
comprised mostly of granite and quartz-diorite. The granite is grey-white, coarse-grained,
hypidiomorphic and granular, consisting of quartz, feldspar, and biotite crystals. The granite is
typically gradational into a quartz-diorite. The contact with the ultramafic and volcanic rocks is
sharp and irregular at times with significant alteration of the ultramafics and volcanics.
7.2.4. Faulting
Drilling has intersected faults identified by slickensides, mylonitization, and intense brecciation
of the host lithologies. Magnetic and gravity surveys indicate that there are major fault
displacements to the northeast and southwest.

NI43-101 Technical Report – Koper Lake Project
15
7.3 Mineralisation
To date only chromite mineralization has been found on the Koper Lake Project property. The
chromite mineralization is potentially economic.
7.3.1 Chromite Mineralization
The chromite mineralisation on the Koper Lake Project is the eastern extension of the Black Bird
chromite deposits and all are on strike with the Black Thor, Black Creek and Big Daddy deposits
3 km to the northeast. The chromite mineralisation does not come to surface on the property.
It is stratiform and is hosted by ultramafics. Various types of chromite mineralization have been
observed including disseminated chromite (1 to 20% chromite), semi-massive chromite and
massive chromite (chromitite). The main chromitite layer is up to about 40 metres thick and has
been traced on the Koper Lake Project property over 0.7 kilometres along strike. The chromite
is present as small grains typically 100 to 200 µm and hosted typically by peridotite and, in the
higher grade portions, by dunite.
8. Deposit Types
Various economic mineral deposit types are known to exist in the James Bay lowlands of
Northern Ontario. These include: magmatic Ni-Cu-PGE, magmatic chromite mineralization,
volcanogenic massive Cu-Zn sulphide mineralization and diamonds hosted by kimberlite.
The ultramafic/mafic rocks found on the Koper Lake Project property have been explored
primarily for nickel-copper sulphide mineralisation although magmatic chromite mineralization
has been found instead. The chromite mineralization occurs as stratiform bands within a large
layered intrusion and shows major similarities with the Kemi intrusion of Finland.
At Kemi, chromite is hosted by a layered intrusion composed of peridotite and pyroxenite
cumulates with chromite layers. The intrusion is interpreted to be funnel-shaped with the
cumulate sequence thickest at the centre. There is a continuous chromite layer that has been
traced 15 km along strike and varies in thickness from a few millimetres to as much as 90
metres in the central portion of the intrusion. Using a cut-off of 20% there were 40 million
tonnes of open pit reserves grading 26.6% Cr2O3 with a Cr/Fe ration of 1.53 (Alapieti, et al.,
1989).
9. Exploration
In 2003 Fancamp participated in a regional GeoTEM magnetic (see Figure 5) and EM survey
flown by Fugro Airborne Surveys. A total of 102 line kilometers were flown over the property as
part of this survey (Hogg, 2003).

NI43-101 Technical Report – Koper Lake Project
16
In 2004 several ground magnetic and horizontal loop EM surveys were completed in the area
with portions of two of the grids extending onto the Fancamp property. Grid 1 consisting of
lines at 200 metre intervals and totalling 11 km on the property; and Grid J consisting of lines at
100 metre intervals with 6.2 km on the property (Hogg, 2005).
In 2006 Fancamp optioned the property to Probe Mines limited who then drilled one hole, FC-
01, to a final depth of 171 metres. No mineralisation of note was encountered and the option
was dropped.
Figure 5 Map showing the Total Field Magnetic survey flown by Fugro in 2003.
In 2007 a larger, more regional helicopter-borne AeroTEM magnetic and EM survey was flown
by AeroQuest (see Figures 6 and 7). A total of 186 line kilometres were flown over the property
(Hogg, 2008).
During 2008 Fancamp drilled 12 diamond drill holes totalling 3,555 metres. In addition, Noront
Resources drilled one hole that extended onto the Fancamp property (NOT-08-40) that ended

NI43-101 Technical Report – Koper Lake Project
17
Figure 6 Map showing Channel 3 – Z off – AEM survey flown by AeroQuest in 2007.
Figure 7 Map showing the Total Field Magnetic survey flown by AeroQuest in 2007.

NI43-101 Technical Report – Koper Lake Project
18
in massive chromite. Of these holes, 5 including the Noront hole, were surveyed using
downhole IP (JVX, 2009).
During 2010 Fancamp drilled an additional 28 holes totalling 8,314 metres including holes FN-
10-25 and 26 that intersected significant chromite intervals at depth.
In early 2013 Geosig completed 48.9 line kilometres of ground magnetic and gravity surveys
over portions of the property (Geosig, 2013). Figure 8 shows the results of the gravity survey.
Bold Ventures, as operator, drilled 9 holes totalling 6,379 metres testing various targets
including the chromite zone discovered in 2008.
Figure 8 Map showing the Residual Bouguer Gravity survey completed in 2013 by Geosig.

NI43-101 Technical Report – Koper Lake Project
19
10. Drilling
To date 49 BQ and NQ-sized holes totalling 7,469 metres have been drilled on the property, not
all of which have tested the Koper Lake Project chromite zone. Down-hole orientation surveys
were completed on all holes. Unfortunately most of the downhole surveys were done using
magnetic methods which result in incorrect azimuth values when in magnetic rocks such as
ultramafic. See Appendix 1 for details on the holes that have been drilled on the property.
10.1 2008 and 2010 Drilling
Fancamp conducted drilling campaigns in 2008 and 2010. These campaigns mostly tested
geophysical anomalies that were believed to represent near surface nickel-copper sulphide
mineralization. A few holes also tested deep nickel-copper targets based on geological
modelling. Two of these holes, FN-10-25 and FN-10-26, intersected massive chromite
mineralization. As chromite was not Fancamp’s primary target, they only analyzed 1 metre long
samples every 6 metres for hole FN-10-25 and 0.5 metre long samples every 4.5 metres for hole
FN-10-26. All of the samples collected were cut in half with a core saw. The samples were sent
to the Activation Laboratories (ActLabs) facility in Thunder Bay for analysis. The core from these
holes is stored in racks at Koper Lake. As all downhole orientation surveys were done using
magnetic instrumentation their azimuth determinations are considered suspect where the
holes were within magnetic rocks such as ultramafics.
10.2 2013 Drilling
In March 2013, a drilling campaign funded by KWG and operated by Bold was initiated. Bold’s
objective is the search for nickel-copper sulphides, while KWG’s objective is to further drill the
chromite horizon discovered during the 2010 campaign. This was done using three drills, with
Bold and KWG having separate core processing facilities staffed by employees of each
company. The hole collars were established by GPS, the azimuth and plunge by Reflex APS, a
collar orientation instrument, and the hole trajectory surveyed by Reflex Gyro. Excessive
downhole deviation of the initial holes was corrected by changing to stabilized core barrels and
long reaming shells for subsequent holes.
The chromite bearing core was logged and sampled in sufficient detail to enable the estimate of
“waste-ore” separation of coarsely crushed feed using heavy media and/or gravity
beneficiation. In addition, the core was subjected to analysis by a handheld XRF. The core was
marked, tagged and cut longitudinally in half with a diamond saw. The bagged samples were
flown to Nakina Airport, loaded into a trailer and delivered to Actlabs, Thunder Bay by KWG
staff. 6 holes targeting chromite were completed. One of these holes, FNCB-13-030 deviated
onto the neighbouring claim owned by Noront Resources. The core from that portion of this
hole that is on Noront property was delivered to Noront. Two additional holes were initiated
but not completed due to the termination of the drilling program due to a forest fire.
NI43-101 Technical Report – Koper Lake Project
20
During this campaign, core from the 2010 drilling campaign was extracted from storage. As
both holes FN-10-25 and FN-10-26 intersected the chromite horizon at an angle of
approximately 20 degrees, this produced long intercepts of massive chromite with volumes
sufficient for a furnace melt test. Hole FN-10-25 has a continuous massive chromite intercept of
220 metres, and hole FN-10-26 has a continuous massive chromite intercept of 53 metres and 4
additional shorter massive chromite intercepts. Only 10% of this core had been sampled and
assayed. The two longer intercepts were chosen for the furnace melt test, while the core with
the remaining massive chromite intercepts was re-logged, and the unsampled intervals
submitted for assay. The entire core was photographed and analysed by handheld XRF,
including previously assayed intervals. The core was delivered to Xstrata Process Support in
Falconbridge, Ontario for the furnace melt test.
11. Sample Preparation, Analyses and Security
All samples were submitted in batches to Activation Laboratories (ActLabs) in Thunder Bay
except for one batch that was submitted instead to Accurassay Laboratories (Accurassay), also
in Thunder Bay, for sample preparation and analysis.
11.1. QA/QC Procedure
As standard procedure each batch of samples typically included certified reference materials, a
blank sample, a pulp duplicate, one coarse reject duplicate and one field (1/4 core) duplicate.
The assay reports were then reviewed by Tracy Armstrong, an independent consultant who
specialises in completing data quality control checks.
Three certified reference materials provided by CDN Resource Laboratories of Langley B.C. have
been used for this program: BD1 which is certified for Pd, Pt and Cr2O3; BD2, certified for V and
Cr2O3; and BD3, certified for Pd, Pt and Cr2O3. In all cases there were no failures in that the
assay labs always reported results compatible with the known standard analyses (Armstrong,
2013).
The sample blanks used are a locally sourced granodiorite with no mineralisation. These are
used to monitor contamination. All blank results higher than the above indicated tolerance
limits were considered to have no impact due to the blank result being too low to impact the
deposit value (Armstrong, 2013).
There were too few duplicates submitted to get a good handle on precision for the data
although there does appear to be an increase in precision with a decrease in grain size for Cr2O3
(Armstrong, 2013).

NI43-101 Technical Report – Koper Lake Project
21
Figure 9 Comparison of Niton XRF readings and Lab Results for hole FN-10-25 (Armstrong, 2013).
Figure 10 Comparison of Niton XRF readings and Lab Results for hole FN-10-26 (Armstrong, 2013).

NI43-101 Technical Report – Koper Lake Project
22
The data set used for the resource estimate includes two holes drilled in 2010 but which were
only partially sampled. To fill in these gaps spot readings were taken by KWG staff using a Niton
portable XRF analyser (Niton) to determine Cr content. These spot readings were calibrated by
collecting spot readings of the previously sampled and assayed intervals and a correction factor
determined based on the ratio of the Niton readings to the lab results. This correction factor
was then applied to all of the unassayed intervals to obtain a final Cr2O3 content. Figures 9 and
10 show the results of the Niton analyses for the two holes evaluated using this method. The
intervals from these same two holes were then submitted to Xstrata for smelting test work
(Barnes, 2013). Xstrata also assayed the core prior to doing their test work.
12. Data Verification
A review of the data by the author (see section 14.1.1.6. and Appendix 2) showed no issues.
The data is considered valid, representative and suitable to be used for resource estimation.
13. Mineral Processing and Metallurgical Testing
A DC pilot smelting test has been completed on core from holes FN-10-25 and FN-10-26 by
Xtrata Process Support (Barnes, 2013). The purpose of this test work was to gauge its response
to smelting by comparing it with more comprehensively tested ores, such as Big Daddy. A total
of 1184 kg of chromite core was used to produce 1500 kg of blended feed.
The results showed that the high grade of the ore results in a very high alloy grade. The Cr
recovery, at 95.5%, while not quite as high as those the recoveries obtained for the Big Daddy
material smelted immediately prior to the Koper Lake Project chromite run, is still excellent by
chromite smelting standards.
Based on the results it was concluded:
• The Koper Lake Project chromite ore smelts easily and produces both high grade alloy
and low Cr values in the discard slag.
• A chrome recovery of 95.5% was achieved for the test period.
• Koper Lake Project chromite, based on the tests results obtained, behaves,
metallurgically speaking, very similarly to Big Daddy chromite, and any slight differences
observed are consistent with its higher Cr: Fe ratio
• An alloy grade of > 60% Cr can be obtained even with the high C contents associated
with operating the furnace at elevated temperatures.
• In spite of the relatively small amount of material available, this brief campaign
successfully provided a glimpse of the likely response of the Koper Lake Project chromite
to typical high carbon ferrochrome smelting in a DC arc furnace.

NI43-101 Technical Report – Koper Lake Project
23
• If can be inferred from the results that the Koper Lake Project chromite material
demonstrates the same high reducibility noted in Big Daddy chromite, making it
amenable to possible alternative extraction processes involving solid state pre-
reduction.
14. Mineral Resource and Mineral Reserve Estimates
14.1. Mineral Resource Estimation
14.1.1. Resource Estimation Methodology
14.1.1.1. Software Used and Data Validation
The software used in the modelling process, including data preparation is CAE Studio, Release
3.21.9646.0.
Core-drilling data was supplied as Microsoft Excel files that included collar information, assays,
lithology information and down hole survey information. The data has been validated by the
author. Once validated this information was imported into CAE Studio as four tables: a collar
file, an assay file, a lithology file, and a survey file. Using the CAE Studio HOLES3D a desurveyed
drill hole file, fnvb_holes2.dm, in UTM coordinate space, was created. The drill hole file was last
updated on August 17, 2013.
The CAE Studio desurveying routine, HOLES3D, does a rigorous set of validation checks
including checking for duplicate borehole numbers, missing survey data and overlapping sample
intervals. If present, it generates a summary report with a list of all errors encountered. These
files were checked to determine if any errors occurred. Once it had been confirmed that no
errors were present the drill hole file was then used for subsequent steps.
As there are no density data available, and due to the similarity of the mineralization with the
nearby Big Daddy chromite deposit a polynomial regression for that data set was used to
populate a SG field, based on Cr2O3 values (Aubut, 2012). The formula used is:
�� = 0.0003��+ 0.0192� + 2.6629 Eq. 14.1
If no Cr2O3 assay was available SG was set to a default value of 2.6629.
14.1.1.2. Geological Domains
Experienced geologists had coded each rock unit based on core logging description. All of the
holes are inclined and six intersected at least some portion of the mineral zone of interest.
Construction of the resource block model was controlled by building a wire frame that was then

NI43-101 Technical Report – Koper Lake Project
24
used to isolate related samples. No cut-off was used to limit the extent of the mineral envelope.
The envelope for the mineral domain (see Figure 11) extends from an elevation of
approximately 115 metres below sea level down to a maximum depth of 1250 metres below
sea level, just below the deepest drilling to date. The mineralisation is open to depth along a
portion of the strike length and is open along strike to the east. While it is not a geological
envelope the mineral envelope does honour the local geology as much as possible.
A total of 6 holes have been used for this resource estimate out of a total of 49 holes drilled on
the property. Holes were excluded because they did not intersect the mineral zone on the
property.
Initial data are contained within a set of Microsoft Excel tables that were updated August 17,
2013.
Figure 11 Isometric view of the Koper Lake Project geological domain used.
14.1.1.3. Drill Hole Database
Using the polynomial regression previously described, the assay table was processed using
EXTRA to calculate SG values. Where no Cr2O3 values are present SG was set to a default value

NI43-101 Technical Report – Koper Lake Project
25
of 2.663 and Cr2O3 was set to 0. Using the appropriate collar, survey, assay and lithology files
the CAE Studio process HOLES3D was used to create a de-surveyed 3D drill holes file:
“FNCB_holes2.dm”.
A visual review was made of the drill hole file. A summary of all of the all the holes drilled on
the property including those used for this resource estimate are presented in Appendix 1 as are
a surface plan showing hole locations (Figure 16) and an example section: 547750E East (Figure
17).
The drill hole file, “FNCB_holes2.dm” contains information for 49 drill holes totalling 7,469
metres and with 695 samples with Cr2O3 assays. This file was used for collecting samples for
estimation of the Koper Lake Project chromite zone.
Figure 12 Histogram of sample length.
14.1.1.4. Sample Selection
Working in cross section a set of mineral zone lines, or strings, was defined for the domain.
These strings were drawn to enclose the Koper Lake Project chromite zone by snapping to the
drill holes. The strings from each set were then used to construct a mineral envelope wire
Fre
quency
LENGTH
.01 1.01 2.01 3.01 4.01 5.01 6.01
.000
.050
.100
.150
.200
.250
LENGTH HistogramNumber of Data 425
mean 1.1590std. dev. .7247
coef. of var .6253
maximum 5.7100upper quartile 1.5000
median 1.1000lower quartile .5375
minimum .0100

NI43-101 Technical Report – Koper Lake Project
26
frame for the domain (see Figure 11). The envelope extends from 115 metres below mean sea
level down to 1250 metres below mean sea level, just above the deepest drilling to date. The
borehole samples located within the mineral envelopes were captured using a custom script.
14.1.1.5. Compositing
The captured samples have an average sample length of 1.16 metres (see Figure 12). It is
expected that mining at Koper Lake Project likely will be by underground mining methods. The
block size used for resource estimation is usually a function of SMU, or Smallest Mining Unit as
there is no point using a block size smaller than the smallest unit that can be physically mined
selectively (usually a blast round). But if samples are large and/or spaced far apart a small block
size would be inappropriate.
For this deposit, due to the geometry and relatively low sample density a block size of 25
metres by 5 metres by 25 metres was chosen as an acceptable compromise.
Composited samples are weighted by Specific Gravity as it is a close approximation of density
(mass per unit volume). The samples were composited to standard 1 m intervals using the CAE
Studio process COMPDH. The COMPDH process starts the composites at the beginning of the
selected data interval and leaves any remainder at the end of the interval. This results in most
holes having one sample with a length less than the established composite length, within the
domain. For grade estimation purposes, drill composites are treated like point data (i.e. their
length is not used), thus the need to composite to a standard sample length to eliminate any
sample bias. And to avoid bias from a very short sample being treated the same as a standard
sample any that were less than 40% of the composite length were rejected.
14.1.1.6. Exploratory Data Analysis
A review of the composited drill hole samples within the mineral envelopes was done, primarily
using GSLib routines (Deutsch and Journel, 1998) to create histograms for all primary elements
and X/Y scatter plots of element pairs (see Appendix 2). Features watched for are outliers and
irregularities in the element statistics. Univariate summary statistics for Cr2O3 are presented in
Table 5.
Cr2O3 does not have any spurious values with a maximum value of 48.9%. The histogram for
Cr2O3 (Figure 13) is a negatively skewed distribution with relatively equal representation of all
fractions from approximately 12% Cr2O3 to about 34% Cr2O3 and with a peak at around 45%.
Exploratory Data Analysis found no issues with the drill hole database that would invalidate
their use for resource estimation purposes.

NI43-101 Technical Report – Koper Lake Project
27
Figure 13 Histogram of Cr2O3 for Koper Lake Project
14.1.1.7 Unfolding
Mineral deposits typically vary in thickness along strike due to the non-uniform nature of the
original deposition environment. Primary and secondary structural modifications also produce
variations in strike and dip as well as thickness. The Cartesian coordinate system makes
modelling of the natural geological chemical distribution within a mineral deposit difficult. To
ensure that all interpolation takes place within a given geological domain, the domain is
unfolded to a planar slab to make variogram calculation and grade interpolation easier. After
interpolation has been carried out, the samples are re-arranged to their original positions. This
unfolding process first requires the generation of unfold strings that are used by CAE Studio as a
guide. These strings also include between section and within section tag strings to further
constrain the unfolding process.
Table 2 Summary Univariate Statistics
Fre
quency
CR2O3
.0 10.0 20.0 30.0 40.0 50.0
.000
.050
.100
.150
.200
.250CR2O3 Histogram
Number of Data 411
number trimmed 14
mean 33.4242std. dev. 14.1653
coef. of var .4238
maximum 48.9600upper quartile 44.4858
median 40.0083lower quartile 23.8375
minimum .0000
FIELD NSAMPLES MINIMUM MAXIMUM MEAN VARIANCE STANDDEV SKEWNESS KURTOSIS
CR2O3 (%) 412 0 48.96 33.46 200.64 14.16 -1.08 -0.07

NI43-101 Technical Report – Koper Lake Project
28
The unfolding routine used is based on a “proportional” concept under which hanging wall and
footwall surfaces of the domain are made flat and parallel to one another. The true along strike
and down dip distances are retained but the across dip distances are first normalised to the
distance across as a proportion of the total distance. Then this normalised value is multiplied by
the average thickness of the mineral domain.
After being composited to uniform sample lengths, the samples were unfolded using a custom
script. Using another custom script the unfold string file was processed further. This routine
checks and validates the strings. The composited sample files and the validated unfold string
file are then used as input to the CAE Studio UNFOLD routine. The output files contain the
samples in unfolded co-ordinate space. All subsequent processing was done on these files and
utilized the new coordinate system consisting of UCSA, UCSB and UCSC (Across the Dip, Down
the Dip and Along the Strike).
14.1.1.8 Grade Variography
The data set consists of sparsely distributed drill holes that are very oblique to the mineral zone
(they cut the zone at very steep angles). As a result, other than for the shorter ranges for the
down the dip direction, the samples are two widely distributed or poorly sampled a particular
direction (across the dip and along the strike in particular) that it was impossible to generate
any kind of useful variograms.
As the style of mineralisation is very similar to that at the nearby Big Daddy chromite deposit it
was decided to utilise the variograms from there. The variograms were then rescaled to reflect
the local sample variance. As there is not enough data to confirm that the same anisotropy
exists the down dip direction was set to be equal to the along strike thus assuming that the
variograms are isotropic within the plane of the mineralisation.
The ranges used for the Koper Lake Project are shown in Table 6. Due to the lack of any
certainty with the values used all resources defined must be classified as Inferred.
14.1.1.9 Block Size Determination
The block size used for resource estimation is usually a function of SMU, or Smallest Mining
Unit and is determined by taking into consideration the type of equipment that may be used
during mining as it has a direct impact on the degree of selectivity that can take place. There is
no point using a block size smaller than the smallest unit that can be physically mined
selectively (usually a blast round). Another factor that needs to be considered is the degree of
sampling detail. If samples are large and/or spaced far apart a small block size would be
inappropriate.

NI43-101 Technical Report – Koper Lake Project
29
For this deposit, due to the geometry and relatively low sample density it is pointless using too
small of a block size, especially since, due to the great deal of uncertainty, no mining evaluation
can be done.
As a result a block size of 25 metres by 5 metres by 25 metres was chosen as an acceptable
compromise.
A custom script was used to create the empty prototype model and then fill it with blocks using
the mineral envelope wire frame. And then this empty model was regularised creating FILLVOL
and VOIDVOL fields containing the volume for each block inside or outside the mineral domain
wire frame.
Table 3 Variogram Model Parameters.
14.1.1.10 Nearest Neighbour Block Model
A Nearest Neighbour (NN) estimated model was created for the domain in order to determine
the declustered mean for our data. This mean can then be used to validate the kriged global
estimates as all methods of estimation should produce essentially the same global mean if done
correctly.
Summary statistics comparing the nearest neighbour model to the sample file are presented in
Table 4.
A visual inspection on a section-by-section and plan-by-plan basis comparing the input sample
file with the resultant nearest neighbour file showed good correlation with the drill holes and
proper spreading of the grade.
The output Nearest Neighbour file name is nn_fncb.dm.
Variogram Models – McFauld’s Lake Cr2O3
Nugget 20.32
1st spherical structure range A 8
1st spherical structure range B 22
1st spherical structure range C 22
1st spherical structure sill 42.52
2nd spherical structure range A 14
2nd spherical structure range B 40
2nd spherical structure range C 40
2nd spherical structure sill 68.23
3rd spherical structure range A 28
3rd spherical structure range B 120
3rd spherical structure range C 120
3rd spherical structure sill 71.56
Total sill 202.63

NI43-101 Technical Report – Koper Lake Project
30
14.1.1.11 Ordinary Kriging Block Model
The purpose of block modelling is to provide a globally unbiased estimate based on discrete
sample data. Geostatistical methods rely on mathematically modelling the autocorrelation of a
regionalized variable, using variography. Then using these mathematical models weights are
derived. These weights are applied to the samples used to derive the estimates while at the
same time minimizing the estimation variance. A common method of estimation is Ordinary
Kriging. It uses the variogram models to initially derive the weights to be used for each estimate
but then, to reduce bias, has all weights sum to 1. In addition, Ordinary Kriging does not require
that the mean of the data be known.
The parameter files needed for Ordinary Kriging were constructed. A nested search strategy
was used (see Appendix 4). This was then followed by the using of a custom script to actually
carry out the Ordinary Kriging process. Each cell in the block model was discretised using a
matrix of 3 x 3 x 3 points in the ABC (unfolded) coordinate system. The Kriging functions were
interpolated at each discretisation point using the same search volume as the nearest
neighbour interpolation, based on the grade variogram results. In case of local low sample
density, a nested search was implemented. Virtually all of the blocks were estimated in the
third search, correlative with Inferred Resources. These likely suffer from poor local estimation
and potentially large conditional bias.
14.1.1.12 Block Model Validation
Verification of grade estimation is carried out in two ways: visually, and statistically.
In the case of a visual check, interpolated estimates are loaded into sections and plans along
with the original borehole data. Using contrasting colour schemes grades were tested. Any
major discrepancy between the original information and the estimated block was analyzed for
possible processing error. Sample plans and sections illustrating this visual check are provided
in Appendix 5.
Major discrepancies were also looked for between the statistics of the sample composites,
nearest neighbour model (declusterised statistics) and the ordinary kriged model. Specific
statistics checked include reproduction of the global mean, as established by nearest neighbour
modeling, and ensuring that all blocks were estimated (see Table 4). No significant global or
local bias was identified.
Table 4 Sample file, Nearest Neighbour and OK model summary statistics.
FILENAME FIELD NRECORDSNSAMPLESMINIMUMMAXIMUMMEAN %Diff VARIANCE SKEWNESSWGTFIELD
fncb_data1u CR2O3 494 465 0.48 47.87 34.94 180.2386 -1.23 LENGTH
nn_fncb CR2O3 7019 7019 0.48 47.87 33.80 192.2752 -1.07 CR2O3
ok_fncb CR2O3 7019 7019 4.66 46.11 34.89 3.22 113.6682 -0.52 CR2O3

NI43-101 Technical Report – Koper Lake Project
31
14.1.1.13 Model Verification
Validation procedures were carried out on the estimated block models including visually
checking the sample file against estimated blocks. The sample grades were found to reasonably
match the estimated block grades in the model.
A global statistical comparison of the global means of all estimations method was done. The
difference between all the global means was found not to exceed approximately 5%, to be
expected if the process was done correctly.
Other statistical checks that were done include the use of Swath plots (see Appendix 5). Swath
plots compare the moving average of the mean for both models and the sample file using
panels, or “swaths” through the mineral envelope. As this is best done if the data are within a
rectilinear volume the unfolded coordinates were used to define the swaths. The result is a
curve for each data set. The curves for the models should inter-weave with the sample curve
and the two model curves should be sympathetic with one another with no major deviations
from one another. No issues were noted.
14.2. Mineral Resource Reporting
14.2.1. Resource Classification – Koper Lake Project chromite deposit
Due to the scarcity of drill hole data the variograms are poorly defined in all directions. As a
result there is a low confidence in the estimates generated and so all blocks are classified as
Inferred Resources. See Appendix 6 for resource classification definitions.
Using a 20% cut-off, there are a total of 43.8 million tonnes at a grade of 37.5% Cr2O3 of
Inferred Resources which should be upgradable through gravity and/or heavy media
concentration. These resources are blocks above cut-off and have had no mineability criteria
applied to them.
Table 5 Summary of Classification of In-Situ Resources, at different cut-offs, for the Koper Lake Project chromite deposit
Classification Tonnes
(millions)
%Cr2O3 Cut-off
Inferred Resources 45.9 36.7 15% Cr2O3
Inferred Resources 43.8 37.5 20% Cr2O3
Inferred Resources 35.9 40.8 25% Cr2O3
Inferred Resources 32.6 42.2 30% Cr2O3

NI43-101 Technical Report – Koper Lake Project
32
Notes:
1. CIM Definition Standards were followed for classification of Mineral Resources.
2. The Mineral Resource estimate uses drill hole data available as of August 17, 2013.
3. The cut-off of 20% Cr2O3 is the same cut-off used for the Kemi deposit as reported by Alapieti et al. (1989) and for the
nearby Big Daddy chromite deposit (Aubut, 2012).
4. Mineral Resources are not Mineral Reserves and do not have demonstrated economic viability.
There is poor confidence in the lateral continuity of the mineralization and so these resources
cannot be used for a pre-feasibility or feasibility mining study. Table 5 presents tonnes and
grade for each Resource Classification using various cut-offs for the Koper Lake Project
chromite deposit.
Figure 14 presents the Cr2O3 tonnes-grade curves for the Koper Lake Project chromite deposit
and helps illustrate the effect of different cut-offs on available resources. The mining and
processing methods chosen will determine what proportion can be converted to reserves as
these do not take into consideration mineability and dilution.
0.0
5.0
10.0
15.0
20.0
25.0
30.0
35.0
40.0
45.0
50.0
0.0
5.0
10.0
15.0
20.0
25.0
30.0
35.0
40.0
45.0
50.0
10 15 20 25 30 35 40 45
Milli
on
s Koper Lake Project
Tonnes-Grade Curves
Tonnes (INF)
INF Grade (%Ni)
Figure 3 Cr2O3 Tonnage-Grade curves for the Koper Lake Project chromite deposit.

NI43-101 Technical Report – Koper Lake Project
33
14.2.2. Risks and Opportunities
14.2.2.1. Risks
All of the drilling done to date that has tested the chromite mineralisation is rather sparse and
is inadequate to properly characterize the mineral continuity within the plane of the
mineralization.
While higher-grade areas exist at depth and along strike they are poorly defined as a result of
the sparse drilling.
14.2.2.2. Opportunities
Infill drilling plus drilling to follow the mineral zone along strike to the east could identify and
expand the presence of the chromite-bearing horizon, in particular higher-grade material.
The mineral zone is open to depth and along strike to the east. Thus there is excellent
opportunity to expand resources significantly with additional drilling.
15. Mineral Reserve Estimates
There has not yet been any mineral reserve estimation done.
16. Mining Methods
As no mining study has yet to be done on the property no mining method has been selected.
17. Recovery Methods
As there have yet to be any bench testing done recovery methods have yet to be established at
this time but should be very similar to those reported for other chromite deposits in the area.
18. Project Infrastructure
Other than the existence of an exploration camp on the nearby Noront property servicing the
exploration programs being conducted by Bold and KWG there is no project infrastructure in
place as yet.
19. Market Studies and Contracts
To date no pre-feasibility or feasibility study has been completed, thus there is no current
market study completed or sales contracts signed.
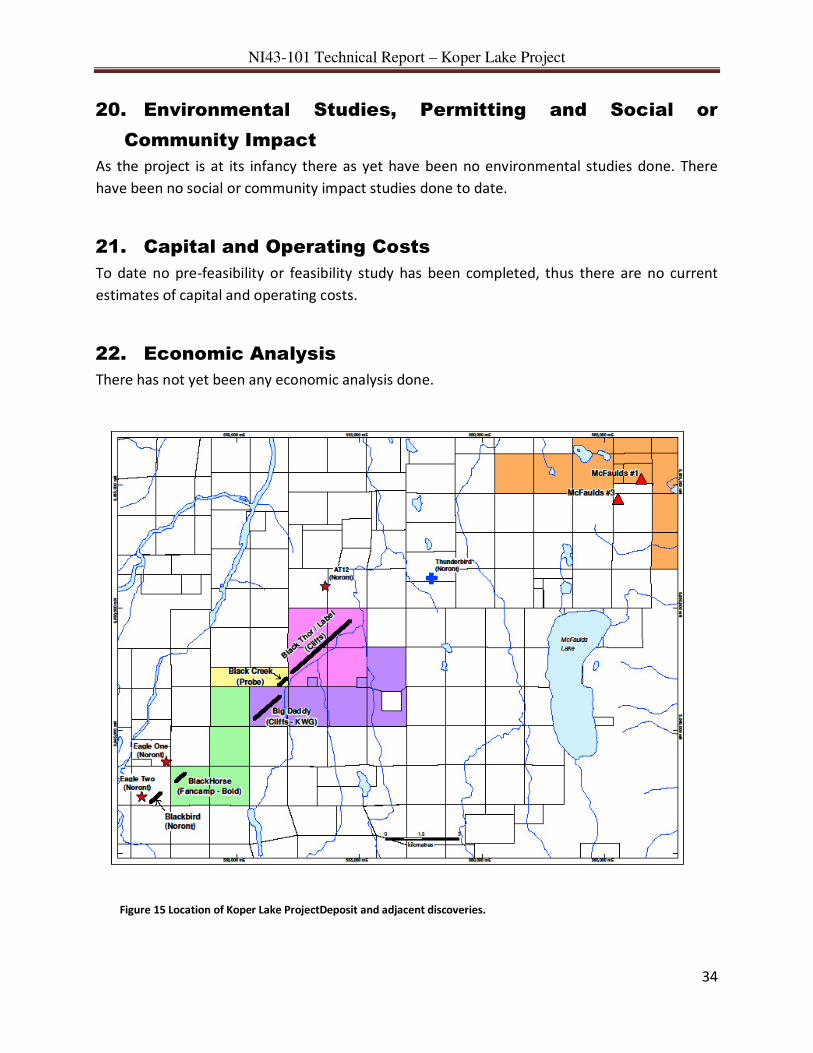
NI43-101 Technical Report – Koper Lake Project
34
20. Environmental Studies, Permitting and Social or
Community Impact
As the project is at its infancy there as yet have been no environmental studies done. There
have been no social or community impact studies done to date.
21. Capital and Operating Costs
To date no pre-feasibility or feasibility study has been completed, thus there are no current
estimates of capital and operating costs.
22. Economic Analysis
There has not yet been any economic analysis done.
Figure 15 Location of Koper Lake ProjectDeposit and adjacent discoveries.

NI43-101 Technical Report – Koper Lake Project
35
23. Adjacent Properties
There are four properties of note that are in the vicinity of the Koper Lake Project property.
These are the Noront property that contains the Eagle 1 and Eagle 2 nickel deposits and the
Blackbird chromite deposit, the Cliffs/KWG property that is host to the Big Daddy chromite
deposit, the Probe Mines property hosting the Black Creek chromite deposit and the Cliffs
Natural Resources property to the northeast that hosts the Black Thor and Black Label chromite
deposits (see Fig. 15 for location). A summary of identified resources for each of the four
chromite deposits is presented in Table 6.
23.1. Noront Eagle 1, Eagle 2 and Blackbird deposits
The discovery of the Noront Eagle 1 deposit was announced on August 28, 2007. The discovery
hole, NOT-07-01, intersected 36 meters of massive sulphide grading 1.84% Ni, 1.53% Cu, 1.14
g/t Pt, 3.49 g/t Pd, 0.13 g/t Au, and 4.8 g/t Ag. A second hole, NOT-07-05, that was drilled
below NOT-07-01, intersected 68.3 m of massive sulphide grading 5.9% Ni, 3.1% Cu, 2.87 g/t Pt,
9.87 g/t Pd, 0.61 g/t Au, and 8.5 g/t Ag. This discovery led the way to an unprecedented staking
rush in the James Bay lowlands of Northern Ontario.
The Noront Eagle 1 deposit is located approximately 5 km SW of the SKF Project Koper Lake
Project property. It is a magmatic sulphide deposit that is hosted by ultramafic rocks and is
believed to be well located within a conduit system. The deposit consists of massive sulphides,
net textured sulphides, sulphide breccias, semi-massive sulphide, but no disseminated
sulphides. Sulphide minerals include pyrrhotite, pentlandite, and chalcopyrite (Armstrong et al.
2008).
The Eagle Two deposit was discovered in February 2008. This deposit is located 2 km south-
west of the Eagle One deposit. It is hosted by shear zones that strike parallel to the contact
between the ultramafic rocks and the felsic plutonic host rocks. No resource estimate has yet
been published for the Eagle Two deposit.
Noront has located two chromite deposits, similar in mineralization to the Black Thor deposit.
They are located approximately 3 km along strike from the Koper Lake Project deposit. The
Blackbird chromite deposits (Blackbird 1 and 2) are hosted by a peridotite unit within a layered
mafic to ultramafic body. Chromite mineralisation occurs as disseminated chromite, semi-
massive chromite with intercalated olivine crystals, banded chromite interfingered with
peridotite and as massive chromite commonly interlayered with dunite and harzbergite.
Resource estimates have been completed by Micon (Gowans et al, 2010b and Murahwi et al,
2012).

NI43-101 Technical Report – Koper Lake Project
36
23.2. Big Daddy Chromite Deposit
The Big Daddy chromite deposit (Aubut, 2012) lies between the Koper Lake Project property to
the south west and the Black Creek and Black Thor/Black Label deposits to the north east. It is a
faulted extension of the same stratigraphy consisting of a well fractionated ultramafic body
hosting a zone of disseminated to massive chromite up to 65 metres thick within dunite and
overlain by pyroxenite.
23.3. Black Creek Chromite Deposit
The Black Creek chromite deposit (Murahwi et al, 2011) lies between the Big Daddy deposit to
the south west and the Black Thor/Black Label deposits to the north east. It is a faulted
extension of the same stratigraphy consisting of a well fractionated ultramafic body hosting a
zone of disseminated to massive chromite up to 65 metres thick within dunite and overlain by
pyroxenite.
23.4. Black Thor and Black Label Chromite Deposits
The Black Thor Chromite Zone has been traced for a length of 2.6 km. It is the most extensive
chromite bearing body on the property. It strikes SW – NE and has an overturned sub-vertical
dip towards the NW ranging between 70 and 85 degrees. The zone typically contains two
chromitite layers (upper and lower) that can range in thickness from 10’s of metres to over 100
m. The layers are separated by a band of disseminated chromite in peridotite/dunite ( Aubut,
2010).
Host lithologies consist of serpentinized peridotite, serpentinized dunite, dunite, and peridotite.
Chromite is present as intermittent chromite beds, finely to heavily disseminated chromite in
dunite/peridotite, and semi-massive to massive chromitite. Because of its lateral continuity
and uniformity the chromite mineralisation was likely deposited in a quiescent magmatic
environment. The Black Thor Chromite Zone is typical of most large layered igneous intrusions
such as the Kemi deposit in Finland (Alapieti et al, 1989).
Within the Black Label deposit chromite is generally present as fine to heavily disseminated
crystals in peridotite, chromitite bearing magmatic breccias, semi-massive bands and as
massive chromitite. Silicate fragments, in the form of rip up clasts and as ovoid blebs have
been observed in the zone and indicate the chromite was emplaced in a highly dynamic
magmatic environment unlike the Black Thor Deposit (Aubut, 2010).
The Black Label Chromite Zone has been traced by drilling for over 2.2 km along strike. It is
locally cross-cut and interrupted by a pyroxenitic body. It lies stratigraphically below the Black
Thor chromite zone. Chromite is generally present as fine to heavily disseminated crystals in
peridotite, chromitite bearing magmatic breccias, semi-massive bands and as massive
chromitite. Silicate fragments, in the form of rip up clasts and as ovoid blebs have been

NI43-101 Technical Report – Koper Lake Project
37
observed in the zone and indicate the chromite was emplaced in a highly dynamic magmatic
environment (Aubut, 2010).
Deposit Classification Tonnes (millions) %Cr2O3 Cut-Off (%Cr2O3)
Blackbird1 Meas. & Ind. 20.5 35.8 30% Inferred 23.5 33.1 30%
Big Daddy2 Meas. & Ind. 29.1 31.7 20% Inferred 3.4 28.1 20%
Black Creek3 Meas. & Ind. 8.6 37.4 20% Inferred 1.6 37.8 20%
Black Thor4 Meas. & Ind. Inferred 121.9 27.8 20%
Table 6 Summary of Classification of In-Situ Resources for other chromite deposits in the area.
1 Murahwi et al., 2012.
2 Aubut, 2012.
3 Murahwi et al., 2011.
4 Aubut., 2010.
24. Other Relevant Data and Information
Details on drill results and other pertinent information can be found on the following web sites:
http://www.kwgresources.com, and http://www.boldresources.com.
25. Interpretation and Conclusions
Drilling to date has identified a chromite horizon that is potentially economic. The zone does
not come to surface but is open along strike.
Using industry-standard block modelling techniques a resource model was created covering the
Koper Lake Project chromite deposit. Querying this model, using a 20% Cr2O3 cut-off, there is a
total in-situ Inferred resources 43.8 million tonnes at a grade of 37.5% Cr2O3. Due to the depth
below surface of the mineral zone this material potentially could be mined by underground
mining methods, but no mineability criteria have been applied. The confidence in this estimate
is such that only a preliminary economic assessment should be attempted using this data.
Initial metallurgical testing consisting of ferro-chrome melting of available chromite material
shows that a very high grade product can be produced enhancing the potential economics of
the deposit.
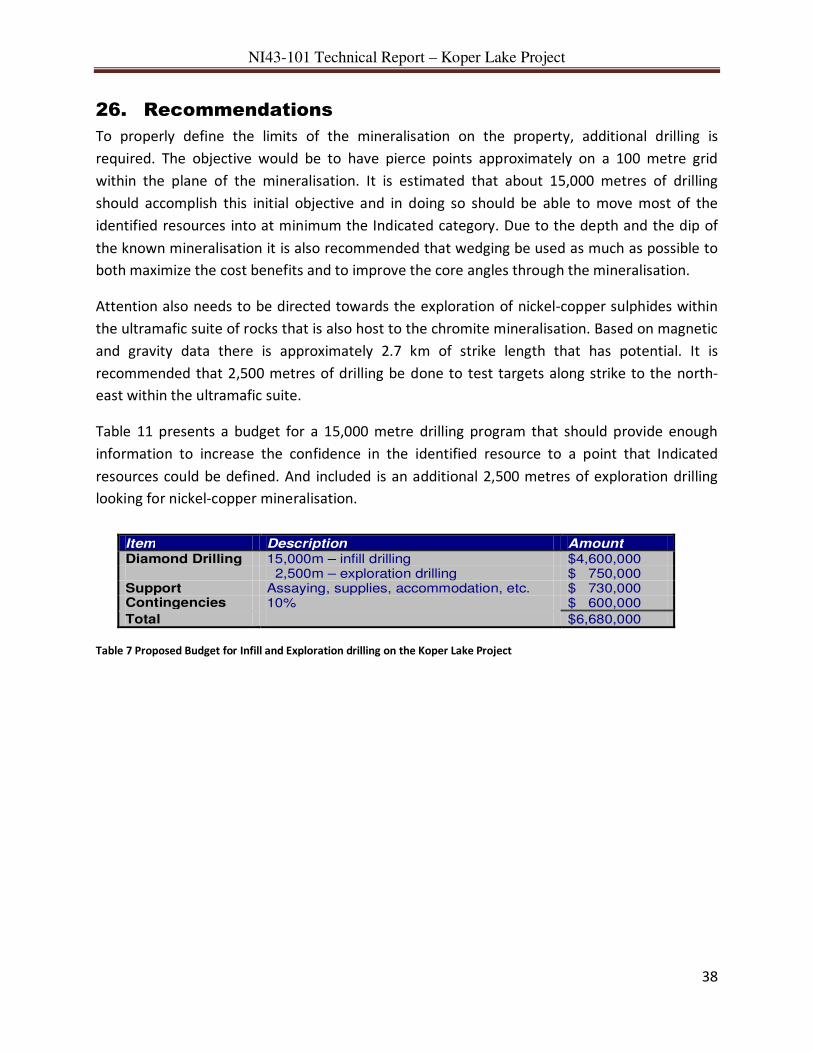
NI43-101 Technical Report – Koper Lake Project
38
26. Recommendations
To properly define the limits of the mineralisation on the property, additional drilling is
required. The objective would be to have pierce points approximately on a 100 metre grid
within the plane of the mineralisation. It is estimated that about 15,000 metres of drilling
should accomplish this initial objective and in doing so should be able to move most of the
identified resources into at minimum the Indicated category. Due to the depth and the dip of
the known mineralisation it is also recommended that wedging be used as much as possible to
both maximize the cost benefits and to improve the core angles through the mineralisation.
Attention also needs to be directed towards the exploration of nickel-copper sulphides within
the ultramafic suite of rocks that is also host to the chromite mineralisation. Based on magnetic
and gravity data there is approximately 2.7 km of strike length that has potential. It is
recommended that 2,500 metres of drilling be done to test targets along strike to the north-
east within the ultramafic suite.
Table 11 presents a budget for a 15,000 metre drilling program that should provide enough
information to increase the confidence in the identified resource to a point that Indicated
resources could be defined. And included is an additional 2,500 metres of exploration drilling
looking for nickel-copper mineralisation.
Table 7 Proposed Budget for Infill and Exploration drilling on the Koper Lake Project
Item Description Amount Diamond Drilling 15,000m – infill drilling $4,600,000 2,500m – exploration drilling $ 750,000 Support Assaying, supplies, accommodation, etc. $ 730,000 Contingencies 10% $ 600,000
Total $6,680,000

NI43-101 Technical Report – Koper Lake Project
39
27. References
Alapieti T. T., Kujanpää J., Lahtinen J. J. and Papunen H. 1989. The Kemi stratiform chromitite
deposit, northern Finland; Economic Geology, v. 84, p. 1057-1077.
Armstrong T., Puritch E., and Yassa A. 2008. Technical report and resource estimate on the
Eagle One deposit, Double Eagle property, McFaulds Lake area, James Bay Lowlands,
Ontario, Latitude 52º45’ N, Longitude -86º17’; Report No. 149, P&E Mining Consultants
Inc. prepared for Noront Resources Ltd. 129 p.
Armstrong T. 2013. Quality Control Report for KWG Resources-Fancamp Drilling at the Koper
Lake Chromite Property, Ring of Fire, Northern Ontario; Internal report prepared for
KWG Resources Inc., 9 p.
Aubut, A. 2010. National Instrument 43-101Technical Report, McFauld’s Lake Area, Ontario,
Canada, Black Thor Chromite Deposit Mineral Resource Estimation Technical Report;
Freewest Resources Canada Ltd. internal report, 65 p.
Aubut, A. 2012. National Instrument 43-101Technical Report, Big Daddy Chromite Deposit,
McFaultds Lake Area, Ontario, Canada, Pocupine Mining Division, NTS 43D16, Mineral
Resource Estimation Technical Report; prepared for KWG Resources Inc., 70 p.
Barnes, A. 2013. Black Horse Chromite Continuous Smelting Testwork, July 2013; Xstrata
Process Support, internal report prepared for KWG Resources Inc., 15 p
Bell R. 1887. Report on an exploration of portions of the Attawapiskat & Albany Rivers, Lonely
Lake to James’ Bay; Montreal, Dawson Brothers 1887, Separate report No 239,
Geological Survey of Canada, Part G, Annual Report 1886, 38 p.
Geosig (2013) Gravimetric and Magnetic Surveys on Koper Lake Project, Blackhorse Grid, BMA
526 862 Area, Porcupine Mining Division, James Bay Lowlands of Northern Ontario,
43D/09; prepared for Bold Ventures Inc., 40 p.
Gowans R., Spooner, J., San Martin, A.J. and Murahwi C. 2010b. NI 43-101 Technical Report on
the Mineral Resource estimate for the Blackbird Chrome Deposits, James Bay Lowlands,
Northern Ontario; Micon International Ltd., prepared for Noront Resources Limited, 188
p.

NI43-101 Technical Report – Koper Lake Project
40
Hogg, Scott and Associates (2003) Airborne Magnetic and Electromagnetic Survey, McFauld’s
Lake Area – Northwestern Ontario, Compilation and Interpretation Report; prepared for
Fancamp Exploration Ltd., 13 p.
Hogg, Scott and Associates (2005) Compilation and Interpretation Report of Two Ground
Magnetic and Horizontal Loop Electromagnetic Surveys, McFauld’s Lake Area –
Northwestern Ontario; prepared for Fancamp Exploration Ltd., 13 p.
Hogg, Scott and Associates (2008) Report on a Helicopter-Borne Electromagnetic and Magnetic
Survey carried out by Aeroquest Ltd. Under contract to Billiken Management on behalf
of Noront Resources Ltd. And Participating Companies, McFauld’s Lake Area, James Bay
Lowlands, Ontario, Canada; prepared for Fancamp Exploration Ltd., 13 p.
JVX (2009) Report on Drill Hole IP Surveys, McFauld’s Lake Property, James Bay Lowlands,
Northern Ontario; prepared for Fancamp Exploration ltd., 79 p.
Murahwi C., San Martin, A.J., and Spooner, J., 2012. Technical Report on the Updated Mineral
Resource estimate for the Black Creek Chrome Deposits, McFaulds Lake Area, James Bay
Lowlands, Northern Ontario, Canada; Micon International Ltd., prepared for Probe
Mines Limited, 135 p.
Murahwi C., San Martin, A.J., Gowans R., and Spooner, J., 2011. Technical Report on the
Updated Mineral Resource estimate for the Blackbird Chrome Deposits, McFaulds Lake
Property, James Bay Lowlands, Ontario, Canada; Micon International Ltd., prepared for
Noront Resources Limited, 177 p.
Percival J.A. 2007. Geology and metallogeny of the Superior Province, Canada, in Goodfellow,
W.D., ed., Mineral Deposits of Canada: A Synthesis of Major Deposit-Types, District
Metallogeny, the Evolution of Geological Provinces, and Exploration Methods;
Geological Association of Canada, Mineral Deposits Division, Special Publication No. 5, p.
903-928.
Riley J. L. 2003. Flora of the Hudson Bay Lowlands and its Postglacial Origins; National Research
Council of Canada Press, Ottawa, 236 p.
Stott G. M. 2007. Precambrian geology of the Hudson Bay and James Bay lowlands region
interpreted from aeromagnetic data – east sheet; Ontario Geological Survey,
Preliminary Map P.3597, scale 1:500,000.

NI43-101 Technical Report – Koper Lake Project
41
Certificate of Qualifications
I, Alan James Aubut, do hereby certify the following:
• I am the author of this National Instrument 43-101 technical document titled “National Instrument 43-
101Technical Report, Koper Lake Project Chromite Deposit, McFauld’s Lake Area, Ontario, Canada,
Porcupine Mining Division, NTS 43D16, Mineral Resource Estimation Technical Report”, dated August 29,
2013.
• I am a graduate of Lakehead University, in Thunder Bay, Ontario with the degree of Honours Bachelor of
Science, Geology (1977).
• I am a graduate of the University of Alberta, in Edmonton, Alberta with the degree of Master of Science,
Geology (1979).
• I hold an Applied Geostatistics Citation through the Faculty of Extension of the University of Alberta, in
Edmonton, Alberta.
• I have been actively practicing geology since 1979.
• I have been practicing mineral resource estimation since 2000.
• I am currently a member in good standing of the Association of Professional Geoscientists of Ontario.
• From 2000 to 2009 I was a member in good standing of the Association of Professional Engineers and
Geoscientists of Manitoba.
• I am a member of the Society of Economic Geologists.
• I operate under the business name of Sibley Basin Group Geological Consulting Services Ltd., a business
independent of KWG Resources and do not expect to become an insider, associate or employee of the
issuer.
• The business address of Sibley Basin Group Geological Consulting Services Ltd. is:
Sibley Basin Group
PO Box 304
300 First St. West
Nipigon, ON
P0T 2J0
The work described in this report is based in part on a field visit to the McFauld’s Lake exploration camp in 2009.
KWG Resources Inc. and Bold Ventures Inc. supplied copies of all reports and data available. It was these data that
were used for the current project. The resource estimate generated with this data is effective as of August 29,
2013.
Alan Aubut
August 29, 2013

NI43-101 Technical Report – Koper Lake Project
42
Appendix 1 – Summary of Diamond Drilling
5
470
00 E
5470
00 E
5475
00 E
5475
00 E
5480
00 E
5480
00 E
5485
00 E
5485
00 E
5490
00 E
5490
00 E
5495
00 E
5495
00 E
5500
00 E
5500
00 E
5505
00 E
5505
00 E
5510
00 E
5510
00 E
5842000 N 5842000 N
5842500 N 5842500 N
5843000 N 5843000 N
5843500 N 5843500 N
5844000 N 5844000 N
5844500 N 5844500 N
5845000 N 5845000 N
5845500 N 5845500 N
5846000 N 5846000 N
5846500 N 5846500 N
Figure 16 Plan of Koper Lake Project Diamond Drilling.

NI43-101 Technical Report – Koper Lake Project
43
547600 E 547600 E
547800 E 547800 E
5842
500
N
5842
500
N
5843
000
N
5843
000
N
5843
500
N
5843
500
N
5842
500
N
584
2500 N
5843
000
N
584
3000 N
5843
500
N
584
3500 N
-1000 Elev -1000 Elev
-500 Elev -500 Elev
0 Elev 0 Elev
FNCB-13-30
FNCB-13-32
FNCB-13-34FNCB-13-36
FN-10-26
FNCB-13-30
FNCB-13-32
FNCB-13-34
FNCB-13-36
FN-10-26
FN-08-06
FN-10-01FN-10-02FN-10-03
FN-10-09
FN-08-06
FN-10-01
FN-10-02
FN-10-03FN-10-09
Figure 17 Sample cross section (547750E) for the Koper Lake Project. The orange line is a slice through
the mineral envelope used to select samples.

NI43-101 Technical Report – Koper Lake Project
44
Table 8 Drill Hole Collar Locations
BHID UTM-X UTM-Y Elevation Length Azimuth Dip
FN-08-01 547660 5843046 172 303.35 270 -50
FN-08-02 547660 5843046 172 181.2 270 -70
FN-08-03 547444 5843052 172 486.2 90 -70
FN-08-04 547444 5843052 172 356.6 90 -50
FN-08-05 547449 5842798 172 506.1 135 -45
FN-08-06 547325 5842995 172 603.5 90 -45
FN-08-07 549325 5843733 172 381 270 -50
FN-08-08 547687 5843150 172 165 270 -45
FN-08-09 547687 5843150 172 134.1 270 -50
FN-08-10 547592 5843046 170 122 90 -45
FN-08-11 550140 5846010 172 150 315 -50
FN-08-12 550140 5846010 172 165.85 315 -70
FN-10-01 547636 5842932 172 108 90 -50
FN-10-02 547636 5842932 171 213 90 -70
FN-10-03 547647 5842978 171 120 90 -50
FN-10-04 547640 5843012 171 63 90 -50
FN-10-05 547672 5843019 171 105 270 -70
FN-10-06 547620 5842885 171 100 90 -45
FN-10-07 547593 5843074 171 93.1 90 -50
FN-10-08 547586 5843105 171 60 90 -50
FN-10-09 547710 5842956 171 90 270 -70
FN-10-10 547680 5843026 171 90 270 -60
FN-10-11 550473 5845870 170 300 315 -45
FN-10-12 550473 5845870 170 255 135 -50
FN-10-13 550235 5845830 176 303 315 -50
FN-10-14 550080 5843100 177 360.2 150 -50
FN-10-15 549215 5843040 177 249 135 -50
FN-10-16 550230 5842860 177 183 135 -50
FN-10-17 547494 5843190 172 170 90 -50
FN-10-18 547513 5843150 172 147 360 -85
FN-10-19 547513 5843150 172 1009 360 -85
FN-10-20 550000 5843000 174 303 150 -50
FN-10-21 549850 5844050 174 324 135 -50
FN-10-22 550090 5842950 170 264 150 -70
FN-10-23 550090 5842950 170 192 150 -50
FN-10-24 550493 5844236 170 264 140 -50
FN-10-25* 548018 5843234 172 1082.3 220 -80
FN-10-26* 547860 5843040 174 1086 297 -80
FN-10-27 547950 5843140 173 237 320 -48.5
FN-10-28 547950 5843140 173 396 320 -75

NI43-101 Technical Report – Koper Lake Project
45
BHID UTM-X UTM-Y Elevation Length Azimuth Dip
FNCA-13-29 547456 5843253 175 1041.8 135 -88
FNCA-13-29W1 547456 5843253 36 135 -88
FNCB-13-30* 547756 5843277 173 774 180 -69
FNCB-13-31 547451 5843171 169 978 177.97 -70
FNCB-13-32* 547756 5843277 173 861 151.9 -73
FNCB-13-33* 547451 5843171 169 861 160.15 -64
FNCB-13-34 547741 5842831 175 363 155 -70
FNCB-13-35* 547925 5843275 175 549 154.2 -77
FNCB-13-36 547741 5842831 175 201 155 -45
FNCB-13-37 548075 5843275 175 252 165 -70
* holes used in resource estimation.

NI43-101 Technical Report – Koper Lake Project
46
Appendix 2 – Exploratory Data Analysis
Histograms
Fre
qu
en
cy
CR2O3
.0 10.0 20.0 30.0 40.0 50.0
.000
.050
.100
.150
.200
.250CR2O3 Histogram
Number of Data 411
number trimmed 14
mean 33.4242std. dev. 14.1653
coef. of var .4238
maximum 48.9600upper quartile 44.4858
median 40.0083lower quartile 23.8375
minimum .0000
Fre
qu
en
cy
SG
2.66 3.06 3.46 3.86 4.26
.000
.050
.100
.150
.200SG Histogram
Number of Data 411
number trimmed 14
mean 3.7000std. dev. .4938
coef. of var .1334
maximum 4.3221upper quartile 4.1107
median 3.9113lower quartile 3.2910
minimum 2.6629

NI43-101 Technical Report – Koper Lake Project
47
Scatter Plots
SG
CR2O3
Cr2O3 vs SG Scatterplot
.0 10.0 20.0 30.0 40.0
2.66
3.06
3.46
3.86
4.26 Number of data 411Number plotted 411
Number trimmed 14
X Variable: mean 33.424std. dev. 14.165
Y Variable: mean 3.700std. dev. .494
correlation .994rank correlation 1.000

NI43-101 Technical Report – Koper Lake Project
48
Appendix 3 – OK Search Parameters Used
UC
SA
UC
SB
UC
SC
OC
TA
NT
METH
OD
USED
?
MIN
IMU
M
NU
MB
ER
OF
OC
TA
NTS
MIN
IMU
M
SA
MP
LES P
ER
OC
TA
NT
MA
XIM
UM
SA
MP
LES P
ER
OC
TA
NT
MIN
IMU
M
NU
MB
ER
OF
SA
MP
LES
MA
XIM
UM
NU
MB
ER
OF
SA
MP
LES
MA
X. N
UM
BER
OF S
AM
PLE
S
PER
HO
LE
10 120 120 YES 5 1 4 20 32 6
15 160 160 YES 5 1 4 10 32 6
20 200 200 NO n/a n/a n/a 5 32 0
- across the dip
- down the dip
- along the strike

NI43-101 Technical Report – Koper Lake Project
49
Appendix 4 – Block Model Plans and Sections
NN Models Sample Plan views – Koper Lake Project chromite deposit
-250 Elev.
-500 Elev.

NI43-101 Technical Report – Koper Lake Project
50
-750 Elev.
-1000 Elev.

NI43-101 Technical Report – Koper Lake Project
51
OK Models: Sample Plan views - – Koper Lake Project chromite deposit
-250 Elev.
-500 Elev.

NI43-101 Technical Report – Koper Lake Project
52
-750 Elev.
-1000 Elev.

NI43-101 Technical Report – Koper Lake Project
53
NN Model – N-S Sample Sections
– Koper Lake Project chromite deposit
Section 547450E Section 547550E

NI43-101 Technical Report – Koper Lake Project
54
Section 547650E Section 547750E

NI43-101 Technical Report – Koper Lake Project
55
Section 547850E Section 547950E

NI43-101 Technical Report – Koper Lake Project
56
OK Models - N-S Sample Sections
– Koper Lake Project chromite deposit
Section 547450E Section 547550E
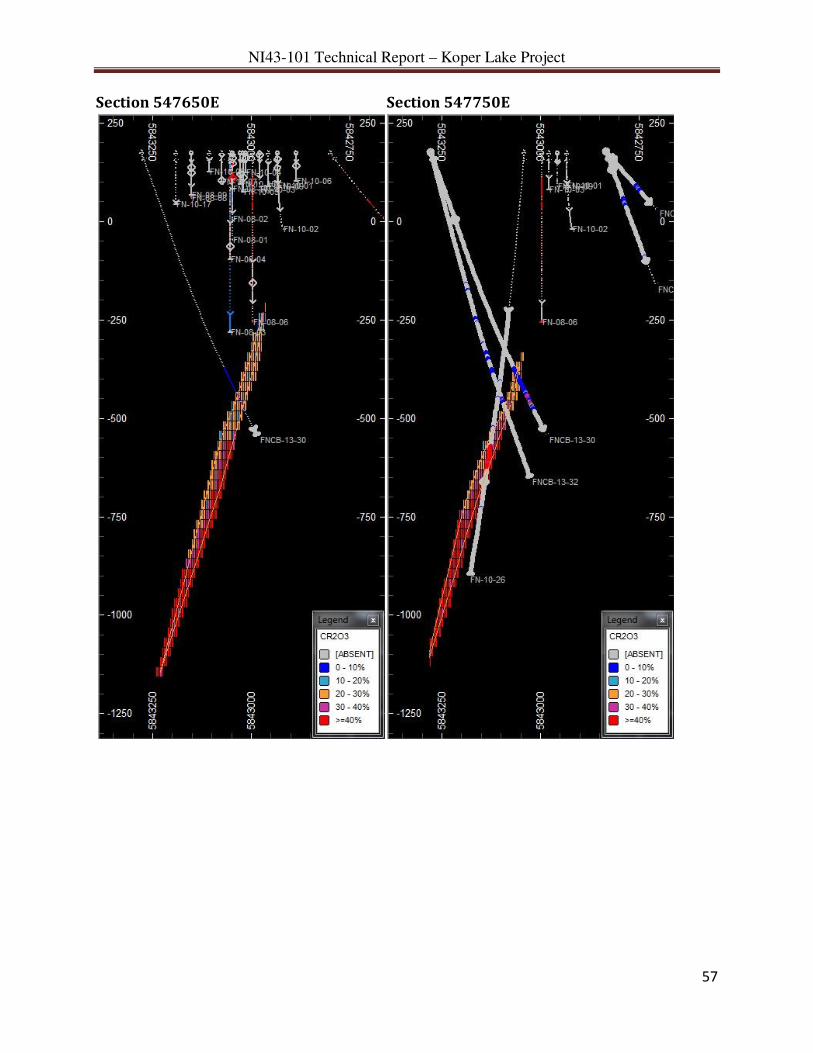
NI43-101 Technical Report – Koper Lake Project
57
Section 547650E Section 547750E

NI43-101 Technical Report – Koper Lake Project
58
Section 547850E Section 547950E

NI43-101 Technical Report – Koper Lake Project
59
Appendix 5 - Model Validation
Swath Plots - Cr2O3
UCSA
0
2
4
6
8
10
12
0
5
10
15
20
25
30
35
40
45
1.3 3.9 6.5 9.1 11.7 14.3 16.9 19.5 22.1 24.7%
Blo
cks
%N
i
UCSA
Koper Lake Project
Swath Plot - Cr2O3 - UCSA
1_fncb_data1u
2_nn_fncb
3_ok_fncb
4_Num.Blks.
UCSB
0
2
4
6
8
10
12
14
16
0
5
10
15
20
25
30
35
40
45
50
120 220 320 420 520 620 720 820 920 1020
% B
lock
s
%N
i
UCSB
Koper Lake Project
Swath Plot - Cr2O3 - UCSB
1_fncb_data1u
2_nn_fncb
3_ok_fncb
4_Num.Blks.

NI43-101 Technical Report – Koper Lake Project
60
UCSC
0
2
4
6
8
10
12
14
16
0
5
10
15
20
25
30
35
40
45
50
62.5 147.5 232.5 317.5 402.5 487.5 572.5 657.5 742.5 827.5
% B
lock
s
%N
i
UCSC
Koper Lake Project
Swath Plot - Cr2O3 - UCSC
1_fncb_data1u
2_nn_fncb
3_ok_fncb
4_Num.Blks.

NI43-101 Technical Report – Koper Lake Project
61
Appendix 6 – Resource Classification Definitions
The following is an extract from the CIM Definition Standards for Mineral Resources and
Mineral Reserves, adopted December 11, 2005.
“A Mineral Resource is a concentration or occurrence of diamonds, natural solid inorganic
material, or natural solid fossilized organic material including base and precious metals, coal,
and industrial minerals in or on the Earth’s crust in such form and quantity and of such a
grade or quality that it has reasonable prospects for economic extraction. The location,
quantity, grade, geological characteristics and continuity of a Mineral Resource are known,
estimated or interpreted from specific geological evidence and knowledge.
The term Mineral Resource covers mineralization and natural material of intrinsic economic interest
which has been identified and estimated through exploration and sampling and within which Mineral
Reserves may subsequently be defined by the consideration and application of technical, economic,
legal, environmental, socio-economic and governmental factors. The phrase ‘reasonable prospects
for economic extraction’ implies a judgement by the Qualified Person in respect of the technical and
economic factors likely to influence the prospect of economic extraction. A Mineral Resource is an
inventory of mineralization that under realistically assumed and justifiable technical and economic
conditions might become economically extractable. These assumptions must be presented explicitly
in both public and technical reports.
Inferred Mineral Resource
An ‘Inferred Mineral Resource’ is that part of a Mineral Resource for which quantity and
grade or quality can be estimated on the basis of geological evidence and limited sampling and
reasonably assumed, but not verified, geological and grade continuity. The estimate is based on
limited information and sampling gathered through appropriate techniques from locations
such as outcrops, trenches, pits, workings and drill holes.
Due to the uncertainty that may be attached to Inferred Mineral Resources, it cannot be assumed that
all or any part of an Inferred Mineral Resource will be upgraded to an Indicated or Measured
Mineral Resource as a result of continued exploration. Confidence in the estimate is insufficient to
allow the meaningful application of technical and economic parameters or to enable an evaluation of
economic viability worthy of public disclosure. Inferred Mineral Resources must be excluded from
estimates forming the basis of feasibility or other economic studies.
Indicated Mineral Resource
An ‘Indicated Mineral Resource’ is that part of a Mineral Resource for which quantity, grade
or quality, densities, shape and physical characteristics, can be estimated with a level of
confidence sufficient to allow the appropriate application of technical and economic
parameters, to support mine planning and evaluation of the economic viability of the deposit.
The estimate is based on detailed and reliable exploration and testing information gathered

NI43-101 Technical Report – Koper Lake Project
62
through appropriate techniques from locations such as outcrops, trenches, pits, workings and
drill holes that are spaced closely enough for geological and grade continuity to be reasonably
assumed.
Mineralization may be classified as an Indicated Mineral Resource by the Qualified Person when the
nature, quality, quantity and distribution of data are such as to allow confident interpretation of the
geological framework and to reasonably assume the continuity of mineralization. The Qualified
Person must recognize the importance of the Indicated Mineral Resource category to the
advancement of the feasibility of the project. An Indicated Mineral Resource estimate is of sufficient
quality to support a Preliminary Feasibility Study which can serve as the basis for major
development decisions.
Measured Mineral Resource
A ‘Measured Mineral Resource’ is that part of a Mineral Resource for which quantity, grade
or quality, densities, shape, and physical characteristics are so well established that they can be
estimated with confidence sufficient to allow the appropriate application of technical and
economic parameters, to support production planning and evaluation of the economic viability
of the deposit. The estimate is based on detailed and reliable exploration, sampling and testing
information gathered through appropriate techniques from locations such as outcrops,
trenches, pits, workings and drill holes that are spaced closely enough to confirm both
geological and grade continuity.
Mineralization or other natural material of economic interest may be classified as a Measured
Mineral Resource by the Qualified Person when the nature, quality, quantity and distribution of data
are such that the tonnage and grade of the mineralization can be estimated to within close limits and
that variation from the estimate would not significantly affect potential economic viability. This
category requires a high level of confidence in, and understanding of, the geology and controls of the
mineral deposit.”