Prepared by the Office of the Treasurer · Execute multi-year contract to ... Vendor Purpose...
23
Prepared by the Office of the Treasurer
-
Upload
nguyenphuc -
Category
Documents
-
view
218 -
download
2
Transcript of Prepared by the Office of the Treasurer · Execute multi-year contract to ... Vendor Purpose...

Prepared by the Office of the Treasurer
1
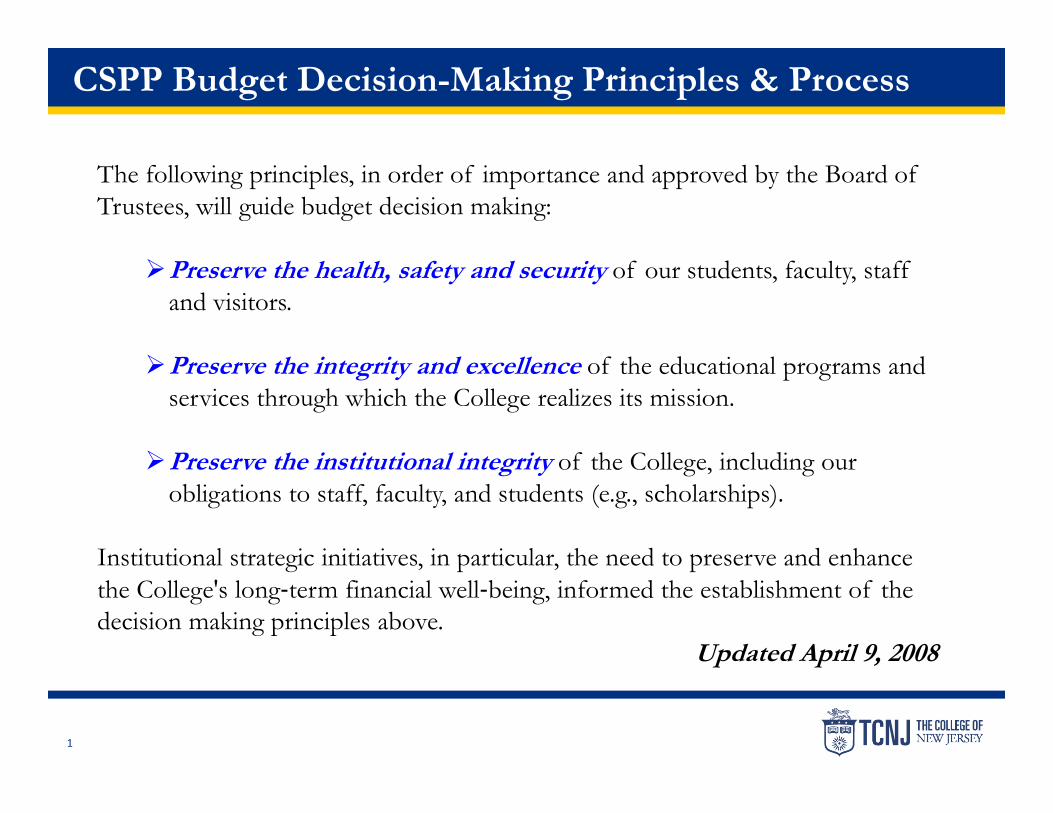
CSPP Budget Decision-Making Principles & Process
The following principles, in order of importance and approved by the Board of Trustees, will guide budget decision making:
Preserve the health, safety and security of our students, faculty, staff and visitors.
Preserve the integrity and excellence of the educational programs and services through which the College realizes its mission.
Preserve the institutional integrity of the College, including our obligations to staff, faculty, and students (e.g., scholarships).
Institutional strategic initiatives, in particular, the need to preserve and enhance the College's long‐term financial well‐being, informed the establishment of the decision making principles above.
Updated April 9, 2008

2
ALL-FUNDS BUDGETINGThis model takes a holistic view of budgeting and places special focus on strategic allocation of resources, support of operational excellence, and implementation of revenue enhancement strategies as illustrated below:
Revenue Enhancements• Enrollment Management Strategies –
Winter Term and Freshman Provisional Students
• Targeted Grants & Contracts• Strategic Summer and January Term
Scheduling (including Blended and Online)
• Expand ESLAS and International Initiatives
• Strategic use of Facilities
Institutional Budgeting• Campus-wide resource allocation
discussions• Funding of Institutional Priorities• Examination of Recurring Budget Savings• Monitor Operating Budget Key
Performance Indicators• Develop Capital Budget and Update
Reserves Policy Benchmark Targets
Strategic Reallocation of Resources• Resource allocation to areas most critical to
TCNJ’s success• Investment in IT tools to provide better
Decision-Support Metrics • Multi-Year Financial Plan to manage and
track various financial strategies
Operational Excellence• Solicit campus-wide input for sustainable
cost savings strategies• Review of Academic and Administrative
processes to identify efficiencies• Create inventory of Cost Savings and
update impact via TCNJ’s website annually
STRATEGIC BUDGET MODEL

3
FY15 TCNJ’s Strategic Plan Alignment
As a result of strategic planning efforts and a campus-wide commitment to prudent fiscal management, TCNJ is now poised to make significant strategic investments over the next several years and the following strategic priorities will continue to be areas of focus during the FY2015 budget development:
Invest in revenue enhancements initiatives
Instructional technology & technology that allows us to improve processes
Raising TCNJ’s visibility
Investments in signature experiences
Improve on the 4-year graduation rate and student advising
Live a culture of diversity and inclusion
Investments in professional development for faculty, staff and students
Investments in facilities and infrastructure

4
FY14 – FY15 Overview

5
Cash & Investments Portfolio
Liquidity remains healthy, with $137.4 million in cash and investments as of 8/31/2014.
Investment income and gains = $293,000 as of 8/31/2014, versus the budget of $3.3 million.
Portfolio StrategyMarketValue&AccruedInterest(inthousands)
WorkingCapital Thesefundsareneededonaday‐to‐daybasis,andareinvestedtoprovidedailyliquidity.
$10,572
ContingencyCash
Thissegmentservesasasupplementtoworkingcapital,andishighlyliquidincaseitisnecessarytoutilizethefundsforoperatingpurposes.
70,031
Short‐DurationFixedIncome
1‐3yearfixedincomeportfoliothatgeneratesincomeandservesasaWorkingCapitalliquiditycushion.
25,842
Multi‐AssetClassGrowth‐orientedportfoliotargetingabove‐inflationrateofreturninsupportoftheCollege’slong‐termgoals.
30,943
$137,388TOTALCASHANDINVESTMENTSasofAugust31,2014
6
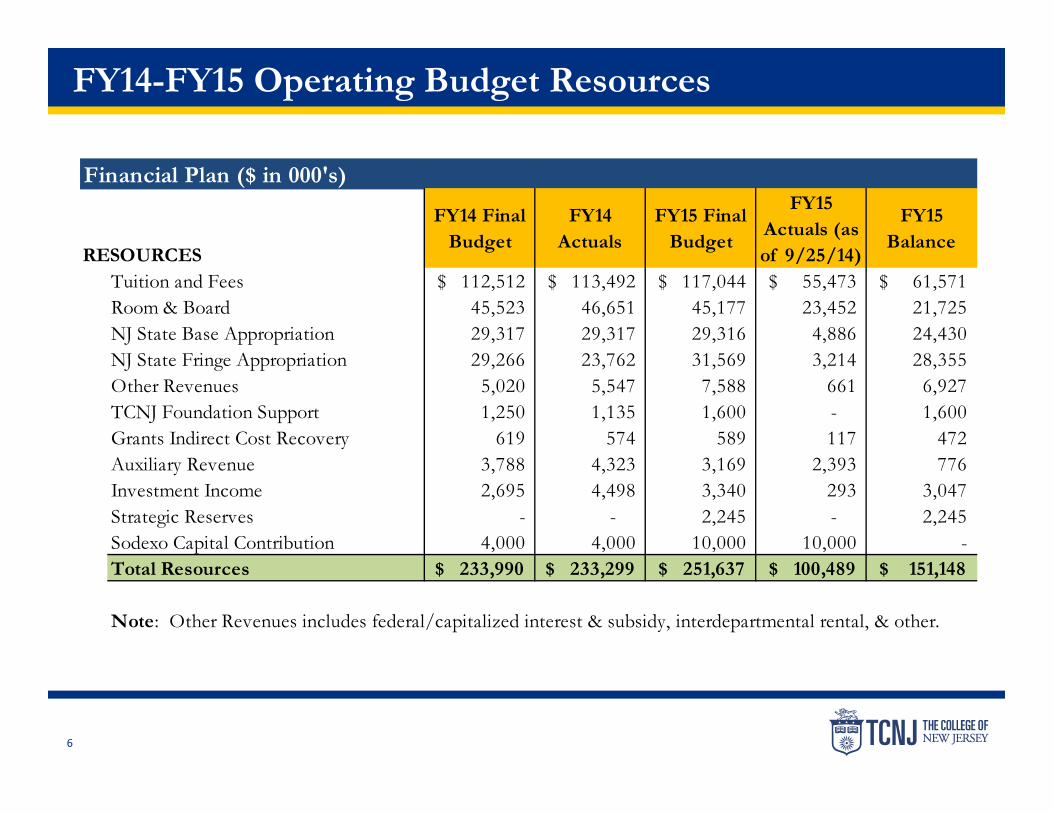
FY14-FY15 Operating Budget Resources
Financial Plan ($ in 000's)
RESOURCES
FY14 Final Budget
FY14 Actuals
FY15 Final Budget
FY15 Actuals (as of 9/25/14)
FY15 Balance
Tuition and Fees 112,512$ 113,492$ 117,044$ 55,473$ 61,571$ Room & Board 45,523 46,651 45,177 23,452 21,725 NJ State Base Appropriation 29,317 29,317 29,316 4,886 24,430 NJ State Fringe Appropriation 29,266 23,762 31,569 3,214 28,355 Other Revenues 5,020 5,547 7,588 661 6,927 TCNJ Foundation Support 1,250 1,135 1,600 - 1,600 Grants Indirect Cost Recovery 619 574 589 117 472 Auxiliary Revenue 3,788 4,323 3,169 2,393 776 Investment Income 2,695 4,498 3,340 293 3,047 Strategic Reserves - - 2,245 - 2,245 Sodexo Capital Contribution 4,000 4,000 10,000 10,000 - Total Resources 233,990$ 233,299$ 251,637$ 100,489$ 151,148$
Note: Other Revenues includes federal/capitalized interest & subsidy, interdepartmental rental, & other.

7
FY14-FY15 Operating Budget Allocation
Financial Plan ($ in 000's)
EXPENDITURES & TRANSFERS
FY14 Final Budget
FY14 Actuals
FY15 Final Budget
FY15 Actuals (as of
9/25/14)
FY15 Balance
Instruction & Research 71,162$ 65,467$ 70,920$ 10,413$ 60,507$ Institutional Scholarships & Waivers 15,711 16,060 16,450 7,227 9,223 Academic Support 14,412 14,517 16,256 4,862 11,394 Student Services 15,531 15,906 16,907 3,207 13,700 Direct Student Support 116,816$ 111,950$ 120,533$ 25,709$ 94,824$ Institutional Support 15,568 13,925 18,032 5,695 12,337 Operations & Maintenance of Plant 22,403 22,389 25,014 6,004 19,010 Total Educational & General 154,787$ 148,264$ 163,579$ 37,408$ 126,171$
31,840 31,471 32,481 5,148 27,333 28,102 28,115 29,975 542 29,433 19,073 23,463 25,345 646 24,699
TOTAL EXPENDITURES & TRANSFERS 233,802$ 231,313$ 251,380$ 43,744$ 207,636$ OPERATING BUDGET SURPLUS 188$ 1,986$ 257$ 56,745$ (56,488)$
Auxiliary Expenses
Total Transfers to Capital & Strategic ReservesTotal Debt Service (Principal & Interest)

8
Net Revenue Enhancements – FY14 & FY15
Targeted Grants and Contracts
Partnership/ Sponsor
PurposeFY2014 Actuals
FY2015 Projected
Status
Nursing Education Capital Health, Hopewell Campus
Expand Nursing program capacity - Off-site RN to BSN degree program
$ - $ 81,450
Enrollment Projection
Realized - Fall 2015
ESL Certification
US Department of Education and various NJ school districts
Training for non-ESL-certified Pre K-12 teachers and administrators
$ 218,000 $ 193,500
Enrollment Projection
Realized - Fall 2015
Brazilian STEM Education Program
Brazilian Government
Providing STEM Education for cohort of Brazilian Students; expanding out-of-state/ international student population
$ - $1,200,000
Enrollment Projection
Realized - Fall 2015
Institute for ESL and American Studies
American Council for International Education & Various Other Partnerships
ESL courses for international students $ 188,000 $ 254,000
Enrollment Projection
Realized - Fall 2015
406,000$ 1,728,950$ Totals by FY

9
Procurement Cost Savings/Cost Avoidance
Annual Return
One-Time Investment
Annual Return
One-Time Investment
Dining Services Sodexo Support for TCNJ’s commencement programs.
$ 40,000 $ 40,000 Realized
Dining Services Sodexo Funding for institutional scholarships.
$ 100,000 $ 100,000 Realized
Dining Services Sodexo
Energy audit services. (Non-cash item; $25,000 in services provided or coordinated through Sodexo.)
$ 25,000 $ 25,000 Realized
Dining Services Sodexo
Renovation – Dining Facilities & BSC. Total $31,000,000 one-time capital contribution; final payment of $17 million due July 2015 (FY16).
$4,000,000 $10,000,000 Realized
ERP Systems Oracle Execute multi-year contract to lower the annual cost.
$ 30,000 $ 30,000 Realized
StatusFY2015 FY2014
PurposeVendorContract/
Service
10
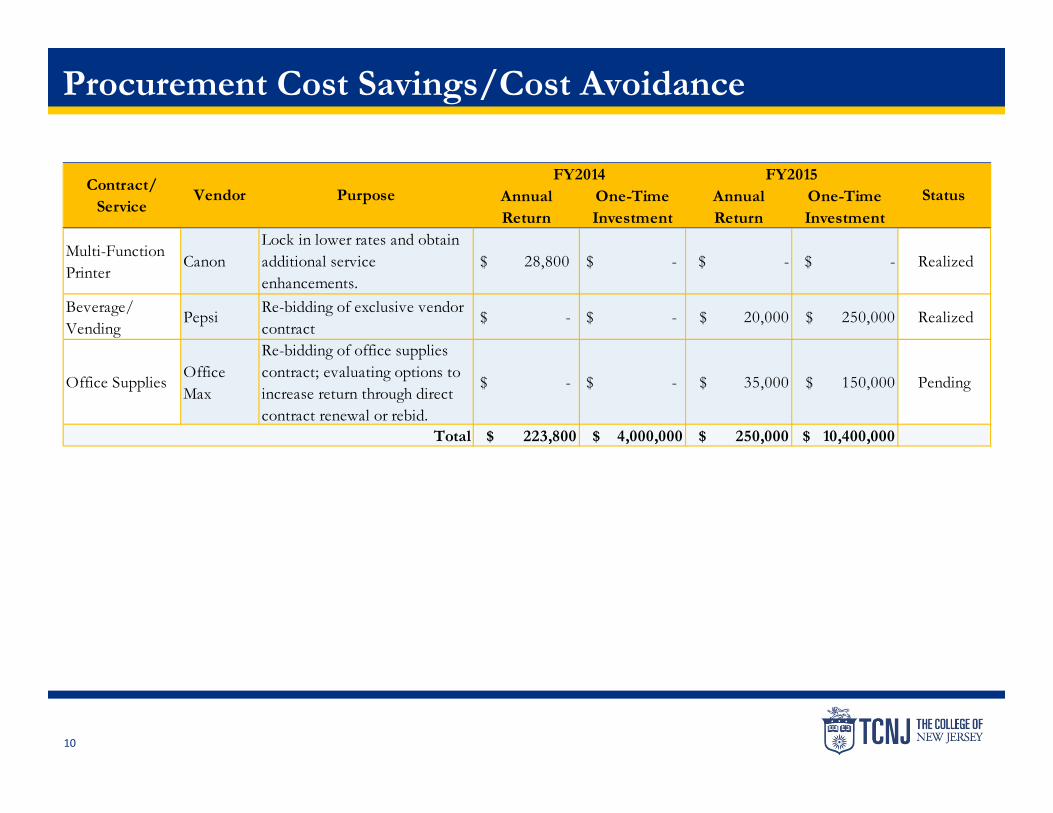
Procurement Cost Savings/Cost Avoidance
Annual Return
One-Time Investment
Annual Return
One-Time Investment
Multi-Function Printer
CanonLock in lower rates and obtain additional service enhancements.
$ 28,800 $ - $ - $ - Realized
Beverage/ Vending
Pepsi Re-bidding of exclusive vendor contract
$ - $ - $ 20,000 $ 250,000 Realized
Office Supplies Office Max
Re-bidding of office supplies contract; evaluating options to increase return through direct contract renewal or rebid.
$ - $ - $ 35,000 $ 150,000 Pending
$ 223,800 $ 4,000,000 $ 250,000 $ 10,400,000
Status
Total
Contract/ Service
Vendor PurposeFY2014 FY2015

11
FY14 Highlights

12
FY14 Operating Budget Highlights
Tuition and Fees – Exceeded projected revenue by $980,000 (modest in-state and out-of-state undergrad enrollment growth, new international student contingent, 2.0% increase in tuition & fees).
Room and Board – Exceeded projected revenue by $1.1 million (increased occupancy and dramatic increase in commuter meal plan participation).
Fringe State appropriations –Trend for the non-cash fringe benefits appropriation nearly identical to the preceding fiscal year, i.e., fringe budget exceeded the actual fringe costs resulting in large, unexpended fringe balance offset by the available balance in the Instruction and Research budget line.
Other Revenues – The College received the 1st payment ($4 million) from Sodexo to fund dining facilities and Brower Student Center renovations.

13
FY14 Operating Budget Highlights
Operating Expenses – $231 million or 99% of the operating budget expended.
Institutional Scholarships – Institutional scholarships increased by $349,000 for FY14 over the budgeted amount for the same period due to merit-based scholarships exceeding the budgeted allocation.
Net Transfers to Capital & Strategic Reserves – Net transfers to capital and strategic reserves totaled $23.5 million, which was $4.4 million over the budgeted amount resulting from increased investment income and housing revenues.
Operating Surplus – Operating budget surplus of $1.9 million will be transferred to the strategic operating reserves.

14
FY15 Highlights

15
FY15 Key Revenue Budget Projections
Net State Appropriation – Level funded
Fringe Appropriation – Increase of $2.3M (by the State) in the non-cash fringe appropriation will be directly offset by a corresponding increase in fringe expense.
Tuition and Fees – Two (2) percent increase
New Tuition Revenue – Brazilian cohort of approximately 65 students - additional net tuition revenue projected at $1.2M.
Room & Board - Occupancy projected at 3,989 beds (FY14 level minus 165 beds for Norsworthy residence hall coming off-line for renovation in FY15 = ($1.3 million in lost room revenues). Note: The dining contract required a minimum board increase of 3.5% for FY15. Room rate increased by only 2.0% to minimize the overall impact.

16
FY15 Key Expense Budget Projections
Personnel Costs - Salary increase is estimated to be $3.3 million - Cost of Living Adjustment (COLA) = 1.75%; Increments = 3.75% and non-unit merit pool = 4.0%.
Budgeted Salary Savings – Consistent with prior years, FY15 salary savings target will be $1.8M, or 2.0% of full time salaries. Key strategy for moderating tuition & fee increases.
Institutional Scholarships & Tuition Waivers – FY15 initial projection is $16.5 million vs. the FY14 actual of $16.1 million.
Principal & Interest - Debt service increased by $1.9 million to approximately $30 million.
Operational Excellence - Targeted cost containment initiatives are projected to generate $110,000 in cost savings – rebidding of procurement contracts.
Capital Funding - $25.3 million in transfers to capital reserves to provide adequate funding for major capital projects – Asset Renewal Plan.

17
FY14-15 Enrollment Projections Undergraduate enrollment is projected to increase by 116 students (includes Brazilian
cohort) but graduate enrollment will be stable.Fall 2013 Fall 2013 Fall 2014
Admissions Cohort* Projection Actual Variance Projection VarianceFull-Time In-State 6,105 6,137 32 6,199 62 Full-Time Out-of-State** 340 367 27 380 13 Part-Time In-State 446 438 (8) 431 (7) Part-Time Out-of-State** 23 24 1 62 38
Total Headcount 6,914 6,966 52 7,072 106
Spring 2014 Spring 2014 Spring 2015Admissions Cohort* Projection as of 1/12/14 Variance Projection Variance
Full-Time In-State 5,904 5,937 33 6,013 76 Full-Time Out-of-State 331 355 24 384 29 Part-Time In-State 485 477 (8) 465 (12) Part-Time Out-of-State 26 29 3 62 33
Total Headcount 6,746 6,798 52 6,924 126
Average Enrollment 6,830 6,882 52 6,998 116
Incoming Class FY2014 Goal FY2014 Actual Variance FY2015 Goal VarianceFall Freshmen 1,395 1,404 9 1,440 36 Fall Transfers** 262 254 (8) 266 12 Spring Transfers 140 125 (15) 140 15 Fall Non-Matriculation** 50 47 (3) 85 38 Fall Provisional 30 42 12 50 8 Spring Admits 45 48 3 55 7
Total 1,922 1,920 (2) 2,036 116
*Projections exclude undergraduate students studying abroad - approximately 100 per semester. ** Includes 12 full-time and 38 part-time Brazilian students for Fall 2014.
18
Key Budget Performance Indicators FY14 & FY15
19
Key Budget Performance Indicators
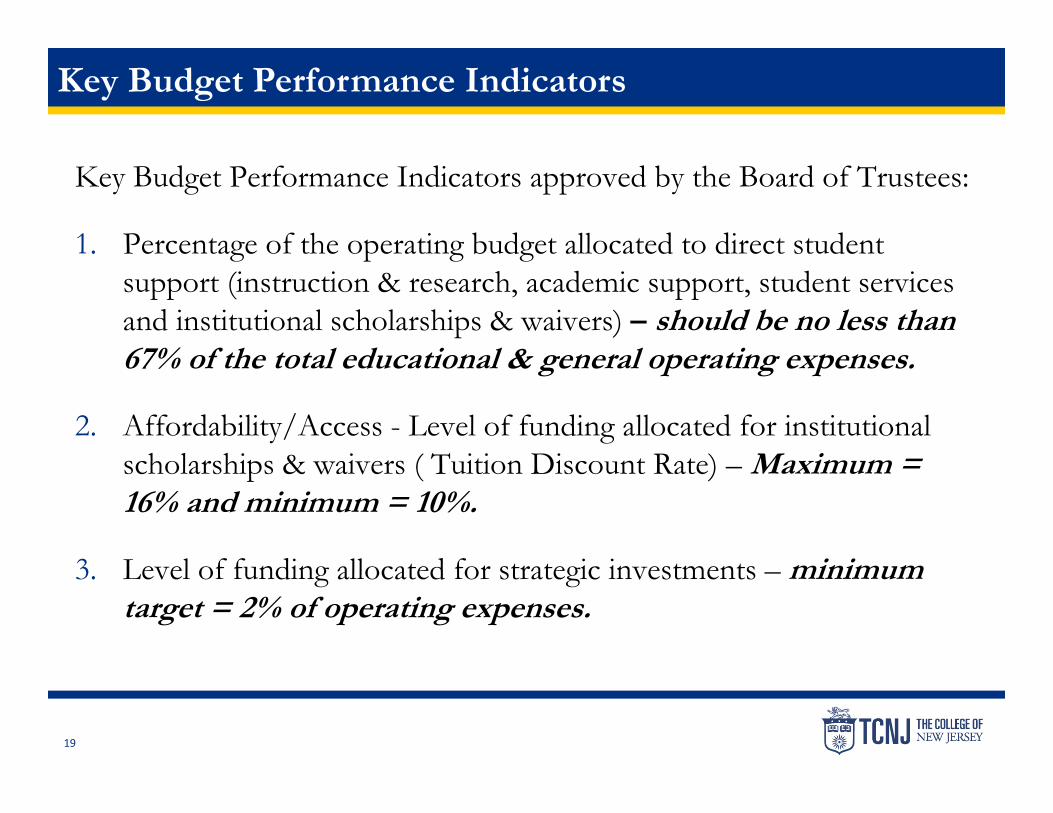
Key Budget Performance Indicators approved by the Board of Trustees:
1. Percentage of the operating budget allocated to direct student support (instruction & research, academic support, student services and institutional scholarships & waivers) – should be no less than 67% of the total educational & general operating expenses.
2. Affordability/Access - Level of funding allocated for institutional scholarships & waivers ( Tuition Discount Rate) – Maximum = 16% and minimum = 10%.
3. Level of funding allocated for strategic investments – minimum target = 2% of operating expenses.

20
Direct Student Support – Minimum 67% Target
E&G Expenditure AllocationsFY 2011 Actuals
FY 2012 Actuals
FY 2013 Actuals
FY 2014 Actuals
FY2015 Budget
Instruction and Research 43% 45% 45% 46% 44%Academic Support 10% 9% 10% 9% 10%Student Services 10% 10% 10% 10% 11%Scholarships and Waivers 10% 10% 10% 10% 10%
Direct Student Support 73% 75% 75% 75% 75%Operation and Maintenance of Plant 17% 16% 15% 15% 15%Institutional Support 10% 10% 10% 10% 10%
Total 100% 100% 100% 100% 100%

21
Affordability/Access – Institutional Scholarships
Institutional Scholarships & Waivers – Target: Minimum 10% - Maximum 16%

22
Strategic Investments Allocation