
Prepared By: Stephanie Hunt Presented By: Larry Freeman January 2015.
20
FACILITY OPERATIONS ENERGY MANAGEMENT DIVISION Prepared By: Stephanie Hunt Presented By: Larry Freeman January 2015
-
Upload
walker-pinnix -
Category
Documents
-
view
214 -
download
1
Transcript of Prepared By: Stephanie Hunt Presented By: Larry Freeman January 2015.

FACILITY OPERATIONS ENERGY MANAGEMENT DIVISION
Prepared By: Stephanie Hunt
Presented By: Larry Freeman
January 2015

2ND QUARTERUTILITY REPORTING
Q2 FYE '15 COMPARED TO Q2 FYE '14

Total Utility ChargesQ2 FYE '15 Compared to Q2 FYE
'14
Total Utilities$912,000
$914,000
$916,000
$918,000
$920,000
$922,000
$924,000
$926,000
$916,144
$924,087
FYE 14FYE 15
0.9%

Utility ChargesQ2 FYE '15 Compared to Q2 FYE
'14
$0
$100,000
$200,000
$300,000
$400,000
$500,000
$600,000$536,016
$276,512
$88,818
$10,203 $4,595
$522,121
$308,491
$74,992
$13,194$5,288
FYE 14FYE 15

Utility ConsumptionQ2 FYE '15 Compared to Q2 FYE
'14
-
2,000,000
4,000,000
6,000,000
8,000,000
10,000,000
12,000,000
6,132,528
10,144,976
141,300 5,642 1,493
5,806,036
11,824,300
135,360 7,366 3,271
FYE 14FYE 15

Duke Energy Progress & LREMCElectric Charges
Q2 FYE '15 Compared to Q2 FYE '14
$515,000
$520,000
$525,000
$530,000
$535,000
$540,000 $536,016
$522,121
FYE 14FYE 15
3%

Duke Energy Progress & LREMCElectric Consumption
Q2 FYE '15 Compared to Q2 FYE '14
KWH5,600,000
5,700,000
5,800,000
5,900,000
6,000,000
6,100,000
6,200,000 6,132,528
5,806,036
FYE 14FYE 15
5%

Town of Pembroke & Robeson County
Water & Sewer ChargesQ2 FYE '15 Compared to Q2 FYE
'14
$260,000
$265,000
$270,000
$275,000
$280,000
$285,000
$290,000
$295,000
$300,000
$305,000
$310,000
$276,512
$308,491
FYE 14FYE 15
12%

Town of Pembroke & Robeson County
Water & Sewer ConsumptionQ2 FYE '15 Compared to Q2 FYE
'14
Gallons9,000,000
9,500,000
10,000,000
10,500,000
11,000,000
11,500,000
12,000,000
10,144,976
11,824,300
FYE 14FYE 15
17%

Hess / Direct Energy (May ‘14) & Piedmont
Natural Gas ChargesQ2 FYE '15 Compared to Q2 FYE
'14
$65,000
$70,000
$75,000
$80,000
$85,000
$90,000
$88,818
$74,992FYE 14FYE 15
16%

Hess / Direct Energy (May ‘14) & Piedmont
Natural Gas ConsumptionQ2 FYE '15 Compared to Q2 FYE
'14
Therms132,000
133,000
134,000
135,000
136,000
137,000
138,000
139,000
140,000
141,000
142,000141,300
135,360
FYE 14FYE 15
4%

M & J Propane ChargesQ2 FYE '15 Compared to Q2 FYE
'14
$0
$2,000
$4,000
$6,000
$8,000
$10,000
$12,000
$14,000
$10,203
$13,194
FYE 14FYE 15
29%

M & J Propane ConsumptionQ2 FYE '15 Compared to Q2 FYE
'14
Gallons0
1,000
2,000
3,000
4,000
5,000
6,000
7,000
8,000
5,642
7,366
FYE 14FYE 15
31%

Oliver Oil ChargesQ2 FYE '15 Compared to Q2 FYE
'14
$4,200
$4,400
$4,600
$4,800
$5,000
$5,200
$5,400
$4,595
$5,288
FYE 14FYE 15
15%

Oliver Oil ConsumptionQ2 FYE '15 Compared to Q2 FYE
'14
Gallons0
500
1,000
1,500
2,000
2,500
3,000
3,500
1,493
3,271
FYE 14FYE 15
119%

Utility Cost Per Student
Utilities Q2 FYE '146,222/Term
Q2 FYE '156,269/Term % Differential
Electric $86.15 $83.29 -3%
Water/Sewer $44.44 $49.21 11%
Natural Gas $14.27 $11.96 -16%
Propane $1.64 $2.10 28%
Oil $0.74 $0.84 14%

Utility Consumption Per Student
Utilities Q2 FYE '146,222/Term
Q2 FYE '156,269/Term % Differential
Electric(kWh) 986 926 -6%
Water/Sewer(Gallons) 1,631 1,886 16%
Natural Gas(Therms) 22.7 21.6 -5%
Propane(Gallons) 0.9 1.2 33%
Oil(Gallons) 0.2 0.5 150%

Utility Cost Per Square Foot
UtilitiesQ2 FYE '14
1,728,143/sqft.
Q2 FYE '151,728,143/sqft
.% Differential
Electric $0.31314 $0.30213 -4%
Water/Sewer $0.16154 $0.17851 11%
Natural Gas $0.05189 $0.04339 -16%
Propane $0.00596 $0.00764 28%
Oil $0.00268 $0.00306 14%
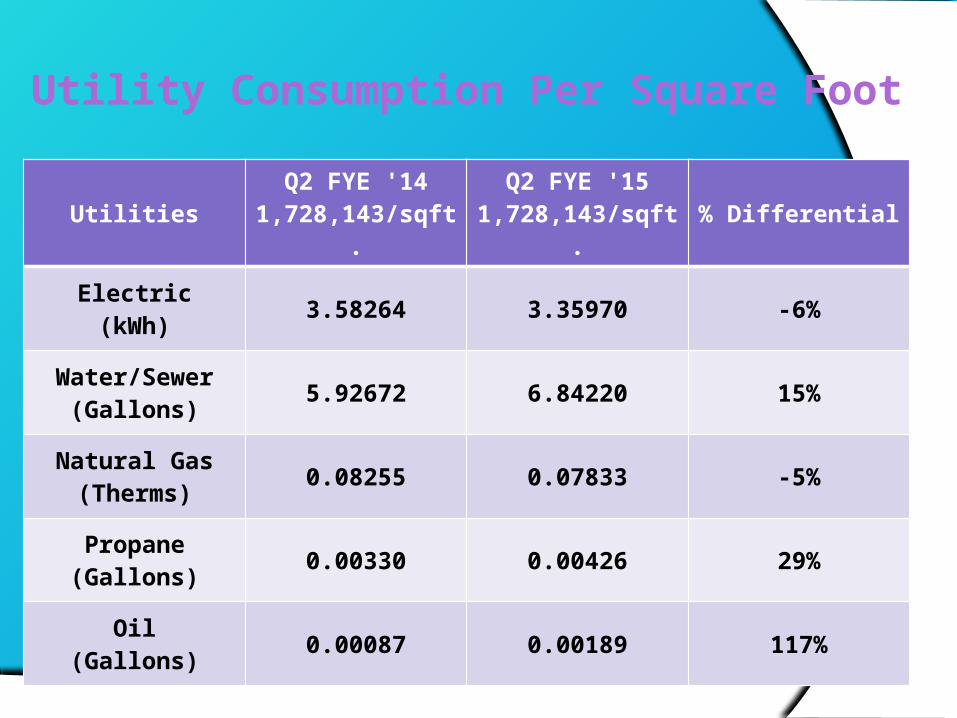
Utility Consumption Per Square Foot
UtilitiesQ2 FYE '14
1,728,143/sqft.
Q2 FYE '151,728,143/sqft
.% Differential
Electric(kWh) 3.58264 3.35970 -6%
Water/Sewer(Gallons) 5.92672 6.84220 15%
Natural Gas(Therms) 0.08255 0.07833 -5%
Propane(Gallons) 0.00330 0.00426 29%
Oil(Gallons) 0.00087 0.00189 117%

UNCP UTILITIESFO/EMD
UNCP/FO/EMD


![Design Pattern 1 [Eric Freeman & Elisabeth Freeman 1 – 5 ]](https://static.fdocuments.us/doc/165x107/56816844550346895dde1d18/design-pattern-1-eric-freeman-elisabeth-freeman-1-5--56ce9704eb05a.jpg)