Prepared by: CEPT University and AIILSG in consultation ...
55
Performance Improvement Plan for Yavatmal Prepared by: CEPT University and AIILSG in consultation with Yavatmal Municipal Council 2012
Transcript of Prepared by: CEPT University and AIILSG in consultation ...

Performance Improvement Plan for Yavatmal
Prepared by:
CEPT University and AIILSG in consultation with Yavatmal Municipal Council
2012

Performance Improvement Plan for Yavatmal
Prepared by:
Centre for Environmental Planning and Technology (CEPT) University,
Ahmedabad
and
All India Institute of Local Self Government (AIILSG), Mumbai
in consultation with
Yavatmal Municipal Council (YMC), Yavatmal

Contents
ABBREVATION ........................................................................................................................................................... iv
EXECUTIVE SUMMARY ............................................................................................................................................. v
1. INTRODUCTION ............................................................................................................................................. 1
2. CITY PROFILE .................................................................................................................................................. 3
2.1 LOCATION AND DEMOGRAPHY .......................................................................................................... 3
2.2 SERVICES IN SLUMS IN YAVATMAL .................................................................................................. 4
2.3 STAFFING OF YMC AND MJP ................................................................................................................. 6
2.4 OVERVIEW OF YMC FINANCES ............................................................................................................ 8
2.5 PRIVATE SECTOR PARTICIPATION IN YAVATMAL .................................................................. 11
3. ASSESSMENT AND PROPOSALS FOR WATER SUPPLY ................................................................ 12
3.1 ASSESSMENT OF CURRENT WATER SUPPLY SYSTEM ........................................................... 12
3.2 ASSESSMENT OF SERVICE DELIVERY ........................................................................................... 13
3.2.1 ACCESS AND COVERAGE ................................................................................................................ 14
3.2.2 SERVICE LEVEL AND QUALITY .................................................................................................... 16
3.2.3 FINANCIAL SUSTAINABILITY........................................................................................................ 16
3.2.4 EFFICIENCY IN SERVICE OPERATION ....................................................................................... 18
3.3 PROPOSED ACTIONS AND INTERVENTIONS .............................................................................. 18
3.4 MOVING TOWARDS 24 X 7 ................................................................................................................. 19
4. ASSESSMENT AND PROPOSALS FOR SANITATION ...................................................................... 23
4.1 COVERAGE OF TOILETS....................................................................................................................... 23
4.2 SEPTAGE AND SULLAGE MANAGEMENT ..................................................................................... 27
4.3 SUMMARY OF PROPOSED ACTIONS / INTERVENTIONS ....................................................... 29
5. SUMMARY OF PERFORMANCE IMPROVEMENT PLAN FOR YAVATMAL ............................. 31
5.1 SUMMARY OF PROPOSAL ................................................................................................................... 31
5.2 PROPOSALS RELATED TO IMPROVING FINANCE OF YMC .................................................... 32
5.3 PHASING OF INVESTMENTS FOR IMPROVEMENT ................................................................... 34
5.4 INSTITUTIONAL IMPERATIVES TO ACHIEVING PROPOSED IMPROVEMENTS ............ 36
REFERENCES ............................................................................................................................................................. 39
ANNEXES ..................................................................................................................................................................... 40

ABBREVATION
AIILSG All India Institute of Local Self Government
BHP Break Horse Power
CAGR Compounded Annual Growth Rate
CEPT Center for Environment Planning and Technology
CO Chief Office
DMA Directorate of Municipal Administration
DPR Detail Project Report
FGD Focus Group Discussion
FSM Fecal Sludge Management
GIS Geographic Information System
IEC Information Education and Communication
IHSDP Integrated Housing and Slum Development Program
KPIs Key Performance Indicators
LCS Low Cost Sanitation
LPS Liters per Second
MJP Maharashtra Jeeven Pradhikaran
MoA Memorandum of Agreement
MSNA Maharashtra Sujal Nirmal Abhiyan
NEERI National Environmental Engineering Research Institute
O & M Operation and Maintenance
ODF Open Defecation Free
PIP Performance Improvement Plan
SIP Slum Improvement Program
SJSRY Suvarna Jayanti Shahari Rojgar Yojana
SLB Service Level Benchmarking
UIDSSMT Urban Infrastructure Development Scheme for Small and Medium Town
ULBs Urban Local Bodies
VAMBAY Valmiki Ambedkar Awas Yojana
YMC Yavatmal Municipal Council

EXECUTIVE SUMMARY
The preparation of this Performance Improvement Plan (PIP) for water supply and sanitation has been
led by the Yavatmal Municipal Council (YMC) with support from the PAS Project through teams from
All India Institute of Local Self Government (AIILSG), Mumbai and the CEPT University, Ahmedabad.
The preparation of PIP has been done in response to a request from the Government of Maharashtra. The
two focus areas of ‘making cities Open Defecation Free’ and ‘moving towards 24x7 water supply’ were
suggested by the Chief Secretary, Government of Maharashtra in an inception meeting, for launching the
Government of India’s Service Level Benchmarking (SLB) process in Maharashtra. In addition to that the
inherent theme for PIPs is improving coverage and service levels for un-served poor (slum dwellers) and
improving financial sustainability. This PIP exercise uses a set of indicators given by the Govt. of India’s
Service Level Benchmark Initiative as a baseline to assess past performance and identify priorities.
City Profile: Yavatmal Municipal Council (YMC) is a class A city having population of 1.17 lakh. It is
located in the Vidarbha region in Eastern Maharashtra. YMC was constituted in 1869 but was dissolved
shortly thereafter. It was again established in 1894 and thus forms one of the oldest municipal councils in
the district. The city is also a chief trading centre in the district and is known as "Cotton City". There was
a substantial increase in population between 1991 and 2001 and then a decrease in the next decade due to
shift of population from city limits to adjoining villages. Discussions with local officials suggest that this
may be due to shift from city limits to adjoining villages; residence in these villages has the benefit of
lower property tax and water rates.
An estimated 39% of population lives in slum settlements in Yavatmal occupying roughly 10% of the
area in YMC. Of the total 27 slum settlements, 19 are notified slums settlements. The remaining 7 non
notified slum settlements accommodate only 7% of the total slum population. There are 15 slum
settlements on government lands of which 10 are notified settlements. The slum settlements are spread
throughout the city.
Water supply: The water supply system in Yavatmal city is operated and maintained by the
Maharashtra Jeeven Pradhikaran (MJP). The water supply scheme also covers surrounding six villages of
YMC. YMC is dependent on surface sources for its water supply through the Nilona dam and Chapdoh
dam on River Waghadhi.. MJP draws 29.9 MLD of water from these two sources. The city has a total
treatment capacity of 33.74 MLD with two conventional water treatment plants (WTP) having capacities
of 16.34 MLD at Nilona WTP and 17.4 MLD at Chapdoh WTP. There are 5 water distribution stations
(WDS) to distribute the treated water to the consumers.
The coverage of household level connections is only 35%, though the entire inhabitated city area is
covered by the distribution network. Per capita availability of water at consumer end is 82 lpcd. While
availability of water is not seen as an issue, due to design of distribution network, the city is able to
supply water only once in 2 days for 1.5 hours. Water quality records 100%, however records are not
maintained properly and therefore has low reliability.Yavatmal exhibits high extent of consumer
metering at 88%. However, extent of non revenue water is still 30%, pointing to possible issues in
network. On the financial sustainability, MJP shows good performance with O & M cost recovery at
191% and collection efficiency at 75%. Though the efficiency of consumer redressal is 100%, it still needs

improvement. Presently the only means of registering complaints is through personal visits to the MJP
office.
As part of the reforms under Maharashtra Sunjal Nirmal Abhiyan (MSNA) and Urban Infrastructure
Development Scheme for Small and Medium Town (UIDSSMT), MJP has carried out augmentation of
storage capacity and distribution network in old city, GIS mapping and hydraulic modelling, installation
of bulk flow meters, consumer survey, energy audit, water audit and leak detection survey. MJP has also
prepared draft Detailed Project Report (DPR) for implementing 24x7 water supply system in YMC.
Sanitiation: Coverage of individual toilet is 71% whereas coverage of individual and community toilet in
the city is 88%. During the field study, the team had observed that some of the public toilets were not
functional. Of the total 53 blocks, about 76% are functional; all pay and used toilets located in slum areas
are functional. Under the Valmiki Ambedkar Awas Yojana (VAMBAY) scheme, efforts have been made
to construct 783 individual toilets in the year 2001 to 2006. Currently around 15% of the city population
resorts to open defecation.
Yavatmal does not have an underground sewerage system. Toilets in the cities are connected to septic
tanks and soak pits. The grey water is collected through the drainage network. The entire habitat area of
the city is covered by the drainage network. The drains are cleaned regularly and maintained by private
contractors. Outfalls of these drains are diverted into the existing lakes without any treatment. Therefore
YMC has proposed to treat this wastewater through phytoride technology developed by NEERI,
feasibility study has been under preparation.
Services to slum settlements: The coverage of HH level water supply connections in slum settlement is
21%, much lower than city coverage. About 76% of slum settlements have internal water supply
network. In addition to the individual water connections provided by MJP to slums, the council also
supplies water through stand posts, hand pumps and tube wells. The connection procedure for slum
dwellers is same as non slum HHS and should be eased by eliminating the initial deposit, and
connection cost can borne by the city along with simplified procedures. The coverage of individual
toilets in slum settlement is only 33% which is very low as compared with city level coverage; and
coverage of individual and community toilet in slum settlement is 55%.
Municipal finance of YMC1: The municipal finances of the Yavatmal Municipal Council have been
reviewed for the last seven years, from 2005-06 to 2011-12. The revenue income is increasing at a rate
slower than the rate of increase in revenue expenditure. The revenue surplus for Yavatmal has decreased
at a Compounded Annual Growth Rate (CAGR) of 3.4% for last five financial years. Own sources
contribute 87% of the total revenue. Property tax forms the other major part of the revenue income
contributing to an average of 12% of the total revenue income while grants and contributions contribute
to another 11% of the total revenue income. The average collection efficiency of property tax is around
95% over a period of 5 years but assessment of properties and revision of tax is not carried out since long
time. Recently MJP has carried out 100% consumer survey and linked with GIS, this datasets will be
useful for property tax assessment. The basic services in the form of water supply, sewerage and
sanitation form about 40% of the total revenue expenditure, while general administration and tax
collection department formed about 29% of the total revenue expenditure in YMC. The revenue
1 Source: CRISIL Advisory Services. (2012). Yavatmal: Assessment of Municipal Finances. Draft Report for PAS Project.
CEPT University.

expenditure on water supply, sewerage and sanitation services have increased at a CAGR of 19% for last
5 years, whereas YMC does not levy any user charges for the sanitation and SWM services.
The capital income has increased substantially from the level of Rs. 2.9 crore during 2005-06 to Rs. 12.8
crore in 2009-10. This increase is primarily due to the UIDSSMT and Integrated Housing and Slum
Development Programme (IHSDP) grants made available to YMC for the purpose of the water supply
project and housing respectively. About 24% of the total capital expenditure has been towards
benefitting urban poor through either housing or provision of basic services. The capital expenditure has
increased over a period of time, and the maximum capital that YMC has been able to utilize in a year is
Rs.7.0 crore as against the capital income of Rs 3.5 crore in 2008-09. The utilisation levels have been
irregular and do not follow a specific trend. Average utilisation of funds has been over100%; with
minimum 26% of capital income utilised in 2009-10 and maximum 184% utilisation in 2007-08 over a
period of 7 years. However the utilisation of funds has been delayed in almost every major scheme
implemented in YMC.
Investible surplus was calculated considering the year – on – year surplus after considering the revenue
surplus and the committed and routine capital expenditure. Here, the opening balance has not been
considered for calculations as only the year-on-year surplus from the annual incomes and expenditures
have been considered. From the assessment it was observed that YMC have an investible surplus to
consider improvements in the performance of service delivery in the FY 2015-16 in the Business As Usual
(BAU) scenario.
Summary of Performance Improvement Plan for YMC: The proposals suggested are focused on two
key areas of establishing 24X7 water supply system and moving towards open defecation free YMC, as
well as improvements in key processes and operations related to these two focal areas. Based on the
analysis of the water and sanitation sectors in Yavatmal, the Performance Improvement Plan for YMC
has been summarized in table 1.
Table 1: Summary of Performance Improvement Plan for YMC
Categories Action
Estimated
Cost (Rs in
crore)
Current status
Water supply
Low cost action
Access &
coverage
Convert stand post into
group connection 0.05
Needs to be done
Subsidize the connection
charges and simplify the
connection procedure for
slum dwellers
0.4
Needs to be done
Efficiency in
service
operation
Introduce appropriate
complain redressal system 0.1
Needs to be done
Capital intensive
Service level &
Quality
24 x 7 water supply
implementation cost
(according to draft DPR)
40.2
Awaiting finalization and
sanction of DPR
Total Water supply improvement cost 40.77

Sanitation
Low cost action
Toilet coverage Refurbishment of community
toilets 0.1
Needs to be done
Fecal sludge
management
Procurement of vacuum
trucks 0.6
Needs to be done
Capital intensive
Toilet coverage Toilet construction cost & IEC
activities 5.7
Preparation of DPR is
required
Service level &
Quality Treatment plant construction 4.8
Feasibility study
completed
Total Sanitation improvement cost 11.2
Total cost for performance improvement 51.2
The Council and MJP have to undertake improvement actions related to processes followed in the water
supply and sanitation operations. These actions being no or low cost can be immediately taken up. These
include revision of ‘new connection’ format for slum settlement, levy drainage tax, carry out property tax
assessment, revision in property tax and improve complain redressal system.
Based on the revenue enhancement measures mentioned above, YMC will generate investible surplus
after 2014. Therefore, process change related actions and low cost actions are proposed in the immediate
intervention and according to availability of surplus, phasing of capital investment projects for sanitation
is done. Water supply is operated and maintained by MJP and therefore it is suggested that the proposed
improvement actions for water supply that are not capital intensive can be borne by MJP while
implementation of the 24x7 water supply project can be proposed under UIDSSMT and/or Nagarothan.
The improvements for YMC have been proposed in three phases: 1) Immediate interventions (from 2013
- 2014), 2) Short term interventions (from 2014 - 2018) and 3) Long term intervention (from 2018-19). The
interventions mentioned above to augment revenue as well as process improvements are proposed to
begin in 2013. The costs shown in figure 1 are inflated at 7 % for each year.
Phase 1: Immediate interventions (from 2013 - 2014)
It is proposed that YMC will begin with interventions related to process and policy changes that will
not require capital investment such as conversion of stand post into group connection, subsidizing
connection costs for slum dwellers and establishment of complaint redressal system. Other activities
that can be immediately followed up by YMC include finalization and approval of the DPR for 24x7
water supply , revision in drain cleaning and O & M of public toilet contractual arrangements,
identifying beneficiaries for individual toilets, etc.

Table 2: Phasing of PIP for YMC (2013-2019)
Activities 2014 2015 2016 2017 2018 2019
Water supply
Phase 1
Convert stand post into group connection
Subsidize the connection cost for slum
settlement
Establish the complain redressal system
24x7 WS DPR approval
Phase 2
24 x 7 water supply implementation
(Major component in DPR will be construction of
mass balance reservoir, rehabilitation of pipelines,
replacement of service connections and customer
meters, installation of pressure reducing valves,
monitoring and then reducing leakages in each DMA)
Sanitation
Phase 1
Refurbishment of community toilets
Phase 2
Procurement of vacuum trucks
Construction of individual toilet
Construction of community toilet
Phase 3
Treatment plant construction
Phase 2: Short term interventions (from 2014- 2018)
Once the revenue augmentation measures and process improvements are in place, YMC can begin its
capital intensive projects from 2014.
Once approval of 24x7 water supply DPR is obtained, implementation of project should be carried
out in four years. Major component in DPR will be construction of mass balance reservoir,
rehabilitation of pipelines, replacement of service connections and customer meters, installation of
pressure reducing valves, monitoring and then reducing leakages in each DMA, etc.
Starting from 2015, YMC can begin construction of individual and community toilets. As issues in
existing community toilets were observed in terms of operation and maintenance, it is proposed that
YMC refurbishes these toilets before initiating construction of new community toilets. Following
this, YMC can begin construction of individual toilets. This activity is planned to be completed in a
period of 3 years considering the investments that will be available with YMC. While the
maintenance of all the pay-n-use toilets has been contracted out, similar arrangements with CBOs
can be looked at with respect to community toilets. Campaigns to bring about awareness related to
cleanliness and hygiene practices, safe sanitation practices, and negative health impacts due to open
defecation needs to be conducted by the Council. Local CBOs need to be roped into this exercise to
ensure participation by all communities. The campaigns should begin by triggering initiation in the
slum settlements and undertaking transect walk to the open defecation sites to highlight the above
issues.

It is proposed that YMC simultaneously strengthen its septage management activities. YMC needs to
augment its current suction emptier capacity by procuring 4 additional vehicles. Subsequently YMC
will begin construction of the septage treatment facility and start operations in a year. The land
required for the septage treatment plant is available near to the solid waste dumping site. The
operation and maintenance of the plant can be carried out by a private operator.
Figure 1: Implementation of sanitation projects after revenue improvement measures
Phase 3: Long term intervention (from 2018-19)
Once the above measures are in place, YMC can begin construction of sullage treatment plant.
After implementation of revenue improvement measures, YMC will be able to generate investible
surplus. ODF related activities can be funded from YMC’s internal surplus whereas for implementing
24x7 water supply, MJP has to depend on external funding.
In order to realise the targets set for improving water supply and sanitation in YMC, the existing
institutional framework must be enhanced to enable better operation and management of these services.
While in certain areas, it is the lack of a defined policy restricting provision of services, in other instances
it is the improper regulation of the existing policies. YMC has to focus its attention on improving policies
related to services, financial sustainability, and accountability to the consumers.
Finally, the implementation of the above processes and proposals requires a dedicated PIP review
committee which will integrate the roles and responsibilities of the various stakeholders in the PIP.
0
1
2
3
4
5
6
7
2015 2016 2017 2018 2019
Rs
in c
rore
Years
Refurbishment of toilets
Procurement of vacuum trucks
Construction of individual toilet
Construction of community toilet
Treatment plant construction
Investible surplus

1 | P a g e
1. INTRODUCTION
The preparation of this Performance Improvement Plan (PIP) for water supply and sanitation has been
led by the Yavatmal Municipal Council (YMC) with support from the Performance Assessmnt System
(PAS) Project through teams from All India Institute of Local Self Government (AIILSG), Mumbai and
the CEPT University, Ahmedabad.
The preparation of PIP has been done in response to a request from the Government of Maharashtra. The
two focus areas of ‘making cities Open Defecation Free’ and ‘moving towards 24x7 water supply’ were
suggested by the Chief Secretary, Government of Maharashtra in an inception meeting, for starting the
Government of India’s Service Level Benchmarking (SLB) process in Maharashtra. In addition, PIPs also
focus on improving coverage and service levels for un-served poor (slum dwellers) and improving
financial sustainability. This PIP exercise uses the set of indicators given by the Service Level Benchmark
Initiative of the Government of India. These are used as a baseline to assess past performance and
identify priorities.
During the preparation of this PIP several dialogues, periodic consultations and meetings were held with
the Chief Officer of YMC and officials from respective departments.
Preparation of the PIP has been done in following stages:
Initial Performance Assessment: Based on the data from YMC, an initial assessment of all SLB
indicators for the past three years was done by the PAS team. The YMC teams were assisted to generate
comparative performance assessment for YMC for last three years. This involved past trends based on
their data in PAS Benchmarking system as well as comparison with other Class A Municipal Councils in
Maharashtra. The existing service levels were assessed against service level benchmarks to be achieved.
The AIILSG/CEPT team visited Yavatmal from 17th July to 23rd July 2011 for further exploration of
ground realities in UWSS. The preparatory work and the city profile of Yavatmal were discussed with
YMC officials at the first meeting on 17th July ‘11. The meeting was attended by the YMC Chief Officer
(CO), along with officials from Sanitation Dept. Water supply system were discussed with MJP officials.
Preliminary priorities were identified at this meeting. Particular focus was also placed on the issues
around making the city open defecation free and exploring the possibility of introducing 24x7 water
supply. ULB officials shared their views about pressing issues and barriers in improving performance of
UWSS in Yavatmal
Detailed Diagnostics and Identification of Key Issues: The diagnostic assessment was prepared by
detailed data collection and taking local ground realities into consideration. This was based on a detailed
field guide developed for purpose of PIP preparation which included data templates, survey formats,
transect walks, schedules of interviews, FGD guidelines, areas for digital documentation, dimensions of
stakeholder consultations etc.
A rapid assessment of demographic /physical characteristics, institutional arrangements, key processes,
municipal finances and private sector participation was also undertaken to build appropriate context for
city performance. The emphasis was also placed on understanding the current data record systems and
measures to improve the performance data reliability.
Detailed discussions with ULB engineers and support staff were held to assess water and sanitation
situation. City level reconnaissance surveys and dedicated field visits were undertaken by teams to
facilities including the source of water as well as treatment and distribution/ collection systems for water
supply, sanitation and solid waste management to validate secondary data and identify performance

2 | P a g e
issues. Wherever applicable, appropriate consultations were also undertaken with MJP officials and
private service providers to help assess and validate issues from different perspectives.
For detailed qualitative insights the teams visited all slums and conducted focus group discussions
(FGDs) with slum dwellers. Transect walks in slum settlements and along city roads helped in mapping
slum locations, open defection sites, public and community toilets, solid waste dumping sites etc. In
addition key person interviews, FGDs and consultations were held with safai karamcharis, contractors
and private parties to identify service delivery issues from consumers’ perspectives.
Action Planning and Preliminary Costing: Consultations with sector experts were also held in August
2011 for proposing actions and estimating the required capital cost/ investment based on identified
improvement areas. At the end of the expert consultations the options for improving water supply,
sanitation and SWM scenario were discussed with concerned YMC officials and Chief Officer. The
diagnostic study, detailed assessment and preliminary strategies for improvement were shared with
YMC officials during second PIP consultative workshop in September 2011 at Yavatmal. The suggestions
by YMC officials were taken and incorporated in the PIP.
Based on the identification of city priorities, consultations were held with the Chief Officer, opinion
leaders, Municipal councillors, YMC officers, and representatives of water and sanitation committees to
discuss priorities for municipal water supply and sanitation.
While proposing strategies and actions for improvement the assessment of ongoing projects was done.
The actions for improvement were identified, prioritised and streamlined in consultation with YMC
officials to achieve both priority/ focal areas - ‘Open Defecation Free YMC’ and ’24 X 7’ water supply.
The identified interventions have been classified as those requiring substantial capital expenditure and
others that are more process and policy related. Actions to improve reliability of performance indicators
are also identified. Preliminary cost estimates have been developed for all actions identified. The
proposed strategies and actions for improvement and estimated capital cost required to implement
actions was discussed with YMC officials during the third PIP consultative workshop in November 2011
at Yavatmal.
Preliminary validation of Draft Performance Improvement Plan by YMC: The proposed draft PIP was
shared with YMC. It has been finalised by incorporating the revisions suggested. This report has been
validated by Yavatmal CO and relevant YMC officials. The PIP describes improvement actions and
related costs. The proposals have been reviewed by technical teams at the AIILSG and CEPT University.
This PIP report will be submitted to the state government for review and guidance. It is anticipated that
the YMC will identify low-cost actions that can be taken up immediately and provide funds for these
actions from their budget. For actions that require significant capital expenditure, the YMC will need to
prepare detailed project reports and seek assistance under appropriate state and national programmes.

3 | P a g e
Figure 3: Population trend of city
100000
105000
110000
115000
120000
125000
Y 1991 Y 2001 Y 2011
Population Growth
Population
2. CITY PROFILE
This section of report gives a profile of the city as well as characteristics of slum settlements. This also captures
staffing pattern of YMC and MJP and its overall financial scenario.
2.1 LOCATION AND DEMOGRAPHY
The city of Yavatmal is headquarters of
Yavatmal District. The Yavatmal
Municipal Council (YMC) was constituted
in 1869 but was dissolved shortly
thereafter. It was again established in 1894
and thus forms one of the oldest
municipal council in the district. The city
is also a chief trading centre in the district
and is known as "Cotton City".
It is located in the Vidarbha region in
Eastern Maharashtra. The city is situated
on an altitude of 450 meters above mean
sea level. The general topography is cone
shaped sloping towards central Yavatmal.
A number of seasonal streams originate
from ridge of Yavatmal and flow away
from the town.
Total municipal area of YMC is 11.7 km2
and habitated area is 9.1 km2 (80%).
Gross density of town is 9950 person per
sq. km and net density is 12756 persons
per sq. km. The city is divided into 40
electoral wards. The population of
Yavatmal constantly increased between
1951 (35980) to 1991 (108591). Figure 3
shows population growth in the city area
for the last two decades. There was a
substantial increase between 1991 and
2001 and then a decrease in the next
decade. Discussions with local officials
suggest that this may be due to shift from
city limits to adjoining villages; residence
in these villages has the benefit of lower
property tax and water rates.
Table 3: Demographic Details
General Details 2001 2011
Area 10.17 km2 11.73 km2
Population 1,20,676 1,16,714
No. of HHs 25,079 25,857
Gross density (per/ sq. km) 11866 9950
No of properties 23,432 26,704
No. of Slums 25 27 (Notified 19)
Population in slums 43,238 45,667
% of Slum pop to total 35.8% 39.1%
Figure 2: Location map of Yavatmal Municipal Council

4 | P a g e
Figure 4: Growth of Yavatmal city
2.2 SERVICES IN SLUMS IN YAVATMAL
Yavatmal city has about 39% of population residing in 27 slum settlements. There are 19 notified slums.
The 7 non notified slums accommodate only 7% of the total slum population. There are 15 slum
settlements on government lands of which 10 slums are notified; slum settlement details are given in
Annex 1. The slums occupy about 10% of the total inhabited area in Yavatmal. Most of the slum
settlements are located along the major roads in the city (See Figure 5). YMC provides services to notified
as well as non-notified slums.

5 | P a g e
Figure 5: Location of Slum Settlements
Housing constructed under IHSDP in
Yavatmal Municipality
Source: (CEPT University, 2011)
YMC has internally earmarked for the urban poor in its
annual budgets to the extent of 5 %. This is based on a
Directorate of Municipal Administration (DMA) circular
issued in 1998 directing all ULBs to allocate 5% of their
annual budget for welfare of backward classes. Average
24% of the total capital expenditure has been utilised or
allocated for the urban poor from FY 2005-06 to FY 2011-12,
various components of capital expenditure and income
directed towards the urban poor are give in annexe no 2.
In addition, reforms have also been promoted under Urban
Infrastructure Development Services for Small & Medium
Town (UIDSSMT) and Maharashtra Sujal Nirmal Abhiyan
(MSNA).
YMC has been proactive in taking up and implementing various schemes for slum improvement,
including: Slum Improvement Programme (SIP) ,Valmiki Ambedkar Awas Yojana (VAMBAY), Dalit
Vasti Developemnt Scheme, Suvarna Jayanti Shahari Rojgar Yojana (SJSRY), Low Cost Sanitation (LCS)
Scheme and Integrated Housing and Slum Development Program (IHSDP). Under VAMBAY scheme, it
has constructed 783 toilets in 13 slum pockets in the year 2001 to 2006. YMC has constructed housing
units for 4 slum settlements (Patipura/ Dolipura, Netaji nagar, Talavfail and Indira nagar) under the
IHSDP scheme. However it has been difficult for YMC to convince the beneficiaries for cluster

6 | P a g e
development schemes and this is iterated by the fact that some of the housing units constructed for
rehabilitation are still lying vacant.
2.3 STAFFING OF YMC AND MJP
The civic affairs of the town are managed by YMC. Figure 6 shows the organizational structure with
details of the 13 functional departments. The executive wing is headed by the Chief Officer (CO) who
supervises functions of all the departments.
The water supply department is combined with fire brigade department as water supply service is
provided by Maharastra Jeeven Pradikaran (MJP) in the city. The MJP raises water bill based on fixed
tariff charges for stand post category users to the municipality for providing water supply through
public stand posts and hand pumps which is then supplied free of cost to all slums. However operation
and maintenance of stand post and hand pumps is carried out by YMC. The MJP sub divisional office at
Yavatmal has a total of 66 staff including 3 technical staff.
Figure 6: Organization Chart of Yavatmal Municipal Council

7 | P a g e
Figure 8: Staffing (Sanctioned vs. Recruited) in Yavatmal
0 100 200 300
Electric
Fire fighting
Public works
Sanitation
Water works
Town planning
Admin
Filled staff Sanctioned staff Table 4: Technical and Non technical staff in UWSS
Department Technical staff Non technical
staff
Water supply
(MJP)
3 66
Sanitation (YMC) 6 256
Source: (Yavatmal Council, Table of sanctioned post for
establishment, 2006)
The functions pertaining to sanitation (viz. cleaning and maintenance of drains and solid waste
management) are carried out by the Health Department of YMC. The Municipal Council has outsourced
the door to door collection, street sweeping, cleaning of drains and operation & maintenance of pay and
used toilets. A quick comparison of
sanctioned and working staff status
across main sectors is given in figure
8. Though water supply in slums is
provided by MJP through stand posts
and bore wells, the YMC staff is
responsible for its operation and
maintenance. MJP has separate staff
that works for water supply
operations. Figure 8 compares
sanctioned versus working staff for
YMC. Sanitation department has
recruited entire sanction staff
including technical staff also. Details
of technical and non technical staff for
UWSS details are given in table no 4.
Figure 7: Organisation chart of MJP sub divisional office

8 | P a g e
2.4 OVERVIEW OF YMC FINANCES
YMC uses a cash-based accounting system. All expenses towards regular operation and maintenance
are treated as revenue expenditure, while expenditure on new projects is treated as capital expenditure.
The municipal finances of the YMC have been reviewed for last five financial years and budgeted
estimates for the next two years, thus spanning a total period of seven financial years starting from year
2005-06. The total revenue income has increased to a level of Rs. 16.2 crore in 2009-2010 from Rs. 11.9
crore in 2005-06. This represents an actual CAGR of 8 %. On the other hand, the revenue expenditure has
increased to a level of Rs. 13.4 crore in 2009-10 from Rs. 8.6 crore in 2005-06. This represents a CAGR of
12 % over a five-year period. The fact that the revenue income is increasing at a rate slower than the rate
of increase in revenue expenditure, this does not indicate a healthy trend for the YMC.
YMC maintains a consolidated general budget that includes all the functions of the council. Thus
accounts related to slums and urban poor, water supply and sewerage etc. have not been budgeted
separately. Few budget items have been recast to be included into the capital account from revenue
account due to incorrect allocation of the items. Table 5 gives the consolidated status of municipal
finances after the recasting exercise.
The revenue surplus for Yavatmal has decreased at a CAGR of 3.4% for last five financial years. Average
revenue surplus has remained at 20% of the revenue income for the period between 2005-06 and 2009-10.
Table 5: Municipal Finances (Recast budget figure) at a glance (Rs in crore)
Item 2005-06
(Actuals)
2006-07
(Actuals)
2007-08
(Actuals)
2008-09
(Actuals)
2009-10
(Actuals)
2010-11
(Budgeted)
2011-12
(Budgeted)
Revenue Income 11.95 12.96 13.06 12.88 16.21 15.55 17.57
Revenue
Expenditure 8.67
9.30
9.98
9.67
13.41 18.44 17.58
Revenue surplus /
Deficit
3.28
3.66
3.08
3.22
2.80
(2.89)
(0.02)
Operating Ratio 73% 72% 76% 75% 83% 119% 100%
Capital Income 2.69 6.40 2.54 3.47 12.88 6.24 6.25
Capital Expenditure 4.66 3.63 4.67 7.08 3.42 17.98 10.58
Capital Surplus /
Deficit
(1.96)
2.77
(2.13)
(3.61)
9.46
(11.74)
(4.33)
Extra-ordinary
income 1.22 4.22 2.04 1.16 1.23 0.94 0.94
Extra-ordinary
Expenditure 2.34 2.93 2.38 1.54 1.93 1.57 1.44
Source: (Yavatmal council budget book , 2005-06 to 2011-12)
The capital income for the Yavatmal Municipal Council includes grant and disbursements against
various schemes like UIDSSMT, IHSDP, Finance commission grants among others. It is observed that the
capital expenditure mainly consists of expenditure against the grants under various state and central
government schemes. The financial analysis of YMC showed that overall capital utilisation is very
uncertain, with minimum 26% of capital income utilised in 2009-10 and maximum 184% utilisation in
2007-08 over a period of 7 years.
9 | P a g e
Revenue Account: The total budgeted revenue income for YMC in 2011-12 was Rs. 17.5 crore. The
revenue incomes of YMC can be broadly classified into own sources and external sources. The revenue
income in the last five financial years has increased at a CAGR of 8 %. The incidental decrease in revenue
income in 2008-09 mentioned previously is due to reduction in octroi collections in the city. Own sources
contribute 87% of the total revenue income of the Yavatmal Municipal Council as per the actuals of last
five financial years External source of revenue income like external grants and contribution contributes a
relatively modest share of 11.3% of the total revenue income over the period of 2007-08 to 2009–10;
however it is budgeted to increase to 71 % of the total revenue income on account of transfer of octroi
from municipal collections to recurring assigned revenues. Most of these are recurring grants, which can
be assumed to be a secured source of income in the present scheme of things.
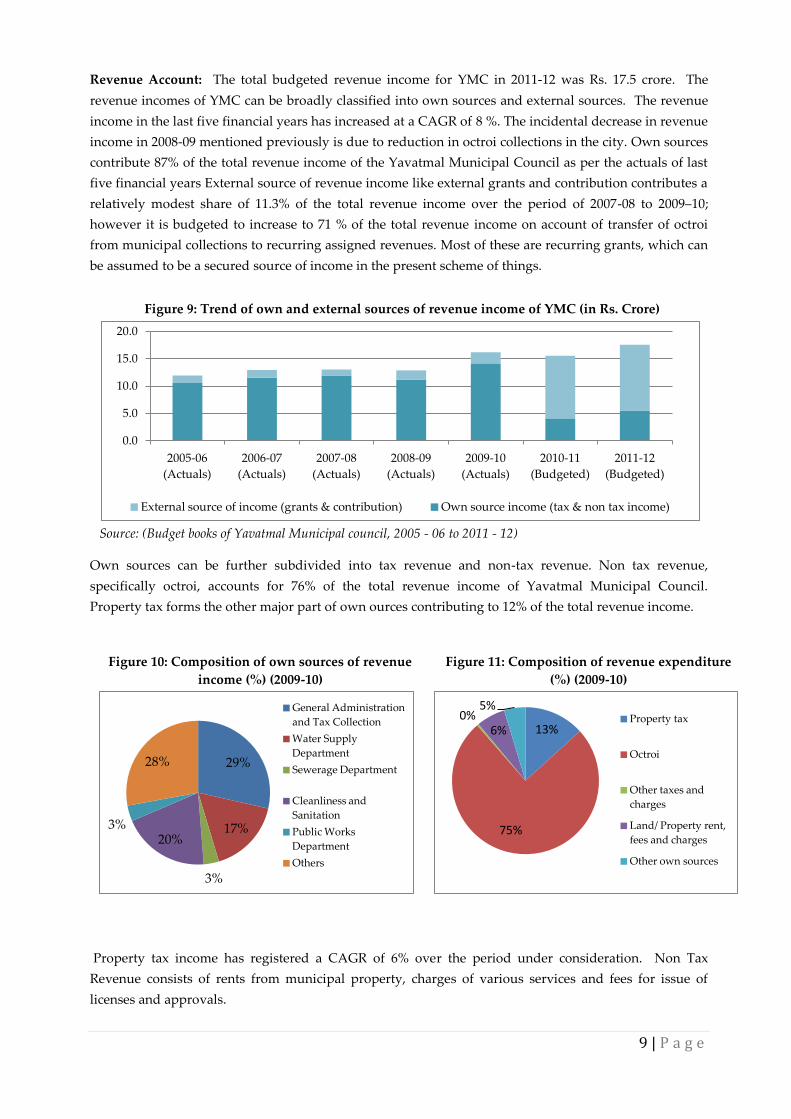
Own sources can be further subdivided into tax revenue and non-tax revenue. Non tax revenue,
specifically octroi, accounts for 76% of the total revenue income of Yavatmal Municipal Council.
Property tax forms the other major part of own ources contributing to 12% of the total revenue income.
Property tax income has registered a CAGR of 6% over the period under consideration. Non Tax
Revenue consists of rents from municipal property, charges of various services and fees for issue of
licenses and approvals.
Figure 9: Trend of own and external sources of revenue income of YMC (in Rs. Crore)
Source: (Budget books of Yavatmal Municipal council, 2005 - 06 to 2011 - 12)
0.0
5.0
10.0
15.0
20.0
2005-06
(Actuals)
2006-07
(Actuals)
2007-08
(Actuals)
2008-09
(Actuals)
2009-10
(Actuals)
2010-11
(Budgeted)
2011-12
(Budgeted)
External source of income (grants & contribution) Own source income (tax & non tax income)
Figure 10: Composition of own sources of revenue
income (%) (2009-10)
29%
17%
3%
20% 3%
28%
General Administration
and Tax Collection
Water Supply
Department
Sewerage Department
Cleanliness and
Sanitation
Public Works
Department
Others
Figure 11: Composition of revenue expenditure
(%) (2009-10)
13%
75%
0% 6%
5% Property tax
Octroi
Other taxes and
charges
Land/ Property rent,
fees and charges
Other own sources

10 | P a g e
The basic services such as water supply, sewerage and sanitation form about 40% of the total revenue
expenditure, while general administration and tax collection department formed about 29% of the total
revenue expenditure in YMC. Water supply services are provided by MJP whereas sanitation and SWM
services are provided by YMC. YMC does not levy any user charges for the sanitation and SWM
services. The revenue expenditure on water supply, sewerage and sanitation services have increased at a
CAGR of 19% for last 5 years, while expenditure on general administration and tax collection has
increased at a CAGR of 12%.
Capital Account: The capital income has increased substantially from the level of Rs. 2.9 Crore during
2005-06 to Rs. 12.8 Crore in 2009-10.This increase is primarily due to the UIDSSMT and IHSDP Grants
made available to YMC for the purpose of the water supply project and housing respectively, starting
2009-10. For this purpose it will not be correct to define a trend in the capital income. The following table
presents the categorization of capital income under various heads:
Table 6: Sources of capital income for YMC (in Rs. Crore)
Items 2005-06
(Actuals)
2006-07
(Actuals)
2007-08
(Actuals)
2008-09
(Actuals)
2009-10
(Actuals)
2010-11
(Budgeted)
2011-12
(Budgeted)
Urban Poor 0.99 1.25 1.09 0.65 1.34 0.52 0.65
Water supply
and sanitation
0.03
0.15
0.43
0.21
0.63
0.91 2
UIDSSMT - - - - 4.38 2 1
IHSDP - - - - 417 - -
Others 1.68 4.99 1.02 2.61 2.35 2.81 2.6
Total 2.69 6.40 2.54 3.47 12.88 6.24 6.25
Source: (Budget books of Yavatmal Municipal council, 2005 - 06 to 2011 - 12)
The following table presents the categorization of capital expenditure under various heads.
Table 7: Capital expenditure for YMC (in Rs. Crore)
Items 2005-06
(Actuals)
2006-07
(Actuals)
2007-08
(Actuals)
2008-09
(Actuals)
2009-10
(Actuals)
2010-11
(Budgeted)
2011-12
(Budgeted)
Urban Poor 0.94 0.39 0.89 2.27 1.07 2.08 1.4
Water supply
and sanitation
0.38
0.32
0.81
1.1
0.62
1.2
0.9
UIDSSMT - - 0.1 - 0.2 6 1.2
IHSDP - - - - 0 2.15 2.20
Others 3.33 2.92 2.87 3.7 1.53 6.55 4.88
Total 4.66 3.63 4.67 7.08 3.42 17.98 10.58
% Utilization of
Capital Income 173% 57% 184% 204% 27% 288% 169%
Source: (Budget books of Yavatmal Municipal council, 2005 - 06 to 2011 - 12)
The capital expenditure has increased over a period of time, and the maximum capital that YMC has
been able to utilize in a year is Rs.7.1 Crore as against the capital income of Rs 3.5 Crore in 2008-09.
However the utilisation of funds has been delayed in almost every major scheme implemented in YMC.
The reasons for this delay are difficult to comment from the available information.

11 | P a g e
An increase in capital expenditure has been projected in the water supply and sanitation segment under
the UIDSSMT funds, which are being utilized for the installation of a city-level water supply system.
Key Inferences: Revenue expenditure is increasing at a higher rate than revenue income. As a result of
which the revenue surplus has followed a decreasing trend. Average revenue surplus was 20% for last
five financial years. Property tax (12%) and Octroi (67%) form the major revenue income sources for
YMC. Collection efficiency for property tax in last five financial years has been at an average of 95 %.
However the coverage of properties is found to be inadequate with 18319 residential properties covered
in the tax assessments against 26000 households in the city. UWSS services account for 33% of the total
revenue expenditure and as against there is no special taxes are levied; only sanitation charges are levied
for septic tank cleaning.
2.5 PRIVATE SECTOR PARTICIPATION IN YAVATMAL
Yavatmal Municipal Council has utilized services of private agencies in sanitation and SWM. The
initiation of private sector involvement in sanitation occurred with the handing over of drainage
cleaning and O & M of pay and use toilets. This was further extended to include door to door collection
of solid waste. Initially, all these three activities were separately contracted to one company. In the next
year, YMC combined all the three activities into one contract for ease of monitoring and cost
effectiveness. For managing the SWM contracts, city is divided into 3 zones wherein zone 1 & 3 is
maintained by Shivkrupa construction and zone 2 contracts by Triveni construction. The operation and
maintenance of the vermin composting plant is also outsourced to another private agency.
Table 8: Private sector participation in Yavatmal
Sector Scope of Contract Duration Type of
Contract
Value of
Contract
Procurement
Process
Waste Water
& Sanitation
Cleaning of drain line,
door to door
collection and
cleaning &
maintenance of
Sulabh shauchalaya
1 Year Annual Rate
Tender
Zone 1: Rs.
21,99,996
Zone 2: Rs.
24,80,000
Zone 3: Rs.
22,99,956
Through
competitive
bidding with bid
selection
Solid waste
management
O & M of vermi
composting plant 3 Year
Annual Rate
Tender
Year 1: Rs.
1,20,000
Year 2: Rs.
1,35,000
Year 3: Rs.
1,48,000
Through
competitive
bidding with bid
selection

12 | P a g e
Figure 13: Schematic flow diagram of water supply scheme
Source: 29.9 MLD
•Chapdoh dam: 15.9 MLD
•Nilona dam: 14 MLD
WTP: 29.3 MLD
•Chapdoh WTP: 15.6 MLD
•Nilona WTP: 13.7 MLD
WDS: 23.8 MLD
• Godhani ESR: 5.56 MLD
•Godhani new ESR: 6.93 MLD
•Darda nagar ESR: 5.24 MLD
•Waghapura ESR: 5.56 MLD
•Pimpal gaon ESR: 0.5 MLD
Consumer end: 22.1 MLD
•Billed metered consumption: 22.1 MLD
3. ASSESSMENT AND PROPOSALS FOR WATER SUPPLY
This section of report provides an overview and assessment of water supply system, along with issues and proposed
improvement actions. This section also captures interventions required by MJP to move towards 24x7 water supply
system
3.1 ASSESSMENT OF CURRENT WATER SUPPLY SYSTEM
The water supply system in Yavatmal city is operated and maintained by the Maharastra Jeeven
Pradhikaran (MJP). The water supply scheme also covers (Wadgapm, Umarsara, Bhosa, Moha, Dorli and
Waghapur) surrounding six villages of
YMC. The current scheme was
commissioned in 1972. It was designed
for the intermediate stage capacity of
8.4 MLD and ultimate capacity of 13.6
MLD. The phase II of the scheme was
commissioned in 1984 wherein
capacity of the filtration plant and
pumping machinery was augmented.
The main sources of water supply for
YMC are the dams on River
Waghadhi: Nilona dam and Chapdoh
dam. Chapdoh dam is situated 25 km
and Nilona dam is 7 km from the city
respectively as shown on in Figure 12.
MJP actually draws a total of 29.9
MLD of water from these two sources.
The city has two conventional water
treatment plants with capacities of 16.34 MLD at Nilona WTP and 17.4 MLD at Chapdoh WTP. There are
5 water distribution stations (WDS) from that treated water is distributed to the consumers. The
schematic diagram of water supply scheme is shown in figure 13. In addition to the individual water
connections provided by MJP to slums, the council also supplies water through stand posts, hand pumps
Figure 12: Location map of Sources and WDS
Chapdoh
dam
Nilona dam
Chapdoh WTP
17.4 MLD
Nilona WTP
16.34 MLD
Yavatmal
Dardanagar ESR Godhani ESR
Waghpur ESR
Pimpalgaon ESR

13 | P a g e
and tube wells. There are 215 public taps, 493 hand pumps and 8 borewells in slum areas across city.
However the borewells are operated by the community itself at their own timings, water being
supplied to the slum dwellers only.
3.2 ASSESSMENT OF SERVICE DELIVERY
The overview of comparative performance indicators of water supply system over a period of three
years are shown in the figure 14. The coverage of household level connections is only 35%, though the
entire inhabitated city area is covered by the distribution network. This indicates that there are
possibilities to increase HH level coverage within the existing network.
Per capita availability of water at consumer end in 2010 – 11 was 82 lpcd. While availability of water is
not seen as an issue, due to design of distribution network, the city is able to supply water only once in 2
days for 1.5 hours. The daily water supply operations still involves manual procedures to operate the
water supply network, such as controlling the 70 valves through manual mode on a daily basis.
As metering is mandatory in all MJP operated water supply scheme, Yavatmal exhibits high extent of
consumer metering at 88%. However, extent of non revenue water is still 30%, pointing to possible issues
in network.
Source: (PAS Project, 2008 to 2011)
On the financial sustainability, MJP shows good on O & M cost recovery at 191% and collection
efficiency is 75%, which is close to the benchmark value of 80%. The billing cycle in MJP is bimonthly
with bill printing and distribution outsourced to a private agency. It is important to note here that
Yavatmal’s water tariff is comparable to that of any other MJP city. The city levies a volumetric charge on
the basis of consumption. The residential tariff of Rs. 10.2 per KL. Over the last seven years, tariff has
been revised three times, with 5% increase in 2006-07 and 10% in 2009-10.
Figure 14: Key Performance Indicators of Water supply system
0
20
40
60
80
100
120
140
160
180
200
Coverage of
WS
connections
Coverage of
WS
connections
in slums
lpcd at
consumer
end
Extent of
metering
Extent of
NRW
Continuity
of WS
Efficiency in
redressal of
complaints
Quality of
water
supplied
Cost
recovery in
WSS
Efficieny in
collection of
WS related
charges 2008-09 2009-10 2010-11

14 | P a g e
Table 9: Water tariff of YMC
Source: (Yavatmal MJP tariff structure)
As part of the reforms under MSNA, MJP has carried out consumer survey for entire city therefore HH
level coverage of water supply scheme has higher reliability. Quality related data are not maintained
properly and therefore have low reliability.
The issues and priorities are analysed based on the themes of access and coverage including slums,
service level and quality, financial sustainability & efficiency in service operation.
3.2.1 ACCESS AND COVERAGE
Coverage of individual water connection: Though 100% of the area is covered by the distribution
network, individual HH level coverage is only 35% which is very low. These can be attributed to many
reasons eg. high connection
fees , lengthy connection
procedure etc. From the
focused group discussions with
citizens, it was found that
approximate costs for water
connection was around Rs.
10,000. According to MJP’s
citizen charter, water
connection will be provided
within 3 months. However
during group discussions it is
reveled that there is no
specified time period within
which the consumer will be
provided the connection.
Coverage of individual water connections in slum settlements: The coverage of individual water
supply connections in slum settlement is 21%, further lower than city coverage even though 76% of slum
settlements have internal water supply network. Additional sources of water supply in slum settlement
are hand pumps, public taps and borewells, hence 48.4 % of the population have access to shared water
services in slums. However, field observations reveals that most of the public taps do not have tap, due
to which water flows continuously during supply periods and therefore registering wastage in water
supply. The adminsitration should covert the exisiting stand posts into group connections on an
immediate basis.
Year 2005-2006 2006-2007 2009-2010
Domestic Rs/KL 8.80 9.25 10.20
Non-Domestic Rs./KL 17.00 18.20 19.65
Commercial Rs./KL 40.00 42.00 46.20
Industrial Rs./KL 0 0 0
Figure 15: Access and coverage in city level and slums
Source: (PAS Project, 2008 to 2011)
38
25
100
76
35
21
100
76
0
20
40
60
80
100
Coverage of water
supply connections
Coverage of water
supply connections
in slums
Coverage of
distribution
network
% of slum
settlements having
internal water
supply network FY 2009-2010 FY 2010-2011
15 | P a g e
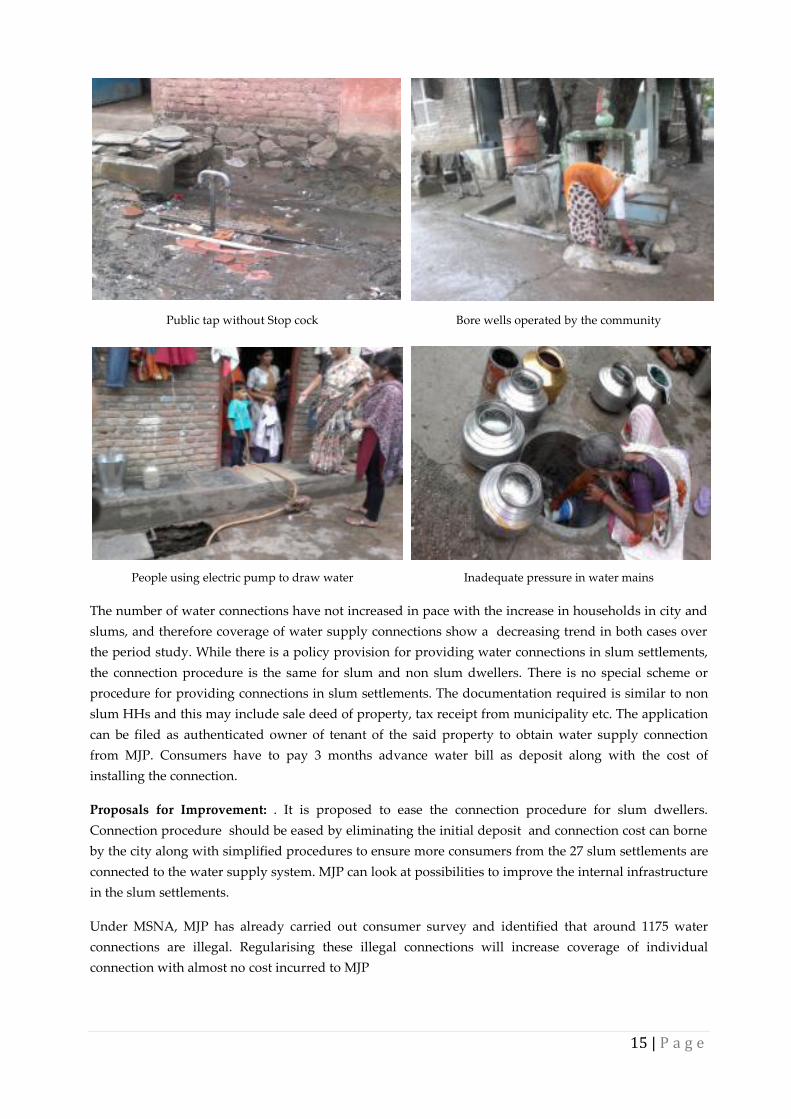
Public tap without Stop cock Bore wells operated by the community
People using electric pump to draw water Inadequate pressure in water mains
The number of water connections have not increased in pace with the increase in households in city and
slums, and therefore coverage of water supply connections show a decreasing trend in both cases over
the period study. While there is a policy provision for providing water connections in slum settlements,
the connection procedure is the same for slum and non slum dwellers. There is no special scheme or
procedure for providing connections in slum settlements. The documentation required is similar to non
slum HHs and this may include sale deed of property, tax receipt from municipality etc. The application
can be filed as authenticated owner of tenant of the said property to obtain water supply connection
from MJP. Consumers have to pay 3 months advance water bill as deposit along with the cost of
installing the connection.
Proposals for Improvement: . It is proposed to ease the connection procedure for slum dwellers.
Connection procedure should be eased by eliminating the initial deposit and connection cost can borne
by the city along with simplified procedures to ensure more consumers from the 27 slum settlements are
connected to the water supply system. MJP can look at possibilities to improve the internal infrastructure
in the slum settlements.
Under MSNA, MJP has already carried out consumer survey and identified that around 1175 water
connections are illegal. Regularising these illegal connections will increase coverage of individual
connection with almost no cost incurred to MJP

16 | P a g e
109 120
80 82
0
20
40
60
80
100
120
140
FY 2009-2010 FY 2010-2011
Per capita supply
of water
Per capita
available of water
at consumer end
3.2.2 SERVICE LEVEL AND QUALITY
Per capita supply: The MJP withdraws 29.9 MLD from the two surface sources of which 14 MLD is
provided to YMC. There is a substantial
increase in supply at source from 109 lpcd to
120 lpcd, as compared to increase in lpcd at
consumer end from 80 lpcd to 82 lpcd.
Field observations reveal low pressure levels
in slum settlements with water available only
at 3 - 4 meters below the ground level at
certain instances. In such cases, it is common
to observe consumers removing the meter
from pipe/ tap and withdrawing water
directly from the distribution network, using
electric pumps. Source: (PAS Project, 2008 to 2011)
Continuity of duration: Though the water quantity at source is considered adequate, MJP provides
water for a period of only 1.5 hrs every alternate day. However, MJP is keen to augment the distribution
network in order to increase the duration of supply. The distribution network in the city was laid down
in 1972 and designed for a population of 60,000. Under UIDSSMT, MJP is laying down distribution
network of 97 km currently.
Quality of water supplied: Quality of water supplied by MJP is 100% but has a D reliabilty. MJP is
carried out water testing regularly at WTP, WDS and at consumer end. Quality data are recorded
manually.
3.2.3 FINANCIAL SUSTAINABILITY
There has been impressive performance from MJP in O & M cost recovery and collection efficiency of
water supply charges. As mentioned previously, YMC provides free supply to slum settlements, apart
from MJP, through public stand post, bore wells etc. MJP charges YMC Rs. 90 lakh annually for the
usage of the public stand post, bills are raised on the fixed rate for stand post. Also, the electricity costs
of operating these borewells amount to Rs. 2 lakh per annum and is borne by YMC. The table below
details the revenue capital and revenue expenditure towards the provision of water supply services by
both MJP and YMC.
Table 10: Revenue income & expenditure for water supply system in YMC area (Rs. lakhs)
Budget Head 2008-2009 2009-2010 2010-2011
Revenue Expenditure
MJP (For supplying most of the water demand, from
raw water intake to distribution through water supply
network, billing and collection )
Salaries and Establishment costs 127.95 125.36 135.34
Fuel, electricity and related charges 218.35 248.69 256.93
Chemicals 7.86 6.11 4.9
Raw water 0 0 0
Repair and Maintenance 54.19 42.32 53.27
Figure 16: LPCD at source and consumer end

17 | P a g e
Budget Head 2008-2009 2009-2010 2010-2011
Others 0.24 0 0.6
Total Revenue Expenditure(MJP) 408.59 422.48 451.04
YMC (For servicing a part of the balance water demand
through borewells and hand pumps)
Salaries and Establishment costs 7.71 9.28 10.85
Raw Water 57.59 181.37 80.00
Repair and Maintenance 19.81 22.43 26.00
Others 9.86 13.95 15.00
Total Revenue Expenditure(YMC) 94.97 227.02 131.85
Revenue Income
MJP 511.77 646.77 675.94
YMC 22.77 23.73 24.83
Revenue Surplus / (deficit)
Revenue surplus / deficit (MJP) 103.18 224.29 224.9
Revenue surplus / deficit (YMC) (72.20) (203.29) (107.02)
(Budget books of Yavatmal Municipal council, 2005 - 06 to 2011 - 12)
The revenue expenditure by YMC towards water supply services has increased by a CAGR of 45% in the
last five financial years. The increase in expenditure is attributed to the increase in expenditure towards
raw water charges. The sudden increase in expenditure could also be due to the charges paid to MJP for
public taps and outstanding water dues.
However the increase in revenue income from water supply service is less in comparison to the revenue
expenditure incurred. The revenue account of water supply services by YMC has thus been in deficit for
the last three financial years. The revenue sources for YMC include 15% contribution from the
consolidated property tax and the income from the sale of water supplied through tankers.
Revenue expenditure by MJP towards water supply services has increased at a CAGR of 5.5 % during
the last three financial years. In comparison, the revenue income has increased at a CAGR of 14.9 %
during last three financial years, thus enabling MJP to maintain a healthy surplus towards the revenue
account.
The average per capita expenditure towards water supply services in the city (considering both MJP and
YMC) was Rs. 502 during last three financial years. This is more than that recommended by HPEC (Rs.
302) and the Zakaria Committee (Rs. 491), respectively, in 2009-10.
MJP has a cost recovery of more than 100% at a collection efficiency ranging from 75 percent to 78
percent (during the last three financial years).
Proposals for improvement
It is proposed to convert stand post into group connections; this will reduce burden on YMC. MJP has
already completed energy audit study, implementation of energy audit study measures will reduce the
operation and maintenance cost of water supply.

18 | P a g e
3.2.4 EFFICIENCY IN SERVICE OPERATION
Extent of NRW: As mentioned above, the per capita
supply at consumer end is less than per capita supply at
source due to losses in the water supply system. Extent of
non revenue water has increased from 25% to 30% in year
2009 – 10 to 2010- 11. Due to absence of metering at
sources, WTPs & WDSs, LPCD and extent of NRW have
low reliabilty. NRW will comprise of apparent losses and
real losses, apparent losses is reduced by regularizing
illegal connections and real losses is reduced by replacing
service line connections and repairing leaked pipelines.
Proposals for improvement: Under MSNA, MJP has already carried out consumer survey and identified
that around 1175 water connections are illegal. Regularising these illegal connections will increase the
water supply revenue and coverage of individual connection with almost no cost incurred to MJP.
MJP is installing bulk meters at various sources, WTPs and WDSs under MSNA. This will not only
improve the data reliability of indicator but also help to monitor and manage losses more efficiently.
Efficiency of complaint redressal: Though the efficiency of consumer redressal is 100%, it still needs
improvement. Presently the only means of registering complaints is through personal visits to the MJP
office.
Proposals for improvement: MJP can look at other complaint registering systems such as through
telephone, SMS, web based technology etc. This will ensure effective addressing of customer complaints
and also help in faster tracking and monitoring of the issues related to water services.
3.3 PROPOSED ACTIONS AND INTERVENTIONS
Based on the issues identified above, indicators are prioritized for the improvement actions. As the
coverage is quite low, this along with continuity and extent of non revenue water will be taken on high
priority basis. This will be followed by establishment of complain redressal system.
Under UIDSSMT, capital intensive works are already being carried out. Besides several water reform
measures are underway in MSNA. Thus the proposed actions for Yavatmal essentially include
additional low cost actions that can be done in sync with capital actions under implementation. Based on
above analysis, summary of improvement actions that can be proposed for Yavatmal are mentioned
below:
0
10
20
30
40
50
FY 2009-2010 FY 2010-2011
Figure 17: NRW of water supply
scheme

19 | P a g e
Table 11: Interventions with minimal capital expenditure
Categories Action Improvement of
KPIs
Estimated
Cost
Access and coverage
Subsidize the connection cost
for slum area and ease the
connection procedure
Coverage of WS
Connections
42 lakh*
Convert stand post into group
connection
Coverage of WS
connections and
Non revenue water
5.4 lakh**
Efficiency in service operation Establish the complaint
redressal system
Complaint redressal 10 lakh***
Total 57.4 lakh
* Assuming average connection charge of Rs. 2000 and 2100 beneficaries in slum settlements
** Assuming average cost for converting standpost into group connection is Rs 2500 per stand post
*** Including mobile application, software and hardware
Average cost for converting standpost into group connection will be around 5.4 lakh.
3.4 MOVING TOWARDS 24 X 7
Govt. of Maharashtra’s major focus in performance improvement has been the planning and
implementation of 24X7 water supply system in all Class A cities in the state. Given that MJP provides
water supply services to YMC, planning and implementation of the 24X7 system has to be carried out by
MJP.
While steps towards achieving 24X7 water supply requires substantial efforts, certain actions related to
skill up gradation of human resources and improved management information systems are easier to
implement. The technical guidelines suggested by MoUD towards 24X7 systems provide an approach
based on the institutional, technical and commercial improvements required. Efficient and effective
operation of urban water supply services is impossible without having these improvement.
Technical: Current water supply systems are operated in constrained conditions and shortcomings have
to be rectified for the conversion from intermittent to a continuous supply system. A summary of key
technical shortcomings are:
Reliable data on distribution networks and customers do not exist
There is virtually no metering of bulk water produced, its transmission or distribution at any
point in the network;
Pipelines within the distribution system are totally interlinked;
Control of leakage on a routine, planned basis is impossible;
It is unusual for a water utility to routinely measure or assess adequacy of system pressure; and
Customer meters do not function with any predictable accuracy under intermittent supply
conditions.
In YMC, the distribution network is very old and laid down in 1972 for a population of 60,000. The
current population has increased to 2, 10,000. Therefore the existing distribution network is not able to

20 | P a g e
fulfill the demand with adequate pressure. There is also no metering at source, WTP and WDS level. As
the distribution network is interlinked, there are no clear operational zones that exist in the present
distribution network. Though the metering at consumer end is 88%, meter accuracy is unknown. To
implement 24x7 water supply, therefore the current water supply system should be improved.
In order to fulfill the existing water demand along with adequate pressure, a DPR was prepared
and approved for improving the distribution network under UIDSSMT. As per the DPR, the
distribution network of 97.5 kms in the old city and construction of ESR of 20 lac lts capacity is
going on. The total approved project cost is Rs 10.96 crore.
Reliable data on distribution network and customers is achieved through:
To generate reliable data on distribution network and consumers, MJP has already procurred
satellite image of Yavatmal city. This has been overlaid with existing water network along type
of pipe line, diameter, length, location of valves, etc. Around 50,000 properties have been
surveyed and the results are integrated into GIS, along with network details.
Interlinked distribution network can be restructured through:
Based on the digital maps prepared , five operational zones within the network is demarcated
using Bentley software for hydraulic modelling. This will help in removing issues of interlinked
pipelines in the network.
Metering at bulk production and distribution points:
To measure the water quantity at various sources, WTPs and at inlet of each operational zones,
bulk flow meters have been installed and around 80% of the work is completed.
Control of leakage on a routine, planned basis
To minimise leakage in water supply system, water audit and leak detection study will be
carried, after completion of the installaion of bulk flow meters at all points. Energy audit will
also be carried out to ensure optimum use of electricity for water supply services.
The above activities will help in removing technical shortcomings of the existing water supply system.
Once this stage is completed, zonewise population is generated using density method and pipe wise
water quantity demand is calculated. For implentation of 24x7 water supply system, the hydraulic model
study is completed and DPR is under preparation. These reforms are funded under MSNA and costs of
these are given in table no 12. MSNA was launched, as reform linked programme to improve water
supply and sanitation in ULBs in Maharashtra. The DPR for the 24 x 7 water supply in Yavatmal is
currently under preparation.

21 | P a g e
Table 12: Approved cost for Water reform activities under MSNA in July 2009
Sr No Component Cost (Rs in crore) Current Status
Approved cost for water reforms activities under MSNA
1 Consumer survey 0.11 Completed
2 Water audit 0.45 Under progress
3 Energy audit 0.15 Completed
4 Flow meters 0.55 Under progress
5 Hydraulic modelling 0.34 Completed
6 GIS mapping 0.25 Completed
7 Computerised water billing and collection
system
0.18 Under progress
Total approved cost for water supply reforms 2.03
Cost for 24x7 water supply (According to draft DPR)
Major component in DPR will be construction of mass
balance reservoir, rehabilitation of pipelines, replacement
of service connections and customer meters, installation of
pressure reducing valves, monitoring and then reducing
leakages in each DMA .
40.23 Draft DPR is
prepared
Total cost for 24 x 7 water supply 42.26
Commercial: The conversion to 24x7 will also require more sophisticated commercial systems and
procedures along with technical improvements. Continuous supply is likely to result in significant
changes in the way the customer interacts with the water supply authority. Billing and payment
arrangements may be revised and expectations with respect to payment discipline will be different.
In YMC, MJP is establishing computerised water billing and revenue collection system. This is funded
under MSNA programme, cost of these reform is given in table 12.
Institutional: Planning, implementing and operating a water service under 24x7 supply conditions also
require technical skills and a higher degree of managerial control. A good institutional framework can
ensure that a 24-7 conversion program is successful and sustainable
In Yavatmal, water supply system is operated and maintained by MJP and as discussed previously MJP
has a different staff organogram. Yavatmal water supply system is handled by team of MJP with prior
experience of implementating 24 x 7 WS in the nearby town of Amravati. Also MJP has the technical and
managerial skill to plan, design, implement, operate and maintain a 24x7 water supply system in YMC.
A summary of the actions already carried out and cost implications towards achieving 24X7 water
systems is given below:

22 | P a g e
Table 13: Summary of improvement actions to implement 24X7 systems
Activity Description Status
Network and
Customer
database
GIS mapping and hydraulic modeling for entire city Carried out under
MSNA 100% Consumer end survey, including identifying and
regularizing illegal connections
Network
Restructuring
Creation of DMAs and installation of bulk flow meters Carried out under
MSNA
Water audit
and Leakage
detection
Conduct water audits and leak detection studies, and repair
existing leakages in the system
Carried out under
MSNA
Implementation
of 24X7 in
whole city
Augmentation of entire network in the city Draft DPR is prepared

23 | P a g e
4. ASSESSMENT AND PROPOSALS FOR SANITATION
This section of report provides details of coverage of toilets in city and in slum settlements with improvement
options focused on making YMC open defecation free city. This section also captures current practice and
improvements for fecal sludge and septage management.
4.1 COVERAGE OF TOILETS
In Yavatmal around 19,000 HHs have individual toilet and approximately 5,000 HHs have access to
community toilets. There are
34 public toilet blocks and 19
pay & use toilet blocks in the
city area. Coverage of
individual toilet is 71%
whereas in slum areas
coverage is only 33% which is
very low as compared with
city level coverage; coverage
of individual and community
toilet in city area is 88% and at
slum level is 55%. Coverage of
toilets is decreasing in the last two years as evident from fig. 17.
As per the recent figures from census 2011, 69% of
the households have access to safe sanitation
implying latrine facilities within premises
connected to septic tank and ventilated improved
pit latrine. 1% of the households have access to
unimproved sanitation like pit latrine without
slab/pit and where night soil is disposed into open
drains. 18% households are depending on the
public toilets. However, 12% of the households in
Yavatmal do not have access to any sanitation
(improved/unimproved/shared) and thus resort to
open defecation practices.
Coverage of toilets in slum areas is abysmally low as compared to overall coverage at city level. Under
the VAMBAY scheme, efforts have been done to add 783 individual toilets from year 2001 to 2006. As
per YMC officials, there are around 4120 individual toilets in the slum settlements. However this is very
less as compared against total requirement of 10,213 individual toilets. There are 53 public and pay & use
toilet blocks. 70% of these toilets blocks are located within slum areas (see Figure 20). Out of 19 notified
slum settlements, 14 settlements have access to either public or pay & use toilets. However of the 7 non
notified slum settlements, only 2 settlements (Amraipura & Pimpal gaon) have access to either public or
pay & used toilets. Refer Annex 3 for details for public and pay & used toilet seats in slum settlements in
Yavatmal.
80 71
39 33
99 88
67
55
0
20
40
60
80
100
2009-10 2010-11
Coverage of individual toilets
Coverage of individual toilets
in slums
Coverage of toilets (individual
+ comm)
Coverage of toilets in slums
(individual + comm)
Figure 18: Coverage of toilets in city and slums across the years
Figure 19: Access to sanitation in YMC (Source: Census 2011)
69
1 18
12
0
20
40
60
80
100
2011
Open defication
Public toilets
Unimproved sanitation
Improved sanitation

24 | P a g e
Figure 20: Map showing notified and non-notified slum settlements and sanitation facilities
Source: (CEPT University,
2011)
During the field study, the
team observed that some of the
toilet blocks and seats are not
functional. The team has
mapped location of functional
Table 14: Status of Public and Pay & Use toilets
Toilets Number
of block
Number
of seats
Number of
functional
block
Number of
functional
seats
Public Toilets 34 347 17 173
Pay & Use Toilets 19 310 19 310
Total 53 657 36 483
Source: (CEPT University, 2011)

25 | P a g e
and non functional toilets as shown in Figure no 20. Of the total 53 blocks, about 76% are functional. 50%
of the public toilets are non functional while all pay & use toilets are in functional condition.
Condition of Public and Pay & Use toilets in Yavatmal Municipality
There are several reasons behind non functionality of public toilet blocks. First hand field interactions
reveal that some of the toilets are non functional due to improper usage or maintenance by the user
groups. The ULB has contracted out cleaning of pay & used toilet blocks. Though this cleaning happens
on regular basis, due to improper usage of toilets, the conditions are found to be unhygienic and
improper. Awareness campaigns need to be conducted by the
Council to ensure proper usage.
Some of the toilet blocks are non functional due to non
availability of water and absence of doors. In one of instances,
it was observed that the toilet block was fenced as part of their
property by the individual family and used for their personal
purposes. Slum wise details of non functional toilets are given
in the table 15.
Efforts to renovate or repair non functional toilets can help
reduce instances of OD in Yavatmal. During the field study, the
team has mapped the location of existing open defecation (OD)
sites and these were found in proximity to the slum locations in
the city (Refer figure 20). Based on the analysis of the existing
toilet facilities, both individual and shared, 17,969 people in
Yavatmal do not have access to any kind of sanitation/ toilet
facilities, which is around 15.4% of city population. This is close to census figure of 12% of city
population resorting to OD.
Based on the above analysis, first priority is to refurbish the existing non functional toilets and
afterwards various options have been worked out based on provision of individual toilets, community
toilets or individual and community toilets where constraints for providing individual toilets exist.
Table 15: Details of non functional
seats for refurbishment
Slum settlement Non functional
toilet seats
Godown Phail 5
Kumbhar Pura 12
Malipura 10
Patipura Dorli pura 14
Shinde Nagar 19
Talav Phail - I 10
Vanjari Phail 13
Amrai Pura 9
Pimpal Gaon 5
Total 97
Source: (CEPT University, 2011)

26 | P a g e
Based on the analysis of existing
toilets, there are 97 toilet seats
which are non function and can be
refurbished by YMC.
Refurbishment cost is assumed to
be Rs. 10,000 per seat. 25 persons
per toilet seat are assumed for
construction of new toilets. The
total costs for refurbishment
amounts to Rs. 10 lakh. YMC
should ensure that these seats
should be spatially distributed
properly. All slum dwellers should have access to public or pay and use toilets. To cover the gap in toilet
provision for the remaining population, three options are considered for YMC. The first is to achieve the
gap through 100% provision of individual toilets, second being combination of individual and
community toilets and last option is construction of only community toilets. These options are discussed
below.
Option 1: Achieving Open defecation free status through 100% provision of individual toilets: After
refurbishing the non functional toilets, a gap of 3454 no of individual toilets still exists and need to be
covered to ensure OD free status. The
total cost works out to be Rs 1209 lakh,
assuming a construction cost of Rs
35,000 per individual toilet. 10%
beneficiary share is taken into
consideration. Total cost for making
Yavatmal OD free by refurbishment of
non functional seats and provision of
individual toilets thus amounts to Rs.
1098 lakh. To identify and motivate the users for construction of individual toilet, there is a need to
create awareness among users through an IEC campaign. Budget of IEC cost is consider as 5% of
construction cost of individual toilet.
Option 2: Achieving Open Defecation Free status through provision of individual and community
toilets: Based on this option, the YMC would have to construct about 1036 individual toilets and 44
community toilet blocks having 10 seats per block. Assuming similar costs for individual toilet as in
Option 1 and Rs. 50,000 per seat (including connection to septic tank), the total cost works out to be Rs.
580 lakh. From this 10% beneficiary share is taken into consideration. To identify and motivate the users
for construction of individual or community toilet, there is a need to create awareness among users
through an IEC campaign. Budget of IEC cost is consider as 5% of construction cost.
Table 16: Cost calculation for refurbishment of non functional
community toilets
Estimated Population resorting to OD 17969
No. of non-functional seats (that needs to be
refurbished)
97
Population shift after refurbishment of non functional
public seats
2425
Estimated population resorting to OD after
refurbishment of non functional public seats
15544
Refurbishment cost of existing Non-Functional
toilets (Rs. Lakh )
10
Source: (CEPT University, 2011)
Table 17: Cost calculation for construction of individual toilets
No of HHs required toilet 3454
Total cost for construction of new individual
toilets (Rs Lakh)
1209
10% beneficiary share (Rs Lakh) 121
Fund required (Rs Lakh) 1088
IEC activity (Rs Lakh) 60
Source: (CEPT University, 2011)

27 | P a g e
Option 3: Achieving Open Defecation
Free status through provision of only
community toilets: Alternatively, the
YMC can also look at the option to
make the city OD free through
provision of community toilets. Under
this scenario, there is a need for
construction of 622 additional new
toilet seats after refurbishing the non
functional toilets. Cost for construction
of new community toilet is assumed as
Rs 50,000 per toilet seat. Total cost for
making Yavatmal OD free by
refurbishment of non functional seats
and constructing the community
toilet blocks amounts to Rs. 321 lakh.
Considering the field realities, there is
an urgent need to create awareness
among users through an IEC
campaign on proper usage of common toilet facilities. Budget of IEC cost is consider as 5% of construction
cost of community toilet.
Table 20: Summary of options to make YMC Open Defecation Free (in Rs. lakhs)
Strategies for ODF Option 1 Option 2 Option 3
Refurbishment cost 10 10 10
Number of individual toilets 3454 1036 0
Number of additional seats in community
toilets / public toilets
0 435 622
Toilet construction cost 1088 544 311
IEC Activities at 5% of construction cost 60 29 16
10% beneficiary share for individual toilet 121 36 0
Total cost (in Rs. Lakh) 1158 583 336
Source: (CEPT University, 2011)
Considering YMC’s current financial position, achieving 100% toilet coverage through option 1 does not
seem to be financially sustainable. On the other hand, while option 3 is the least costly of all options,
operation and maintenance of the community blocks will remain an issue as similar issues can be seen in
the existing community and pay-n-use toilets. Option 2 is most feasible both in terms of cost as well as
management of community toilet blocks.
4.2 SEPTAGE AND SULLAGE MANAGEMENT
Yavatmal does not have underground sewerage system. Toilets in the cities are connected to septic tanks
and soak pits. The grey water is collected through the drainage network. The city has 100% habituated
area covered under drainage network through open and closed drains. The drains are cleaned regularly
by private contractors and hence do not give rise to foul smell even during the peak operating hours.
Table 18: Cost calculation for construction of community toilet
Number of seats need to be constructed 622
Cost for constructing new community toilet seats
(Rs. Lakh)
311
IEC activity (Rs Lakh) 16
Source: (CEPT University, 2011)
Table 19: Cost calculation for construction of individual &
community toilets
Number of individual toilet need to be constructed 1036
Number of seats need to be constructed for
community toilet
435
10% beneficiary share for individual toilet (Rs
Lakh)
36
Cost for construction of toilets (Rs in Lakh) 544
IEC activity (Rs in Lakh) 29
Source: (CEPT University, 2011)

28 | P a g e
Cleaned open drains in city Waste left along sides of the
drain
Open drain network in Slums
Field visit revels that most of the city drains are clean and well maintained. However in few slum
pockets where there are narrow streets and drains, drains are clogged, the cleaning is not carried out
regularly. In some areas drains are cleaned but waste is left along sides of the drain.
Outfalls of these drains are diverted into the existing lakes. At present, wastewater is not treated and
disposed off in natural water bodies. City has one vacuum machine to clean the septic tank. Within city
limit 750 Rs per trip and outside city limit 1000 Rs per trip is the septic tank cleaning charge. The septage
is dumped near the solid waste dumping place without any treatment.
Proposal for improvement:
Treatment of septage:
Field study revealed lack of
septage treatment and
disposal facility. YMC needs
to treat fecal sludge; treated
fecal sludge can be sold to
farmers since Yavatmal is
surrounded by good
agricultural hinterland. YMC
also has to procure
additional suction emptiers.
Considering the estimated
number of 17815 septic tanks and cleaning interval of 5 years, a total of 5 suction emptiers would be
required for YMC. This is assuming that one emptier cleans 700 tanks annually. As YMC already has one
emptier, it will need to procure an additional four emptiers with each costing about Rs. 15 lakhs.
Composting of fecal sludge can be carried out at adjacent to the dumping place located near to the vermi
composting plant. The compost plant will have 93 dump pits excavated of dimension of 30 x 10 x 3 feet.
The fecal sludge will be dumped into these pits and used for producing compost. Compost thus
produced every year is dug out, sold to farmers and the pits are reused. O & M of the fecal sludge
treatment plant can be outsourced along with SWM vermi composting plant.
Table 21: Cost calculation for Fecal sludge managment
Collection
of septage
Number of emptier available at present 1
Needed for full service by Municipality 5
Supply gap 4
Cost of septic tank emptier (Rs in Lakh) 60
Treatment
of septage
No of septic tanks 17815
Average volume of FS reaching at composting
site
1.25 m3 per
septic tank
No of compost pit needed (Assuming annually
2 composting cycle per pit)
93
Area of compost pits 3488 sq. m

29 | P a g e
Treatment of sullage
The municipality has developed a proposal for the treatment of wastewater through Phytoride
technology tested by NEERI.
According to PAS checklist 2010-11, YMC generates around 8 MLD of wastewater. Construction cost for
phytoride technology based treatment facility is assumed to be Rs 1.2 lakh for 20 m3/day wastewater.
Average cost for construction of treatment plant will thus work out to be Rs. 4.8 crore for YMC.
4.3 SUMMARY OF PROPOSED ACTIONS / INTERVENTIONS
Given that Govt. of Maharashtra’s major focus in urban sanitation has been towards ‘making cities
Open Defecation Free’, the performance improvement plan in sanitation for YMC has concentrated on
the covering the gap in toilet coverage, and related components like IEC activities, awareness campaigns,
etc.
It is proposed that the YMC will move towards ODF status within the next five years. Assuming that the
YMC will do this through provision of both individual and community toilets, it will cost the council Rs.
1.17 crore per year, across the five years. Simultaneously, the YMC will have to undertake revenue
augmentation measures like levy sanitation taxes, levy charges for maintenance of community toilets,
etc.
Table 22: Cost for Sanitation improvement in YMC
Cost for ODF Rs in Lakh
Refurbishment cost 10
Toilet construction cost 544
IEC Activities at 5% of construction cost 29
Total cost for toilet coverage 583
Cost for FSM 60
Cost for Septage treatment 480
However, the YMC must also simultaneously undertake community mobilization and awareness
campaigns in order to ensure that the community toilet blocks are maintained/ managed properly. While
the maintenance of all the pay-n-use toilets has been contracted out, similar arrangements with CBOs can
be looked at with respect to community toilets. Campaigns to bring about awareness related to
cleanliness and hygiene practices, safe sanitation practices, and negative health impacts due to open
defecation needs to be conducted by the Council. Local NGOs and CBOs need to be roped into this
exercise to ensure participation by all communities. The campaigns should begin by triggering initiation
in the slum settlements and undertaking transect walk to the open defecation sites to highlight the above
issues.
Proposed project for wastewater treatment:
Pilot project of construction of Decentralized Wastewater Treatment facility for Public Toilets and
afterwards success story can be replicated in all 52 toilets
Feasibility study has been done for the treatment of municipal sewage through Phytoride
Technology by NEERI.

30 | P a g e
As mentioned previously, septic tank cleaning machines are inadequate as compared to the demand.
Assuming that YMC will meet this demand by procuring additional four vacuum trucks, cost incurred
will be Rs 60 lakh. Cost of fecal sludge treatment is minimal, as YMC already has land available near the
vermi compost plant.
YMC has already proposed a Phytoride technology based treatment facility for sullage treatment.
Construction cost of this treatment system will be around 480 lakh. The operation and maintenance cost
of this system is very less and relatively easy to maintain.

31 | P a g e
5. SUMMARY OF PERFORMANCE IMPROVEMENT PLAN FOR YAVATMAL
This section covers overall cost summary of PIP proposal along with phase wise implementation plan. This covers
assessment of the level of funding available with YMC and the amount required to be generated from external
sources to fund these PIP actions.
5.1 SUMMARY OF PROPOSAL
The proposals summarized below are focused on two key areas of establishing 24X7 water supply
system and moving towards open defecation free. It also includes improvements in key processes and
operations related to these two focal areas. Based on the analysis of the water and sanitation sectors in
Yavatmal, the Performance Improvement Plan has been summarized in table 23 given below. While
some of the actions identified in the previous sections can be taken up immediately and are low cost
actions, others are more capital intensive and will require preparation of detailed project reports and
financing plans to implement.
Table 23: Overall cost summary of PIP action
Categories Action
Estimated
Cost (Rs
in crore)
Current status
Water supply
Low cost action
Access &
coverage
Convert stand post into
group connection 0.05
Needs to be done
Subsidize the connection
charges and simplify the
connection procedure for
slum dwellers
0.4
Needs to be done
Efficiency in
service operation
Introduce appropriate
complain redressal system 0.1
Needs to be done
Capital intensive
Service level &
Quality
24 x 7 water supply
implementation cost
(according to draft DPR)
40.2
Awaiting finalization
and sanction of DPR
Total Water supply improvement cost 40.77
Sanitation
Low cost action
Toilet coverage Refurbishment cost 0.1 Needs to be done
Fecal sludge
management
Procurement of vacuum
trucks 0.6
Needs to be done
Capital intensive
Toilet coverage Toilet construction cost & IEC
activities 5.7
Preparation of DPR is
required
Service level &
Quality Treatment plant construction 4.8
Feasibility study
completed
Total Sanitation improvement cost 11.2
Total cost for performance improvement 51.2
Process related improvement actions: Based on discussions with the MJP & YMC, process related
improvement actions that can impact the service levels of the water supply system is revision of ‘new

32 | P a g e
connection’ format for slum settlements. In new connection format, eliminate connection deposit and
connection charge can be borne by MJP.
Improvements related to performance contract for sanitation
The contract with private parties does not specify any performance targets or incentives which would
help YMC to monitor the improvement in sanitation. Improvements are suggested in the contract with
respect to specifying annual targets as well as reporting procedures for the private contractors.
Under the agreement between YMC and private contractors, the operation and maintenance of pay and
use toilets is the responsibility of private contractors. Some of the clauses that need to be revised by
adding certain performance targets are listed below:
Table 24: Improvements required in contract between private agency and YMC
Categories Contractual clauses Improvements/ additions
suggested
Access and coverage Include target for no of
community toilets users
Service level and quality There should not be any
complaints from nearby
residence
Monthly routine inspection of
cleanliness of toilets and drains
by community leaders.
Efficiency in service operation Clean drains regularly Clean drains and dump the
waste at dumping site. Levy
penalty charges if hips of waste
are seen along with drains.
5.2 PROPOSALS RELATED TO IMPROVING FINANCE OF YMC
In order to carry out the PIP, the financial capability of YMC needs to improve. The financial assessment
has been done through the approach of business-as-usual scenario, which is based on the hypothesis that
the past trends in key financials of YMC would continue in the future. Based on such assumption, the
key financials of YMC have been projected and the investible surplus has been determined. To arrive at
the investible surplus in the this scenario, calculations are based on 1) revenue surplus (Difference of
total revenue expenditure and WSS related revenue expenditure), 2) net surplus after capital and
revenue receipt and expenditure (revenue surplus + capital receipts other than WSS – capital expenditure
other than WSS and debt servicing), and 3) investible surplus (surplus + revenue related to WSS –
revenue expenditure related to WSS). The key financials of the council have been projected for 10 years
from 2011-12 as shown in below table. The financial assessment of YMC shows that the investment
capacity of the council is improving over a period of time.

33 | P a g e
Table 25: Projected investible capacity – Business as usual scenario (Rs in Crore)
Year 2011-12 2021-22
Revenue surplus (other than WS, WWS, and MSW) 5.16 14.70
Capital receipt 6.25 14.75
Capital expenditure 10.58 13.49
Net Surplus after capital and revenue accounts (All
except WS,WWS,MSW and Slums)
0.84 15.95
Revenues (WS, WWS, MSW, and slum) 0.13 0.17
Revenue expenses (WS, WWS, MSW, and slum) 5.31 6.85
Balance available for investment in performance
improvement actions
-4.34 9.27
Source: (CRISIL Infrastructure Advisory Limited, Municipal financial assessment for Yavatmal Municipal
council, 2005-2012)
It can be observed that YMC does not have significant balance for investment in performance
improvement actions until 2015-16. This highlights the requirement of improving the revenue sources for
meeting the service obligations of the city.
Investment capacity after revenue enhancement measures
As per 2009-10 budget of YMC, the per capita deficit in wastewater and SWM services combined is Rs.
196. Under the Maharashtra Municipal Councils, Nagar Panchayats and Industrial Townships Act, 1965,
the council can levy following water and sanitation related additional taxes apart from the mandatory
consolidated property tax:
Special sanitary tax on private latrines, premises, or compounds cleansed by a municipal agency
after making provision for the cleansing thereof by manual labour; or for conducting or
receiving the sewage thereof into municipal sewers
Drainage tax
Special water tax for water supplied by the council in individual cases, with charges for such
supply being fixed in such modes as shall be best suited to the varying circumstances of any
class of cases
Based the Act, YMC can explore levying sewerage charges as part of the property tax to recover O&M
cost for the services provided. Other revenue improvement measures that YMC can explore are
mentioned below.
Increase in property tax rates
Increase in demand of property taxation through improvement in coverage
The above actions do not require any significant capital investments for implementation and need only
process changes. To simulate the effect of the above changes in the investment capacity, assumptions
have been made considering improvement of O & M costs in services. The details of assumptions are
given in Annexure no 5.
At the same time, serious expenditure controls also needs to be enforced for YMC to contribute towards
improving the investible surplus. Hence YMC can look to financing its projects after 2014.

34 | P a g e
5.3 PHASING OF INVESTMENTS FOR IMPROVEMENT
Based on the revenue enhancement measures mentioned above, the investment surplus for YMC will be
approx. Rs. 45.5 crore in the next ten years. Hence YMC can look to financing its sanitation projects
whereas water supply projects will be financed by MJP. Cost for 24x7 water supply implementation can
be covered under UIDSSMT and/or Nagarothan grant. The improvements for YMC have been proposed
in three phases: 1) Immediate interventions (from 2013 - 2014), 2) Short term interventions (from 2015 -
2018) and 3) Long term interventions (from 2018-2019). The interventions mentioned above to augment
revenue as well as process improvements are proposed to begin in 2013. The costs shown below
indicated are inflated at 7% for each year.
Table 26: Phasing of PIP for YMC
Activities 2014 2015 2016 2017 2018 2019
Water supply
Phase 1
Convert stand post into group connection
Subsidize the connection cost for slum
settlement
Establish the complain redressal system
24x7 WS DPR approval
Phase 2
24 x 7 water supply implementation
(Major component in DPR will be construction of
mass balance reservoir, rehabilitation of pipelines,
replacement of service connections and customer
meters, installation of pressure reducing valves,
monitoring and then reducing leakages in each DMA)
Sanitation
Phase 1
Refurbishment of community toilets
Phase 2
Procurement of vacuum trucks
Construction of individual toilet
Construction of community toilet
Phase 3
Treatment plant construction
Phase 1: Immediate interventions (from 2013 - 2014)
It is suggested that low cost action along with preliminary work for finalization and approval of the DPR
for 24x7 will be undertaken in the first year. It is proposed that YMC will begin with interventions
related to process and policy changes that will not require capital investment such as introducing
drainage tax, property assessment, revision in property tax etc. These interventions are listed below:
In water supply
o Convert stand post into group connection
o Subsidize the connection cost for slum settlement

35 | P a g e
o Establish complaint redressal system
o Finalization and approval of DPR for 24X7
In sanitation
o Revision in contractual arrangements
o Levy drainage tax
o Identify beneficiary for individual toilets
Phase 2: Short term intervention (from 2014-18)
Once the revenue augmentation measures and process improvements are in place, it is proposed that
YMC can begin its capital intensive projects from 2014-15.
YMC will be able to fund implementation of open defecation for entire city from its own revenue
sources.
It is suggested that low cost action along with preliminary work for 24x7 like DPR finalization,
approval, etc be undertaken in the first phase. Subsequently, implementation of DPR should be
carried out in the following four years and covered in phase 2.
In first year, low cost action should be implemented. YMC can begin refurbishment of existing
community toilets before initiating construction of new community toilets. To begin with YMC
will identify the beneficiary for individual toilet and then in the subsequent year can go for
construction of individual toilets. Construction of individual toilets will be completed in three
years, while community toilet will be completed by two years.
While the maintenance of all the pay-n-use toilets has been contracted out, similar arrangements
with CBOs can be looked at with respect to community toilets. Campaigns to bring about
awareness related to cleanliness and hygiene practices, safe sanitation practices, and negative
health impacts due to open defecation needs to be conducted by the Council. Local CBOs need
to be roped into this exercise to ensure participation by all communities. The campaigns should
begin by triggering initiation in the slum settlements and undertaking transect walk to the open
defecation sites to highlight the above issues.
At present, YMC has one vacuum truck for cleaning septic tank; it is proposed that in the first
year YMC will start treating fecal sludge and then in the subsequent four years will procure
additional vacuum truck. For fecal sludge treatment, it is proposed that YMC can use extra
space available at existing solid waste dumping site. And O & M should be given on contract
basis along with existing vermi composting plant.

36 | P a g e
Figure 21: Implementation of sanitation projects
Phase 3: Long term intervention (from 2018-19)
It is suggested that YMC should first implement ODF activities like refurbishment and then
construction of community toilets and individual toilets and then can go for a construction of
sullage treatment plant.
After implementation of revenue improvement measures, YMC will be able to generate investible
surplus. YMC will be able to fund ODF related activities from their internal surplus whereas for
implementing 24x7 water supply, MJP has to depend on external funding.
5.4 INSTITUTIONAL IMPERATIVES TO ACHIEVING PROPOSED IMPROVEMENTS
In order to realise the targets set for improving water supply and sanitation in YMC & MJP, the existing
institutional framework must be enhanced to enable better operation and management of these services.
While in certain areas, it is the lack of a defined policy restricting provision of services, in other instances
it is the improper regulation of the existing policies. YMC has to focus its attention on improving policies
related to services, financial sustainability, and accountability to the consumers.
To ensure adequate utilisation of funds for capital projects, YMC has to build capacity of existing staff
for project implementation. As mentioned previously, MJP has enough technical capacity to plan, design,
implement, operate and maintain a 24x7 water supply system. A summary of the institutional reforms
that YMC needs to undertake are given below.
0
1
2
3
4
5
6
7
2015 2016 2017 2018 2019
Rs
in c
rore
Years
Refurbishment of toilets
Procurement of vacuum trucks
Construction of individual toilet
Construction of community toilet
Treatment plant construction
Investible surplus

37 | P a g e
Table 27: Institutional improvements proposed for YMC
Area of improvement Suggested improvements
Human resource
management
YMC has to ensure adequate utilisation of funds for capital projects, YMC
needs to built capacity of existing staff.
Equity in service
delivery
Introduce policy to improve water supply and sanitation services to slum
settlements, as well as un-served areas of the city. Reform institutional
arrangements (with MJP) to target and monitor improvement services to
slum settlements.
Financial
sustainability Introduce tariff for sewerage, sanitation, septage management services.
Consumer redressal
system
Establishment of complaint redressal system to ensure effective addressing
of customer complaints and also help in faster tracking and monitoring of
the issues related to water & sanitation services.
The Council has to also form a PIP review committee in order to ensure proper implementation of the
proposed projects. This is discussed below.
Constitution of the PIP review committee: The first step towards implementation of the proposed
projects should be to constitute a PIP review committee comprising of key technical staff for water
supply (MJP sub divisional office) and sanitation. The committee will be headed by the CO. The Council
must legally mandate the PIP review committee with implementing the proposed projects. Appropriate
budget provisions should be made to properly manage the committee. The responsibilities of the
committee will include quarterly progress updates to General Body and divisional office of MJP and
annual progress reports to the Directorate of Municipal Administration (DMA). A broad schematic of the
institutional structure is shown below.
Performance monitoring through regular setting of targets and use of performance indicators: In order
to ensure that YMC is able to achieve the performance improvement proposals outlined above, it is
necessary that it has a well structured monitoring framework in place. The monitoring aspects will
include
PIP review committee, CO
MJP, sub divisional office
Sanitation department
Account & property tax dept
General body, MJP divisional office ,
DMA
Advisory &
monitory role
Reports to review
committee
Implementation of PIP
proposals
Monitory role
Figure 22: Institutional structure for PIP implementation

38 | P a g e
• Timely data capture and analysis of performance indicators
• Assessment and evaluation of progress
• Setting of targets (for own department as well as MJP) and corrective action if required
• Decisions on policy, resource allocation and incentives/ penalties
• Operational decisions and plans
As the performance improvement proposals are phased from 2013 till 2019, it is necessary for YMC to
ensure that through the above process, the targets set for each year is achieved and if required corrective
measures need to be incorporated. This will be possible only if the information related to performance
indicators are updated and analysed regularly. Similarly, policies to provide incentives/ penalties to
internal and external staff based on their performance needs to be implemented. Given that YMC should
look to external agencies for support in PIP, the monitoring process should also include review of these
agencies. A possible performance monitoring framework is suggested below.
Figure 23: Performance monitoring framework proposed for YMC
Data generation level at
operational units
Analysis level at head of
department
Decision making level at
MC and standing
committee
Source: (Adapted from MoUD website: http://www.urbanindia.nic.in/programme/uwss/slb/slb.htm)
Water supply, sanitation, accounts,
property tax department and MJP
Collate and analyse performance indicators - PIP review committe,
YMC
Assessment and evaluation of
performance - YMC and DMA
Setting of targets for own department and MJP - PIP review committee,
YMC
Corrective actions and performance improvements -
related department YMC and MJP
Decision on Policy, resource allocation,
Incentives & penalties : YMC and DMA
Operational decisions and plans: PIP review
committee, YMC
Feed back
Feed back
Should report
Should report
Should report
Should report Should translate into

39 | P a g e
REFERENCES
CENSUS. (2011). Provision Population Totals of 2011. Retrieved 2012, from Census of India. 2011.:
http://www.censusindia.gov.in/2011-prov-results/PPT_2.html
CEPT University. (2009 - 2011). City Level Checklist. Performance Assessment Systems for Urban Water
Supply and Sanitation for Maharashtra. Mimeo.
CRISIL Advisory Services. (2012). Yavatmal: Assessment of Municipal Finances. Draft Report for PAS Project.
CEPT University.
MJP. (2006). DPR for Improvement in Distribution Network in Yavatmal Water Supply Scheme. Mimeo.
MJP. (2011). Monthly information of water works. Mimeo
MJP. (2011). Reform Works Under Maharashtra Sujal and Nirmal Abhiyan. Mimeo
MJP. Yavatmal Water Supply Scheme. Brief Statement. Mimeo
MJP. (2011). Yavatmal tariff structure . Mimeo
MoUD. (2011). Advisory on Septage Management in Indian Cities: National Urban Sanitation Policy. Retrieved
June 2012, from Ministry of Urban Development, Govt. of India:
http://www.urbanindia.nic.in/programme/uwss/slb/SeptageMgmtAdvMay20.pdf
MoUD. (2008). Guidance Notes for Continous Water Supply (24-7 supply). A Guide to Project Preparation,
Implementation and Appraisal. MoUD.
MoUD. (2010). Service Level Benchmarks. Retrieved June 2012, from Ministry of Urban Development.
Government of India. Web site: http://www.urbanindia.nic.in/programme/uwss/slb/slb.htm
Yavatmal Municipal council. (2005-06 to 2011-12). YMC Budget book .Mimeo.
Yavatmal Municipal Council. (2010). Contract for cleaning with Triveni Construction. Mimeo
Yavatmal Municipal Council. (2004-05 to 2008-09). Tax collection proforma. Mimeo
Yavatmal Council. (2006), Table of sanctioned post for establishment.Mimeo.

40 | P a g e
ANNEXES
Annex 1: Slum Settlement Profile of Yavatmal Municipal Council
Sr.
No
Slum name Notified Land
Ownership
Population
(2011)
No of
Households
(2011)
1 Ambedkar Nagar Stay Private 4677 1015
2 Bangar Nagar Y Private 2284 574
3 Giri Nagar Y Private 721 167
4 Godown Phail Y Private 2844 635
5 Indira Nagar Y Govt.
owned
3145 640
6 Kumbhar Pura Y Govt.
owned
2410 452
7 Malipura Y Private 3670 820
8 Netaji Nagar Y Govt.
owned 2754 575
9 Patipura Dorli pura Y Govt.
owned 2409 564
10 Ravidas Nagar Y Govt.
owned 1118 254
11 Santaji Nagar Y Private 702 184
12 Seva Nagar Y Govt.
owned
1119 363
13 Shinde Nagar Y Private 1888 419
14 Talav Phail - I Y Govt.
owned 3488 773
15 Tarpura Y Govt.
owned 2969 600
16 Thakur Plot Y Private 1151 275
17 Talav Phail - II Y Govt.
owned
2195 484
18 Lokhande Plot Y Private 747 180
19 Vanjari Phail Y Private 1759 425
20 Pimpal Gaon N Govt.
owned 1790 424
21 Amrai Pura N Govt.
owned 274 70
22 Gautam Nagar N Private 390 85
23 Kamgar Nagar N Govt.
owned 350 78
24 Rohile Baba Math N Govt.
owned 202 34
25 Vaghapur Nakka N Govt.
owned 132 18
26 Rajratan Nagar N Private 226 46
27 Amba Nagar Y Govt.
owned
253 59
Total 45667 10213
Source: Yavatmal Municipal Council

41 | P a g e
Annex 2: Capital income and expenditure towards urban poor (Rs in Crore)
Urban Poor 2005-06
(Actuals)
2006-07
(Actuals)
2007-08
(Actuals)
2008-09
(Actuals)
2009-10
(Actuals)
2010-11
(Budgeted)
2011-12
(Budgeted)
Capital Income
Dalit community
development plan 0.88 1.25 1.08 0.65 0.13 0.25 0.50
Minority
community 0.11 0.00 0.00 0.00 0.15 0.15 0.15
Akhsay nagri funds 0.00 0.00 0.00 0.00 0.00 0.00 0.00
Slum area
improvement fund 0.00 0.00 0.00 0.00 1.06 0.12 0.00
IHSDP Grant 0.00 0.00 0.00 0.00 4.15 0.00 0.00
IHSDP other
contribution 0.00 0.00 0.00 0.00 0.02 0.00 0.00
Total 0.99 1.25 1.09 0.65 5.52 0.52 0.65
% of total 36.77 19.61 42.93 18.73 42.85 8.42 10.44
Capital Expenditure
5 % funds for urban
poor 0.00 0.00 0.00 0.00 0.07 0.35 0.35
Minority
community
development 0.00 0.00 0.00 0.00 0.13 0.20 0.15
Dalit community
area improvement
fund 0.90 0.37 0.88 2.27 0.76 0.70 0.60
Community
development fund 0.04 0.02 0.00 0.00 0.03 0.03 0.00
Slum development
fund 0.00 0.00 0.00 0.00 0.09 0.80 0.30
IHSDP 0.00 0.00 0.00 0.00 0.00 2.15 2.20
Total 0.94 0.39 0.89 2.27 1.07 4.23 3.60
Source: (Budget books of Yavatmal Municipal council, 2005 - 06 to 2011 - 12)

42 | P a g e
Annex 3: Slum settlement wise no of functional & non functional toilet facilities
Sr.
No Slum name
Notified
(Yes/
No)
Population
(2011)
No of
HHs
No of Seats in Public
toilet
No of
seats
in
pay
& use
toilet
Total No.
of seats
(PT+P&U
)
Functiona
l seats out
of Total
No. of
seats
(PT+P&U)
Functional
Non-
Functiona
l
1 Amba Nagar Y 253 59 0 0 0 0 0
2 Ambedkar
Nagar Stay 4677 1015 0 0 0 0 0
3 Bangar Nagar Y 2284 574 5 0 0 5 5
4 Giri Nagar Y 721 167 0 0 0 0 0
5 Godown Phail Y 2844 635 5 5 0 10 5
6 Indira Nagar Y 3145 640 0 0 10 10 10
7 Kumbhar Pura Y 2410 452 15 12 0 27 15
8 Lokhande Plot Y 747 180 0 0 0 0 0
9 Malipura Y 3670 820 10 10 0 20 10
1
0 Netaji Nagar Y 2754 575 0 0 0 0 0
1
1
Patipura Dorli
pura Y 2409 564 14 14 64 92 78
1
2 Ravidas Nagar Y 1118 254 0 0 16 16 16
1
3 Santaji Nagar Y 702 184 0 0 0 0 0
1
4 Seva Nagar Y 1119 363 0 0 19 19 19
1
5 Shinde Nagar Y 1888 419 19 19 10 48 29
1
6 Talav Phail - I Y 3488 773 0 10 20 30 20
1
7 Talav Phail - II Y 2195 484 0 0 40 40 40
1
8 Tarpura Y 2969 600 0 0 10 10 10
1
9 Thakur Plot Y 1151 275 0 0 0 0 0
2
0 Vanjari Phail Y 1759 425 12 13 37 62 49
2
1 Amrai Pura N 274 70 10 9 20 39 30
2
2 Gautam Nagar N 390 85 0 0 0 0 0
2
3 Kamgar Nagar N 350 78 0 0 0 0 0
2
4 Pimpal Gaon N 1790 424 5 5 19 29 24
2
5 Rajratan Nagar N 226 46 0 0 0 0 0
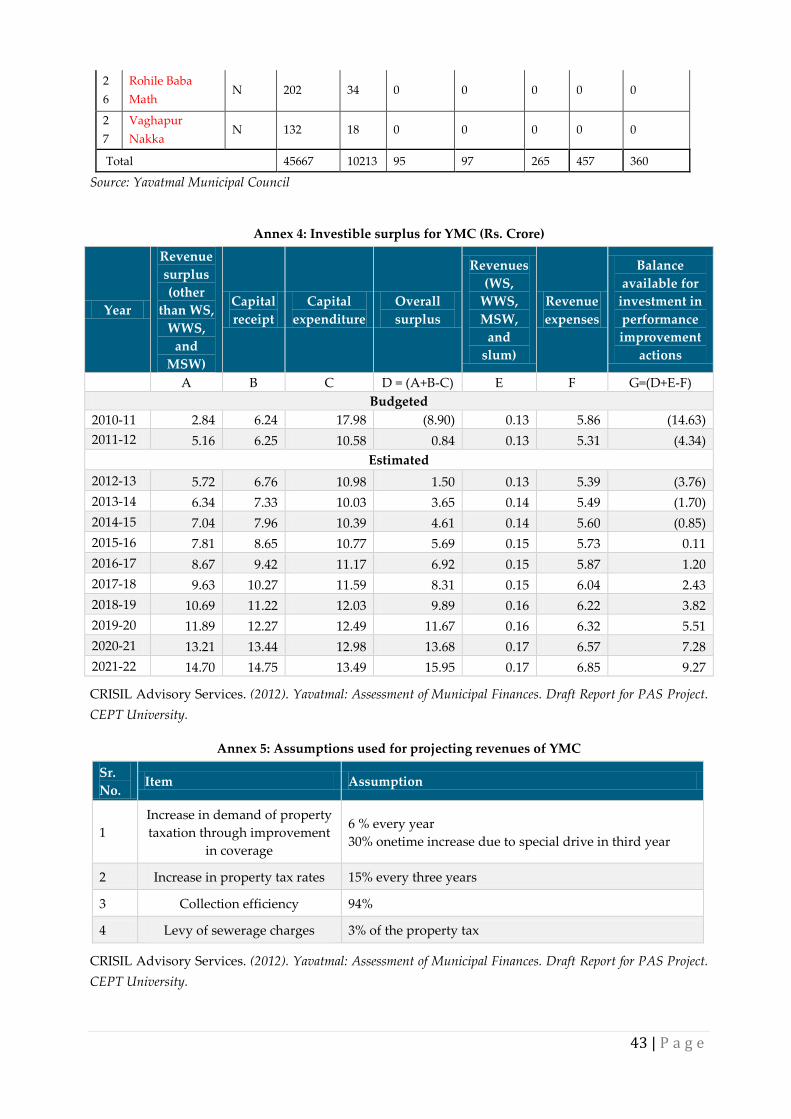
43 | P a g e
2
6
Rohile Baba
Math N 202 34 0 0 0 0 0
2
7
Vaghapur
Nakka N 132 18 0 0 0 0 0
Total 45667 10213 95 97 265 457 360
Source: Yavatmal Municipal Council
Annex 4: Investible surplus for YMC (Rs. Crore)
Year
Revenue
surplus
(other
than WS,
WWS,
and
MSW)
Capital
receipt
Capital
expenditure
Overall
surplus
Revenues
(WS,
WWS,
MSW,
and
slum)
Revenue
expenses
Balance
available for
investment in
performance
improvement
actions
A B C D = (A+B-C) E F G=(D+E-F)
Budgeted
2010-11 2.84 6.24 17.98 (8.90) 0.13 5.86 (14.63)
2011-12 5.16 6.25 10.58 0.84 0.13 5.31 (4.34)
Estimated
2012-13 5.72 6.76 10.98 1.50 0.13 5.39 (3.76)
2013-14 6.34 7.33 10.03 3.65 0.14 5.49 (1.70)
2014-15 7.04 7.96 10.39 4.61 0.14 5.60 (0.85)
2015-16 7.81 8.65 10.77 5.69 0.15 5.73 0.11
2016-17 8.67 9.42 11.17 6.92 0.15 5.87 1.20
2017-18 9.63 10.27 11.59 8.31 0.15 6.04 2.43
2018-19 10.69 11.22 12.03 9.89 0.16 6.22 3.82
2019-20 11.89 12.27 12.49 11.67 0.16 6.32 5.51
2020-21 13.21 13.44 12.98 13.68 0.17 6.57 7.28
2021-22 14.70 14.75 13.49 15.95 0.17 6.85 9.27
CRISIL Advisory Services. (2012). Yavatmal: Assessment of Municipal Finances. Draft Report for PAS Project.
CEPT University.
Annex 5: Assumptions used for projecting revenues of YMC
Sr.
No. Item Assumption
1
Increase in demand of property
taxation through improvement
in coverage
6 % every year
30% onetime increase due to special drive in third year
2 Increase in property tax rates 15% every three years
3 Collection efficiency 94%
4 Levy of sewerage charges 3% of the property tax
CRISIL Advisory Services. (2012). Yavatmal: Assessment of Municipal Finances. Draft Report for PAS Project.
CEPT University.

44 | P a g e
Annex 6: Investible surplus after revenue enhancement measures (Rs. Crore)
Year
Balance available for
investment in
performance
improvement actions
Increment due to
increase in demand of
property taxation
Increment due to
Levy of Sewerage
Charges
Investible
surplus after
revenue
augmentation
measures
Budgeted
2010-11 (14.63) - - (14.63)
2011-12 (4.34) - - (4.34)
Estimated
2012-13 (3.76) 0.27 0.05 (3.44)
2013-14 (1.70) 0.33 0.06 (1.32)
2014-15 (0.85) 0.83 0.08 0.05
2015-16 0.11 1.30 0.09 1.50
2016-17 1.20 1.42 0.10 2.72
2017-18 2.43 1.56 0.10 4.09
2018-19 3.82 2.22 0.13 6.16
2019-20 5.51 2.40 0.13 8.04
2020-21 7.28 2.60 0.14 10.02
2021-22 9.27 3.52 0.17 12.96
CRISIL Advisory Services. (2012). Yavatmal: Assessment of Municipal Finances. Draft Report for PAS Project.
CEPT University.

The Performance Assessment System (PAS) Project
The PAS Project aims to develop appropriate methods and tools to measure, monitor and improve
delivery of water and sanitation in cities and towns in India. The PAS Project includes three major
components of performance measurement, performance monitoring and performance
improvement. It covers all the 400+ urban local governments in Gujarat and Maharashtra.
CEPT University has received a grant from the Bill and Melinda Gates Foundation for the PAS
Project. It is being implemented by CEPT University with support of Urban Management Centre
(UMC) in Gujarat and All India Institute of Local Self-Government (AIILSG) in Maharashtra.
PAS Project
CEPT University
Kasturbhai Lalbhai Campus, University Road, Navrangpura, Ahmedabad 380 009 Gujarat, India
Tel: +91-79-26302470
Fax: +91-79-26302075
www.pas.org.in
All India Institute of Local Self-Government
M.N. Roy Human Development Campus, Plot No.6, F-Block, Bandra Kurla Complex
Bandra (East), Mumbai - 400 051, Maharashtra, India
Tel: +91-22-26571713/14/15
Fax: +91-22-2657 2286
www.aiilsg.org
CEPT-AIILSG team would like to acknowledge the support provided by Yavatmal Municipal Council for this document. The team is
especially grateful to the Chief Officer Mr. Rajendra Mohite, Mr. Devardaji (Admin head), Mr. Bhoyar (Engg in MJP), Mr.
Palaskar, Mr. Joshi, Ms. Shilpa (SI,), Mr. Liladhar (community organiser) and other staff members of YMC & MJP who have
assisted us in the PIP exercise.