PREPARATION OF HIGHLY REFLECTIVE FILMS BY …
78
PREPARATION OF HIGHLY REFLECTIVE FILMS BY SUPERCRITICAL INFUSION OF A SILVER ADDITIVE INTO POLY (ETHER ETHER KETONE) Negin Nazem Thesis submitted to the Faculty of the Virginia Polytechnic Institute and State University in partial fulfillment of the requirements for the degree of Master of Science in Chemical Engineering Larry T. Taylor, Chair Eva Marand Richey M. Davis October 3, 1997 Blacksburg, Virginia Keywords: Supercritical Fluid, Supercritical Fluid Infusion, Silver, Reflectivity, Poly (Ether Ether Ketone) Copyright 1997
Transcript of PREPARATION OF HIGHLY REFLECTIVE FILMS BY …

PREPARATION OF HIGHLY REFLECTIVE FILMS BY
SUPERCRITICAL INFUSION OF A SILVER ADDITIVE INTO POLY
(ETHER ETHER KETONE)
Negin Nazem
Thesis submitted to the Faculty of the Virginia Polytechnic Institute and State University in partial
fulfillment of the requirements for the degree of
Master of Science
in
Chemical Engineering
Larry T. Taylor, Chair
Eva Marand
Richey M. Davis
October 3, 1997
Blacksburg, Virginia
Keywords: Supercritical Fluid, Supercritical Fluid Infusion, Silver, Reflectivity,
Poly (Ether Ether Ketone)
Copyright 1997
PREPARATION OF HIGHLY REFLECTIVE FILMS BY
SUPERCRITICAL INFUSION OF A SILVER ADDITIVE INTO POLY
(ETHER ETHER KETONE)
Negin Nazem
(ABSTRACT)
There has been a great interest in preparing polymeric reflective surfaces in the last few
years. The application of supercritical fluid technology in this area is beginning to receive a great
deal of attention. Poly ether ether ketone (PEEK) is well known for its excellent thermal,
chemical, mechanical and electrical properties. These properties make it ideal for use in aerospace,
electrical, fluid handling and coating industries. Supercritical infusion of a silver–containing
additive (1,5-cyclooctadiene- 1,1,1,5,5,5-hexafluoroacetylacetonato)silver(Ι) into a PEEK film
was achieved with moderately high density CO2 at various temperatures, pressures, and times.
During the infusion process: 1) polymer sample was exposed to both supercritical CO2 and the
additive under pressure for a brief time, 2) depressurization of the system caused the CO2 to
rapidly diffuse out of the polymer; while the remaining additive in the polymer desorbed at a much
slower rate governed by its diffusivity in the CO2-free polymer. Following this process the
infused film was heated for a short time period to thermally reduce the infused metal and to form
a reflective surface. In this research the effect of different additive concentrations, infusion
conditions (e.g. temperature, pressure, time), and curing conditions (e.g. air flow rate,
temperature, time) on the nature of the PEEK surface will be presented.

III
This Thesis is dedicated
to my mom, dad, Nikoo
and
Mehdi

IV
ACKNOWLEDGMENT
There are many people to thank and acknowledge, and each one has helped make this
achievement possible. I would like to thank Dr. Larry Taylor for his kindness, patience and
encouragement. Dr. Adley Forti Rubira for his guidance during this research. Dr. Eva Marand and
Dr. Richey M. Davis for serving on my committee. The assistance of Frank C. Cromer and
Stephen McCartney and Kermit Kwan is also appreciated. And finally I would like to thank
NASA Langley Research Center for obtaining reflectivity measurements, Applied Separations for
donating supercritical infusion system and Air Products and Chemicals Inc. for providing
supercritical CO2.

V
TABLE OF CONTENTS
ABSTRACT...................................................................................................................II
DEDICATION..............................................................................................................III
ACKNOWLEDGMENTS............................................................................................IV
TABLE OF CONTENTS..............................................................................................V
LIST OF FIGURES....................................................................................................VII
LIST OF TABLES.......................................................................................................IX
1. INTRODUCTION..................................................................................................... 1
2. HISTORICAL BACKGROUND.............................................................................. 3
3. EXPERIMENTAL....................................................................................................11
3.1 - Materials............................................................................................................... 11
3.1.1. Polymer Film.................................................................................................... 11
3.1.2. Additive ........................................................................................................... 11
3.2 - Instrumentation..................................................................................................... 11
3.3 - Supercritical Fluid Infusion and Cure Procedure.................................................... 11
3.4 – Characterization ................................................................................................... 14
3.4.1. X-Ray Photoelectron Spectroscopy (XPS) ....................................................... 14
3.4.2. Transmission Electron Microscopy (TEM) ....................................................... 14

VI
3.4.3. Scanning Electron Microscopy (SEM).............................................................. 14
3.4.4. Auger Electron Spectroscopy (AES) ................................................................ 15
3.4.5. Thermogravimetric Analysis (TGA).................................................................. 15
3.4.6. Reflectivity Measurements................................................................................ 15
4. RESULTS AND DISCUSSION................................................................................16
4.1 – Preliminary ........................................................................................................... 16
4.2 - General Characterization ...................................................................................... 16
4.2.1. Basic Considerations in Light Scattering Theory...............................................17
4.3 – PEEK in the Presence of Supercritical CO2 ........................................................... 18
4.4 - Synthesis of the Metalized Film ............................................................................. 18
4.5 - Surface Analysis of the Films................................................................................. 21
4.5.1- Effect of Cure Air Flow Rate ........................................................................... 35
4.5.1.1- Mass Transfer During the Cure Process.......................................................35
4.5.2 – Effect of Cure Temperature and Time............................................................. 38
4.6 – Thermal Analysis of the Film ............................................................................... 61
4. CONCLUSIONS......................................................................................................63
REFERENCES............................................................................................................65
Vita...............................................................................................................................69

VII
LIST OF FIGURES
Figure 1: Chemical structure of selected polymers ........................................................... 8
Figure 2: Molecular structure of PEEK and additive used in this study............................12
Figure 3: Applied Separations SFE Spe-ed......................................................................13
Figure 4: Surface silver atomic concentration versus: (A) infusion temperature, (B) % additive,
(C)infusiontime........................................................................................................26
Figure 5: Angel of incidence (i).......................................................................................27
Figure 6: % Reflectivity versus surface silver atomic concentration at 20°.......................29
Figure 7: XPS profile of infused and cured sample before being dipped in acetone..........32
Figure 8: XPS profile of infused and cured sample which had been dipped in acetone after cure
............................................................................................................................... 33
Figure 9: Scanning electron microscopy (SEM) of silver - infused PEEK which was cured at
225°C/120min/100 SCFH ....................................................................................... 42
Figure 10-A: Transmission electron microscopy (TEM) of silver - infused PEEK which was cured
at 225°C/120min/100 SCFH (magnification: 187,500x)........................................... 43
Figure 10-B: Transmission electron microscopy (TEM) of silver - infused PEEK which was cured
at 225°C/120min/100 SCFH (magnification: 67,000x)............... ..............................44
Figure 11: Carbon (C1s): (A) photoelectron spectrum, (B) curve resolved for non infused PEEK
............................................................................................................................... 45
Figure 12: Oxygen (O1s): (A) photoelectron spectrum, (B) curve resolved for non infused PEEK
............................................................................................................................... 46
Figure 13: XPS profile of infused film which was cured at 225°C/120min/100 SCFH ... 48
Figure 14: Carbon (C1s): (A) photoelectron spectrum, (B) curve resolved for infused and cured
PEEK ..................................................................................................................... 49

VIII
Figure 15: Oxygen (O1s): (A) photoelectron spectrum, (B) curve resolved for infused and cured
PEEK ..................................................................................................................... 50
Figure 16: Fluorine (F1s): (A) photoelectron spectrum, (B) curve resolved for infused and cured
PEEK ..................................................................................................................... 51
Figure 17: Silver (Ag 3d) photoelectron spectrum ......................................................... 52
Figure 18: Silver (Ag 3d) Auger spectrum..................................................................... 53
Figure 19: Depth profiling via Auger electron microscopy (AES) of infused film which was cured
at 225°C/120min/100 SCFH ................................................................................... 54
Figure 20-A: Transmission electron spectroscopy (TEM) of silver - infused film which was cured
at 250°C/60min/100 SCFH ( magnification: 187,500x)............................................ 57
Figure 20-B: Transmission electron spectroscopy (TEM) of silver - infused film which was cured
at 250°C/60min/100 SCFH ( magnification: 67,000x) ............................................. 58
Figure 21: Scanning electron microscopy (SEM) of silver - infused film which was cured at
250°C/60min/100 SCFH ......................................................................................... 59
Figure 22: Oxygen (O1s): (A) photoelectron spectrum, (B) curve resolved for infused film which
was cured at 250°C/60min/100 SCFH..................................................................... 60
Figure 23: Thermogravimetry analysis (TGA) of infused film which was cured at
225°C/120min/100 SCFH ....................................................................................... 62

IX
LIST OF TABLES
Table 1: Mass Change For PEEK Film Upon Extraction with Supercritical CO2 and Then
Decompression.........................................................................................................19
Table 2: Supercritical infusion conditions and appearance of the PEEK with 20wt.%
[Ag(COD)HFA]2.............................................................. ...................................... 20
Table 3: Supercritical infusion conditions and appearance of the PEEK with 10wt.%
[Ag(COD)HFA]2................................................................ .................................... 22
Table 4: Supercritical infusion conditions and appearance of the PEEK with 5wt.%
[Ag(COD)HFA]2................................................................ .................................... 23
Table 5: Atomic concentrations of selected elements via XPS of infused/cured metalized reflective
films........................................................................................................................ 24
Table 6: Percent reflectivity of selected silver infused/cured PEEK films........................ 28
Table 7: Atomic concentrations (XPS) of infused/cured PEEK/silver films as a function of order
of treatment..............................................................................................................31
Table 8: Percent reflectivity of infused/cured PEEK/silver films as a function of order of wash
treatment..................................................................................................................34
Table 9 : Atomic concentrations (XPS) and percent reflectivity of selected elements comparing
different air flow rates during cure cycle................................................................. .36
Table 10: Atomic concentrations (XPS) and percent reflectivity of selected elements at fixed cure
temperature and different times.......................................... ..................................... 39
Table 11: Atomic concentration (XPS) and percent reflectivity of selected elements at fixed cure
temperature and different times.......................................... ..................................... 40
Table 12: Atomic concentration (XPS) and percent reflectivity of selected elements at fixed cure
temperature and different times.......................................... ..................................... 56

1
1. Introduction
The unique characteristics of supercritical fluids have been known since 18221.
Supercritical fluids have received a great deal of attention in a number of important scientific
fields2-15. There are several reasons for choosing a supercritical fluid over a conventional solvent16
such as 1) more favorable mass transport properties6, and 2) easier adjustment of the chemical
potential of the system by changing the pressure and/or temperature14. One can therefore access a
significant range of physicochemical properties (density, diffusivity, viscosity, dielectric constant,
etc.) without passing through a phase boundary, such as changing from gas to liquid. In other
words, a supercritical fluid can be considered a continuously adjustable solvent.
A supercritical fluid can be defined as any substance that is above its critical temperature
and pressure, such that no distinct liquid or gas phase can exist. Supercritical fluids have high
diffusivity and low viscosity compared to their corresponding liquid state, thus allowing rapid
mass transport and enhanced matrix penetration. Fluid density which often is a measure of
solvating power is related to temperature and pressure. The most common supercritical fluid is
CO2 because of its moderate critical pressure and temperature (PC = 73 atm, TC =31°C), inertness,
non-toxicity, and wide availability in pure form.
The potential of supercritical fluid (SCF) technology for polymer processing is being
realized in areas ranging from extraction and synthesis to the preparation of new composite
materials. The range of polymer properties which have been attained over the years has been
continually extended. Polymers today are used for everything from catalyst to adhesives17. The
utilization of a polymer in a specific application is redominantly based upon the polymer’s
chemical and physical properties. The high diffusivity of supercritical carbon dioxide in many solid
polymers, for example has implications in polymer modification. A sampling of these studies
includes: 1) polymer controlled precipitation18, 2) polymer fractionation19, 3) polymer
plasticization20, and 4) medium for polymer synthesis21. Swelling of many polymers in
supercritical CO2 suggests a high permeation rate of CO2.

2
There is a great interest in obtaining materials having a surface layer of metal. Some uses
for these materials are for optical and structural conductive purposes; while, others are intended
for electrical and magnetic applications22. Traditionally metal-coated polymers have been achieved
by a variety of external processes such as chemical vapor deposition, lammination, and sputter
technology23. The work described here will demonstrate the preparation of a highly reflective
metal coated poly(ether ether ketone) film by supercritical infusion of a silver additive. The effect
of different additive concentrations, infusion conditions, and curing conditions on the metallized
surface of PEEK will be studied.

3
2. Historical Background
Few reports have discussed the use of supercritical fluids to infuse a substance into a
matrix such as a polymer24. The additive must dissolve in carbon dioxide first. The basis of this
process is to expose a polymer sample to an additive substance and CO2 under high pressure. The
additive carried by the CO2 rapidly diffuses into the polymer. When the CO2 pressure is released,
the gas rapidly diffuses out of the polymer, sharply reducing the additive diffusivity; the additive
would then be left in the polymer to desorb at a slow rate governed by its diffusivity in the CO2-
free polymer. The terms “CO2- assisted impregnation “or simply “ infusion” for brevity is often
used in referring to this process.
Berens24 and Sand25 demonstrated in 1986 that polymer substrates could be impregnated
by swelling the polymer with a solution of penetrant in CO2 followed by rapid venting of the
supercritical solution. A variety of polymers (e.g. poly(vinyl chloride), polycarbonate,
poly(methylmethacrylate), poly(vinyl acetate)) and additives such as dimethyl phthalate, octane,
n-butanol, and naphthalene were used in this study. The penetrant having lower diffusivity than
gaseous CO2 was retained by the polymer. The amount of penetrant absorbed was determined
from the weight change of sample after most of the CO2 had escaped. Chemical reactions may be
carried out in the swollen solid polymer substrate or the CO2 may only function as an aid whereby
the physical properties of the polymer are regained after processing. This approach has obvious
advantages over liquid solvent infusion which may be time consuming and where potentially toxic,
residual solvent may be left in the product. Although supercritical infusion (or impregnation) has
only been studied in a very limited fashion, both organic and organometallic penetrants have been
explored. Berens found that CO2 accelerated the absorption of many low molecular weight
additives into a number of polymers. The infusion process may also be described as a partitioning
of the additive between the CO2-and polymer-rich phases. Consequently, the relative solubility of
the additive in both the CO2 and in the polymer is a major factor governing the amount of additive
absorbed. Poly(vinyl chloride) (PVC) with dimethyl phthalate has been used to explore the effects
of supercritical CO2 on the transport kinetics and equilibria of an additive in a glassy polymer24.

4
In another study26, poly(ethylene glycol) diacrylate and 4,4’-dichlorobenzophenone were
infused into polycarbonate in the presence of CO2. Following depressurization and removal from
the autoclave, UV radiation initiated a reaction that consumed ~25% of the acrylate residue. It
was shown that by controlling the infusion time one could control the amount of acrylate residue
which was consumed. For example, the time of infusion could be designed in such a way that only
1% of the acrylate residue was consumed.
Watkins and McCarthy27 have modified solid organic polymers by carrying out chemical
reactions within supercritical fluid - swollen solid polymer substrates. The reactions can be run
either in the presence of the supercritical fluid solution or subsequent to removal of the solution
by depressurization. One illustrative study involved the infusion of CO2 solutions of styrene into a
variety of polymer substrates where thermally initiated radical polymerization within the swollen
substrate generated polystyrene- substrate polymer blends. The advantages of supercritical fluids
as reaction media for this study were: 1) they increased (significantly) diffusion rates of penetrants
in solid polymers; 2) the solvent strength could be adjusted over wide ranges by manipulating
temperature and pressure; therefore the degree of swelling and the partitioning of reagents
between the swollen polymer matrix and the supercritical fluid solution were controllable; 3)
since common supercritical fluid solvents are gases at atmospheric pressure; the solvent rapidly
dissipated upon release of pressure thus trapping penetrants in the polymer substrate.
CO2- assisted impregnation of fragrances and pharmaceuticals in thermoplastic polymers
such as poly(ethylene) and poly(propylene) has also been disclosed25. The thermoplastic polymer
was impregnated by 1) dissolving an impregnation material such as a fragrance or pharmaceutical
material in a near critical or supercritical fluid and 2) reducing the pressure so that the critical fluid
agent diffuses out of the thermoplastic polymer. The amount of fragrance or pharmaceutical
material in the thermoplastic polymer was controlled by the concentration of impregnation
material in the critical liquid.
It has been shown via Fourier transform infrared spectroscopy that polymers possessing
electron donating functional groups exhibit specific molecular interactions with CO2, most

5
probably of a Lewis acid-base nature28. The evidence for interaction was the observation of the
splitting of the band corresponding to the CO2 bending mode. This splitting was not observed
with polymers such as polyethylene and polystyrene which lacked electron-donating functional
groups. A series of polymer films, such as polyesters, poly(vinyl methyl ketone), and poly(2-vinyl
pyridine) exhibited the splitting suggested. Higher solubility of CO2 into the polymer could be
correlated with the CO2 band splitting. These results suggested that CO2 might act as an electron
acceptor rather than an electron donor.
Supercritical fluid infusion has been demonstrated with organometallics29 by infusion of
polyethylene with CP*Ir(CO)2 where CP* = η5- C5(CH3)5 via supercritical CO2. Infusion attempts
also employed CO2 saturated with a fluoroalcohol. The infused polyethylene provided a new
opportunity for investigating the equilibrium process by matrix isolation / FT-IR. In this study the
photochemical C-H activation of polyethylene by CP*Ir(CO2) and CP*Ir(CO2)…HORF were
compared. Clearly, the impregnation of other organometallic compounds into polymers offers
considerable possibilities for the modification or tailoring of specific polymer properties.
The feasibility of using supercritical fluids to impregnate a variety of carbon/carbon
composites (as opposed to polymers) with a ceramic precursor has been successfully
demonstrated30. Polycarbosilane and polysilane were employed as silicon carbide precursors. The
apparent carbon/carbon porosity varied from 4% to 85% . The conditions required to dissolve,
transport, and precipitate the ceramic precursors were not provided. Significant improvements in
oxidative resistance and mechanical properties were measured. Supercritical fluid fractionation of
the ceramic precursors was demonstrated as a means whereby to control physical properties and
char yield of the composite.
The synthesis of polymer/metal composites containing isolated metal nanoclusters
distributed homogeneously through a polymeric substrate was recently reported31. A platinum
organometallic precursor, (1,5- cyclooctadiene) dimethylplatinum(Π), (COD)Pt(CH3)2, was
dissolved in supercritical CO2 and infused into both solid poly(4-methyl-1-pentene) (PMP) and
poly(tetrafluorethylene) (PTFE). Reduction to platinum metal followed infusion by either

6
hydrogenolysis before (4hr.) or after (24hr.) decompression or by thermolysis (20hr.) in CO2 by
raising the temperature to 140°C prior to decompression. Regardless of the post-infusion
treatment, dark- colored composites were produced that contained platinum clusters with a
maximum particle diameter of 15 nm. Uniform distribution of platinum clusters throughout both
films was reported. A significant amount of platinum metal was also deposited at the PTFE
surface. The effect of different infusion conditions on metal distribution was not investigated.
The placement of thin metal films on a solid inorganic surface via supercritical fluid
transport of organometallic precursors has also been demonstrated32. In this process, precursor
reagent(s) (e.g. Al(HFA)3, Cr(acac)3, In(acac)3) were dissolved in a supercritical fluid (e.g.
pentane, acetone, CO2) and then this solution, under high pressure, was passed through the
restrictor into a deposition chamber where the rapid expansion of super- critical fluid caused
vaporization of the solute(s). The vaporized precursor compounds were then induced to react at
or near a substrate surface (usually Si or SiO2) to form a thin film. Unfortunately the
decomposition temperature of the precursor (600-800°C) was well above the decomposition
temperature of most polymers thus resulting in polymer degradation prior to metal reduction.
Boggess et al. have studied the infusion of a silver complex into both poly(amide acid) and
fully cured polyimide films using supercritical CO2. Optimal conditions for the production of a
reflecting film were established33 as 110°C/5000psi/120min for infusion and 100°C/60min/30
SCFH for cure process . The polyimide on which this feasibility was demonstrated was derived
from 3,3’,4,4’- benzophenonetetracarboxylic acid dianhydride (BTDA) and 4,4’- oxydianiline
(ODA). Supercritical fluid infusion of the (1,5-cyclooctadiene-1,1,1,5,5,5-hexafluoroacetonate)
silver(Ι), [Ag(COD)HFA]2 was into the fully cured BTDA-ODA polyimide. Thermal treatment of
the infused film resulted in a reflective silver surface. The infused film showed no apparent
change in texture or color, and only a slight change in mass was observed relative to the polyimide
before infusion. Thus, supercritical CO2 was believed to penetrate the polyimide but little CO2
remained when the pressure was reduced to one atmosphere.

7
Later on, this process was expanded to a number of polyimides such as PMDA-ODA,
6FDA-ABP, ODPA-DABP (Figure 1) to see whether a reflective surface could be formed using
the silver complex34. It was interesting that not all of the polyimides after infusion with the silver
additive and subsequent heating gave rise to a reflective surface. The explanation of failure to
form a reflective surface on some polyimides such as 6FDA-ABP stated to result from lack of a
ketonic carbonyl oxygen in the polymer. Combinations of several other dianhydride-diamine pairs
were studied in order to further test the suggestion that a ketonic carbonyl group was necessary
for the formation of a reflective surface. Each polyimide with a ketonic carbonyl group in the
dianhydride and or the diamine formed a reflective silver surface; while if no ketonic group were
present no reflective surface was forthcoming. Also, this study determined that the infusion
process was not unique to supercritical CO2 since a reflective film could be obtained via using
supercritical CHF3 as the carrier of the silver complex.
The feasibility for preparation of novel thin silver films on a variety of polymer substrates
such as polycarbonate(PC), polysulfone(PS) and polymethylmethacrylate (PMMA) via
supercritical infusion of a silver precursor under relatively mild conditions has been reported35.
Resulting films were (a) reflective, (b) maintained their flexible nature and (c) had a surface
resistance higher than 1011 ohms in spite of their metallic appearance. It was determined that silver
infused PS films could be either reflective or conductive just by controlling the temperature of the
thermal treatment. Temperatures above the PS glass transition temperature (Tg) resulted in low
surface electrical resistance (~3-20Ω); while a reflective surface formed at cure temperatures
below the PS glass transition temperature . Chemical structures for some of these polymers are
shown in Figure 1.
The objective of this M.S. thesis was to extend this silver-mirror technology to additional
polymer films via supercritical fluid infusion of a silver precursor under relatively mild conditions.
The polymer on which this feasibility has been conducted is poly(ether ether ketone), (PEEK).
Depending on the additive concentration, infusion conditions (e.g. temperature, pressure
and time), and curing conditions (e.g. temperature and time), silver surface films with varied

8
Figure 1: Chemical structure of some polymers
O
N
O
O
N
O
O
n
S
O
O
BTDA/DDSO2
N
O
O
N
O
O O
n
PMDA/DABP
n
O
ON
O
O
N
O
O
N
O
O
N
O
OOO
n
ODPA/DABP
BTDA/ODA

9
PC
Figure 1: Chemical structure of some polymers
CF3
CF3
O
N
O
O
N
O
O
n
6FDA/DABP
O
O C O
CH3
CH3
S
O
n
PS
CF3
N
O
O
N
O
O
CF3
O O
n
6FDA/APB
C O C
OCH3
CH3
n
O

10
reflectivity were produced. The nature of the silver and its distribution within the polymer and on
the surface of the film were obtained via microscopy and surface analysis techniques such as x-ray
photoelectron spectroscopy (XPS), transmission electron microscopy (TEM), scanning electron
microscopy (SEM) and auger electron spectroscopy (AES). In addition, thermogravimetric
analyses (TGA) and reflectivity measurements were conducted. The application of this work is in
the space where large area antennas and reflectors desirable.

11
3. Experimental
3.1 - Materials
3.1.1. Polymer Film
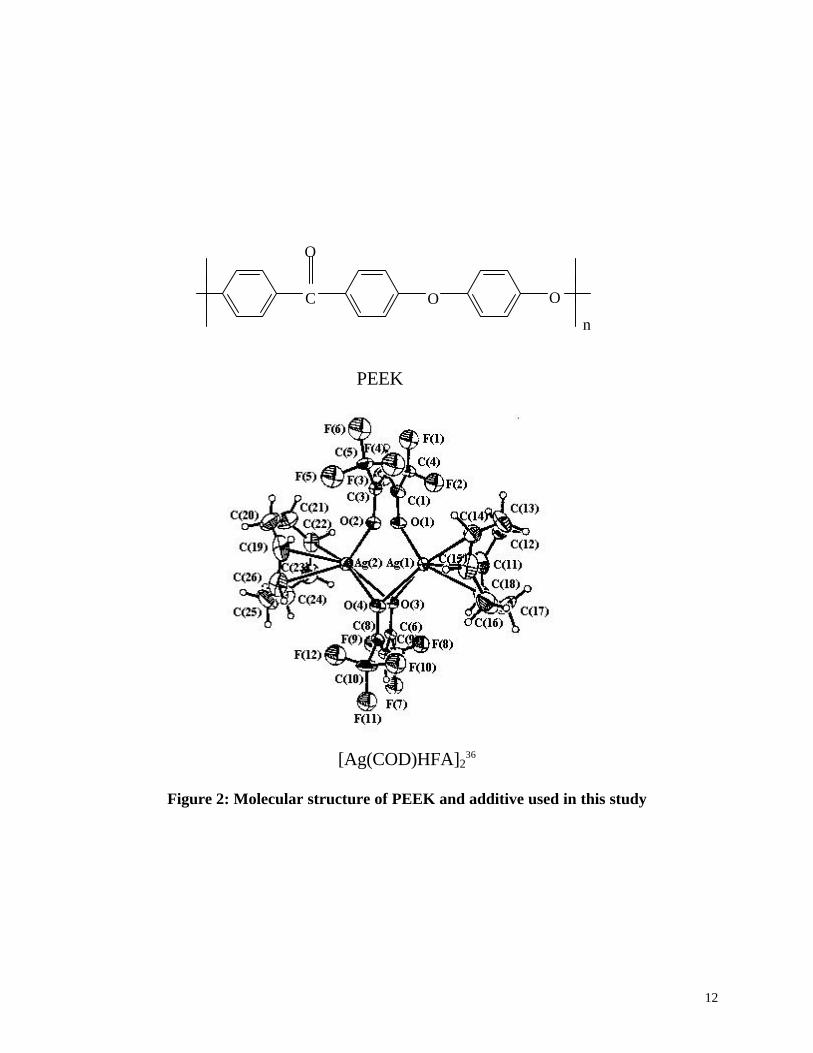
Poly(etheretherketone), PEEK, film was obtained from McMASTER-CARR supply
company (Dayton, NJ.) and used as received (Figure 2). The thickness of the film was 0.003″. It
had a smooth surface on one side and a much rougher surface on the other film side. PEEK has
been described as a tough, semi crystalline thermoplastic. The common grade of PEEK is ca 35%
crystalline and has a density of 1.32 g/ml. PEEK is an inert polymer under normal storage
conditions.
3.1.2. Additive
The additive (1,5-cyclooctadiene-1,1,1,5,5,5-hexafluoroacetonato)silver(Ι),
[Ag(COD)HFA]2, was obtained from Aldrich Chemical Company (Milwaukee, WI.) and was used
as received (Figure 2). It has a boiling point of 200°C and a melting point of 122-124°C.
3.2 - Instrumentation
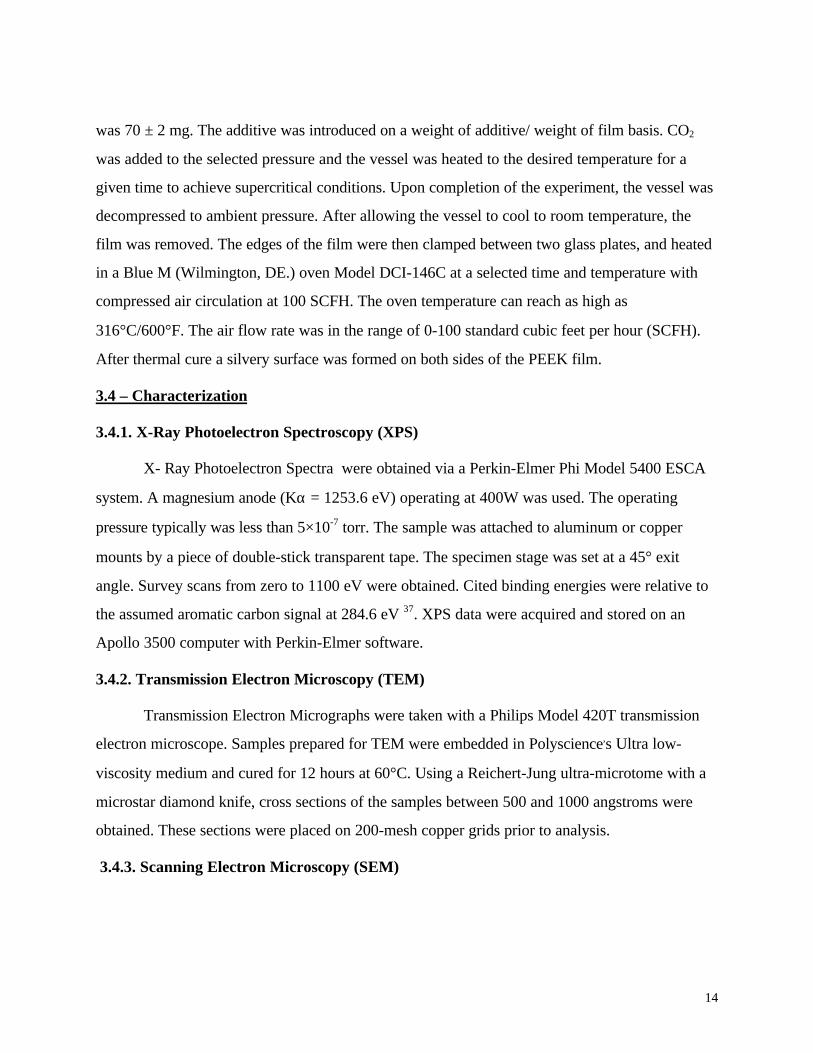
All supercritical fluid infusion (SFI) experiments were performed using an Applied
Separations (Allentown, PA.) supercritical fluid system (Spe-ed SFE) equipped with an air-driven
piston pump to achieve a maximum pressure of 10,000 psi (Figure 3). The oven module of the
Spe-ed SFE can reach temperatures as high as 250°C. A 10 ml stainless steel supercritical fluid
extraction vessel (Keystone Scientific, Bellefonte, PA.) was used for each infusion. Following
each infusion experiment, the vessel was returned to ambient conditions by releasing pressure
through a heated valve. All infusion experiments were performed using SFE/SFC grade CO2 (Air
Products and Chemicals Inc., Allentown, PA.) padded with 2000 psi of helium.
3.3 - Supercritical Fluid Infusion and Cure Procedure
The film and the additive were placed together in the vessel. The average weight of film
12
[Ag(COD)HFA]236
Figure 2: Molecular structure of PEEK and additive used in this study
C
O
O
n
PEEK
O

13
Figure 3: Applied Separations SFE Spe-ed
14
was 70 ± 2 mg. The additive was introduced on a weight of additive/ weight of film basis. CO2
was added to the selected pressure and the vessel was heated to the desired temperature for a
given time to achieve supercritical conditions. Upon completion of the experiment, the vessel was
decompressed to ambient pressure. After allowing the vessel to cool to room temperature, the
film was removed. The edges of the film were then clamped between two glass plates, and heated
in a Blue M (Wilmington, DE.) oven Model DCI-146C at a selected time and temperature with
compressed air circulation at 100 SCFH. The oven temperature can reach as high as
316°C/600°F. The air flow rate was in the range of 0-100 standard cubic feet per hour (SCFH).
After thermal cure a silvery surface was formed on both sides of the PEEK film.
3.4 – Characterization
3.4.1. X-Ray Photoelectron Spectroscopy (XPS)
X- Ray Photoelectron Spectra were obtained via a Perkin-Elmer Phi Model 5400 ESCA
system. A magnesium anode (Kα = 1253.6 eV) operating at 400W was used. The operating
pressure typically was less than 5×10⁻⁷ torr. The sample was attached to aluminum or copper
mounts by a piece of double-stick transparent tape. The specimen stage was set at a 45° exit
angle. Survey scans from zero to 1100 eV were obtained. Cited binding energies were relative to
the assumed aromatic carbon signal at 284.6 eV 37. XPS data were acquired and stored on an
Apollo 3500 computer with Perkin-Elmer software.
3.4.2. Transmission Electron Microscopy (TEM)
Transmission Electron Micrographs were taken with a Philips Model 420T transmission
electron microscope. Samples prepared for TEM were embedded in Polyscience,s Ultra low-
viscosity medium and cured for 12 hours at 60°C. Using a Reichert-Jung ultra-microtome with a
microstar diamond knife, cross sections of the samples between 500 and 1000 angstroms were
obtained. These sections were placed on 200-mesh copper grids prior to analysis.
3.4.3. Scanning Electron Microscopy (SEM)

15
An ISI Model SX-40 scanning electron microscope (SEM) was used to obtain all scanning
electron micrographs. The samples were attached to aluminum mounts using double-stick tape
coated with a thin layer of gold in order to dissipate charge.
3.4.4. Auger Electron Spectroscopy (AES)
A Perkin – Elmer Phi Model 610 Scanning Auger Microprobe System was used to record
depth profiles of modified films. A typical electron beam voltage was 3 kV with a beam current of
0.1 µA. The ion beam used for concurrent argon sputter etching was operated with an
accelerating voltage of 4 kV and an ion current of 5µA/cm2. The ion gun was rastered within a
2mm×2mm square. Samples were mounted on aluminum mounts using double-stick transparent
tape. Silver paint was applied to the corner of the samples to reduce charging on the surface of
the sample.
3.4.5. Thermogravimetric Analysis (TGA)
Thermogravimetric analysis was performed using a TA Instrument, Inc. (New Castle, DE)
Hi-Res Model TGA 2950 Thermogravimetric Analysis. The heating rate was 10 °C/min with a
dynamic airflow of 20 ml/min. The system’s internal calibration procedure was followed to
calibrate the system.
3.4.6. Reflectivity Measurements
All reflectivity determinations were performed at NASA Langley Research Center.
Measurements were obtained at 531 nm on a Lambda 9 UV/VIS/NIR spectrophotometer with a
variable angle reflectivity attachment. Measurements at 531 nm were used since this is the solar
maximum value and these materials are of interest for aerospace applications.

16
4. Results and Discussion
4.1 – Preliminary
Incorporation of a silver additive into PEEK film via a supercritical fluid to form a
reflective mirror surface of silver was found to be strongly dependent on both the infusion and
curing conditions. The first set of experiments was designed to determine if supercritical CO2
could penetrate the surface of the PEEK. After this experiment, infusion of the additive directly
into the PEEK was performed. The first attempt was the infusion of 20 percent additive while
temperature, pressure and time were varied. After the infusion process, the film was cured to
reduce the infused silver and to hopefully give rise to formation of a silver mirror. All infused
samples were cured at 225°C for 30 minutes and for another 30 minutes at 250°C; while, the flow
rate of air during the cure cycle was 100 standard cubic feet per hour. Since a reflective mirror
surface formed as a result of 20% additive, the amount of additive to film level (wt./wt.) was
reduced to 10 and 5% to determine whether reflective mirror surfaces could also be formed. For
10 % additive a reflective mirror surface formed. Using 5% additive a reflective mirror surface
also formed but only at 110°C/120min/2200psi and 140°C/120min/2200psi for infusion. The cure
conditions were the same as noted previously. The objective of this chapter is to describe the
synthesis and characteristics of silver modified films made via infusion using supercritical fluid
CO2 and to optimize the conditions for formation of a reflective surface.
4.2 - General Characterization
Fully cured PEEK is a transparent, colorless, flexible film which has a smooth side and
rough side. It has a glass transition temperature (Tg)=143°C, melting point (Tm)=334°C and is
stable in the melt at 400°C in air38.
Infusion by supercritical CO2 containing silver additive generated in some cases films,
which appeared metallic silver on both sides after cure. All films maintained their flexibility after
surface coverage with silver. The appearance of the silvery surface on the film depended solely on
the infusion conditions since the cure conditions were the same in all experiments described in this
section.
17
4.2.1- Basic Considerations in Light Scattering Theory
Often materials are modified by coating them to create new materials for different
purposes, i.e. coating of paper to cover the base sheet and to form a new design primarily for
printing39. The optical properties of coated materials depend on the characteristics of the coating
pigment. Usually the high reflectance results mainly from light scattering within both the coating
and base stock. When a ray of light enters the sheet it rapidly becomes diffused in the spatial
direction. At each interface between a pigment particle and air, the phenomena of reflection,
diffraction, interference and refraction occur. These are the basic mechanisms of light scattering.
In view of irregular shapes and depositions of the particles making up the coating and base stock
it is easy to see how these phenomena, involved in multiple scattering, result in diffusion of the
light. The technical measurement of the light scattering power is the specific scattering coefficient.
Scattering coefficient, s, may depend on the properties of particles such as particle size, particle
shape and refractive index. Concerning the particle size one should mention that the extent of
reflection and refraction will depend upon the amount of surface area per unit mass (the specific
surface). If the linear dimensions of the space are large enough to permit to consider a scattering
coefficient of the mass of particles, it should be very small in magnitude, and the reflectivity of the
mass would also be low. This follows the fact that the specific surface of subdivided matter varies
inversely with the particle diameter, the “constant” depending on particle shape. As the particles
are made smaller, the specific surface area becomes larger, and the scattering coefficient and the
reflectivity increase substantially. The index of refraction of pigment particles also has an effect on
the scattering coefficient particularly, when the particles are in contact with, a liquid or solid.
During the transmission of light through pigment particles, some of the radiation is
absorbed and transformed to thermal form. In any case light is absorbed by all materials in
varying degrees, and the measure of absorbing power is the specific absorption coefficient.
Absorption coefficient (k) is a function of natural and added coating materials, and may be a
strong function of wavelength39.

18
Kubelka and Munk40 showed the relationship between the reflectance (where the
reflectance defined as a ratio of the intensity of reflected light over the intensity of incident light)
of an opaque layer (theoretically infinitely thick) and the coefficients s and k (scattering coefficient
and absorption coefficient, respectively) by the following equation:
R= 1+ (k/s)- Square root[ 2 (k/s) + (k/s)2]
where the reflectivity (R) is a function of the ratio of (k/s). Further, if the reflectivity is to be very
high this ratio must be very low. For imperfectly opaque films this equation becomes more
complicated.
4.3 –PEEK in the Presence of Supercritical CO2
To determine if supercritical CO2 could penetrate the surface of the PEEK a strip of
PEEK film was subjected to 2200 psi CO2 at 110°C for 120 minutes. There was no apparent
change in the color or the texture of the film and only a slight change in mass was observed (Table
1) after decompression. Thus, supercritical CO2 may penetrate the PEEK but if it does we
concluded that little CO2 remained when the pressure was reduced to ambient pressure.
Furthermore, it didn’t appear that any component of the PEEK was extracted during the CO2
treatment.
4.4 – Synthesis of the Metalized Film
A thin strip of PEEK film and 20wt.% [Ag(COD)HFA]2 were placed together in a
stainless steel vessel. CO2 was added to a pre-selected temperature and pressure. Table 2 lists the
various infusion conditions and times that were employed. Upon completion of the experiment,
the vessel was decompressed to ambient pressure. After allowing the vessel to cool to room

19
Table 1: Mass change for PEEK film upon treatment with supercritical CO2 and then
decompression
(Infusion conditions: 110°°C/2200psi/120min.)
Time (min) Mass change
Exactly after decompression +0.6%
1 day after decompression at
room temperature
+0.4%
2 days after decompression at
room temperature
+0.3%
7 days after decompression at
room temperature
+0.3%

20
Table 2: Supercritical infusion conditions and appearance of the PEEK with 20 wt. %
[Ag(COD)HFA]2 after infusion/cure
Infusion conditions
Sample T(°°C) t(min) P(psi) Surface
A-1 60 60 2200 Brown
A-2 60 120 2200 Brown
A-3 60 120 5000 Brown
A-4 80 60 2200 Brown
A-5 80 120 2200 Silvery mirror
A-6 80 60 4000 Brown
A-7 80 120 5000 Brown
A-8 110 60 2200 Silvery mirror
A-9 110 120 2200 Silvery mirror
A-10 110 60 5000 Brown
A-11 110 120 5000 Brown

21
temperature, the film was removed. No apparent changes were observed in the color or texture of
the infused film. The edges of the film were then clamped between two glass plates, and heated in
an oven at 225°C for 30 minutes and for another 30 minutes at 250°C; while, the flow rate of air
during the cure cycle was 100 standard cubic feet per hour (SCFH). A silvery surface formed on
both sides of the PEEK film (Table 2) during the cure in three instances (e.g. A-5:
80°C/2200psi/120min, A-8: 110°C/2200psi/60min, and A-9: 110°C/2200psi/120min.).
Since a reflective mirror surface did not form at 60°C infusion for the 20 wt.% level of
additive/ polymer, experiments for 10 wt.% level of additive/ polymer were carried out above
60°C (Table 3). Again a silvery surface was obtained on both sides of PEEK in three instances
(e.g. B-4:110°C/2200psi/60min, B-5: 110°C/2200psi/120min, and B-8: 140°C/2200psi/120min.).
For the same reason the infusion experiments for 5 wt.% of additive /polymer were begun at
110°C (Table 4). Silvery surfaces were observed at 110°C/2200psi/120min for C-1 and at
140°C/2200psi/120min for C-3. All PEEK films before infusion had a thickness of 0.003″ mm
and a dimension of 5×1 cm. and the dimensions remained constant after cure.
4.5 - Surface Analysis of the Films
X-ray photoelectron spectroscopy (XPS) was used to investigate the surface properties of
silver containing films prepared by the method outlined in Section 3.3. Depth profiling via Auger
electron spectroscopy (AES) in conjunction with argon ion etching was utilized to gain additional
knowledge regarding the distribution of particles in the bulk of the films. A detail analysis of the
surface density of particles and the distribution of particles in the films were obtained via scanning
electron microscopy (SEM) and transmission electron microscopy (TEM), respectively.
Elemental surface atomic compositions from XPS for selected films which exhibited a
silver mirror are presented in Table 5. A comparison of films A-5 and A-9 (20 wt.% of
additive/polymer) revealed that at constant pressure and time (2200 psi and 120 minutes), as the
infusion temperature increased from 80°C to 110°C, silver atomic concentration on the film

22
Table 3: Supercritical infusion conditions and appearance of the PEEK with 10 wt.%
[Ag(COD)HFA]2 after infusion/cure
Infusion conditions
Sample T(°°C) t(min) P(psi) Surface
B-1 80 60 2200 Brown
B-2 80 120 2200 Brown
B-3 80 120 5000 Brown
B-4 110 60 2200 Silvery mirror
B-5 110 120 2200 Silvery mirror
B-6 110 120 5000 Brown
B-7 110 180 5000 Brown
B-8 140 120 2200 Silvery mirror

23
Table 4: Supercritical infusion conditions and appearance of the PEEK with 5 wt.%
[Ag(COD)HFA]2 after infusion and cure
Infusion conditions
Sample T(°°C) T(min) P(psi) Surface
C-1 110 120 2200 Silvery mirror
C-2 110 120 5000 Brown
C-3 140 120 2200 Silvery mirror
C-4 140 120 5000 Brown

24
Table 5: Atomic concentrations of selected elements via XPS of infused/cured metalized
reflective films
(Cure conditions: 225,250°°C/30+30min/100 SCFH)
Sample %
additive
Infusion
Conditions
(°°C/psi/min)
%C %O %F %Ag
A-5 20 80/2200/120 75.9 13.9 2.7 7.5
A-9 20 110/2200/120 68.6 12.3 0.6 18.5
B-4 10 110/2200/60 76.1 13.1 1.4 9.6
B-5 10 110/2200/120 67.0 14.8 2.7 15.5
C-1 5 110/2200/120 81.2 14.7 0.2 3.9

25
surface increased from 7.5 to 18.5% and fluorine concentration decreased from 2.7 to 0.6%. At
10 wt.% of additive/polymer and constant temperature and pressure (110°C and 2200 psi), the
amount of silver increased from 9.6 to 15.5% and the amount of fluorine increased from 1.4 to
2.7% in going from 60 to 120 minutes infusion. At constant infusion conditions (110°C, 2200 psi,
120 min.) the amount of silver on the surface decreased as the wt.% level of additive/polymer
changed from 20% to 10% to 5%. The plots of silver atomic concentration versus infusion
temperature, infusion time and %wt. additive have been shown separately (Figure 4).
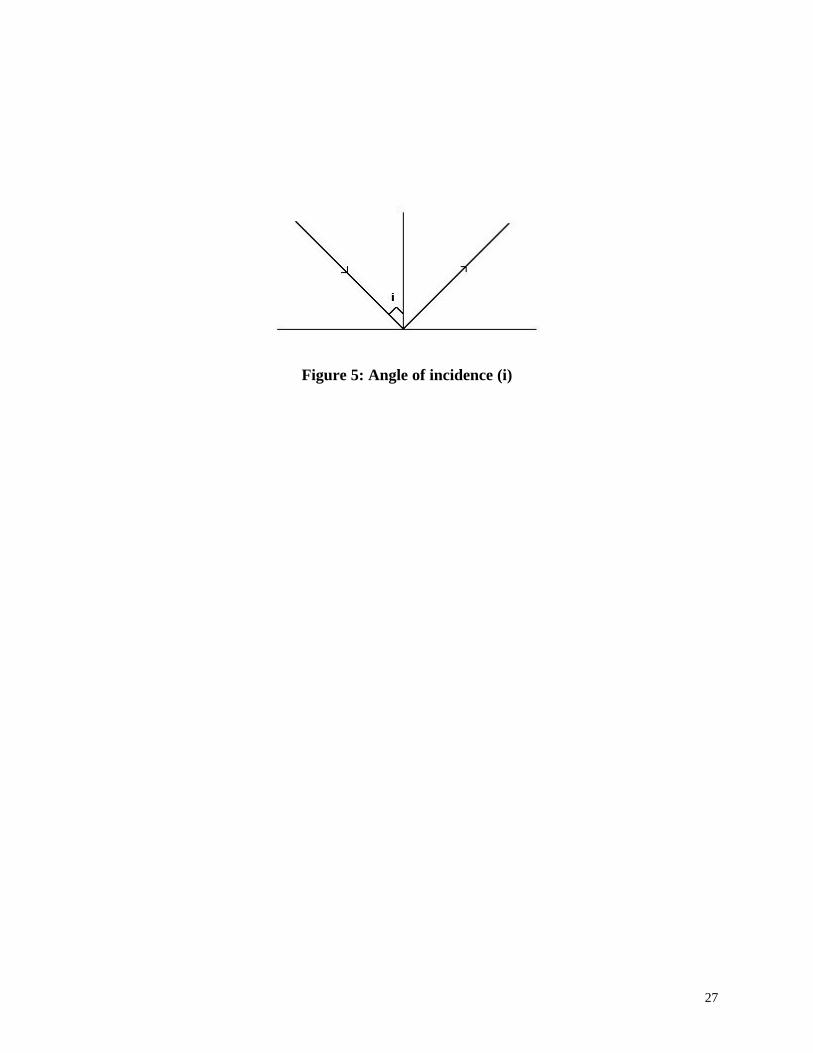
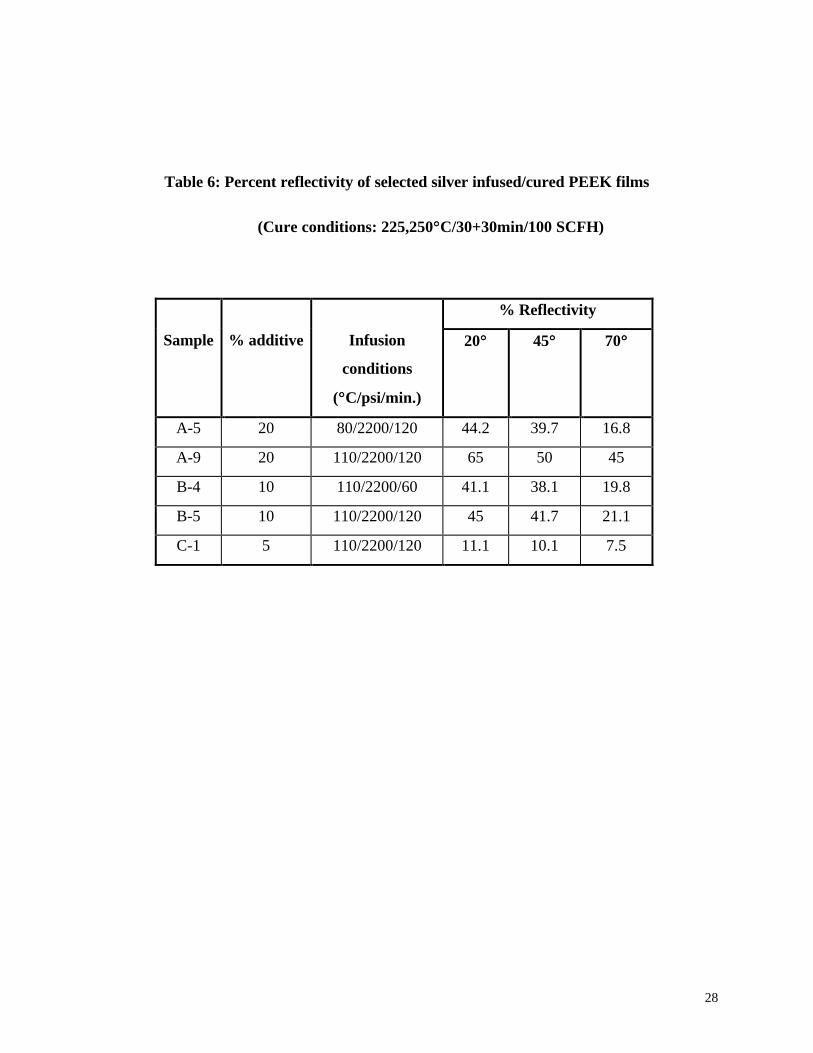
Reflectivity results for infused silvered films are summarized in Table 6. The angle of
incidence defined as an angle of incoming light measured perpendicularly to the surface (Figure
5). Reflectivity measured at 20°, 45° and 70° relative to the incident light of 531 nm (i.e. the most
intense wavelength of solar radiation) was taken as the criterion for evaluation. The results of
these measurements yielded reflectivity values of the film compared to an optical silver mirror
assigned a reflectivity value of 100%. The highest reflectivity was 65% measured on the 20 wt.%
additive/polymer for an infusion temperature, pressure, and time of 110°C, 2200 psi and 120
minutes, respectively. The second highest reflectivity was 45% at 10 wt.% additive/polymer for
the same infusion conditions. Also, for the same infusion conditions using 5 wt% additive the
reflectivity of 11.1% observed. These reflectivity results support the XPS results mentioned
previously in that a higher atomic concentration of silver on the surface gave rise to films with
higher reflectivity (all samples cured at 225,250°C/30+30min/100 SCFH). The plot of
%reflectivity versus percent atomic concentration of silver for selected elements at constant
infusion conditions (110°C/2200psi/120min.) and constant cure conditions
(225,250°C/30+30min/100 SCHF) is shown in Figure 6.
Despite the formation of reflective mirror surfaces at both 20 and 5 wt.% additive/
polymer, our future work focused on films that incorporated 10% additive. At this point, the best
infusion condition using 10% additive with subsequent formation of high reflectivity films was
110°C, 2200 psi and 120 minutes; while, the cure condition was T=225,250°C for t=30,30

26
(A)
(B)
(C)
Figure 4: Surface silver atomic concentration versus: (A) infusion temperature using 20
wt% additive, (B) infusion time using 10 wt.% additive, (C) % additive
0
5
10
15
20
0 20 40 60 80 100 120
Infusion Temperature, C
Ato
mic
% A
g
0
5
10
15
20
0 50 100 150
Infusion Time, min
Ato
mic
% A
g
0
5
10
15
20
0 5 10 15 20 25
% Additive, wt.
Ato
mic
% A
g
27
Figure 5: Angle of incidence (i)
28
Table 6: Percent reflectivity of selected silver infused/cured PEEK films
(Cure conditions: 225,250°°C/30+30min/100 SCFH)
% Reflectivity
Sample % additive Infusion
conditions
(°°C/psi/min.)
20°° 45°° 70°°
A-5 20 80/2200/120 44.2 39.7 16.8
A-9 20 110/2200/120 65 50 45
B-4 10 110/2200/60 41.1 38.1 19.8
B-5 10 110/2200/120 45 41.7 21.1
C-1 5 110/2200/120 11.1 10.1 7.5

29
Figure 6: %Reflectivity versus surface silver atomic concentration at 20°° for 5, 10,
20 wt.% additive
0
10
20
30
40
50
60
70
0 5 10 15 20
Atomic % Ag
% R
efle
ctiv
ity

30
minute with an air flow rate of 100 SCFH. Under these conditions and taken from the oven the
atomic concentrations of silver and fluorine as stated previously were 15.5 and 2.7%, respectively
(Table 5). It was thought that the surface of the silvery film might be covered with unconverted
additive since fluorine was on the surface. It was reasoned that if the surface were cleaned of
fluorine a higher reflectivity might result. We tried to remove the fluorine from the surface by
dipping the sample in acetone for 1 minute since the additive is very soluble in acetone. Four films
were studied in order to investigate if the amount of fluorine on the surface could be reduced by
cleaning the surface in this way (Table 7). The placement of the washing step within the
infusion/cure process was varied. All resulting films were infused/cured in the same way and each
had a reflective surface.
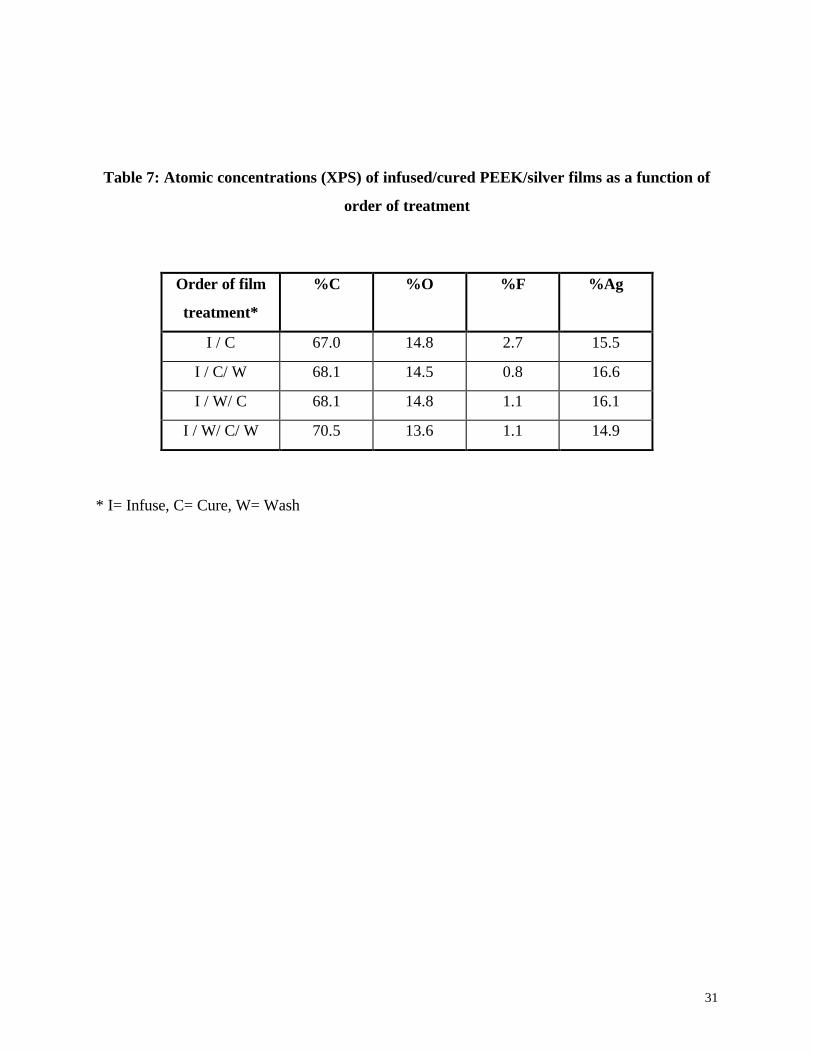
The XPS analysis as stated earlier for the unwashed silver film found 15.5% silver and
2.7% fluorine on the surface (see Figure 7 for XPS profile); while, it had a reflectivity of 45% at
20°. A second sample was infused, cured, and dipped in acetone after the cure. The atomic
concentrations of silver and fluorine on the surface were 16.6% and 0.8%, respectively while the
surface had a reflectivity of 59% at 20°. The XPS analysis showed that dipping the sample in the
acetone for one minute after cure caused reduction in the amount of fluorine from 2.7% to 0.8%
and an increase in the amount of silver from 15.5% to 16.6% (Figure 8). It was interesting to
observe that by cleaning the surface after curing the reflectivity changed from 45% to
approximately 59% (Table 8). The third sample was infused, washed after infusion, and then
cured. It showed 16.1% silver and 1.1% fluorine on the surface with a reflectivity of 46.7%.This
observation suggests that a wash step after curing is more effective than before curing. The fourth
sample was infused, washed after infusion, cured, and again washed after cured. The XPS data for
this sample detected 14.9% silver and 1.1% fluorine, while its reflectivity was around 53.1%. It
may be speculated that washing the film after infusion causes reduction in the amount of infused
additive. Washing a single time after curing appears to be the method of choice. It should be
noted that XPS analysis of the backside (e.g. rougher side) of the film which had been washed
after curing showed different atomic concentrations than the smooth side: 72.3%
31
Table 7: Atomic concentrations (XPS) of infused/cured PEEK/silver films as a function of
order of treatment
Order of film
treatment*
%C %O %F %Ag
I / C 67.0 14.8 2.7 15.5
I / C/ W 68.1 14.5 0.8 16.6
I / W/ C 68.1 14.8 1.1 16.1
I / W/ C/ W 70.5 13.6 1.1 14.9
* I= Infuse, C= Cure, W= Wash

32
Figure 7: XPS profile of infused and cured sample before being dipped in acetone
(Infusion conditions: 110°°C/2200psi/120min.)
(Cure conditions: 225,250°°C/30+30min/100 SCFH)

33
Figure 8: XPS profile of infused and cured sample which had been dipped in
acetone after cure
( Infusion conditions: 110°°C/2200psi/120min.)
( Cure conditions: 225,250°°C/30+30min/100 SCFH)

34
Table 8: Percent reflectivity of infused/cured PEEK/silver films as a function of order of
wash treatment
% Reflectivity
Order of film treatment 20°° 45°° 70°°
I/C 45 41.7 21.1
I/C/W 59.4 54.3 26.8
I/W/C 46.7 41.2 16.1
I/W/C/W 53.1 46.3 17.6

35
carbon,14.1% oxygen, 3.4% fluorine and 10.3% silver. No reflectivity measurements on the
reflective rough film side were measured. Since washing the sample just after cure showed the
highest reflectivity and the least amount of surface fluorine all samples were dipped in acetone for
one minute in the following experiments.
4.5.1-Effect of Cure Air Flow Rate
Three important factors during the cure cycle might affect the formation of a reflective
surface: 1) air flow rate, 2) temperature, and 3) time. A discussion of the effect of cure air flow
rate follows. A piece of film infused at 110°C,2200psi and 120 minutes was cut into three pieces
and cured separately. The cure conditions for each film were T=225,250°C at t=30,30 minutes
while the air flow rate was either 0, 30, 100 SCFH. After curing, all three reflective samples were
washed by dipping the films in acetone for one minute.
XPS results (e.g. atomic concentrations) for these films are shown in Table 9. Some air
flow appears to be essential to get high atomic concentration of silver on the surface. At an
airflow rate of 30 SCFH, silver concentration was 17.2% and when there was no airflow the silver
value was 2.3%. The fluorine concentration was 0.1% and 1.7% on the surface for flow rates of 0
and 30 SCFH, respectively. Reflectivity results surprisingly appear to not be affected by flow rate.
At 0, 30 and 100 SCFH, the percent reflectivity was 55.6, 56.4 and 59.4, respectively at 20°. The
same behavior was observed when reflectivity measurements were obtained at both 45° (e.g. 49.8,
50.2 and 54.3% at 0, 30, 100 SCFH, respectively) and 70° (e.g. 24.8, 26.2 and 26.8% at 0, 30,
100 SCFH, respectively). Since the reflectivity was slightly higher at 100 SCFH, this air flow was
used for the following studies.
4.5.1.1 -Mass Transfer During the Cure Process
Mass transfer usually refers to any process in which diffusion plays a role. Diffusion is the
spontaneous intermingling or mixing of atoms or molecules by random thermal motion. It gives
rise to motion of species relative to the motion of the mixture. During the cure process two

36
Table 9: Atomic concentrations (XPS) and percent reflectivity of selected elements
comparing different air flow rates during cure cycle
(Infusion conditions 110°°C/2200psi/120min.)
Cure conditions Atomic concentration % Reflectivity
(°°C / min) SCFH %C %O %F %Ag 20°° 45°° 70°°
225,250/30,30 0 68.5 29.2 0.1 2.3 55.6 49.8 24.8
225,250/30,30 30 68 13.2 1.7 17.2 56.4 50.2 26.2
225,250/30,30 100 68.1 14.5 0.8 16.6 59.4 54.3 26.8
225,250/30,30 100 - - - - 60.5 53.3 26.6

37
steps for mass transfer are possible: 1) diffusion of volatile product (such as HFA and COD)
through the PEEK film. Molecules within a single phase will always diffuse from regions of higher
concentration to regions of lower concentration41. This gradient results in a molar flux of the
species, W, in the direction of concentration gradient. The molar flux, W, is the result of two
contributions: the molecular diffusion flux, produced by a concentration gradient, J, and the flux
resulting from the bulk motion of the fluid, B, so:
W=B+J
Because there is no bulk motion of the fluid (B=0), the flux will be only that resulting from the
concentration gradient. So the constitutive equation for J, the diffusional flux, resulting from a
concentration difference is related to the concentration gradient by Fick’s first law:
J= -D(ðc/ðz)
Where D is a diffusivity or diffusion coefficient.
2) diffusion/convection of volatile product from the surface of PEEK film to the air phase. This
behavior could be determined in terms of a molar flux from the bulk to the surface:
Wext=k(Csurf - Cair)
where k is the mass transfer coefficient. Since in our system Cair= 0, the above equation is reduced
to:
Wext= kCsurf
It should be note that the mass transfer coefficient (k) is a function of convection. In
convection the fluid coming into contact with a hot surface heats up and moves away, thereby
distributing the heat. When the motion of the fluid is brought about by external forces it is called
forced convection42. This form of heat transfer is very important technically. It is to be expected
that the heat transfer coefficient will rise as velocity increases, because the more rapid the fluid
flows the more rapid will the parts of the fluid be heated up and be replaced by new ones. Since
changing the air flow rate from 0 to 30 SCFH showed a large increase in surface silver atomic
concentration (Table 9). It concluded that convection from the surface was a rate-limiting step.
38
4.5.2 – Effect of Cure Temperature and Time
In hopes of improving the surface reflectivity, the effect of temperature and time during
the thermal treatment was considered. Up to now the usual cure conditions were 225°C for 30
minutes and another 30 minutes at 250°C. To study the effect of cure temperature and time, 3 sets
of experiments were performed wherein temperature was varied from 225 to 250°C and time was
varied from 30 to 120 minutes. The infusion conditions were the same for all samples (T=110°C,
P=2200psi and t=120 min.).
Initially three samples were cured at fixed temperature (e.g. 225, 250°C) while the cure
time varied from 15+15, 30+30, and 60+60 minutes, respectively (e.g. samples were again dipped
in acetone for one minute after cure) at 100 SCFH air flow(Table 10). There was an increase in
silver concentration and in reflectivity (Table 10) when the cure time increased from 15+15 to
30+30 minutes. But increasing the cure time from 30+30 to 60+60 minutes resulted in a decrease
in both silver concentration and in reflectivity, as well. While the changes in silver atomic
concentration were significant, the changes in reflectivity were considered to be minimal. This
behavior could be explained by nucleation of particles at 30+30 minutes; however, there was no
nucleation at 60+60 minutes and just growth of particles observed. Turkevich43 defined growth as
a process in which additional material deposits on the particle causing it to increase in size. Thus,
in this manner the medium became more discontinuous and as a result less reflective. Nucleation
defined as a process whereby a discrete particle of a new phase forms in a previously single-phase
system.
In a second study, 3 samples were cured separately for 30, 60, and 120 minutes at a fixed
temperature of 225°C rather than for half the time at two different temperatures and then dipped
in acetone for 1 minute. All three samples formed reflective surfaces. Table 11 lists the atomic
concentrations of carbon, oxygen, fluorine and silver on the surface of each film as determined

39
Table 10: Atomic concentrations (XPS) and percent reflectivity of selected elements at fixed
cure temperature and different times
(Infusion conditions 110°°C/2200psi/120min.)
Cure conditions Atomic concentration % Reflectivity
T(°°C) t(min) %C %O %F %Ag 20°° 45°° 70°°
225,250 15+15 72.4 14.9 0.9 11.8 55.8 50.3 15.7
225,250 30+30 68.1 14.4 0.8 16.6 59.4 54.3 26.8
225,250 60+60 77.5 14.4 0.5 7.7 53.4 51.3 20.8

40
Table 11: Atomic concentration (XPS) and percent reflectivity of selected elements at fixed
cure temperature and different times
(Infusion conditions 110°°C/2200psi/120min.)
Cure conditions Atomic concentration % Reflectivity
T(°°C) t(min) %C %O %F %Ag 20°° 45°° 70°°
225 30 71.2 14.7 0.6 13.6 39.3 32.7 20.1
225 60 69.3 14.7 0.4 15.6 42.8 36.3 23.7
225 120 64.9 15.9 0.6 18.8 62.8 54.4 26.3

41
via XPS. Also it lists the reflectivity data which suggest that the reflectivity and silver
concentration increased as the cure time increased. It is believed that at 225°C and 120 minutes
better intermixing of polymer and additive were obtained and nucleation process happened
relative to the 225,250°C and 60+60 minutes which seemed growth of particles observed.
Scanning electron microscopy (SEM) of this film showed a surface which exhibited different size
particles distributed on the surface (Figure 9). In terms of particles size and shape if assumed
particles had a spherical shape and since they were small it followed the suggestion in light
scattering theory that for small particles, the specific surface became large and as a result the
scattering coefficient and the reflectivity would increase. To obtain a view of the internal physical
structure of the film, transmission electron microscopy (TEM) of a film cross- section was used.
The TEM showed the silver layer to be approximately 400 angstrom (40 nm) thick and most of
the silver in the film was part of this layer (Figure 10). However, there were particles of silver,
most less than 50 angstrom (5 nm) in diameter, that extended several hundred nanometers into the
PEEK.
In order to find the chemical state of elements for silver infused PEEK films X-ray
photoelectron spectroscopy (XPS) was applied to both non-infused PEEK and to silver infused
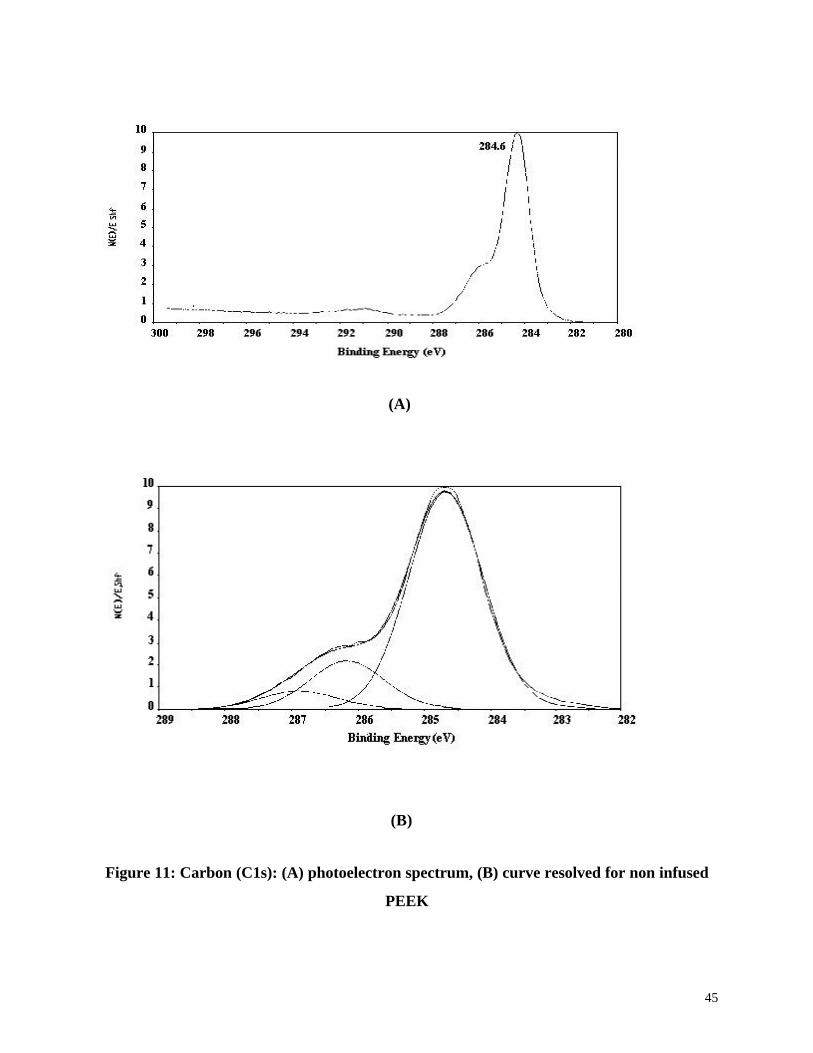
PEEK to compare the result. The carbon (C1s) photoelectron spectrum for non-infused PEEK
(smooth side) exhibited the pattern displayed in Figure 11-A. This signal may be curve resolved
into three separate carbon environments that would be expected based on the chemical structure
of PEEK (Figure 11-B). The calculated carbon ratio for PEEK is 1:5:12, corresponding to the
carbonyl, ether, and aromatic carbons, respectively. Experimental ratios obtained from the area
gave a ratio of 1:3:12.5. The oxygen (O1s) photopeak, as expected, exhibits two types of oxygen
species (carbonyl and ether, Figure 12-B). Theoretically, one would expect a 2:1 ratio between
ether and carbonyl oxygen. Experiment yielded a 2:1 ratio, which shows excellent agreement with
theory.
Changes in surface composition relative to the non-infused PEEK film were noticeable

42
Figure 9: Scanning electron microscopy (SEM) of silver - infused PEEK which was
cured at 225°°C/120min/100 SCFH

43
Figure 10-A: Transmission electron microscopy (TEM) of silver - infused PEEK which was
cured at 225°°C/120min/100 SCFH (magnification: 187,500x)

44
Figure 10-B: Transmission electron microscopy (TEM) of silver - infused PEEK which was
cured at 225°°C/120min/100 SCFH (magnification: 67,000x)
45
(A)
(B)
Figure 11: Carbon (C1s): (A) photoelectron spectrum, (B) curve resolved for non infused
PEEK

46
(A)
(B)
Figure 12: Oxygen (O1s): (A) photoelectron spectrum, (B) curve resolved for non infused
PEEK

47
for silver infused films. For infused PEEK film, which was cured continuously at 225°C and 120
minutes, the XPS profile is shown in Figure 13. The carbon (C1s) photoelectron spectrum for this
sample exhibited the same pattern which was shown for non-infused PEEK (Figure 14-A).
Surprisingly, the oxygen (O1s) photopeak for this same sample showed three rather than two
types of oxygen atoms present on the surface (Figure 15-B). Oxygen 1 and 2 corresponded to the
carbonyl and ether oxygen, respectively. Oxygen 3, was probably due to surface contamination.
The photopeak (Figure 16-B) at 688.4 eV suggested that fluorine was present as a fluorocarbon
(CF2), either formed by a chemical reaction between the silver additive with PEEK or by
incomplete decomposition of [Ag(COD)HFA]2 on the surface of the PEEK.
The Chemical state of the silver was of interest in the same film (Figure 17). The obtained
from the silver 3d photo peak was not sufficient to determine the chemical state of silver because
silver metal and silver (Ι) have nearly identical binding energies. Schon44 and Larson45 have shown
that Auger shifts (MNN) are frequently more revealing than XPS shifts for different chemical
states of silver. The chemical state of silver was estimated from the Auger line (Figure 18) versus
the binding energy of the photoelectron line37.The kinetic energy was calculated by subtracting the
Auger peak binding energy (896.4 eV) from the Kα of magnesium (1253.6 eV) to obtain the
value of 357.2 eV. The Auger parameter was then calculated by adding the values of the kinetic
energy (357.2 eV) and the binding energy of Ag(3d 5/2) (368.5) to give 725.5 eV. This indicated
that the most of the silver was present in the zero oxidation state, since the Auger parameter of
silver metal is 726 eV.
Depth profiling via Auger electron spectroscopy (AES) in conjunction with argon ion
etching ( sputtering rate was 50 angstrom/min.) was utilized to gain additional knowledge
regarding the distribution of particles in the bulk of the silver infused PEEK film at 225°C/120
min/100 SCFH. By looking at the depth profile (Figure 19) one can observe nearly 50% and 42%
atomic concentrations of silver and carbon, respectively, within the first 40 angstroms of the
surface. This finding supports the early TEM results which suggested that the silver layer was not
continuous. After the first 40 angstroms, the concentration of silver decreased and the concent

48
Figure 13: XPS profile of infused film which was cured at 225°°C/120min/100 SCFH

49
(A)
(B)
Figure 14: Carbon (C1s): (A) photoelectron spectrum, (B) curve resolved for infused and
cured PEEK

50
(A)
(B)
Figure 15: Oxygen (O1s): (A) photoelectron spectrum, (B) curve resolved for infused and
cured PEEK

51
(A)
(B)
Figure 16: Fluorine (F1s): (A) photoelectron spectrum, (B) curve resolved for infused and
cured PEEK

52
Figure 17: Silver (Ag 3d) photoelectron spectrum

53
Figure 18: Silver (Ag 3d) Auger spectrum

54
Figure 19: Depth profiling via Auger electron microscopy (AES) of silver - infused film
which was cured at 225°°C/120min/100 SCFH

55
concentration of carbon increased as one goes deeper into the surface. for example, at the depth
of 250 angstroms the atomic concentrations of silver and carbon are about 10% and 82%,
respectively. The atomic concentration of oxygen remains nearly constant through the film (e.g.
nearly10%).
Finally, three samples were cured separately for 30, 60 and 120 minutes as before but at a
fixed temperature of 250°C rather 225°C and then dipped in acetone for one minute after cure
(Table 12). All three samples formed reflective mirror surfaces. There was an increase in both
silver concentration and reflectivity when the cure time increased from 30 to 60 minutes. But
increasing the cure time from 60 to 120 minutes resulted in a slight increase in silver concentration
and a large decrease in reflectivity. Here again this behavior could be explained by “ nucleation
and continued growth of particles which lead to greater discontinuity of the medium”. It appeared
at 30 and 60 minutes nucleation dominates-leads to high reflectivity and at 120 minutes particle
growth dominates-leads to lower reflectivity. Transmission electron microscopy (TEM) showed
discontinuity of the metallic silver layer for infused film which was cured at 250°C for an hour
(Figure 20). The TEM profiles of this sample revealed the silver particles on the surface were
approximately between 500 to 900 angstrom (50 to 90 nm) in diameter while much smaller
particles of silver with diameter less than 150 angstrom (15 nm) appeared at several hundred
nanometers into the film. Scanning electron microscopy (SEM) of this film showed a surface with
bigger particles (Figure 21) relative to the samples which cured at 225°C,120 min and 100 SCFH.
The oxygen (O1s) photopeak for this sample showed two types of oxygen: carbonyl and ether
oxygen (Figure 22). Since the area under the peak at 531.3 eV was higher than the area under the
peak at that position for original PEEK it was believed that a little bit oxygen exist as an oxide
oxygen. Note that no signal that could be attributed to fluorine.
From the previous experiments, one can conclude that reflectivity of the film is dependent
on both time and temperature of thermal treatment. At lower cure temperature (225°C) it was
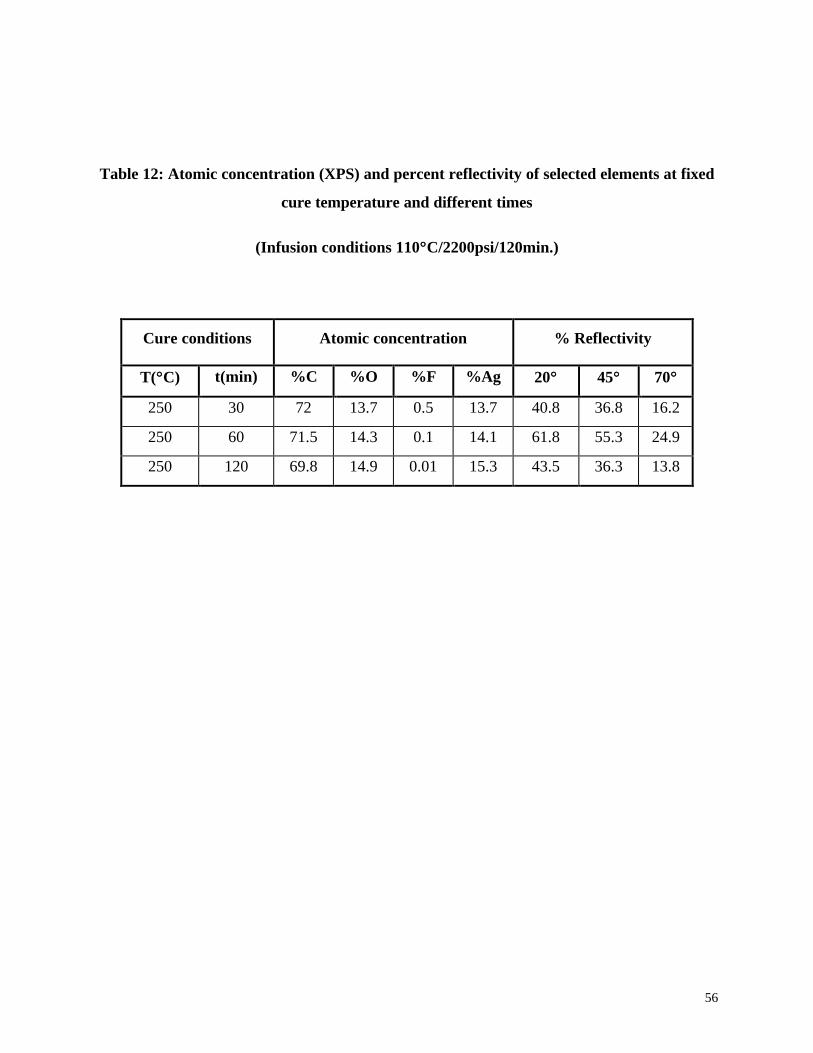
56
Table 12: Atomic concentration (XPS) and percent reflectivity of selected elements at fixed
cure temperature and different times
(Infusion conditions 110°°C/2200psi/120min.)
Cure conditions Atomic concentration % Reflectivity
T(°°C) t(min) %C %O %F %Ag 20°° 45°° 70°°
250 30 72 13.7 0.5 13.7 40.8 36.8 16.2
250 60 71.5 14.3 0.1 14.1 61.8 55.3 24.9
250 120 69.8 14.9 0.01 15.3 43.5 36.3 13.8

57
Figure 20-A: Transmission electron microscopy (TEM) of infused film which was cured at
250°°C/60min/100 SCFH ( magnification: 187,500x)

58
Figure 20-B: Transmission electron microscopy (TEM) of infused PEEK which was cured
at 250°°C/60min/100 SCFH ( magnification: 67,000x)

59
Figure 21: Scanning electron microscopy (SEM) of infused film which was cured at
250°°C/60min/100 SCFH

60
(A)
(B)
Figure 22: Oxygen (O1s): (A) photoelectron spectrum, (B) curve resolved for infused film
which was cured at 250°°C/60min/100 SCFH

61
demonstrated that long cure (120 min.) time is necessary to obtain high reflectivity, while at a
higher cure temperature (250°C) shorter cure time (60 min.) is required. However, one must
recognize that at lower cure temperatures, very long cure times may also cause the medium to
become more continuous and result in more reflective surface.
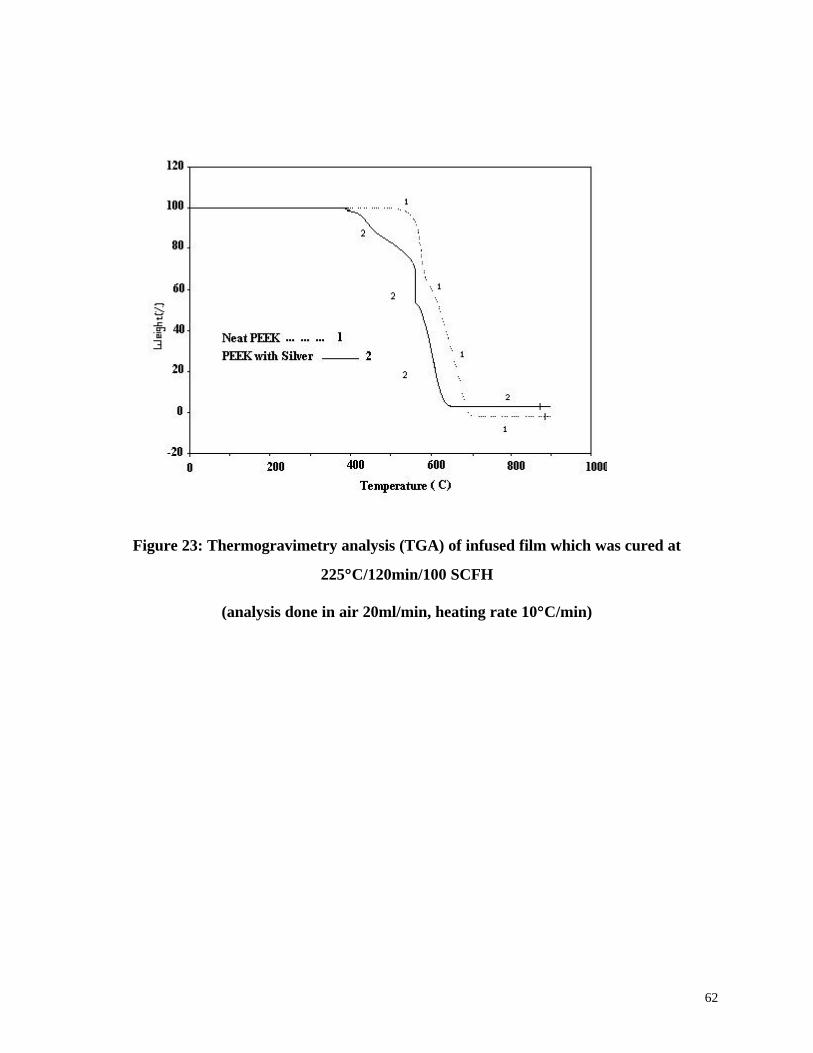
4.6 – Thermal Analysis of the Film
Thermal methods of analysis are well suited for the characterization of these materials.
Estimates of PEEK film thermal stability were obtained by performing thermal gravimetric
analysis (TGA) in air atmosphere. Stabilities are commonly referenced to the polymer
decomposition temperature (PDT). PDT10 is a parameter corresponding to the temperature at
which 10% weight loss occurs46,47. Thermal gravimetric analysis (TGA) is dependent on the type
of atmosphere, flow rate of atmosphere, positioning of the film within the furnace, and the heating
rate48.
The PDT10 in air for non-doped PEEK was 560°C. The observed PDT10 for an infused
film (110°C/2200psi/120min) with 10 wt.% additive/polymer which was cured at 225°C/120
min/100 SCFH was 450°C (Figure 23). The large difference between the polymer decomposition
temperatures (PDT) for infused films versus original films suggested the incorporation of silver
into film lowered the polymer decomposition temperature (PDT). It seemed that the presence of
silver serves to catalyze the oxidative degradation of the PEEK. However, the knee that was
present in the TGA curve of the infused PEEK film could be described by this hypothesis that
silver species were only present in the surface or near surface region of the infused PEEK film46.
Porta had reported that residual metal species within a polymer acted as a catalyst in the polymer
decomposition mechanism and was responsible for reduced stability of the polymer film49,50.
62
Figure 23: Thermogravimetry analysis (TGA) of infused film which was cured at
225°°C/120min/100 SCFH
(analysis done in air 20ml/min, heating rate 10°°C/min)

63
4. Conclusions
The focus of this research was the preparation of highly reflective polymer surfaces. The
CO2-assisted infusion process was feasible for incorporating a silver additive into a PEEK film.
Reflective silver-surfaced PEEK was prepared by infusion and thermal reduction of (1,5-
cyclooctadiene-1,1,1,5,5,5 hexafluoroacetylacetonato) silver (Ι), [Ag(COD)HFA]2. No chemical
reducing agent was needed to effect silver reduction. Reflectivity of the surface was dependent
both on the infusion and cure conditions.
The first goal of this work was to determine the best infusion conditions at fixed cure
conditions. In this regard the influence of infusion parameters studied. This goal was achieved by
evaluating different additive concentrations at different temperatures, pressures, and times. The
result of this study demonstrated that:
Ι - At constant pressure and time, the reflectivity of the surface increased as the temperature
increased due to high diffusivity of CO2 at high temperature.
ΙΙ - At constant temperature and pressure, the reflectivity increased as the time increased due to
infusing more CO2 at longer time.
ΙΙΙ - At constant time and temperature, increasing the pressure caused the reflectivity to decrease.
Optimal infusion condition were determined to be at 110°C/2200psi/120min for 10wt%
additive/polymer. To improve the reflectivity of the surface, samples were dipped in to acetone
for one minute in order to remove fluorine from the surface. The second portion of this work
focused on the effect of the cure parameters such as airflow rate, temperature, and time at fixed
infusion conditions on reflectivity. It was observed that the highest reflectivity was obtained when
the airflow rate had its maximum value. The optimal cure condition was at 225°C/120min/100
SCFH for infusion condition at 110°C/2200psi/120min. The reflectivity of the surface which
employed these infusion/ cure conditions was about 62%. Analysis by TEM revealed a surface
layer of silver particles 40 angstrom thick which was determined by XPS to
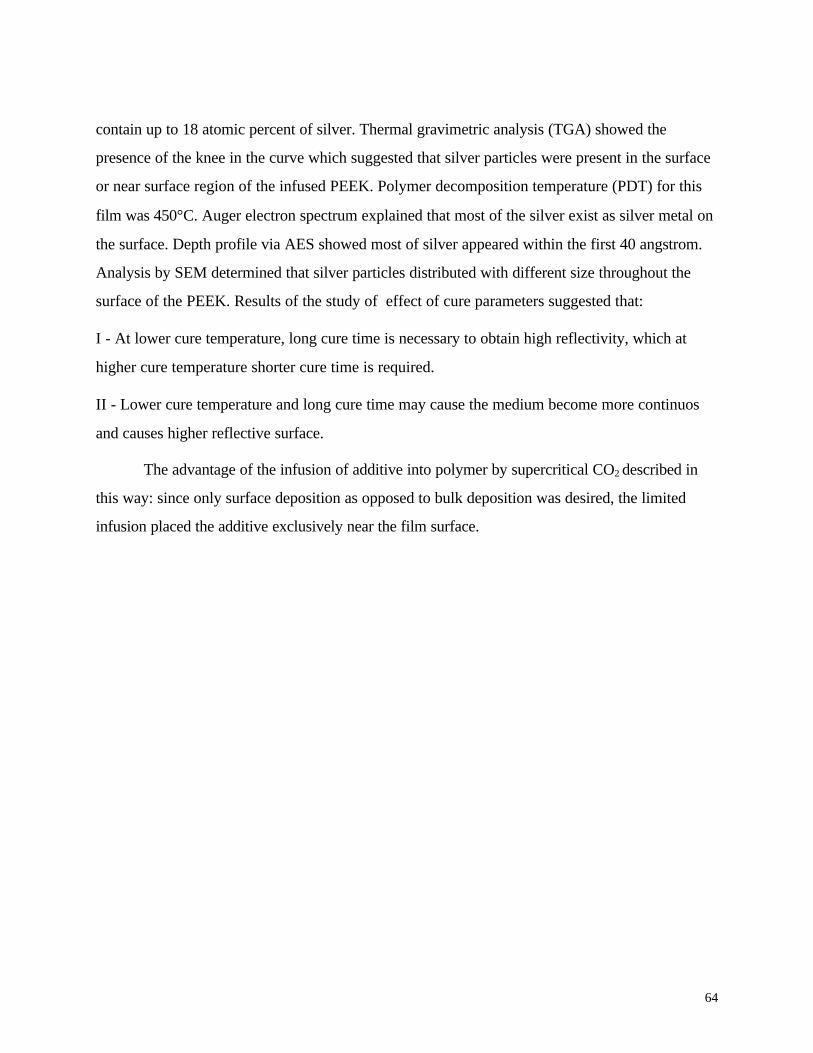
64
contain up to 18 atomic percent of silver. Thermal gravimetric analysis (TGA) showed the
presence of the knee in the curve which suggested that silver particles were present in the surface
or near surface region of the infused PEEK. Polymer decomposition temperature (PDT) for this
film was 450°C. Auger electron spectrum explained that most of the silver exist as silver metal on
the surface. Depth profile via AES showed most of silver appeared within the first 40 angstrom.
Analysis by SEM determined that silver particles distributed with different size throughout the
surface of the PEEK. Results of the study of effect of cure parameters suggested that:
Ι - At lower cure temperature, long cure time is necessary to obtain high reflectivity, which at
higher cure temperature shorter cure time is required.
ΙΙ - Lower cure temperature and long cure time may cause the medium become more continuos
and causes higher reflective surface.
The advantage of the infusion of additive into polymer by supercritical CO2 described in
this way: since only surface deposition as opposed to bulk deposition was desired, the limited
infusion placed the additive exclusively near the film surface.

65
References
1. Cagniard de la Tour, C., Ann. Chim. Phys., 21, 127,178 (1822).
2. Reid, R.C.; Prausnitz, J.M.; Poling, B.E., The Properties of Gases and Liquids; 4th ed.;
McGraw-Hill: New York, NY, 1987.
3. Bruno, T.J.; Ely, J.F., Supercritical Fluid Technology: Reviews in Modern Theory and
Applications; CRC Press: Boca Raton, FL, 1991.
4. Paulaitis, M.E.; Krukonis, V.J.; Kurnik, R.T.; Reid, R.C., Rev. Chem. Eng., 1, 179 (1983).
5. Paulaitis, M.E.; Kander, R.G.; DiAndreth, J.R., Bunsenges. Phys. Chem., 88, 869 (1984).
6. Brennecke, J.F.; Eckert, C.A., AICHE J. 35,1409 (1989).
7. Klesper, E., Angew. Chem. Int. ED. Engl., 17, 738 (1978).
8. Novotony, M.V.; Springton, S.R.; Peaden, P.A.; Fjeldsted, J.C.; Lee, M.L., Anal. Chem., 53,
407A (1981).
9. Supercritical Fluid Chromatography; Smith, R.M., Ed.; Royal Society of Chemistry
Monograph; Royal Society of Chemistry: London, UK, 1988.
10. Smith, R.D.; Wright, B.W.; Yonker, C.R., Anal. Chem., 60, 1323A (1988).
11. Brunner, G. Ion. Exch. Solvent Ext., 10, 105 (1988).
12. Eckert, C.A.; Van Alsten, J.G., Environ. Sci. Technol., 20, 319 (1986).
13. Supercritical Fluids – Chemical Engineering Principles and Applications; Squires, T.G.;
Paulaitis, M.E., Eds. ACS Symp. Ser. 329; ACS: Washington, DC, 1987.
14. Van Wasen, U.; Swaid, I.; Schneider, G.M., Angew. Chem. Int. Ed. Engl. , 19, 575 (1980).
15. Aaltonen, O.; Rantakyla, M., CHEMTECH, 21,240 (1991).
16. Supercritical Fluid Technology, Bright, F. V.; McNally, M.E.P., Eds. ACS Symp. Ser. 488;
ACS. Washington, DC, 1992.

66
17. Carraher, Jr, C.E.; Pittman, Jr, C.U.; Sheats, J.E., Metal-Containing Polymeric Systems,
Carraher, Jr, C.E.; Pittman, Jr, C.U.; Sheats, J.E., Ed. Plenum Press, New York, p.1 (1985).
18. Luna- Barcenas, G.; Kanakia, S.K.; Sanchez, I.C.; Johnston, K.P., Polymer, 36, 3173 (1995).
19. McHugh, M.A.; Krukonis, V.J., Supercritical Fluid Extraction: Principles and Practice;
Butterworths, Boston, 1994.
20. Condo, P.D.; Johnston, K.P., J. Polym. Sci. Polym. Phys. Ed., 32, 523 (1994).
21. DeSimone, J. M.; Guan, Z.; Elsbernd, C.S., Science, 257, 945 (1992).
22. Lee, S.M., Film Deposition Techniques in Kirk-Othmer Encyclopedia of Chemical
Technology, John Wiley & Sons, New York, 10, 247, (1980).
23. Jorgensen, G.; Schissel, P., Met. Plast., Mittal, K.L.; Susko, J.R., Eds., Plenum Press: New
York, 1, 79(1989).
24. Berens, A.R.; Huvard, G.S.; Korsmeyer, R. W.; Kunig, F.W., J. Appl. Polym. Sci., 46, 231
(1992).
25. Sand, M.L.; U.S. Patent 4,598,006 (1986).
26. Berens, A.R.; Huvard, G.S.; Korsmeyer, R.W., U.S.Patent 4,820,752 (1986).
27. Watkins, J. J.; McCarthy, T. J., Macromolecules, 27, 4845 (1994).
28. Kazarian, S.G.; Vincent, M.F.; Bright, F.V.; Liotta, C.L.; Eckert, C.A., J. Amer. Chem. Soc.,
118, 1729 (1996).
29. Cooper, A.I; Kazarian, S.G.; Poliakoff, M., Chem. Phys. Lett., 206, 175 (1993).
30. Wagner, R.A.; Krukonis, V.J.; Coffey, M.P., Ceram. Eng. Sci. Proc., 9, 957 (1988).
31. Watkins, J.J.; McCarthy, T.J., Chem. Mat., 7.1991 (1995).
32. Hansen, B.N.; Hybertson, B.M.; Barkley, R.M.; Sievers, R.E., Chem. Mater., 4, 749 (1992).
33. Boggess, R.K.; Taylor, L.T.; Stoakley D.M.; St. Clair, A.K., J. Appl. Polym. Sci., 64, 1309
(1997).

67
34. Rosolovsky, J.; Boggess; R.K., Rubira, A.F.; Taylor, L.T.; Stoakley, D.M.; St.Clair, A.K.,
Submitted for Publication.
35. Rubira, A.F.; Nazem, N.; Boggess, R.B.; Taylor, L.T., Stoakley, D.M.; St.Clair, A.K.,
Submitted for Publication.
36. Bailey, A.; Corbitt, T.S.; Hampden-Smith, M.J.; Duesler, E.N.; Kodas, T.T., Polyhedron, 12,
1785 (1993)
37. Wagner, C.D.; Riggs, W.M; Davis, L.E.; Moulder, J.F., Handbook of X-ray Photoelectron
Spectroscopy, Muilenberg, G. E., Ed. Perkin-Elmer Corporation, Eden Prairie, Minnesota,
p.38 (1979).
38. High Performance Polymers and Composites, Kroschwitz, J.I., Ed. John Wiley & Sons, New
York, 1991.
39. Physical Chemistry of Pigments in Paper Coating, Garey, Carroll.L., Ed. Tappi Press,
Atlanta,GA, 1997.
40. Kubelka, P.; Munk, F., Z. Tech. Physik. 12, 593 (1931).
41. Fogler, H.S., Elements of Chemical Reaction Engineering, 2nd ed.; Prentic Hall PTR:
Englewood, NJ, 1992.
42. Grassmann, P., Physical Principles of Chemical Engineering, Pergamon Press: New York,
NY, 1971.
43. Turkevich, J.; Stevens, P.C.; Hiller, J., Disc. Faraday Soc. 11, 55 (1951).
44. Schon, G., Acta Chem. Scand.27, 2623 (1973).
45. Larson, J., J. Electron. Spectrosc. Relat. Phenom. 4, 213 (1974).
46. Khune, G. D., J. Macromol.Sci.Chem. A15, 241 (1981).
47. Ghatge, N.D.; Mulik, U.P., J. Polym. Sci., Polym. Chem. Ed. 18, 1905 (1980).
48. Sazanov, Yu. N., J. Thermal Anal. 23,65 (1982).

68
49. Porta, G.M.; Metal/ Polymer Interactions, Ph. D. Thesis, Virginia Polytechnic Institute and
State University, 1989.
50. Witsch, J.M.; Poly(amide acid) Infusion with Copper (Π) Chloride to Form Polyimide
Microcomposite Films, M.S.Thesis, Virginia Polytechnic Institute and State University, 1992.

69
Vita
Negin Nazem was born on April 22, 1969 in Tehran, Iran. She attended Sharif University
and Technology Institute in Iran where she received her B.S. in chemical engineering in spring
1994 and in fall 1995 she enrolled in graduate school in Virginia Tech.