Preparation of DOPC and DPPC Supported Planar Lipid Bilayers for
26
Int. J. Mol. Sci. 2013, 14, 3514-3539; doi:10.3390/ijms14023514 OPEN ACCESS International Journal of Molecular Sciences ISSN 1422-0067 www.mdpi.com/journal/ijms Article Preparation of DOPC and DPPC Supported Planar Lipid Bilayers for Atomic Force Microscopy and Atomic Force Spectroscopy Simon J. Attwood 1 , Youngjik Choi 2 and Zoya Leonenko 1,2,3, * 1 Department of Physics and Astronomy, University of Waterloo, Waterloo, ON N2L 3G1, Canada; E-Mail: [email protected] 2 Department of Biology, University of Waterloo, Waterloo, ON N2L 3G1, Canada; E-Mail: [email protected] 3 Waterloo Institute for Nanotechnology, University of Waterloo, Waterloo, ON N2L 3G1, Canada * Author to whom correspondence should be addressed; E-Mail: [email protected]; Tel.: +1-519-888-4567. Received: 31 December 2012; in revised form: 29 January 2013 / Accepted: 1 February 2013 / Published: 6 February 2013 Abstract: Cell membranes are typically very complex, consisting of a multitude of different lipids and proteins. Supported lipid bilayers are widely used as model systems to study biological membranes. Atomic force microscopy and force spectroscopy techniques are nanoscale methods that are successfully used to study supported lipid bilayers. These methods, especially force spectroscopy, require the reliable preparation of supported lipid bilayers with extended coverage. The unreliability and a lack of a complete understanding of the vesicle fusion process though have held back progress in this promising field. We document here robust protocols for the formation of fluid phase DOPC and gel phase DPPC bilayers on mica. Insights into the most crucial experimental parameters and a comparison between DOPC and DPPC preparation are presented. Finally, we demonstrate force spectroscopy measurements on DOPC surfaces and measure rupture forces and bilayer depths that agree well with X-ray diffraction data. We also believe our approach to decomposing the force-distance curves into depth sub-components provides a more reliable method for characterising the depth of fluid phase lipid bilayers, particularly in comparison with typical image analysis approaches.
Transcript of Preparation of DOPC and DPPC Supported Planar Lipid Bilayers for

Int. J. Mol. Sci. 2013, 14, 3514-3539; doi:10.3390/ijms14023514OPEN ACCESS
International Journal ofMolecular Sciences
ISSN 1422-0067www.mdpi.com/journal/ijms
Article
Preparation of DOPC and DPPC Supported PlanarLipid Bilayers for Atomic Force Microscopy and AtomicForce Spectroscopy
Simon J. Attwood 1, Youngjik Choi 2 and Zoya Leonenko 1,2,3,*
1 Department of Physics and Astronomy, University of Waterloo, Waterloo, ON N2L 3G1, Canada;
E-Mail: [email protected] Department of Biology, University of Waterloo, Waterloo, ON N2L 3G1, Canada;
E-Mail: [email protected] Waterloo Institute for Nanotechnology, University of Waterloo, Waterloo, ON N2L 3G1, Canada
* Author to whom correspondence should be addressed; E-Mail:[email protected];
Tel.: +1-519-888-4567.
Received: 31 December 2012; in revised form: 29 January 2013 / Accepted: 1 February 2013 /
Published: 6 February 2013
Abstract: Cell membranes are typically very complex, consisting of a multitude of different
lipids and proteins. Supported lipid bilayers are widely used as model systems to study
biological membranes. Atomic force microscopy and force spectroscopy techniques are
nanoscale methods that are successfully used to study supported lipid bilayers. These
methods, especially force spectroscopy, require the reliable preparation of supported lipid
bilayers with extended coverage. The unreliability and a lack of a complete understanding
of the vesicle fusion process though have held back progressin this promising field. We
document here robust protocols for the formation of fluid phase DOPC and gel phase
DPPC bilayers on mica. Insights into the most crucial experimental parameters and a
comparison between DOPC and DPPC preparation are presented. Finally, we demonstrate
force spectroscopy measurements on DOPC surfaces and measure rupture forces and bilayer
depths that agree well with X-ray diffraction data. We also believe our approach to
decomposing the force-distance curves into depth sub-components provides a more reliable
method for characterising the depth of fluid phase lipid bilayers, particularly in comparison
with typical image analysis approaches.
Int. J. Mol. Sci. 2013, 14 3515
Keywords: DOPC; DPPC; AFM; force spectroscopy; supported lipid bilayer; vesicle fusion;
breakthrough forces; force volume
1. Introduction
The surfaces of cell plasma membranes play a pivotal role in many biological processes including
cell recognition, signalling, selective-ion transfer, adhesion and fusion [1]. The composition and lateral
organisation of native membranes are complex, consisting for example of mixtures of phospholipids,
glycolipids and various proteins. Such complexity makes the task of identifying the specific effects of
membrane interactions with other molecules very difficult.Therapeutic drugs or protein molecules may
target specific receptors, but also may interact non-specifically with the lipid membrane itself [2,3]. By
simplifying the system, it is possible to systematically study the sub-components of cellular membranes
and therefore gain valuable insights that would otherwise be obscured.
Atomic Force Microscopy is a very powerful technique that can be used to study not only the
topographical changes but also a range of biomechanical properties. There has been a lot of interest
recently in planar supported lipid bilayers (SLB) as model systems, comprised of either single or
multiple component lipids, prepared either using vesicle fusion [4–12], or Langmuir–Blodgett or
Langmuir–Schaefer deposition [13–15]. There are generally two approaches to studying these systems
with the Atomic Force Microscope. Firstly, AFM imaging can be performed by scanning the AFM probe
across the surface of a lipid bilayer, which provides information on the topographical characteristics
of the supported lipid bilayer, such as the lateral extent ofdomains, roughness and height of patches
relative to the substrate. Then, after addition of an effector molecule of interest, the surface topography
can be re-assessed. We can also find the timescale of the interaction by imaging the surface after
incremental time steps and at each point assess the changes.Examples of these type of studies
include lipid interactions with anesthetic halothane [16,17], ethanol [16], antibiotic azithromycin
[18,19], immunodeficiency peptide [7], peptide gramicidin [20], amyloid beta [21–24], model peptide
WALP23 [25].
The second approach is to apply force spectroscopy to assessthe biomechanical changes due to
some effector molecule. In this technique AFM probes are brought towards the supported lipid bilayer
and a load increasingly applied until the bilayer ruptures and the probe senses the underlying hard
substrate. Afterwards the probe is withdrawn and the cycle is repeated many times. The rupture
events are manifested by a well-defined discontinuity in theforce-distance approach curves, which
can subsequently be analysed to determine the magnitude of the rupture force or break-through-force.
The average or most probable rupture force has shown to be a fingerprint for the intrinsic properties
of the bilayer. The effect of pH [26], ionic strength of medium [27], deposition pressure [28],
temperature [29] and head/tail group composition [30] on membrane structure and function have all
been studied. Furthermore, the effect of various proteins and drugs have also been studied, including
Myelin based protein [31,32], cytochrome-c [31], bax protein [33], cholesterol [34–36], Synapsin I [37],
general anesthetic halothane [17] and antibiotic azithromycin [19]. Atomic force spectroscopy (AFS)
Int. J. Mol. Sci. 2013, 14 3516
is commonly performed in a force volume mode in order to collect a statistically sound set of data.
This requires defect-free supported planar lipid bilayerscovering extended areas. In all of these studies
an essential prerequisite is a well-developed protocol that can consistently be used to prepare lipid
bilayers [38].
In the current work we detail two protocols that have been developed for preparing both fluid and
gel phase planar bilayers on mica for use in AFM studies. Dioleoylphosphatidylcholine (DOPC) has a
transition temperature of−16.5 C [39] and therefore exists in the fluid like liquid crystalline state (Lα) at
room temperature. Dipalmitoylphosphatidylcholine (DPPC) has a transition temperature of41.3 C [40]
and therefore exists in the solid-like gel state (Lβ) at room temperature. Lipids in different states can
affect membrane functionality very differently and we therefore chose two lipids to represent the two
main lipid phase classes. Furthermore, phospholipids containing the choline group moiety are the most
abundant class in eukaryotic cells [41]. We also note that DOPC and DPPC are two of the most common
model lipid systems studied.
We report defect-free bilayers that are ideally suited for AFM studies. We highlight the most
significant experimental parameters, and introduce tests that can be used to confirm the presence of
bilayer. We present optimization approaches to account forsolution to solution differences that are
difficult to control. We then highlight the major differences between fluid and gel phase lipids by
presenting a protocol for the formation of DPPC bilayers. Weillustrate through experiment the effect of
parameters such as solution temperature, cooling rate, incubation time, concentration and ionic strength.
Without a thorough understanding of bilayer preparation, it is easy to produce misleading results.
Even mature protocols are reported to take several months ofpractice before these model systems can
be accurately and reliably reproduced [38]. We hope to highlight the relative importance of various
experimental parameters, illustrate the significant differences between gel and fluid phase lipids, and
present important tests for bilayer assessment. Debate still continues about the best way to prepare
bilayer samples and the important experimental parametersas evident by every single laboratory using
a different protocol. We hope that through this work, scientists new to the field can quickly and reliably
produce model bilayer systems for their study.
Finally, we illustrate the effectiveness of the DOPC protocol by assessing the DOPC surface with
force spectroscopy. Without a reliable, robust and defect-free bilayer surface, it is easy for the tip to
get contaminated, producing inconsistent and misleading results. We demonstrate that rupture force
and depth values can easily be obtained in good agreement with other AFM studies. We believe that
obtaining the depth characteristics of a bilayer from the force spectroscopy measurements is a much
more accurate and representative measure of the bilayer thickness. Our values agree well with previous
X-ray diffraction studies.
2. Results and Discussion
2.1. DOPC Bilayers from Vesicles in Water
The AFM is a very powerful tool for determining the topography of materials at the nanoscale and
has the distinct advantage over other techniques in that it can be used in liquid over a range of salt

Int. J. Mol. Sci. 2013, 14 3517
concentrations and pH values. This makes it particularly amenable to the study of biological systems
where physiological conditions are important. In the case of synthetic bilayers, which are important
cell analogues, experiments must be carried out at least in pure water, as their assembly and stability is
primarily driven by the hydrophobicity of these amphiphilic molecules.
A deficiency of the AFM is its inability to truly probe three dimensions. Topography maps lack
a depth component into the sample and are really two dimensional surface maps. From a practical
viewpoint, it is therefore very difficult to distinguish single bilayers that completely cover the surface
from multilayers and/or bare mica, all of which would produce a completely featureless image. There
are tricks however that can be employed to overcome some of these problems.
Figure 1. Time series of DOPC bilayer formation. Four separate samples of DOPC bilayers
on mica were prepared that were incubated for (A) 5min; (B) 10min; (C) 17min and
(D) 20min. Below each image is an illustration of the state of the lipidcoverage across the
mica surface. The time series experiment is a good way of determining that a complete single
bilayer covers the mica surface. Without doing the time series experiment, it is very difficult
to distinguish a complete single bilayer from multilayer oreven bare mica. In addition, when
faced with a DOPC sample with partial patchy coverage, it is asimple task to prepare a new
sample with a slightly increased incubation time that will result in continuous coverage. All
images were taken in pure water at room temperature.
Protocols for the preparation of DOPC liposome solutions and sample preparation by vesicle fusion
are described in detail in the experimental section. In order to produce and verify that a complete bilayer
has been formed on the mica surface, we find it necessary to perform a time series of experiments. That
is, we prepare several samples each incubated with the liposome solution for slightly different times.
Thus, we are able to capture the sample at different stages during formation and, by washing, halt any
further progress. As shown in Figure1, this allows us to very precisely determine the exact experimental
conditions for the specific liposome solution being used, which will produce complete coverage (we
observe continuous bilayers for> 30µm2 areas). There are several methods for confirming whether
we observe single bilayer patches spreading across a mica surface versus patches of bilayer forming
on top of a complete first bilayer (or multilayer). Firstly, the phase signal, which is thought to reflect
differences in mechanoelastic and surface chemical properties, can be used; if we see a large difference
in phase (1–2 degrees for Agilent AFM) between the bilayer patches and the underlying surface, then
Int. J. Mol. Sci. 2013, 14 3518
this is a good indication that we are observing mica beneath the bilayer patches. However, if the tip gets
contaminated, which is very likely whilst imaging the soft DOPC bilayers, then the contrast will not
be as great and making a firm conclusion is difficult. We also know that if we incrementally decrease
the time or concentration any further than as in the least covered surface, we will only see featureless
samples, indicative of bare mica.
It should be noted that it has previously been thought that the addition of calcium or other divalent
cations was an essential step to forming bilayers on mica surfaces [38,42–44]. However we have
unequivocally demonstrated here that bilayers on mica can be formed by vesicle fusion in pure water.
Such systems may be useful for example when trying to excludeion mediated interactions.
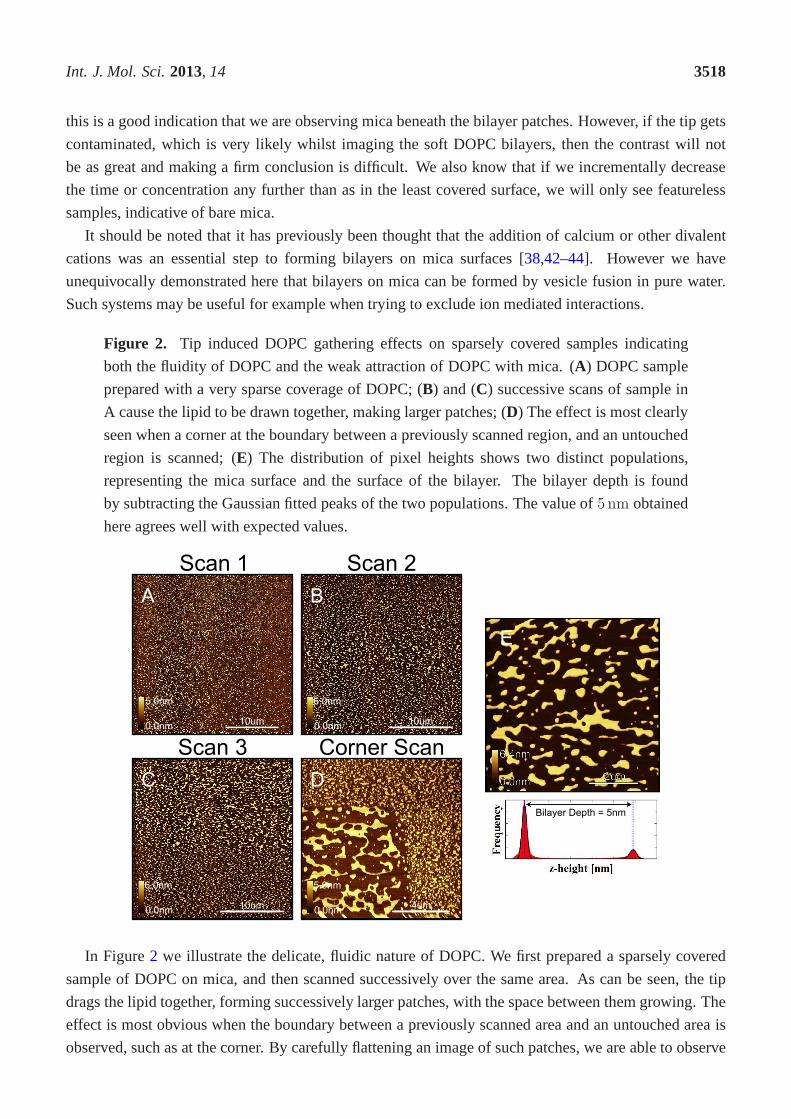
Figure 2. Tip induced DOPC gathering effects on sparsely covered samples indicating
both the fluidity of DOPC and the weak attraction of DOPC with mica. (A) DOPC sample
prepared with a very sparse coverage of DOPC; (B) and (C) successive scans of sample in
A cause the lipid to be drawn together, making larger patches; (D) The effect is most clearly
seen when a corner at the boundary between a previously scanned region, and an untouched
region is scanned; (E) The distribution of pixel heights shows two distinct populations,
representing the mica surface and the surface of the bilayer. The bilayer depth is found
by subtracting the Gaussian fitted peaks of the two populations. The value of5 nm obtained
here agrees well with expected values.
In Figure2 we illustrate the delicate, fluidic nature of DOPC. We first prepared a sparsely covered
sample of DOPC on mica, and then scanned successively over the same area. As can be seen, the tip
drags the lipid together, forming successively larger patches, with the space between them growing. The
effect is most obvious when the boundary between a previously scanned area and an untouched area is
observed, such as at the corner. By carefully flattening an image of such patches, we are able to observe
Int. J. Mol. Sci. 2013, 14 3519
two distinct populations, representing the mica surface and the top surface of the bilayer. By fitting
two Gaussian distributions and then subtracting the difference between the peak heights, we find that
the bilayer depth is5 nm. The precision of this measurement is very high (standard error of the mean
< 0.02%), however the largest uncertainty in this measurement is due to the force setpoint. By scanning
with a higher force, it is easy to compress the bilayer, measuring slightly less than the “true” depth, and
by scanning with a low force, it is possible that longer rangerepulsive forces play a role, resulting in an
overestimation. We believe a quantitative approach to depth measurement of soft bilayer systems can
only be achieved by analysing force distance curves.
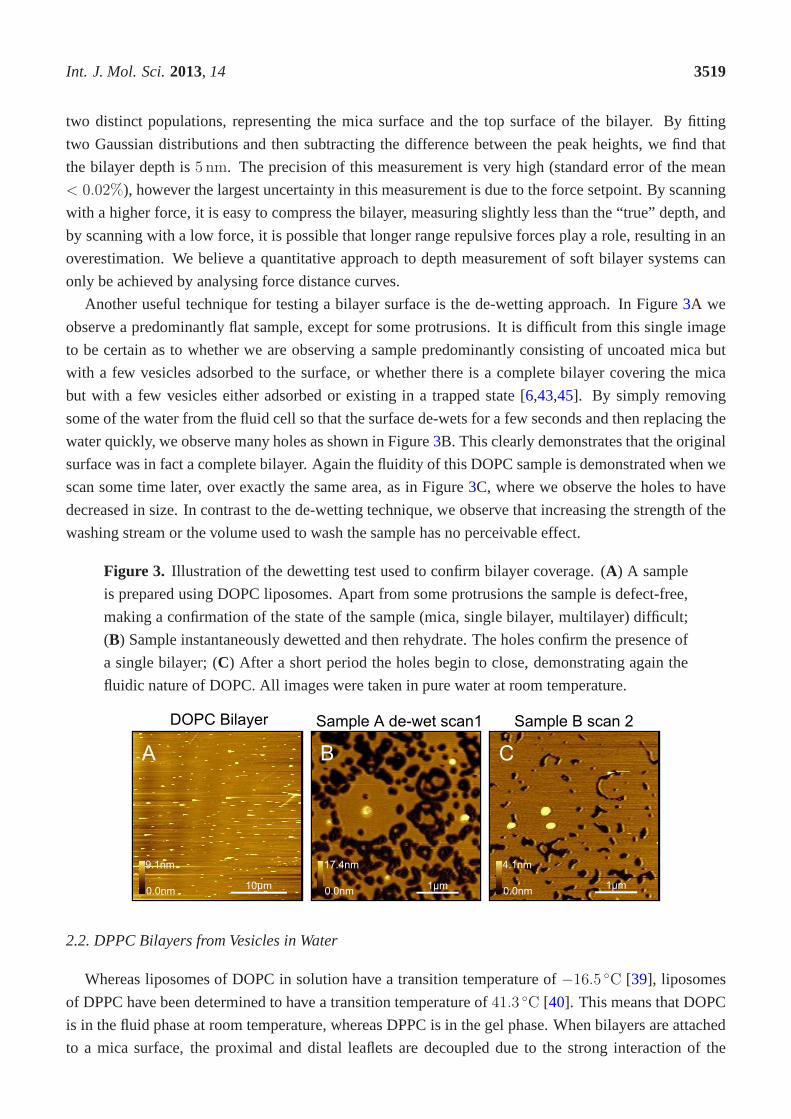
Another useful technique for testing a bilayer surface is the de-wetting approach. In Figure3A we
observe a predominantly flat sample, except for some protrusions. It is difficult from this single image
to be certain as to whether we are observing a sample predominantly consisting of uncoated mica but
with a few vesicles adsorbed to the surface, or whether thereis a complete bilayer covering the mica
but with a few vesicles either adsorbed or existing in a trapped state [6,43,45]. By simply removing
some of the water from the fluid cell so that the surface de-wets for a few seconds and then replacing the
water quickly, we observe many holes as shown in Figure3B. This clearly demonstrates that the original
surface was in fact a complete bilayer. Again the fluidity of this DOPC sample is demonstrated when we
scan some time later, over exactly the same area, as in Figure3C, where we observe the holes to have
decreased in size. In contrast to the de-wetting technique,we observe that increasing the strength of the
washing stream or the volume used to wash the sample has no perceivable effect.
Figure 3. Illustration of the dewetting test used to confirm bilayer coverage. (A) A sample
is prepared using DOPC liposomes. Apart from some protrusions the sample is defect-free,
making a confirmation of the state of the sample (mica, singlebilayer, multilayer) difficult;
(B) Sample instantaneously dewetted and then rehydrate. The holes confirm the presence of
a single bilayer; (C) After a short period the holes begin to close, demonstrating again the
fluidic nature of DOPC. All images were taken in pure water at room temperature.
2.2. DPPC Bilayers from Vesicles in Water
Whereas liposomes of DOPC in solution have a transition temperature of−16.5 C [39], liposomes
of DPPC have been determined to have a transition temperature of41.3 C [40]. This means that DOPC
is in the fluid phase at room temperature, whereas DPPC is in the gel phase. When bilayers are attached
to a mica surface, the proximal and distal leaflets are decoupled due to the strong interaction of the

Int. J. Mol. Sci. 2013, 14 3520
proximal leaflet with the mica surface [46] leading to a broadening of the transition temperature to
between41 C and46 C. AFM based studies demonstrated that there is a transition temperature width
of 10 C [47] for single bilayers on mica. Even with substrate induced broadening of the transition
temperature, it is clear that DPPC is in the gel phase at room temperature. The dynamics of vesicle
fusion are completely different for lipids in the gel phase compared with the fluid phase. Typically it
is reported that DPPC vesicles should be heated above the transition temperature (50–60C) in order
for them to fuse with the mica surface and form planar bilayers [23,38,48]. We typically observe that
DPPC vesicles in water deposited at room temperature eitherpartially fuse, or only form a vesicle layer.
However, we demonstrate later that for high concentrationsof DPPC solution deposited for short time
periods before washing, the vesicles will fuse to mica at room temperature.
Figure 4. DPPC domains observed at room temperature. (A) DPPC liposome solution in
pure water was added to a fluid cell at60 C. After 5min incubation the sample was washed
and allowed to cool with the heater off∼ 5 Cmin−1 . Lipid completely covers the surface
with two different domains with a height difference of∼ 2 nm; (B) The same sample was
reheated to60 C, held at that temperature for5min and cooled at5 Cmin−1 . Holes in the
lipid exposing mica appear after re-heating, which are thought to be due to lipid loss into
the liquid.
We prepared DPPC liposomes using the general protocol described in the experimental section, with
the lipid at0.3mgml−1 . The solution was then added to a fluid cell containing mica maintained at60 C
using the heating stage. After5min the sample was washed with water and allowed to cool at room
temperature (∼ 5 Cmin−1 ). Previous experiments (data not shown) with low lipid concentrations
(< 0.5mgml−1 ) demonstrated that the vesicles would not fuse to mica at room temperature. However,
as shown in Figure4A, when heating in-situ, the vesicles are able to fuse. We observe complete bilayer
coverage across the mica surface, however we very distinctly observe∼ 2 nm high domains. We then
reheated the sample to60 C, which was maintained for5min, and then cooled the sample (5 Cmin−1 )
to room temperature. We now observe holes in the bilayer surface exposing mica, due to lipid loss to
Int. J. Mol. Sci. 2013, 14 3521
the water [29], allowing us to clearly see the three levels correlating tobare mica, a low DPPC domain,
and a high DPPC domain. The highest domain appears to be about6 nm in height, consistent with
DPPC in its gel phase [25,47,49]. Furthermore, we see that the higher domains have become larger
in size and more uniform at their edges, suggesting a re-organization has occurred due to the extra
heating step. Similar domains have been reported before [23,29,47,50] at room temperature although the
domains were usually much smaller and experiments were carried out in buffer with salt. It is not clear
exactly what they are due to, however they are usually attributed to either interdigitation, or tilting of
the lipids. These experiments have been repeated using a liposome solution that was prepared straight
from powdered DPPC, so as to be completely certain that thereare no trace solvents in the solution. The
results were qualitatively identical to those presented here.
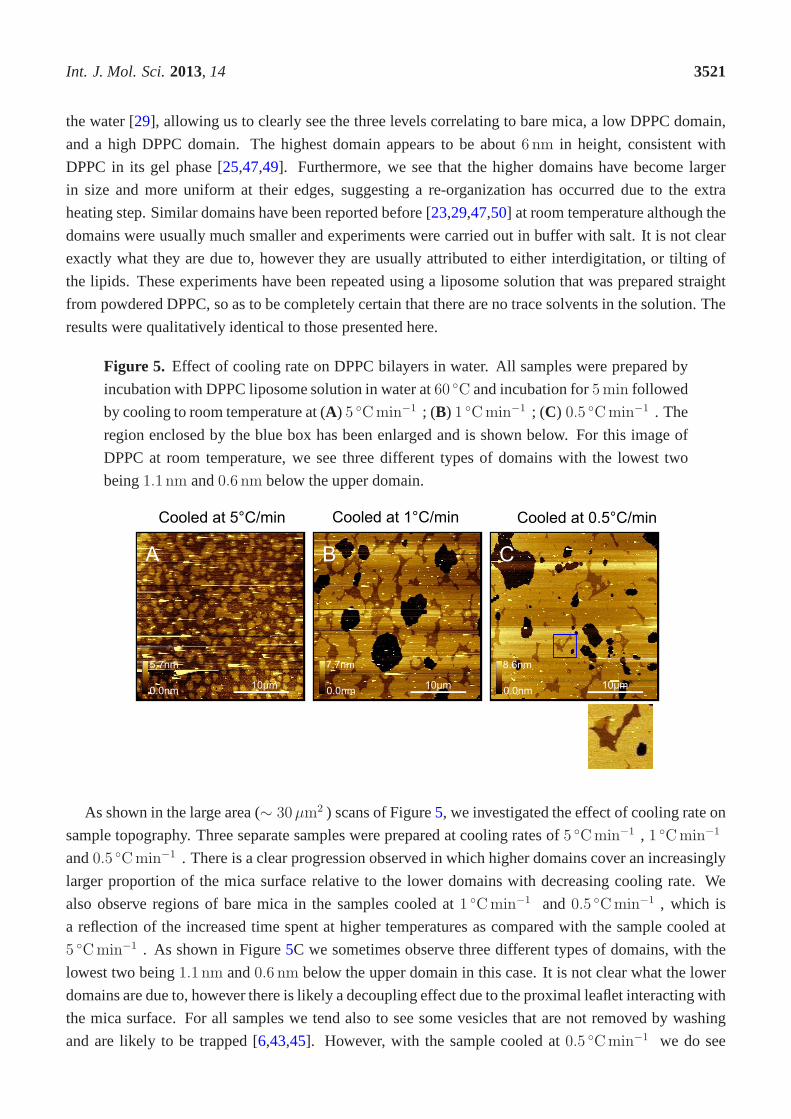
Figure 5. Effect of cooling rate on DPPC bilayers in water. All sampleswere prepared by
incubation with DPPC liposome solution in water at60 C and incubation for5min followed
by cooling to room temperature at (A) 5 Cmin−1 ; (B) 1 Cmin−1 ; (C) 0.5 Cmin−1 . The
region enclosed by the blue box has been enlarged and is shownbelow. For this image of
DPPC at room temperature, we see three different types of domains with the lowest two
being1.1 nm and0.6 nm below the upper domain.
As shown in the large area (∼ 30µm2 ) scans of Figure5, we investigated the effect of cooling rate on
sample topography. Three separate samples were prepared atcooling rates of5 Cmin−1 , 1 Cmin−1
and0.5 Cmin−1 . There is a clear progression observed in which higher domains cover an increasingly
larger proportion of the mica surface relative to the lower domains with decreasing cooling rate. We
also observe regions of bare mica in the samples cooled at1 Cmin−1 and0.5 Cmin−1 , which is
a reflection of the increased time spent at higher temperatures as compared with the sample cooled at
5 Cmin−1 . As shown in Figure5C we sometimes observe three different types of domains, with the
lowest two being1.1 nm and0.6 nm below the upper domain in this case. It is not clear what the lower
domains are due to, however there is likely a decoupling effect due to the proximal leaflet interacting with
the mica surface. For all samples we tend also to see some vesicles that are not removed by washing
and are likely to be trapped [6,43,45]. However, with the sample cooled at0.5 Cmin−1 we do see

Int. J. Mol. Sci. 2013, 14 3522
extended regions several micrometers square of defect-free bilayer that could be used to test interactions
with other molecules either by surface imaging or force spectroscopy.
We also tested the effect of changing the temperature of the mica in the fluid cell. When only
39 C is maintained, we see a dramatic reduction in the number of lower domains compared with a
sample prepared at60 C as shown in Figure6. The trend of decreasing lower domains with decreasing
temperature continues down to33 C where the domains are almost completely eliminated. However,
at 30 C we start to observe unfused vesicles. This suggests that although the transition temperature
for a DPPC liposome solution is41 C, they will fuse with mica in pure water at and above33 C.
Thus it seems the minimum temperature for complete vesicle fusion is well below the lipid transition
temperature. However, for these samples prepared between33 C and39 C, we observe many more
protrusions across the surface, suggesting that trapped vesicles are more likely to form at these lower
temperatures. Reimhultet al. [45] made the same observation with eggPC (transition temperature
∼ −15 C) using the Quart Crystal Microbalance technique. We also tested a sample prepared at33 C
and cooled at0.5 Cmin−1 , for which we observe the lower domains completely eliminated (data not
shown as very similar to Figure6E).
Figure 6. Effect of mica temperature during deposition. All samples were prepared with a
cooling rate of5 Cmin−1 . Mica temperature during deposition was: (A) 60 C; (B) 39 C;
(C) 37 C; (D) 35 C; (E) 33 C; (F) 30 C. Lower domains decrease dramatically as a
proportion of total lipid coverage between60 C and39 C, after which a slow decrease is
observed to33 C. At 30 C we mostly observe unfused vesicles. Protrusions thought tobe
trapped vesicles are seen for all samples but dominate for temperatures below60 C.

Int. J. Mol. Sci. 2013, 14 3523
Figure 7. Assigning identity to protrusions observed in bilayer samples. The schematics
illustrate three possible variants that may lead to the protrusions seen in DPPC bilayer
samples: trapped vesicle, adsorbed vesicle and partially fused vesicle.
Although we mentioned earlier that the protrusions are likely to be trapped vesicles, it is actually very
difficult to be certain about the exact form that they take. Asshown in Figure7 we suggest that they
could be either trapped vesicles, adsorbed vesicles or partially fused vesicles. In order to gain insights
into this process, we prepared a new liposome solution at1mgml−1 and diluted it to create samples
at 0.5mgml−1 , 0.33mgml−1 and0.17mgml−1 and deposited at33 C. Higher resolution images of
these samples are shown in Figure8. At 0.5mgml−1 , we observe a complete bilayer, but with partially
fused bilayer patches adsorbed on top. When the solution is diluted to0.33mgml−1 , we see a decrease
in the quantity of the adsorbed bilayer patches, and some holes in the first bilayer that expose the mica
surface. When the solution is diluted to0.17mgml−1 , we see the mica is only partially covered, and that
although there are some flat bilayer patches, a good proportion of them appear to exist in the partially
fused state. It seems that preparing bilayers at these lowertemperatures in water results in partially fused
vesicles that lead to the protrusions observed. Although lower domains and holes can be eliminated at
lower temperatures, the drawback is that partially fused vesicles are inevitable. Such a surface is not
ideally suited as a model test surface. Samples created at higher temperatures, although lacking vesicle
type protrusions, are also not ideal as the tip can more easily get contaminated at the edge of holes in
the bilayer.
Interestingly, we observe a very similar trend when varyingthe incubation time of a1mgml−1 DPPC
solution. As shown in Figure9, we vary the incubation time from0min (sample immediately washed
after deposition, actual incubation time< 2 sec) to 3min. At the shortest incubation time, we observe
patchy coverage across the mica surface, including partially fused vesicles. The coverage increases in a
time-dependent manner, and at the longest incubation time we again observe a complete bilayer but with
lipid patches and partially fused vesicles across the surface. Based on this, it seems that an increase in
incubation time is equivalent to an increase in concentration. Another important point to note is that in
this case these samples were prepared at room temperature. It seems therefore that although vesicles are
not able to completely fuse when at lower concentrations (∼ 0.3mgml−1 ) and below33 C, vesicles
will completely fuse even at room temperature when the concentration is high enough. Therefore, this
suggests that there is interdependence between the concentration and the temperature at which vesicles
will fuse.

Int. J. Mol. Sci. 2013, 14 3524
Figure 8. Dilution test for samples prepared at33 C. DPPC samples in water were prepared
at (A) 0.5mgml−1 ; (B) 0.33mgml−1 and (C) 0.17mgml−1 . By diluting the liposome
solution to the point where bare mica is seen in the samples, we are able to see the very
initial stages of vesicle fusion, which indicate protrusions are partially fused vesicles. Below:
Schematics illustrating proposed generalised models for respective samples.
Figure 9. Variation of short incubation times when using a DPPC solution of high
concentration (1mgml−1 ). Incubation times of (A) 0min; (B) 1min and (C) 3min. The
increase in surface coverage with increasing incubation time is qualitatively the same as seen
for experiments increasing the concentration.
In Figure10we demonstrate the dewetting test for DPPC. In this case we removed the liquid from the
fluid cell carefully until the surface was instantaneously dewetted, after which water was immediately
replenished. The surface was re-imaged, and then the dewetting step repeated again followed by a
final image being taken. As can be seen, holes are formed afterthe initial dewetting, which become
larger after the second dewetting step. As with DOPC, this isa good test used to verify that the surface
was completely covered with a first layer of lipid. In addition we can see that dewetting seems to

Int. J. Mol. Sci. 2013, 14 3525
preferentially remove the bilayer patches from the top as opposed to the vesicle structures. As with
DOPC, we also tested the effect of various washes with increased force but again observed no change
in the bilayer topography. We also tested the effect of washing with a buffer at a different ionic
strength (PBS) followed by again washing with water, for which we also observe no change in the
surface topography.
Figure 10. Illustration of the dewetting test for DPPC. The sample bilayer in (A), which
is very similar to the bilayer in Figure9C, was dewetted instantaneously and immediately
rehydrated (B); The dewetting step was repeated a second time (C). The holes in the bilayer
become progressively larger after each successive wash. The test proves that the sample in
(A) was a complete bilayer with partially fused lipid patches on top.
2.3. DPPC Bilayers from Vesicles in Buffered Salt Solutions
We see in the literature that bilayers can be prepared both inpure water and in solutions containing
buffers and salts of various types and concentrations. It isalso reported in the literature that
divalent cations such asCa2+ or Mg2+ are very important in aiding fusion of vesicles to mica
surfaces [42,43,51]. We therefore tested two buffers, one containing only NaCland HEPES buffer
(HEPES-NaCl: 10mM HEPES,150mM NaCl, pH 7.4), and another in addition containing20mM
Mg2+ (HEPES-NaCl-Mg:10mM HEPES,150mM NaCl,20mM MgCl2, pH 7.4).
Figure 11. DPPC bilayers prepared from a HEPES-NaCl liposome solution. Bilayers
prepared at (A) 60 C; (B) 65 C and (C) 70 C. We observe continuous fusion only when
the sample plate is maintained at70 C; below this temperature mostly observed are vesicles
with occasional fused patches.

Int. J. Mol. Sci. 2013, 14 3526
We see in Figure11 that vesicles do not fuse to mica unless the deposition temperature is raised to
70 C. Below this temperature, we see a combination of small fusedbilayer patches and unfused vesicles.
Samples were prepared using liposomes in HEPES-Mg at exactly the same concentration
(0.06mgml−1 ) and deposition time (2min) as for the HEPES-NaCl samples shown in Figure11. We
see from Figure12 that at50 C a vesicle layer is formed. By increasing the force whilst scanning, we
are able to fuse the vesicles to some extent as shown by the contrasting horizontal regions of fused and
unfused regions. From55 C to 70 C we clearly see that the bilayer has fused, however quite a lotof
holes still appear. The change in minimum temperature for complete vesicle fusion of DPPC liposomes
at 0.06mgml−1 between HEPES-NaCl buffer and HEPES-NaCl-Mg buffer from∼ 70 C to ∼ 55 C
is thought to be due to the increased attraction between positively charged liposomes and negatively
charged mica. It has been shown that for DMPC liposomes, which have the same head group as DPPC,
the charge on the liposomes can vary depending on the ionic strength of the medium [48]. In the case of
pure water, they observe a strong repulsion due to negative charges, whereas in 100–150mM NaCl the
liposomes are close to neutral. With150mM NaCl plus20mM MgCl2, they observe a repulsion due to
positive charges.
Figure 12. DPPC bilayers prepared from a HEPES-NaCl-Mg liposome solution. Bilayers
prepared at (A) 50 C; (B) 55 C; (C) 65 C; (D) 70 C. When the sample plate is maintained
at50 C we only observe a vesicle layer, which can be partially fusedby the tip as indicated
by the horizontal streaks in A. For55 C, 65 C and 70 C deposition temperatures, we
observe extended regions of fused bilayer. More domains areobserved for the highest
temperatures. Samples were prepared using liposomes in HEPES-Mg at exactly the same
concentration (0.06mgml−1 ) and deposition time (2min) as for the HEPES-NaCl samples
shown in Figure11.

Int. J. Mol. Sci. 2013, 14 3527
Figure13A shows another DPPC sample prepared in HEPES-Mg, similar tothe samples shown in
Figures12B–D except that it was incubated at60 C and for60min as opposed to just2min. The sample
is very similar to those prepared for shorter incubation times, indicating that increasing the time further
has little effect on the quality of the bilayer. We note that by increasing the force that the tip images
with, we are able to superficially make the sample appear smoother, with less trapped vesicles. Although
some of the vesicles were dislodged and moved away whilst scanning, many of them still remain and the
surface mainly looks much cleaner because the tip is tracking across the surface of the vesicles better
with the higher force. At these higher forces however, damage can occur to the sample. We see a
higher resolution scan in Figure13C. A few lines of this area were then scanned with much increased
force (Figure13D), which then causes holes to appear with the second pass at amuch lighter force. In
addition to the formation of holes, we see that some holes fillin even when scanning relatively lightly.
Although the extent of tip induced changes is far less than with fluidic DOPC, we still see that DPPC
is quite easily deformed by the tip. We believe that the quality of the bilayer shown in Figure13D is
comparable to DPPC bilayers presented by several other groups, which used their DPPC samples as test
systems to assess changes due to other proteins/peptides ordrug interactions [16,23,25,30,47,50,52].
Figure 13. DPPC sample prepared from HEPES-NaCl-Mg liposome solutionand incubated
at60 C for 60min. (A) Light force scanning highlights vesicles; (B) Higher force scanning
makes the sample appear more continuous than it really is. Although some vesicles were
dislodged and swept away, the smoother appearance of the surface is mostly due to the tip
tracking across the vesicles better; (C) Extended regions of defect-free bilayer are observed;
(D) A few lines of (C) were scanned with a high force and then scanned lightly again (area
enclosed by red box). We see holes due to the hard scanning. Wealso see holes disappearing
even with relatively light scanning (area enclosed by red circle), indicating that the DPPC
bilayers are delicate and dynamic, although much less so than DOPC.

Int. J. Mol. Sci. 2013, 14 3528
Overall we do not observe any significant improvement in the quality of the DPPC bilayer surface
(extent of flat regions, absence of holes, domains or trappedvesicles) when comparing bilayers prepared
in water (Figure5C), HEPES-NaCl (Figure11C) or HEPES-NaCl-Mg (Figure12D). However, these
samples were prepared with slightly different experimental conditions; pure water:Cl = 0.3mgml−1 ,
td = 5min, Td = 60 C, Rc = 0.5 Cmin−1 ; HEPES-NaCl:Cl = 0.06mgml−1 , td = 2min, Td =
70 C, Rc = 5 Cmin−1 ; HEPES-NaCl-Mg:Cl = 0.06mgml−1 , td = 2min, Td = 55 C, Rc =
5 Cmin−1 (Cl, td, Td, Rc are lipid concentration, deposition time, deposition temperature and cooling
rate respectively).
Generally we observe that DPPC bilayers prepared in either HEPES-NaCl or HEPES-NaCl-Mg form
fused bilayers with less concentrated solutions and with less time than compared with vesicles prepared
in pure water alone. In order to prepare fluid phase DOPC bilayers in pure water, we need higher
concentration (> 0.5mgml−1 ) and longer incubation time (∼ 15min). Generally we are able to use
much faster cooling rates for DPPC samples prepared in either buffer and see fewer domains compared
with samples prepared in pure water, for which a high proportion of the sample surface contains lower
domains unless very slow cooling rates are used. Since DOPC is in the fluid phase at room temperature,
we never observe domain formation during sample preparation. We also observe interdependence
between lipid concentration and the minimum temperature atwhich vesicles fuse for DPPC. We observe
that although vesicles are not able to fuse when at lower concentrations (∼ 0.3mgml−1 ) and below
33 C, vesicles will fuse even at room temperature when the concentration is high enough (1mgml−1 ).
2.4. Force Spectroscopy of DOPC Bilayers
During a typical force spectroscopy experiment, the tip successively approaches and leaves
the surface in a cyclic manner. The force experienced by the cantilever is detected and then
plotted against the z-piezo displacement or tip-sample separation. During each cycle the x- and
y-coordinates are typically fixed, however in order to get a more reliable measure of the surface
properties, the tip is typically moved laterally between cycles, in an approach often referred to as
“force volume mapping” [53]. This is illustrated schematically in Figure14C. Collecting data at several
different points across a surface is preferable over measurements at a single point, since slight deviations
in bilayer properties can be averaged, giving a more representative measurement. However, as seen
in the image, if the bilayer is full of holes, the tip can easily become contaminated at the mica–lipid
edges, resulting in misleading results. It is imperative therefore that the bilayer be continuous for
such measurements.
Figure14 illustrates the most important features of a typical force-distance curve exhibiting a rupture
event associated with a fluid-like lipid bilayer. Typically, the rupture force (FB), bilayer depth (zA−B) and
Young’s modulus (E) may be determined from the approach curve. In addition, theforce of adhesion
(Fadh) and work of adhesion (Wadh) may be determined from the retract curve. For the current work
however, we focus just on the rupture force and depth measurements. All of the significant discontinuities
in the approach curve have been labeled (A–D). The physical significance of these points and their
transitions is interpreted as follows; (A) First contact ofthe tip with the top surface of the bilayer; (A–B)
elastic compression of the bilayer; (B) Rupture of the uppersurface of the bilayer; (B–C) Rapid tip

Int. J. Mol. Sci. 2013, 14 3529
transition through the central portion of the bilayer; (C) On-set of increased repulsion associated with
compression of proximal head groups, water layer [54] and other trapped material; (C–D) Compression
of trapped material; (D) Tip in direct contact with mica surface.
Figure 14. (A) Schematic force-distance plot highlighting the most significant features of
a typical rupture event associated with a fluid-like lipid bilayer. From the approach curve
(blue), the rupture forceFB, the bilayer depthzA−D and the Young’s modulusE may be
determined. From the retract curve (red), the maximum forceof adhesionFadh and the work
of adhesionWadh may be determined; (B) Schematic illustrating tip penetration through
the bilayer (not to scale); (C) A 16 × 16 grid illustrating “force volume mapping”, where
force-distance curves are conducted at each point on a grid across a surface (in this case
4µm× 4µm).
We are able to get several different measures of the bilayer depth. The full depth of the bilayer
may be considered to be the distance between points A and D (zB−D). It should be noted however that
several factors can lead to over- or under-estimation of thebilayer depth using this approach. Point A
is not always well-defined, for example, due to long range electrostatic repulsion leading to a curved
region around A, and a similar problem may be observed aroundD. The nature of the curve about these
discontinuities is dependent on the tip chemistry, the ionic strength of the medium and lipid composition
and phase. Typically ill-defined contact regions have been observed when a bilayer has formed on the
tip, creating strong repulsion for example due to hydrationeffects [37,55]. For these reasons, the depth
zB−D is typically quoted in the literature and often referred to as the “jump depth”.
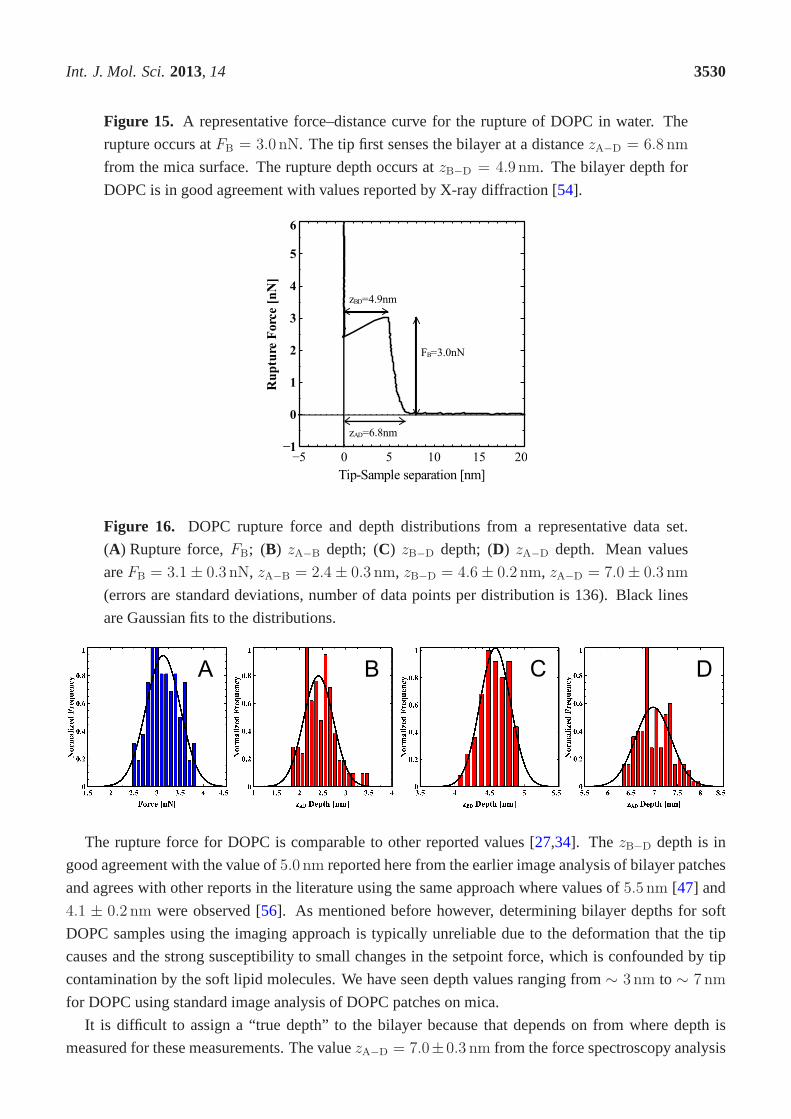
In Figure15 we show a single representative force distance curve for therupture of DOPC in pure
water. We have converted the z-piezo displacement to tip-sample separation so as to more accurately
reflect the tip dynamics. We observe that the tip first senses the upper surface of the bilayer at a distance
zA−D = 6.8 nm from the mica surface and the rupture depth occurs atzB−D = 4.9 nm. The rupture
occurs atFB = 3.0 nN.
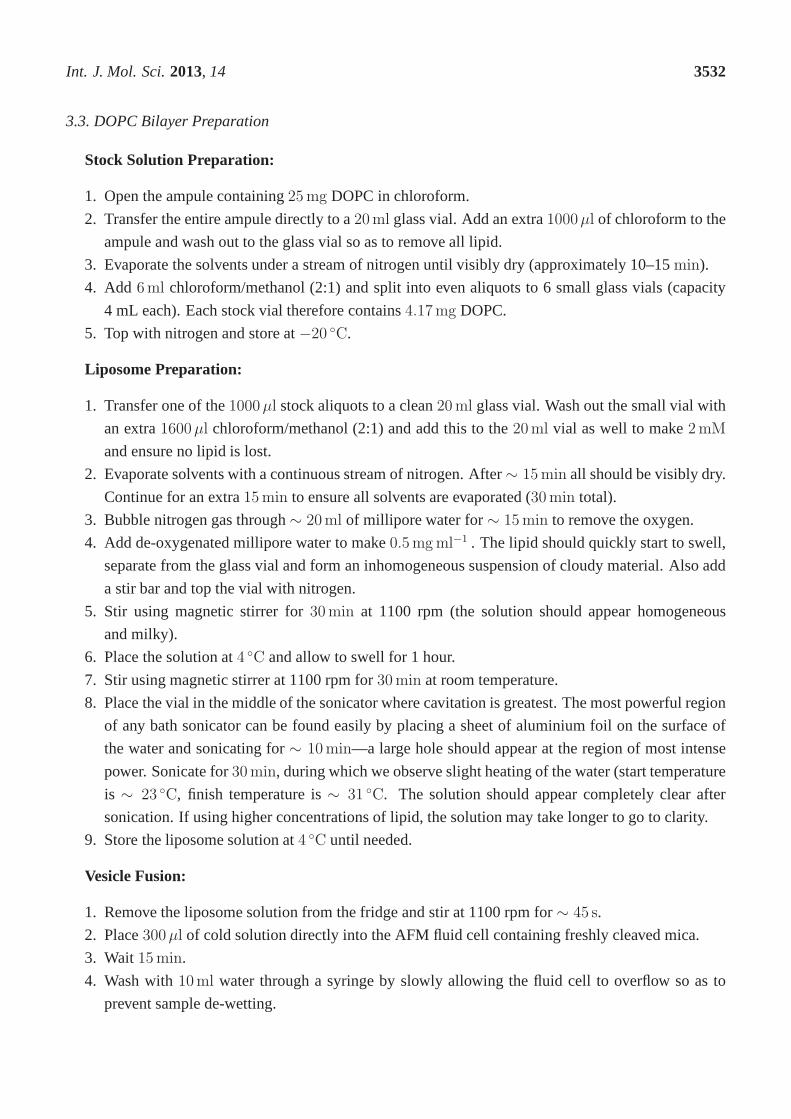
In order to have a more accurate reflection of the bilayer properties, it is necessary to repeat the
force-distance measurements several times. As shown in Figure 16 we have collected data for 136
approach–retract cycles for a single tip. The mean values areFB = 3.1± 0.3 nN, zA−B = 2.4± 0.3 nm,
zB−D = 4.6± 0.2 nm, zA−D = 7.0± 0.3 nm.
Int. J. Mol. Sci. 2013, 14 3530
Figure 15. A representative force–distance curve for the rupture of DOPC in water. The
rupture occurs atFB = 3.0 nN. The tip first senses the bilayer at a distancezA−D = 6.8 nm
from the mica surface. The rupture depth occurs atzB−D = 4.9 nm. The bilayer depth for
DOPC is in good agreement with values reported by X-ray diffraction [54].
− Tr
−lTt
−aTp
pp
4
3
4
5
6
NDD
e p e -p -e Sp
Figure 16. DOPC rupture force and depth distributions from a representative data set.
(A) Rupture force,FB; (B) zA−B depth; (C) zB−D depth; (D) zA−D depth. Mean values
areFB = 3.1± 0.3 nN, zA−B = 2.4± 0.3 nm, zB−D = 4.6± 0.2 nm, zA−D = 7.0± 0.3 nm
(errors are standard deviations, number of data points per distribution is 136). Black lines
are Gaussian fits to the distributions.
The rupture force for DOPC is comparable to other reported values [27,34]. The zB−D depth is in
good agreement with the value of5.0 nm reported here from the earlier image analysis of bilayer patches
and agrees with other reports in the literature using the same approach where values of5.5 nm [47] and
4.1 ± 0.2 nm were observed [56]. As mentioned before however, determining bilayer depthsfor soft
DOPC samples using the imaging approach is typically unreliable due to the deformation that the tip
causes and the strong susceptibility to small changes in thesetpoint force, which is confounded by tip
contamination by the soft lipid molecules. We have seen depth values ranging from∼ 3 nm to ∼ 7 nm
for DOPC using standard image analysis of DOPC patches on mica.
It is difficult to assign a “true depth” to the bilayer becausethat depends on from where depth is
measured for these measurements. The valuezA−D = 7.0±0.3 nm from the force spectroscopy analysis

Int. J. Mol. Sci. 2013, 14 3531
is undoubtedly an overestimate, since the tip may sense electrostatic interactions before it actually makes
contact, and the term “contact” is also ill-defined because the head groups are typically hydrated, so the
tip may be first sensing those water molecules. The depthzB−D = 4.6± 0.2 nm is taken at a point when
the bilayer is in compression, and so is likely an underestimation. Interestingly, an X-ray diffraction
study [54] reports a fully hydrated DOPC bilayer thickness ofD = 6.31 nm, which is most similar to the
depthzA−D = 7.0± 0.3 nm. They observe the thickness only due to the lipids as beingD′
B = 4.53 nm,
which is comparable to the depthzB−D = 4.6±0.2 nm. They also report a water layer ofD′
W = 1.79 nm
and comparable to the depthzA−B = 2.4 ± 0.3 nm. We believe that presenting the constituent depth
contributions, especiallyzA−D, zB−D andzA−D, is a much more robust way of characterising a bilayer as
compared with the standard image analysis approach.
3. Experimental Section
3.1. Materials and Instrumentation
Stock ampules (25mg) of 1,2-dioleoyl-sn-glycero-3-phosphocholine (DOPC, purity > 99%) in
chloroform were purchased from Avanti Lipids and stored at−20 C immediately after receipt.
Powdered 1,2-dipalmitoyl-sn-glycero-3-phosphocholine(DPPC, purity≥ 99%) was purchased from
Sigma-Aldrich and stored at−20 C. Chloroform (purity> 99.8%) and sodium chloride (purity
> 99%) were purchased from EMD chemicals (USA). Methanol (purity> 99.8%), sodium hydroxide
(purity > 97%) and magnesium chloride (purity> 99%) were purchased from Caledon Laboratories
(Georgetown, Ontario, Canada). HEPES (purity> 99.5%) was purchased from Sigma-Aldrich.
Millipore water (resistivity> 18MΩcm ) from a Synergy UV-system was used throughout. A Branson
1510 sonicator bath was also used. Muscovite mica (grade V-4, 22mm diameter,0.15mm thick circular
discs) was purchased from SPI Supplies (West Chester, PA, USA). Silicon MAC-2 cantilevers (nominal
spring constant2.8Nm−1 ) were purchased from Agilent Technologies. DNPS silicon nitride cantilevers
(4 levers, nominal spring constants range in0.06Nm−1 − 0.350Nm−1 ) and gold coated NPG levers
(4 levers, nominal spring constants range in0.06Nm−1 − 0.350Nm−1 ) were purchased from Bruker.
1-Undecanethiol (purity> 98%) was purchased from sigma.
3.2. General Handling of Lipids
An important point to note when handling DOPC is that due to the double bond in its tail, it is
particularly susceptible to hydrolysis or oxidation [57]. The lipid powders are extremely hygroscopic and
so we prefer to purchase DOPC dissolved in chloroform and layered with argon. Upon receipt, we store
at−20 C and use one ampoule at a time, which can be divided into aliquots, layered with nitrogen/argon
and again stored at−20 C until required. Degassing water with nitrogen/argon to displace oxygen
before liposome preparation and always keeping solutions of DOPC layered with nitrogen/argon when
not in use are also recommended.
Int. J. Mol. Sci. 2013, 14 3532
3.3. DOPC Bilayer Preparation
Stock Solution Preparation:
1. Open the ampule containing25mg DOPC in chloroform.
2. Transfer the entire ampule directly to a20ml glass vial. Add an extra1000µl of chloroform to the
ampule and wash out to the glass vial so as to remove all lipid.
3. Evaporate the solvents under a stream of nitrogen until visibly dry (approximately 10–15min).
4. Add 6ml chloroform/methanol (2:1) and split into even aliquots to 6small glass vials (capacity
4 mL each). Each stock vial therefore contains4.17mg DOPC.
5. Top with nitrogen and store at−20 C.
Liposome Preparation:
1. Transfer one of the1000µl stock aliquots to a clean20ml glass vial. Wash out the small vial with
an extra1600µl chloroform/methanol (2:1) and add this to the20ml vial as well to make2mM
and ensure no lipid is lost.
2. Evaporate solvents with a continuous stream of nitrogen.After ∼ 15min all should be visibly dry.
Continue for an extra15min to ensure all solvents are evaporated (30min total).
3. Bubble nitrogen gas through∼ 20ml of millipore water for∼ 15min to remove the oxygen.
4. Add de-oxygenated millipore water to make0.5mgml−1 . The lipid should quickly start to swell,
separate from the glass vial and form an inhomogeneous suspension of cloudy material. Also add
a stir bar and top the vial with nitrogen.
5. Stir using magnetic stirrer for30min at 1100 rpm (the solution should appear homogeneous
and milky).
6. Place the solution at4 C and allow to swell for 1 hour.
7. Stir using magnetic stirrer at 1100 rpm for30min at room temperature.
8. Place the vial in the middle of the sonicator where cavitation is greatest. The most powerful region
of any bath sonicator can be found easily by placing a sheet ofaluminium foil on the surface of
the water and sonicating for∼ 10min—a large hole should appear at the region of most intense
power. Sonicate for30min, during which we observe slight heating of the water (start temperature
is ∼ 23 C, finish temperature is∼ 31 C. The solution should appear completely clear after
sonication. If using higher concentrations of lipid, the solution may take longer to go to clarity.
9. Store the liposome solution at4 C until needed.
Vesicle Fusion:
1. Remove the liposome solution from the fridge and stir at 1100 rpm for∼ 45 s.
2. Place300µl of cold solution directly into the AFM fluid cell containing freshly cleaved mica.
3. Wait15min.
4. Wash with10ml water through a syringe by slowly allowing the fluid cell to overflow so as to
prevent sample de-wetting.
Int. J. Mol. Sci. 2013, 14 3533
Optimization:
Typically the above protocol will give a continuous bilayerof DOPC. However, slight decreases in the
concentration (e.g., a little extra lipid lost during preparation of the liposome solution) may mean that a
complete bilayer is not formed. In this case we have found that it is best to prepare several samples that
have been incubated for slightly longer and shorter periodsof time and image these using the AFM. By
capturing the state of bilayer coverage at various points intime, it is then possible to be certain that for
a given incubation time a complete bilayer was formed. The time series test is described in more detail
in the main text. In some cases, a complete bilayer may not form even for extended incubation times. In
this case, another approach can be taken whereby a higher concentration of lipid (1mgml−1 ) liposome
solution is prepared. This solution can then be sequentially diluted to find the optimum concentration to
form a complete bilayer.
3.4. DPPC Bilayer Preparation
Liposome Preparation:
1. Weigh out powdered DPPC and add chloroform/methanol (2:1) to make2mM.
2. Evaporate solvents with a continuous stream of nitrogen for∼ 30min or until visibly dry.
3. For liposomes in water: Add water to make0.3mgml−1 (this concentration was used for the
sample shown in Figure5). For liposome in buffer: Add HEPES buffer (10mM HEPES,150mM
NaCl, 20mM MgCl2, pH 7.4) to make1mgml−1 (this liposome concentration was used for
samples shown in Figure13 but diluted later). Also add a stir bar and top the vial with nitrogen.
4. Stir using magnetic stirrer for30min at 1100 rpm and at room temperature.
5. Place the solution at60 C and allow to swell for 1 hour.
6. Stir using magnetic stirrer for30min at 1100 rpm.
7. Sonicate for45min at 60 C. The solution should appear completely clear after sonication.
However, if using higher concentrations of lipid, the solution may take longer to go to clarity.
Vesicle Fusion:
1. Stir the liposome solution for∼ 45 s.
2. Prepare the fluid cell with freshly cleaved mica at60 C.
3. For liposomes in water: Add300µl and wait 5min. For liposomes in buffer: dilute to∼
0.06mgml−1 in a small centrifuge tube, add300µl to the fluid cell and wait2min.
4. For liposomes in water: Cool at a rate less than0.5 Cmin−1 . For liposomes in buffer: Cooling
at5 Cmin−1 will produce a few domains, and a lower cooling rate will produce even fewer.
5. Wash with10ml water through a syringe by slowly allowing the fluid cell to overflow so as to
prevent sample de-wetting.
3.5. Atomic Force Microscopy
All AFM imaging was conducted in pure water or buffer either using an Agilent 5500 AFM
(Agilent technologies Inc, Santa Clara CA, USA) equipped with a MAC mode 3 control box, or a
Int. J. Mol. Sci. 2013, 14 3534
JPK nanowizard-2 (JPK Instruments AG, Berlin, Germany). Temperature controlled experiments were
performed using the Agilent system equipped with a LakeShore 325 temperature controller and fluid
cell. Imaging was performed in intermittent contact mode orMAC mode (Agilent AFM only) using
MAC-II cantilevers (nominalk = 2.8Nm−1 ). MAC mode allows for excellent control of the cantilever
in liquid environments and is ideally suited for imaging soft supported bilayer surfaces. Since the mode
is an intermittent contact (or AC) technique, cantilevers of slightly higher spring constant than those
used for contact mode can be used with great effect. We have also imaged in contact mode using
DNPS (Bruker) levers with a nominal spring constant of0.06− 0.350Nm−1 and find the image quality
comparable. However, MAC mode is less sensitive to cantilever drift (as the cantilever deflection drifts
the force set-point must be continually adjusted to maintain a constant contact force) and so is often
more convenient.
3.6. Atomic Force Spectroscopy
For force spectroscopy experiments presented here, we usedgold coated probes from Bruker (NPG,
nominalk = 0.06Nm−1 ). Cantilevers were first functionalised with> 2mM 1-undecanethiol for
> 12 h to provide a more homogeneous surface. As with Loiet al. [58] we observe improved consistency
with this approach rather than using uncoated levers. Several different samples and cantilevers have been
tested, all showing qualitatively the same results. We havealso replicated experiments using uncoated
MAC-2 silicon cantilevers from Agilent.
Cantilevers were first calibrated in air using the thermal tune method [59], which is implemented
in both the Agilent PicoView software and the JPK software. Briefly, a thermal noise spectrum is first
recorded in air. The cantilever is then pressed against a hard material such as mica to obtain the cantilever
sensitivity inmV−1 . The cantilever spring constant is then calculated from these two measurements as
detailed in the reference.
Force curves were obtained by repeatedly approaching and retracting the cantilever to the surface (tip
velocity was715 nm s−1 ) whilst simultaneously recording the tip deflection. The tip deflection dataVd
(in Volts) was converted to force units (Newtons) usingF = kVdS, whereS is the normal cantilever
sensitivity in mV−1 . The normal sensitivity is the inverse of the gradient of thelinear region of the
force-distance curve when the cantilever is in hard contact. The force calibration was carried out for
each force curve separately to ensure the most accurate value for the sensitivity in case of drift. Care
was taken to ensure that high enough loads were reached such that the sensitivity could be found from a
linear region. The z-piezo displacement values,zd, were converted to tip-sample separations,zts, using
zts = |zp| − |zd|, wherezd is the tip deflection in nanometers. Typically force curves are taken at points
on a grid of 16 by 16 points across a2µm square area. Several different areas have also been tested and
give qualitatively the same results. Results were analysedusing a script developed in our laboratory with
MATLAB 7.4.0.
4. Conclusions
We have developed robust protocols to reproducibly generate extended regions of DOPC bilayer
surfaces on mica in water using the vesicle fusion approach.Such test surfaces are typically defect-free

Int. J. Mol. Sci. 2013, 14 3535
and thus ideally suited for studying the influence of effector molecules such as proteins/peptides or drugs
either through AFM imaging or by force spectroscopy. Such surfaces are especially suitable for force
spectroscopy studies, in which the tip can easily get contaminated at edges of defects in the bilayer.
We also demonstrate that DPPC bilayers can be prepared either in pure water or in buffer solutions
with additional ions. These surfaces typically have defects either in the form of lower domains or holes
exposing bare mica. However, such defects are reported by several other groups and there are still regions
∼ 5µm2 that are suitable for further testing.
The large number of different experimental parameters thatcan influence both the preparation of
the liposome solution and their fusion with mica, together with the interdependence of some of those
parameters, make it very difficult to understand and controlthe whole process. There are a staggering
number of laboratories that have their own unique “recipe” for preparing bilayers on surfaces, and the
complexity of bilayer preparation demonstrated here undoubtedly contributes to such diversity. We have
focused here on just two examples of lipids containing phosphocholine (PC) head groups in their fluid
and gel phases. It is expected that different lipids will require different conditions in order to consistently
prepare bilayers suitable as model systems, however the general themes should apply to all. We hope
that by highlighting the most critical experimental parameters, and by providing their general protocols,
we provide crucial information to aid scientists, especially those new to the field.
We have also demonstrated force spectroscopy studies of DOPC bilayers prepared using our vesicle
fusion protocol. Both the depth measurements and rupture force data are comparable to literature values.
We also demonstrate an approach for the assessment of the bilayer thickness characteristics. We sub-
divide the force-distance plots into depths about the discontinuities and find that these compare well
to hydrated and unhydrated lipid values obtained by X-ray diffraction. Without a robust and reliable
protocol for bilayer preparation, much time can be wasted with inconsistent and misleading results.
With the protocol that we present here however, force spectroscopy experiments can be quickly used to
assess lipid surfaces in a reliable manner.
Acknowledgements
The authors acknowledge funding from Canadian Foundation for Innovation (CFI), Ontario Research
Fund (ORF) and Natural Science and Engineering Council of Canada (NSERC) to Z.L. as well as Ontario
Graduate Scholarship and Waterloo Institute for Nanotechnology (WIN) Fellowship to Y.V.C.
References
1. Voet, D.; Voet, J.G.Biochemistry; ACS: Washington, DC, USA, 1990.
2. Mouritsen, O.; Jorgensen, K. A new look at lipid-membranestructure in relation to drug research.
Pharm. Res. 1998, 15, 1507–1519.
3. Phillips, R.; Ursell, T.; Wiggins, P.; Sens, P. Emerging roles for lipids in shaping membrane-protein
function. Nature 2009, 459, 379–385.
4. Dufrene, Y.; Barger, W.; Green, J.; Lee, G. Nanometer-scale surface properties of mixed
phospholipid monolayers and bilayers.Langmuir 1997, 13, 4779–4784.
Int. J. Mol. Sci. 2013, 14 3536
5. Dufrene, Y.; Boland, T.; Schneider, J.; Barger, W.; Lee, G. Characterization of the physical
properties of model biomembranes at the nanometer scale with the atomic force microscope.
Faraday Discuss. 1998, 111, 79–94.
6. Richter, R.; Berat, R.; Brisson, A. Formation of solid-supported lipid bilayers: An integrated view.
Langmuir 2006, 22, 3497–3505.
7. El Kirat, K.; Dufrene, Y.F.; Lins, L.; Brasseur, R. The SIVtilted peptide induces cylindrical reverse
micelles in supported lipid bilayers.Biochemistry 2006, 45, 9336–9341.
8. Goksu, E.I.; Vanegas, J.M.; Blanchette, C.D.; Lin, W.C.;Longo, M.L. AFM for structure and
dynamics of biomembranes.Biochim. Biophys. Acta-Biomembr. 2009, 1788, 254–266.
9. Alessandrini, A.; Seeger, H.M.; Di Cerbo, A.; Caramaschi, T.; Facci, P. What do we really measure
in AFM punch-through experiments on supported lipid bilayers? Soft Matter 2011, 7, 7054–7064.
10. Picas, L.; Milhiet, P.; Hernandez-Borrell, J. Atomic force microscopy: A versatile tool to probe the
physical and chemical properties of supported membranes atthe nanoscale.Chem. Phys. Lipids
2012, 165, 845–860.
11. Lesniewska, E.; Milhiet, P.; Giocondi, M.; Le Grimellec, C. Atomic Force Microscope Imaging
of Cells and Membranes. InAtomic Force Microscopy in Cell Biology; Academic Press Inc.:
San Diego, CA, USA, 2002; Volume 68, pp. 51–65.
12. Seantier, B.; Giocondi, M.C.; Le Grimellec, C.; Milhiet, P.E. Probing supported model and native
membranes using AFM.Curr. Opin. Colloid & Interface Sci. 2008, 13, 326–337.
13. Petty, M. Langmuir-Blodgett Films: An Introduction; Cambridge University Press: Cambridge,
UK, 1996.
14. Rinia, H.; Demel, R.; van der Eerden, J.; de Kruijff, B. Blistering of Langmuir-Blodgett bilayers
containing anionic phospholipids as observed by atomic force microscopy. Biophys. J. 1999,
77, 1683–1693.
15. Picas, L.; Suarez-Germa, C.; Teresa Montero, M.; Hernandez-Borrell, J. Force spectroscopy study
of langmuir-blodgett asymmetric bilayers of phosphatidylethanolamine and phosphatidylglycerol.
J. Phys. Chem. B 2010, 114, 3543–3549.
16. Leonenko, Z.; Cramb, D. Revisiting lipid-general anesthetic interactions (I): Thinned domain
formation in supported planar bilayers induced by halothane and ethanol.Can. J. Chem.-Revue
Can. Chimie 2004, 82, 1128–1138.
17. Leonenko, Z.; Finot, E.; Cramb, D. AFM study of interaction forces in supported planar DPPC
bilayers in the presence of general anesthetic halothane.Biochim. Biophys. Acta-Biomembr. 2006,
1758, 487–492.
18. Merino, S.; Domenech, O.; Diez, I.; Sanz, F.; Vinas, M.; Montero, M.; Hernandez-Borrell, J.
Effects of ciprofloxacin on Escherichia coli lipid bilayers: An atomic force microscopy study.
Langmuir 2003, 19, 6922–6927.
19. Berquand, A.; Mingeot-Leclercq, M.; Dufrene, Y. Real-time imaging of drug-membrane
interactions by atomic force microscopy.Biochim. Biophys. Acta-Biomembr. 2004, 1664,
198–205.

Int. J. Mol. Sci. 2013, 14 3537
20. Leonenko, Z.; Carnini, A.; Cramb, D. Supported planar bilayer formation by vesicle fusion: The
interaction of phospholipid vesicles with surfaces and theeffect of gramicidin on bilayer properties
using atomic force microscopy.Biochim. Biophys. Acta-Biomembr. 2000, 1509, 131–147.
21. Choucair, A.; Chakrapani, M.; Chakravarthy, B.; Katsaras, J.; Johnston, L.J. Preferential
accumulation of A beta(1-42) on gel phase domains of lipid bilayers: An AFM and fluorescence
study. Biochim. Biophys. Acta-Biomembr. 2007, 1768, 146–154.
22. Legleiter, J.; Fryer, J.D.; Holtzman, D.M.; Kowalewski, T. The modulating effect of mechanical
changes in lipid bilayers caused by apoe-containing lipoproteins on a beta induced membrane
disruption.Acs Chem. Neurosci. 2011, 2, 588–599.
23. Sheikh, K.; Giordani, C.; McManus, J.J.; Hovgaard, M.B.; Jarvis, S.P. Differing modes of
interaction between monomeric A beta(1-40) peptides and model lipid membranes: An AFM study.
Chem. Phys. Lipids 2012, 165, 142–150.
24. Quist, A.; Doudevski, I.; Lin, H.; Azimova, R.; Ng, D.; Frangione, B.; Kagan, B.; Ghiso, J.; Lal, R.
Amyloid ion channels: A common structural link for protein-misfolding disease.Proc. Natl. Acad.
Sci. USA 2005, 102, 10427–10432.
25. Yarrow, F.; Kuipers, B.W.M. AFM study of the thermotropic behaviour of supported DPPC bilayers
with and without the model peptide WALP23.Chem. Phys. Lipids 2011, 164, 9–15.
26. Hui, S.; Viswanathan, R.; Zasadzinski, J.; Israelachvili, J. The structure and stability of
phospholipid-bilayers by atomic-force microscopy.Biophys. J. 1995, 68, 171–178.
27. Dekkiche, F.; Corneci, M.C.; Trunfio-Sfarghiu, A.M.; Munteanu, B.; Berthier, Y.; Kaabar, W.;
Rieu, J.P. Stability and tribological performances of fluidphospholipid bilayers: Effect of buffer
and ions.Colloids Surf. B-Biointerfaces 2010, 80, 232–239.
28. Benz, M.; Gutsmann, T.; Chen, N.; Tadmor, R.; Israelachvili, J. Correlation of AFM and SFA
measurements concerning the stability of supported lipid bilayers. Biophys. J. 2004, 86, 870–879.
29. Fang, Y.; Yang, J. The growth of bilayer defects and the induction of interdigitated domains in the
lipid-loss process of supported phospholipid bilayers.Biochim. Biophys. Acta-Biomembr. 1997,
1324, 309–319.
30. Garcia-Manyes, S.; Redondo-Morata, L.; Oncins, G.; Sanz, F. Nanomechanics of lipid bilayers:
Heads or tails?J. Am. Chem. Soc. 2010, 132, 12874–12886.
31. Mueller, H.; Butt, H.; Bamberg, E. Adsorption of membrane-associated proteins to lipid
bilayers studied with an atomic force microscope: Myelin basic protein and cytochrome c.
J. Phys. Chem. B 2000, 104, 4552–4559.
32. Mueller, H.; Butt, H.; Bamberg, E. Force measurements onmyelin basic protein adsorbed to mica
and lipid bilayer surfaces done with the atomic force microscope.Biophys. J. 1999, 76, 1072–1079.
33. Garcia-Saez, A.J.; Chiantia, S.; Salgado, J.; Schwille, P. Pore formation by a bax-derived peptide:
Effect on the line tension of the membrane probed by AFM.Biophys. J. 2007, 93, 103–112.
34. Chiantia, S.; Ries, J.; Kahya, N.; Schwille, P. CombinedAFM and two-focus SFCS study of
raft-exhibiting model membranes.ChemPhysChem 2006, 7, 2409–2418.
35. An, H.; Nussio, M.R.; Huson, M.G.; Voelcker, N.H.; Shapter, J.G. Material properties of lipid
microdomains: Force-volume imaging study of the effect of cholesterol on lipid microdomain
rigidity. Biophys. J. 2010, 99, 834–844.
Int. J. Mol. Sci. 2013, 14 3538
36. Sullan, R.M.A.; Li, J.K.; Hao, C.; Walker, G.C.; Zou, S. Cholesterol-dependent nanomechanical
stability of phase-segregated multicomponent lipid bilayers. Biophys. J. 2010, 99, 507–516.
37. Pera, I.; Stark, R.; Kappl, M.; Butt, H.; Benfenati, F. Using the atomic force microscope to
study the interaction between two solid supported lipid bilayers and the influence of synapsin I.
Biophys. J. 2004, 87, 2446–2455.
38. Mingeot-Leclercq, M.P.; Deleu, M.; Brasseur, R.; Dufrene, Y.F. Atomic force microscopy of
supported lipid bilayers.Nat. Protoc. 2008, 3, 1654–1659.
39. Ulrich, A.; Sami, M.; Watts, A. Hydration of dopc bilayers by differential scanning calorimetry.
Biochim. Biophys. Acta-Biomembr. 1994, 1191, 225–230.
40. Biltonen, R.; Lichtenberg, D. The use of differential scanning calorimetry as a tool to characterize
liposome preparations.Chem. Phys. Lipids 1993, 64, 129–142.
41. Thompson, G.A.J.In Form and Function of Phospholipids; Elsevier: Amsterdam, The Netherlands,
1973.
42. Leckband, D.; Helm, C.; Israelachvili, J. Role of calcium in the adhesion and fusion of bilayers.
Biochemistry 1993, 32, 1127–1140.
43. Reviakine, I.; Brisson, A. Formation of supported phospholipid bilayers from unilamellar vesicles
investigated by atomic force microscopy.Langmuir 2000, 16, 1806–1815.
44. Jass, J.; Tjarnhage, T.; Puu, G. From liposomes to supported, planar bilayer structures on
hydrophilic and hydrophobic surfaces: An atomic force microscopy study. Biophys. J. 2000,
79, 3153–3163.
45. Reimhult, E.; Hook, F.; Kasemo, B. Temperature dependence of formation of a supported
phospholipid bilayer from vesicles on SiO2.Phys. Rev. 2002, 66, 051905:1–051905:4.
46. Yang, J.; Appleyard, J. The main phase transition of mica-supported phosphatidylcholine
membranes.J. Phys. Chem. B 2000, 104, 8097–8100.
47. Leonenko, Z.; Finot, E.; Ma, H.; Dahms, T.; Cramb, D. Investigation of temperature-induced phase
transitions in DOPC and DPPC phospholipid bilayers using temperature-controlled scanning force
microscopy.Biophys. J. 2004, 86, 3783–3793.
48. Garcia-Manyes, S.; Oncins, G.; Sanz, F. Effect of ion-binding and chemical phospholipid structure
on the nanomechanics of lipid bilayers studied by force spectroscopy. Biophys. J. 2005, 89,
1812–1826.
49. Leidy, C.; Kaasgaard, T.; Crowe, J.; Mouritsen, O.; Jorgensen, K. Ripples and the formation of
anisotropic lipid domains: Imaging two-component double bilayers by atomic force microscopy.
Biophys. J. 2002, 83, 2625–2633.
50. Rinia, H.; Kik, R.; Demel, R.; Snel, M.; Killian, J.; van der Eerden, J.; de Kruijff, B.
Visualization of highly ordered striated domains induced by transmembrane peptides in supported
phosphatidylcholine bilayers.Biochemistry 2000, 39, 5852–5858.
51. Shinozaki, Y.; Siitonen, A.M.; Sumitomo, K.; Furukawa,K.; Torimitsu, K. Effect of Ca2+ on
vesicle fusion on solid surface: Anin vitro model of protein-accelerated vesicle fusion.Jpn. J.
Appl. Phys. 2008, 47, 6164–6167.
Int. J. Mol. Sci. 2013, 14 3539
52. Marques, J.T.; Viana, A.S.; de Almeida, R.F.M. Ethanol effects on binary and ternary supported
lipid bilayers with gel/fluid domains and lipid rafts.Biochim. Biophys. Acta-Biomembr. 2011,
1808, 405–414.
53. Soussen, C.; Brie, D.; Gaboriaud, F.; Kessler, C. Modeling of Force-Volume Images in Atomic
Force Microscopy. InProceedings of the 2008 IEEE International Symposium on Biomedical
Imaging: From Nano to Macro, Paris, France, 14–17 May 2008; Volume 1–4.
54. Tristram-Nagle, S.; Petrache, H.; Nagle, J. Structure and interactions of fully hydrated
dioleoylphosphatidylcholine bilayers.Biophys. J. 1998, 75, 917–925.
55. Abdulreda, M.H.; Moy, V.T. Atomic force microscope studies of the fusion of floating lipid
bilayers.Biophys. J. 2007, 92, 4369–4378.
56. Picas, L.; Rico, F.; Scheuring, S. Direct measurement ofthe mechanical properties of lipid phases
in supported bilayers.Biophys. J. 2012, 102, L1–L3.
57. Grit, M.; Desmidt, J.; Struijke, A.; Crommelin, D. hydrolysis of phosphatidylcholine in aqueous
liposome dispersions.Int. J. Pharm. 1989, 50, 1–6.
58. Loi, S.; Sun, G.; Franz, V.; Butt, H. Rupture of molecularthin films observed in atomic force
microscopy. II. Experiment.Phys. Rev. E 2002, 66, 031602:1–031602:7.
59. Hutter, J.; Bechhoefer, J. Calibration of atomic-forcemicroscope tips.Rev. Sci. Instrum. 1993,
64, 1868–1873.
c© 2013 by the authors; licensee MDPI, Basel, Switzerland. This article is an open access article
distributed under the terms and conditions of the Creative Commons Attribution license
(http://creativecommons.org/licenses/by/3.0/).