Preparation of CoMoS catalysts for hydr odesulfurization ...
7
Transcript of Preparation of CoMoS catalysts for hydr odesulfurization ...
310
†To whom correspondence should be addressed.
E-mail: [email protected]
Korean J. Chem. Eng., 29(3), 310-316 (2012)DOI: 10.1007/s11814-011-0171-9
INVITED REVIEW PAPER
Preparation of CoMoS catalysts for hydrodesulfurization using methylacetoacetateas a chelating agent
Sang Il Lee*,**, Ara Cho*, Jae Hyun Koh**, and Sang Heup Moon*,†
*School of Chemical & Biological Engineering and Institute of Chemical Processes,Seoul National University, Seoul 151-744, Korea
**Institute of Technology, SK Innovation Co., Ltd., Daejeon 305-712, Korea(Received 31 May 2011 • accepted 5 July 2011)
Abstract−CoMoS/Al2O3 catalyst, which was prepared using Co(MeAA)2·2H2O as a new Co precursor, showed ac-
tivity for hydrodesulfurization (HDS) higher than that of conventional catalysts, which were prepared using Co(NO3)·
6H2O as a Co precursor and/or by adding ethylene-di-amine-tetra-acetic acid (EDTA) as a chelating agent. Catalyst
of a similar activity was also obtained simply by impregnating a conventional CoMo/Al2O3 catalyst with an aqueous
solution of methylacetoacetate (MeAA) followed by drying and sulfidation. The added MeAA reacted with Co to pro-
duce Co(MeAA)2·2H2O on the catalyst surface during impregnation step, such that the resulting catalyst became simi-
lar to one prepared by direct impregnation with Co(MeAA)2·2H2O. The in-situ synthesis of Co(MeAA)2·2H2O on the
catalyst surface was advantageous over the method of directly adding the Co precursor to the impregnation solution
because the former method did not use a basic material, which was required for the synthesis of the Co precursor. Fur-
thermore, MeAA was soluble in water, whereas Co(MeAA)2·2H2O had to be dissolved in an organic solvent, e.g., 1,4-
dioxane. The Co species in the MeAA-added catalysts were sulfided at temperatures higher than those of conventional
catalysts, and consequently the former catalysts contained greater amounts of the HDS-active CoMoS phase than the
latter.
Key words: Hydrodesulfurization, CoMoS, Methylacetoacetate, Chelating Agent
INTRODUCTION
Improvement in the activity of current hydrotreating catalysts is
required to meet recent stringent environmental regulations demanded
for low sulfur contents of transportation fuels [1,2]. The majority
of commercial hydrotreating catalysts are composed of Co (or Ni)
and Mo dispersed on supports [3-6]. The HDS-active center is the
so-called “CoMoS (or NiMoS) phase,” which consists of sulfided
Co or Ni atoms on the edges and corners of MoS2 crystallites [4,6-
8]. Numerous studies have been made to prepare catalysts contain-
ing increased amounts of the active CoMoS or NiMoS phase.
Organic chelating agents, such as nitrilotriactic acid (NTA), citric
acid (CA), ethylene-di-amine-tetra-acetic acid (EDTA) and their
derivatives, have been widely used in the preparation of HDS cata-
lysts because they promote the formation of the CoMoS phase dur-
ing catalyst sulfidation [9-13]. The mechanism of catalyst promo-
tion by the chelating agent was investigated previously. Kubota et
al. reported, based on their study of CA-added catalysts, that added
CA suppressed the sulfidation of Co such that Mo component in
the catalyst was sulfided prior to or in parallel with the sulfidation
of Co, which produced increased amounts of the CoMoS phase [10].
Shimizu et al. studied the effect of chelating agents, e.g., NTA, EDTA
and trans-1,2-cyclohexanediamine-N,N,N',N'-tetraacetic acid
(CyDTA), on the performance of various catalysts, e.g., CoMo, NiMo
and NiW. They reported that the beneficial effect of chelating agents
originated from the stability of a promoter-chelating agent complex
that eventually allowed the formation of highly active sites [13].
On the other hand, Frizi et al. observed that the length of MoS2
slabs increased due to the retarded migration of Co on the MoS2
edge when the stability of the Co-chelating agent complex was exces-
sive as in the case of Co(EDTA) [14,15]. They also proposed that
the simultaneous sulfidation of Mo and Co was responsible for a
decrease in the MoS2 slab length and an increase in the number of
Co atoms that decorated the Mo sites.
In this study, we used cobalt methylacetoacetate, Co(MeAA)2·
2H2O as a new Co precursor to take advantage of its moderate stability
compared with a Co-EDTA complex. We also attempted to find a
new method for modifying the Mo surface with Co(MeAA)2·2H2O
by producing the latter in situ on the catalyst surface instead of by
directly adding the Co precursor to impregnation solution. The HDS
activity of prepared catalyst was measured using dibenzothiophene
(DBT) and 4,6-dimethyldibenzothiophene (4,6-DMDBT) as model
reactants. The catalyst surface was characterized using Fourier trans-
form infrared (FTIR) spectroscopy, temperature-programmed sulfi-
dation (TPS), temperature-programmed reduction (TPR) and high-
resolution transmission electron microscopy (HRTEM).
EXPERIMENTAL
1. Catalyst Preparation
Co(MeAA)2·2H2O was synthesized by a known method [16]:
10 g of MeAA was added to a solution, containing 3.5 g of NaOH
and 153 g of methanol, with stirring. The MeAA-containing solution
was added drop-wise to a solution containing 10.3 g of cobalt(II)
chloride hexa-hydrate in 161 g of methanol with vigorous stirring.
Preparation of CoMoS catalysts for hydrodesulfurization using methylacetoacetate as a chelating agent 311
Korean J. Chem. Eng.(Vol. 29, No. 3)
The resulting pale-pink precipitates, Co(MeAA)2·2H2O, were filtered
and washed with 500 g of methanol. To purify the crude Co(MeAA)2·2H2O, the precipitates were dissolved in 100 g of 1,4-dioxane and
filtered. Then, 400 g of methanol was added to the filtered 1,4-dioxane
solution to make pure precipitates. Finally, the precipitates were
filtered, washed with 300 g of methanol and dried at 353 K for two
days at a pressure of 50 mbar.
Co(MeAA)2-impregnated catalyst was prepared by sequentially
loading γ-Al2O3 with Mo and Co. That is, 30 g of γ-Al2O3 was im-
pregnated with 10.8 g of (NH4)6Mo7O24·4H2O in aqueous solution,
followed by drying in air at 393 K for 2 h (designated as Mo(d))
and final calcination in air at 773 K for 2 h (designated as Mo(c)).
Mo(c) was additionally impregnated with Co(MeAA)2·2H2O dis-
solved in 1,4-dioxane, followed by drying in air at 473 K for 2 h
(designated as Co(M)Mo(c)).
Two types of catalysts were prepared using Co(NO3)2·6H2O as
a Co precursor. Mo(c) was impregnated with Co(NO3)2·6H2O in
aqueous solution, followed by drying in air at 393 K for 2 h (desig-
nated as Co(d)Mo(c)) and final calcination in air at 773 K for 2 h
(designated as Co(c)Mo(c)).
The two catalysts, Co(d)Mo(c) and Co(c)Mo(c), were addition-
ally impregnated with an increasing amount of MeAA, which was
dissolved in an aqueous solution, followed by drying in air at 473 K
for 2 h (designated as Co(d)Mo(c)_xM and Co(c)Mo(c)_xM, x being
the mole ratio of MeAA/Co).
To compare the effect of MeAA with that of EDTA, a known
chelating agent in commercial use, a series of EDTA-containing
catalysts were prepared as reported previously [17]. Mo(d) or Mo(c)
was impregnated with Co(NO3)2·6H2O and EDTA, which was dis-
solved in an NH4OH-added aqueous solution, followed by drying in
air at 393 K for 3 h. The catalysts were designated as Co(E)Mo(c)
and Co(E)Mo(d) according to the post-treatment conditions of Mo/
Al2O3. The mole ratio of EDTA/Co was 1.2. The nominal contents
of Co and Mo in all catalysts were 4 wt% and 15 wt%, respectively.
Two sample catalysts were prepared for TPS experiments by im-
pregnating γ-Al2O3 with Co(NO3)2·6H2O and subsequently with or
without MeAA. That is, Co(NO3)2/Al2O3 with a Co content of 4 wt%
was prepared by impregnating γ-Al2O3 with Co(NO3)2·6H2O in aque-
ous solution, followed by drying in air at 473 K for 2 h (designated
as Co(d)). The other sample, Co(d)_M, was prepared by adding
MeAA to Co(d), followed by drying in air at 473 K for 2 h.
2. Reaction
Prior to use in HDS, all CoMo catalysts were pre-sulfided in a
pentadecane solution containing 30 vol% of dimethyldisulfide
(DMDS) at 623 K under a hydrogen pressure of 4.0 MPa for 4 h.
Mo(c) was sulfided at a temperature of 673 K. After sulfidation,
the catalysts were used for the HDS of DBT or 4,6-DMDBT in an
autoclave at 593 K under a hydrogen pressure of 4.0 MPa. The reac-
tor contained 0.03 g of DBT or 4,6-DMDBT dissolved in 30 cm3
of pentadecane or dodecane, respectively. The amounts of catalysts
charged in the reactor were 0.05 g for the HDS of DBT and 0.1 g
for the HDS of 4,6-DMDBT. Reaction products were analyzed with
a gas chromatograph (HP5890, Agilent) equipped with a flame ion-
ization detector and a silicone capillary column.
3. Characterization
IR spectra of catalysts or gases adsorbed on the catalysts were
recorded by using a Nicolet 6700 model FT-IR spectrometer at a
resolution of 4 cm−1 and 200 scans per spectrum. To analyze possi-
ble changes in the property of MeAA during catalyst preparation, a
self-supporting wafer (10-15 mg/cm2) of catalysts, either contain-
ing MeAA or not and either dried or calcined after cobalt introduc-
tion, was prepared by pressing the catalyst powders. The wafer was
placed in an IR cell, heated to 573 K, and maintained at the temper-
ature in Ar flow for 1 h, followed by cooling to 313 K. The IR spec-
trum of the wafer was recorded at 313 K after the cell was degassed
at pressures below 10−3 mbar.
To obtain IR spectra of NO adsorbed on the catalysts, a self-sup-
porting wafer of sulfided catalyst was introduced into an IR cell,
heated to 573 K, and maintained at a constant temperature in a flow
of 10% H2/N2 for 2 h. The flowing gas was switched to Ar and the
temperature was maintained at 573 K for 0.5 h, after which the cell
was cooled to 313 K. An IR spectrum was recorded at 313 K after
the cell was degassed at 10−3 mbar. The spectrum was measured
again after the catalyst was exposed to 15 Torr of NO for 5 min,
followed by degassing of the cell. The IR spectrum of adsorbed NO
was obtained from the difference between the above two measure-
ments.
TPR experiments were performed using an Autochem II model of
Micromeritics equipped with a thermal conductivity detector (TCD)
and a low temperature trap for the removal of desorbed water dur-
ing the experiments. Sulfided samples, obtained under the condition
described above (section 2.2), were treated in a flow of N2 at 473 K
for 1 h, cooled to room temperature, and finally heated to 750 K at
a rate of 5 K/min in a flowing gas mixture of 5 vol% H2/N2. The
signal of H2 consumption was measured by a TCD.
TPS was performed in a reactor connected with a mass spec-
trometer. Samples were treated in a flow of N2 at 473 K for 1 h, cooled
to room temperature, and finally heated to 773 K at a rate of 5 K/
min in a flow mixture of 10 vol% H2S/H2. The H2S signal was meas-
ured by mass spectroscopy.
HRTEM was obtained using TecnaiTM G2 F30 operated at 300
kV. Samples were ground in a mortar and dispersed in heptanes. A
drop of suspension liquid was placed on a micro holy grid. To esti-
mate the average length and stacking degree of MoS2 slabs, more
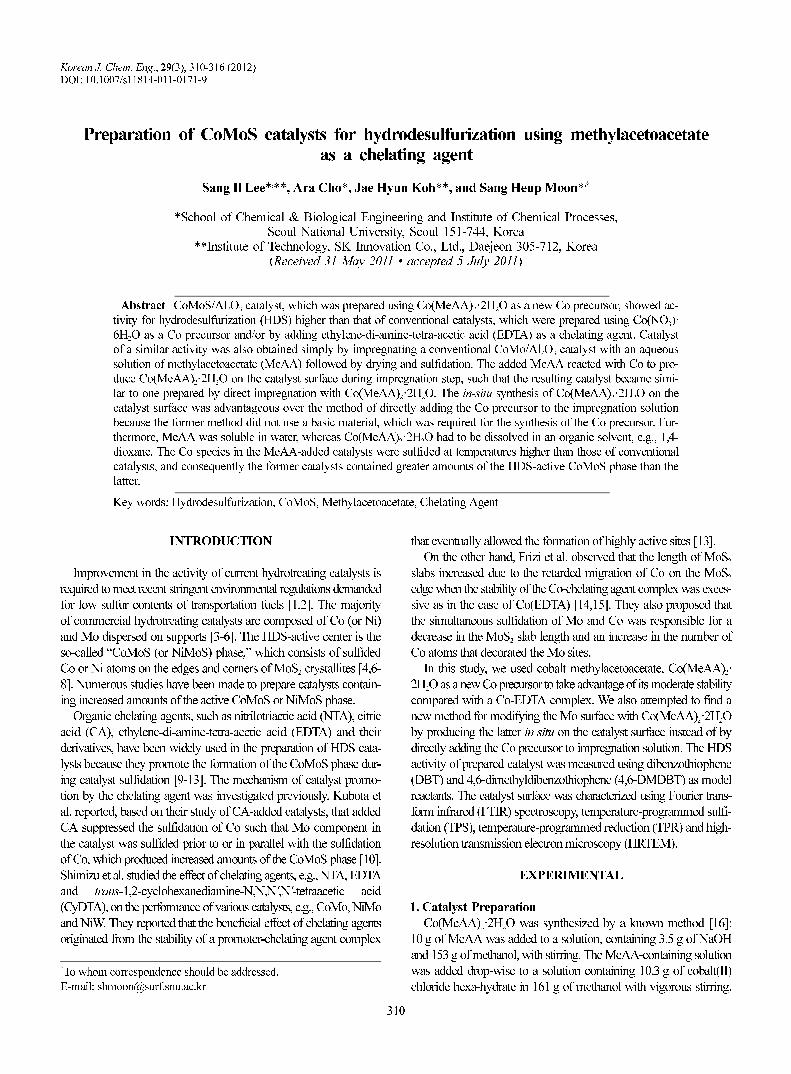
Fig. 1. HDS of DBT on MoS2/Al2O3 and CoMoS/Al2O3 catalystsprepared from different cobalt precursors. Sample nota-tions are described in section 2.1.

312 S. I. Lee et al.
March, 2012
than 200 crystallites were measured.
RESULTS
1. HDS of DBT and 4,6-DMDBT
Fig. 1 shows plots of DBT conversions obtained using six dif-
ferent catalysts, assuming that the reaction followed first-order kinet-
ics. The activity increased in an order, Mo(c)<<Co(d)Mo(c)~Co(E)
Mo(c)<Co(E)Mo(d)<Co(c)Mo(c)<Co(M)Mo(c), demonstrating the
promotional effect of Co and the advantage of Co(MeAA)2·2H2O
as a Co precursor. It is noteworthy that Co(M)Mo(c) showed the
highest activity among sample catalysts, i.e., higher than those pre-
pared using Co(NO3)2·6H2O as a Co precursor, Co(d)Mo(c) and
Co(c)Mo(c), or using EDTA as a chelating agent, Co(E)Mo(c) and
Co(E)Mo(d). All catalysts were pre-sulfided under an identical con-
dition, described in section 2.2, prior to use in the HDS.
Fig. 2 shows the reaction results of catalysts prepared by impreg-
nating Co(d)Mo(c) with different amounts of MeAA. The estimated
rate constants are listed in Table 1. The activity of Co(d)Mo(c) in-
creased with the amounts of added MeAA, although the increase
rate became smaller at high MeAA/Co mole ratios. Eventually, the
activity of Co(d)Mo(c)_4M became comparable to that of Co(M)
Mo(c), which was prepared by directly adding Co(MeAA)2·2H2O
to the preparation solution. The same trend was observed when the
catalysts were used in the HDS of 4,6-DMDBT, although the activity
increase was smaller than in DBT HDS. Contrary to the above re-
sults, catalysts prepared by impregnating Co(c)Mo(c) with MeAA
did not show an increase in the activity, as shown for Co(c)Mo(c)_
xM in Table 1. This discrepancy will be discussed in section 4.2.
The product distribution of DBT HDS was also affected by the
addition of MeAA, as shown in Fig. 3. The major products were
biphenyl (BP), cyclohexylbenzene (CHB) and dicyclohexyl (DCH),
which could be classified into two groups, BP and CHB+DCH, ac-
cording to the extent of ring saturation. BP was obtained largely by
the direct desulfurization (DDS) of DBT without ring saturation,
whereas CHB and DCH were obtained by the hydrogenation (HYD)
of the aromatic ring [18-20]. The BP/(CHB+DCH) ratios of the
MeAA-containing catalysts, Co(d)Mo(c)_xM, were higher than
that of Co(d)Mo(c) and increased with the amount of added MeAA
eventually to approach one for Co(M)Mo(c). The same trend was
observed in the HDS of 4,6-DMDBT (Table 1) although the prod-
uct distribution was obtained only for two catalysts, Co(d)Mo(c)
and Co(d)Mo(c)_2M.
2. HRTEM and FTIR
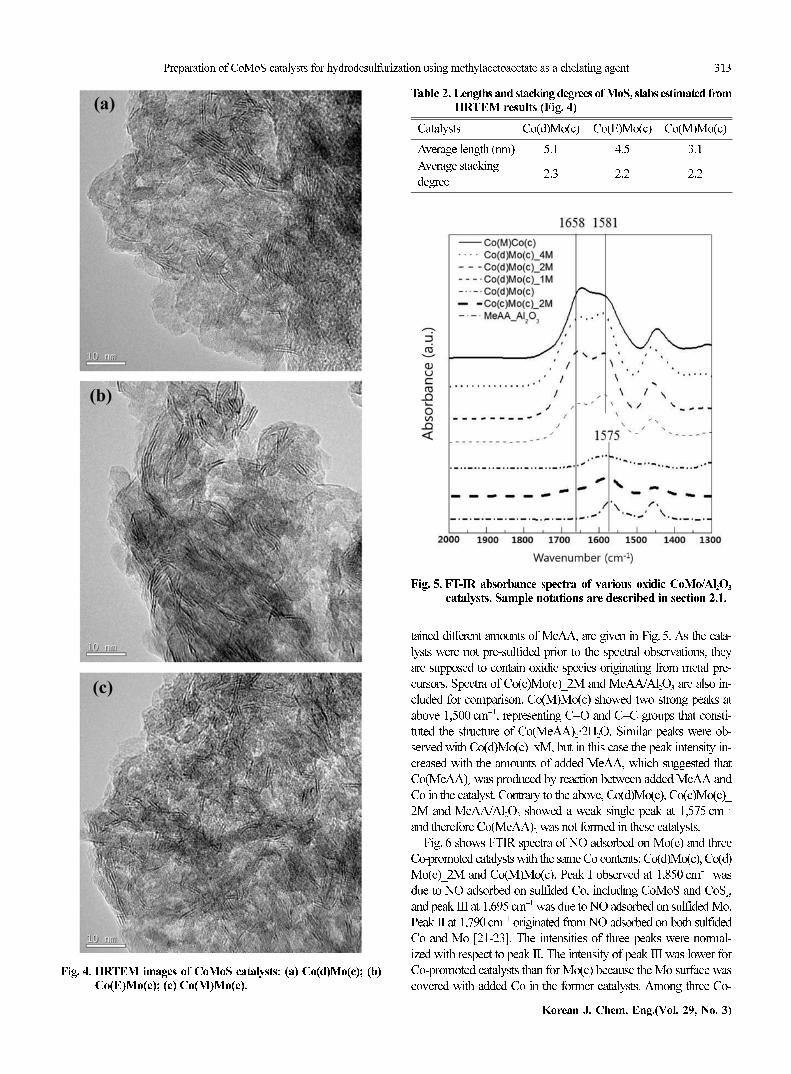
Fig. 4 shows HRTEM images of three catalysts prepared using
different Co precursors. The average lengths and stacking degrees of
MoS2 slabs estimated from the images are summarized in Table 2.
The stacking degree of MoS2 slabs remained nearly constant but
the slab length was affected by the Co precursors. Among three sam-
ple catalysts, Co(M)Mo(c) showed the shortest slab length, i.e., the
highest dispersion of MoS2 slabs.
FTIR spectra of Co(M)Mo(c) and Co(d)Mo(c)_xM, which con-
Fig. 2. HDS of DBT on MoS2/Al2O3 and CoMoS/Al2O3 catalystsprepared by adding different amounts of MeAA. Samplenotations are described in section 2.1.
Table 1. Rate constants in the HDS of DBT and 4,6-DMDBT
Rate constant, ka (10−3 min−1) (relative value)
Catalystb ReactionMole ratio of MeAA/Co
0 1 2 4
Co(d)Mo(c)_xM
DBT HDS3.6
(1.0)
4.2
(1.2)
5.6
(1.6)
6.1
(1.7)
4,6-DMDBT
HDS
3.2
(1.0)
3.9
(1.2)
[0.20]c [0.24]c
Co(M)Mo(c) DBT HDS 6.3
Co(c)Mo(c)_xM DBT HDS4.4
(1.0)
4.6
(1.0)
aFirst-order reaction model was used to calculate the rate constantbThe amounts of catalysts were 0.05 g for DBT HDS and 0.1 g for
4,6-DMDBT HDScThe ratio of DMBP to (MCHT+DMDCH) among products of 4,6-
DMDBT HDS at a conversion of 40%
Fig. 3. Product distribution in the HDS of DBT obtained using CoMoS/Al2O3 catalysts prepared by adding different amountsof MeAA. Sample notations are described in section 2.1.
Preparation of CoMoS catalysts for hydrodesulfurization using methylacetoacetate as a chelating agent 313
Korean J. Chem. Eng.(Vol. 29, No. 3)
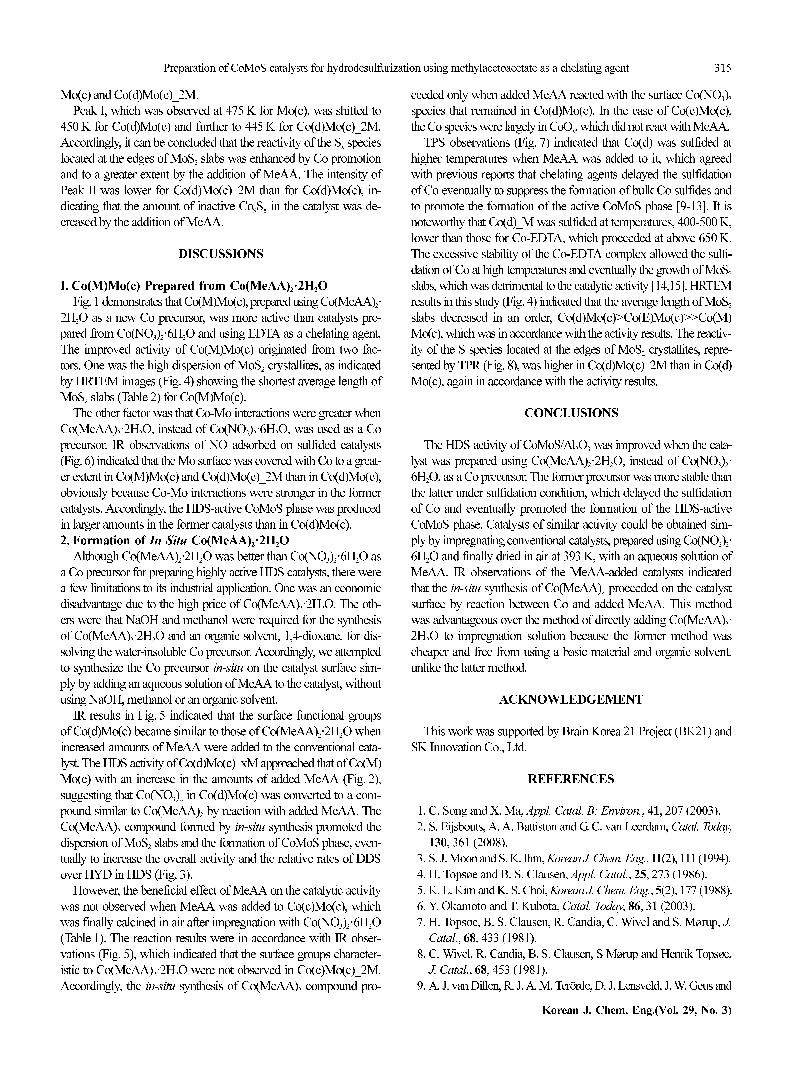
tained different amounts of MeAA, are given in Fig. 5. As the cata-
lysts were not pre-sulfided prior to the spectral observations, they
are supposed to contain oxidic species originating from metal pre-
cursors. Spectra of Co(c)Mo(c)_2M and MeAA/Al2O3 are also in-
cluded for comparison. Co(M)Mo(c) showed two strong peaks at
above 1,500 cm−1, representing C=O and C=C groups that consti-
tuted the structure of Co(MeAA)2·2H2O. Similar peaks were ob-
served with Co(d)Mo(c)_xM, but in this case the peak intensity in-
creased with the amounts of added MeAA, which suggested that
Co(MeAA)2 was produced by reaction between added MeAA and
Co in the catalyst. Contrary to the above, Co(d)Mo(c), Co(c)Mo(c)_
2M and MeAA/Al2O3 showed a weak single peak at 1,575 cm−1
and therefore Co(MeAA)2 was not formed in these catalysts.
Fig. 6 shows FTIR spectra of NO adsorbed on Mo(c) and three
Co-promoted catalysts with the same Co contents: Co(d)Mo(c), Co(d)
Mo(c)_2M and Co(M)Mo(c). Peak I observed at 1,850 cm−1 was
due to NO adsorbed on sulfided Co, including CoMoS and CoSx,
and peak III at 1,695 cm−1 was due to NO adsorbed on sulfided Mo.
Peak II at 1,790 cm−1 originated from NO adsorbed on both sulfided
Co and Mo [21-23]. The intensities of three peaks were normal-
ized with respect to peak II. The intensity of peak III was lower for
Co-promoted catalysts than for Mo(c) because the Mo surface was
covered with added Co in the former catalysts. Among three Co-Fig. 4. HRTEM images of CoMoS catalysts: (a) Co(d)Mo(c); (b)
Co(E)Mo(c); (c) Co(M)Mo(c).
Fig. 5. FT-IR absorbance spectra of various oxidic CoMo/Al2O3
catalysts. Sample notations are described in section 2.1.
Table 2. Lengths and stacking degrees of MoS2 slabs estimated fromHRTEM results (Fig. 4)
Catalysts Co(d)Mo(c) Co(E)Mo(c) Co(M)Mo(c)
Average length (nm) 5.1 4.5 3.1
Average stacking
degree2.3 2.2 2.2

314 S. I. Lee et al.
March, 2012
promoted catalysts, Co(M)Mo(c) and Co(d)Mo(c)_2M showed a
lower intensity of peak III than in the case of Co(d)Mo(c), indicat-
ing that Mo was covered with Co to a greater extent in the former
catalysts. It is noteworthy that the IR spectra nearly overlapped for
Co(d)Mo(c)_2M and Co(M)Mo(c).
The difference in the coverage of Mo with Co also affected the
sulfidation of Co in the catalysts. That is, the relative intensity of peak
I compared with the intensity of Peak III was higher for Co(M)Mo(c)
and Co(d)Mo(c)_2M than for Co(d)Mo(c), i.e., Co(M)Mo(c)~Co(d)
Mo(c)_2M>Co(d)Mo(c), which indicated that the Co species were
sulfided to greater extents in the former two catalysts. Accordingly,
catalysts prepared using MeAA as a chelating agent or Co(MeAA)2·
2H2O as a Co precursor are expected to have larger amounts of the
HDS-active CoMoS phase after sulfidation. It is also noteworthy
that Co(M)Mo(c) and Co(d)Mo(c)_2M showed nearly identical sur-
face properties prior to sulfidation, as analyzed by the above IR ob-
servations (Fig. 5).
3. TPS and TPR
Fig. 7 shows TPS of Co(d), either containing MeAA or not, and
Mo(c). A small positive peak appearing at 310-320 K (Peak I) on
Co(d)_M originated from the desorption of H2S physically adsorbed
on the sample [24,25]. Mo(c), which was expected to contain MoO3
after the final calcination step, showed a large negative peak at 315-
450 K (Peak II) because H2S was consumed during the transfor-
mation of MoO3 into Mo oxy-sulfides (MoO3−xSx) or MoS3. The
negative peak was followed by a sharp positive peak appearing at
higher temperatures (Peak III), 450-500 K, which was due to the
evolution of H2S during the reduction of MoO3−xSx or MoS3 to MoO3−x
Sx−y or MoS2. The MoO3−xSx−y species in Mo(c) were eventually con-
verted to MoS2 at higher temperatures, above 500 K (Peak IV) [26,
27].
Co(d) showed a TPS result somewhat similar to that of Mo(c),
except that Peaks II and III were shifted to higher temperatures, by
about 50 K, from those of Mo(c). However, Peak III observed at
450-500 K for Co(d) was not due to the sulfidation of Co(d) but to
the hydrogenation of elemental sulfur that had been produced by
the reaction of Co(NO3)2 with H2S [28]. Accordingly, the sulfidation
of Co(d) was completed at ca. 450 K (Peak II), which was lower
than temperature required for the complete sulfidation of Mo(c) to
MoS2, i.e., above 500 K (Peak IV).
Unlike the above two samples, Co(d)_M did not show a sharp
positive Peak III at 450-550 K. Furthermore, Peak II of Co(d)_M
was shifted to significantly higher temperatures, by about 100 K
from that of Mo(c) and by 60 K from that of Co(d). The above re-
sults suggest that the Co species in Co(d) was stabilized by added
MeAA.
The TPR patterns of three sulfided catalysts, Mo(c), Co(d)Mo(c)
and Co(d)Mo(c)_2M, showed two negative peaks (Fig. 8). Peak I,
observed at 400-500 K, was ascribed to the reduction of the Sx species
chemisorbed at the edges of MoS2 crystallites, which was related
to the HDS activity. For example, Li et al. reported that the catalytic
activity increased with a decrease in the peak temperature [29,30].
Peak II at 600-750 K, which was assigned to the reduction of cata-
lytically inactive Co9S8 phase [29-32], was observed only for Co(d)
Fig. 6. FT-IR absorbance spectra of NO adsorbed on various CoMoS/Al2O3 catalysts. Sample notations are described in sec-tion 2.1.
Fig. 7. Temperature-programmed sulfidation (TPS) of various sam-ples. Sample notations are described in section 2.1. Mass sig-nal representing H2S (m/e=34) was measured.
Fig. 8. Temperature-programmed reduction (TPR) of sulfide cat-alysts. Sample notations are described in section 2.1.
Preparation of CoMoS catalysts for hydrodesulfurization using methylacetoacetate as a chelating agent 315
Korean J. Chem. Eng.(Vol. 29, No. 3)
Mo(c) and Co(d)Mo(c)_2M.
Peak I, which was observed at 475 K for Mo(c), was shifted to
450 K for Co(d)Mo(c) and further to 445 K for Co(d)Mo(c)_2M.
Accordingly, it can be concluded that the reactivity of the Sx species
located at the edges of MoS2 slabs was enhanced by Co promotion
and to a greater extent by the addition of MeAA. The intensity of
Peak II was lower for Co(d)Mo(c)_2M than for Co(d)Mo(c), in-
dicating that the amount of inactive Co9S8 in the catalyst was de-
creased by the addition of MeAA.
DISCUSSIONS
1. Co(M)Mo(c) Prepared from Co(MeAA)2·2H2O
Fig.1 demonstrates that Co(M)Mo(c), prepared using Co(MeAA)2·
2H2O as a new Co precursor, was more active than catalysts pre-
pared from Co(NO3)2·6H2O and using EDTA as a chelating agent.
The improved activity of Co(M)Mo(c) originated from two fac-
tors. One was the high dispersion of MoS2 crystallites, as indicated
by HRTEM images (Fig. 4) showing the shortest average length of
MoS2 slabs (Table 2) for Co(M)Mo(c).
The other factor was that Co-Mo interactions were greater when
Co(MeAA)2·2H2O, instead of Co(NO3)2·6H2O, was used as a Co
precursor. IR observations of NO adsorbed on sulfided catalysts
(Fig. 6) indicated that the Mo surface was covered with Co to a great-
er extent in Co(M)Mo(c) and Co(d)Mo(c)_2M than in Co(d)Mo(c),
obviously because Co-Mo interactions were stronger in the former
catalysts. Accordingly, the HDS-active CoMoS phase was produced
in larger amounts in the former catalysts than in Co(d)Mo(c).
2. Formation of In Situ Co(MeAA)2·2H2O
Although Co(MeAA)2·2H2O was better than Co(NO3)2·6H2O as
a Co precursor for preparing highly active HDS catalysts, there were
a few limitations to its industrial application. One was an economic
disadvantage due to the high price of Co(MeAA)2·2H2O. The oth-
ers were that NaOH and methanol were required for the synthesis
of Co(MeAA)2·2H2O and an organic solvent, 1,4-dioxane, for dis-
solving the water-insoluble Co precursor. Accordingly, we attempted
to synthesize the Co precursor in-situ on the catalyst surface sim-
ply by adding an aqueous solution of MeAA to the catalyst, without
using NaOH, methanol or an organic solvent.
IR results in Fig. 5 indicated that the surface functional groups
of Co(d)Mo(c) became similar to those of Co(MeAA)2·2H2O when
increased amounts of MeAA were added to the conventional cata-
lyst. The HDS activity of Co(d)Mo(c)_xM approached that of Co(M)
Mo(c) with an increase in the amounts of added MeAA (Fig. 2),
suggesting that Co(NO3)2 in Co(d)Mo(c) was converted to a com-
pound similar to Co(MeAA)2 by reaction with added MeAA. The
Co(MeAA)2 compound formed by in-situ synthesis promoted the
dispersion of MoS2 slabs and the formation of CoMoS phase, even-
tually to increase the overall activity and the relative rates of DDS
over HYD in HDS (Fig. 3).
However, the beneficial effect of MeAA on the catalytic activity
was not observed when MeAA was added to Co(c)Mo(c), which
was finally calcined in air after impregnation with Co(NO3)2·6H2O
(Table 1). The reaction results were in accordance with IR obser-
vations (Fig. 5), which indicated that the surface groups character-
istic to Co(MeAA)2·2H2O were not observed in Co(c)Mo(c)_2M.
Accordingly, the in-situ synthesis of Co(MeAA)2 compound pro-
ceeded only when added MeAA reacted with the surface Co(NO3)2species that remained in Co(d)Mo(c). In the case of Co(c)Mo(c),
the Co species were largely in CoOx, which did not react with MeAA.
TPS observations (Fig. 7) indicated that Co(d) was sulfided at
higher temperatures when MeAA was added to it, which agreed
with previous reports that chelating agents delayed the sulfidation
of Co eventually to suppress the formation of bulk Co sulfides and
to promote the formation of the active CoMoS phase [9-13]. It is
noteworthy that Co(d)_M was sulfided at temperatures, 400-500 K,
lower than those for Co-EDTA, which proceeded at above 650 K.
The excessive stability of the Co-EDTA complex allowed the sulfi-
dation of Co at high temperatures and eventually the growth of MoS2
slabs, which was detrimental to the catalytic activity [14,15]. HRTEM
results in this study (Fig. 4) indicated that the average length of MoS2
slabs decreased in an order, Co(d)Mo(c)>Co(E)Mo(c)>>Co(M)
Mo(c), which was in accordance with the activity results. The reactiv-
ity of the S species located at the edges of MoS2 crystallites, repre-
sented by TPR (Fig. 8), was higher in Co(d)Mo(c)_2M than in Co(d)
Mo(c), again in accordance with the activity results.
CONCLUSIONS
The HDS activity of CoMoS/Al2O3 was improved when the cata-
lyst was prepared using Co(MeAA)2·2H2O, instead of Co(NO3)2·
6H2O, as a Co precursor. The former precursor was more stable than
the latter under sulfidation condition, which delayed the sulfidation
of Co and eventually promoted the formation of the HDS-active
CoMoS phase. Catalysts of similar activity could be obtained sim-
ply by impregnating conventional catalysts, prepared using Co(NO3)2·
6H2O and finally dried in air at 393 K, with an aqueous solution of
MeAA. IR observations of the MeAA-added catalysts indicated
that the in-situ synthesis of Co(MeAA)2 proceeded on the catalyst
surface by reaction between Co and added MeAA. This method
was advantageous over the method of directly adding Co(MeAA)2·
2H2O to impregnation solution because the former method was
cheaper and free from using a basic material and organic solvent,
unlike the latter method.
ACKNOWLEDGEMENT
This work was supported by Brain Korea 21 Project (BK21) and
SK Innovation Co., Ltd.
REFERENCES
1. C. Song and X. Ma, Appl. Catal. B: Environ., 41, 207 (2003).
2. S. Eijsbouts, A. A. Battiston and G. C. van Leerdam, Catal. Today,
130, 361 (2008).
3. S. J. Moon and S. K. Ihm, Korean J. Chem. Eng., 11(2), 111 (1994).
4. H. Topsøe and B. S. Clausen, Appl. Catal., 25, 273 (1986).
5. K. L. Kim and K. S. Choi, Korean J. Chem. Eng., 5(2), 177 (1988).
6. Y. Okamoto and T. Kubota, Catal. Today, 86, 31 (2003).
7. H. Topsøe, B. S. Clausen, R. Candia, C. Wivel and S. Mørup, J.
Catal., 68, 433 (1981).
8. C. Wivel, R. Candia, B. S. Clausen, S Mørup and Henrik Topsøe,
J. Catal., 68, 453 (1981).
9. A. J. van Dillen, R. J. A. M. Terörde, D. J. Lensveld, J. W. Geus and

316 S. I. Lee et al.
March, 2012
K. P. de Jong, J. Catal., 216, 257 (2003).
10. T. Kubota, N. Rinaldi, K. Okumura, T. Honma, S. Hirayama and Y.
Okamoto, Appl. Catal. A: Gen., 373, 214 (2010).
11. R. Cattaneo, F. Rota and R. Prins, J. Catal., 199, 318 (2001).
12. R. Cattaneo, T. Shido and R. Prins, J. Catal., 185, 199 (1999).
13. T. Shimizu, K. Hiroshima, T. Honma, T. Mochizuki and M. Yamada,
Catal. Today, 45, 271 (1998).
14. N. Frizi, P. Blanchard, E. Payen, P. Baranek, M. Rebeilleau, C.
Dupuy and J. P. Dath, Catal. Today, 130, 272 (2008).
15. S. L. González-Cortés, T. C. Xiao, P. M. F. J. Costa, B. Fontal
and M. L. H. Green, Appl. Catal. A: Gen., 270, 209 (2004).
16. D. S. Sankhla, R. C. Mathur and S. N. Misra, J. Inor. Nucl. Chem.,
42, 489 (1980).
17. M. A. Lélias, E. Le Guludec, L. Mariey, J. van Gestel, A. Travert,
L. Oliviero and F. Maugé, Catal. Today, 150, 179 (2010).
18. F. Bataille, J. L. Lemberton, P. Michaud, G. Pérot, M. Vrinat, M.
Lemaire, E. Schulz, M. Breysse and S. Kasztelan, J. Catal., 191,
409 (2000).
19. T. Kabe, A. Ishihara and Q. Zhang, Appl. Catal. A: Gen., 97, L1
(1993).
20. V. Meille, E. Schulz, M. Lemaire and M. Vrinat, J. Catal., 170, 29
(1997).
21. R. Nava, R. A. Ortega, G. Alonso, C. Ornelas, B. Pawelec and J. L. G.
Fierro, Catal. Today, 127, 70 (2007).
22. N. Y. Topsøe and H. Topsøe, J. Catal., 84, 386 (1983).
23. M. S. Rana, J. Ramírez, A. Gutiérrez-Alejandre, J. Ancheyta, L.
Cedeño and S. K. Maity, J. Catal., 246, 100 (2007).
24. P. Arnoldy, J. L. de Booys, B. Scheffer and J. A. Moulijn, J. Catal.,
96, 122 (1985).
25. K. Inamura, T. Takyu, Y. Okamoto, K. Nagata and T. Imanaka, J.
Catal., 133, 498 (1992).
26. M. de Boer, A. J. van Dillen, D. C. Koningsberger and J. W. Geus,
J. Phys. Chem., 98, 7862 (1994).
27. R. Iwamoto, K. Inamura, T. Nozaki and A. Iino, Appl. Catal. A: Gen.,
163, 217 (1997).
28. S. I. Lee, A. Cho, J. H. Koh, S. H. Oh and S. H. Moon, Appl. Catal.
B: Environ., 101, 220 (2011).
29. M. Li, H. Li, F. Jiang, Y. Chu and H. Nie, Fuel, 88, 1281 (2009).
30. B. Scheffer, N. J. J. Dekker, P. J. Mangnus and J. A. Moulijn, J.
Catal., 121, 31 (1990).
31. P. J. Mangnus, A. Riezebos, A. D. Vanlangeveld and J. A. Moulijn,
J. Catal., 151, 178 (1995).
32. N. K. Nag, D. Fraenkel, J. A. Moulijn and B. C. Gates, J. Catal.,
66, 162 (1980).