Preparation of Activated Carbon from Caribbean …725410/FULLTEXT01.pdfKE202X Master Thesis in...
50
1 KUNGLIGA TEKNIKSKA HÖGSKOLAN Preparation of Activated Carbon from Caribbean Pine by Chemical Activation Johanna Ahnemark Sandra Marques Department of Chemical Engineering Royal Institute of Technology (KTH) Stockholm, Sweden September 2013
Transcript of Preparation of Activated Carbon from Caribbean …725410/FULLTEXT01.pdfKE202X Master Thesis in...

1
KUNGLIGA TEKNIKSKA HÖGSKOLAN
Preparation of Activated Carbon from Caribbean Pine by Chemical Activation
Johanna Ahnemark Sandra Marques
Department of Chemical Engineering Royal Institute of Technology (KTH)
Stockholm, Sweden
September 2013
KE202X Master Thesis in Chemical Engineering Preparation of Activated Carbon from Caribbean Pine by Chemical Activation
2
Preparation of Activated Carbon from Caribbean Pine by chemical activation
Johanna Ahnemark
Sandra Marques
Supervisors
Rolando Zanzi Vigouroux Department of Chemical Engineering and Technology
Royal Institute of Technology (KTH) Stockholm, Sweden
Francisco Márquez Montesino
Facultad de Forestal y Argonomia Departamento de Química
Universidad de Pinar del Río “Hermanos Saiz Montez Oca“ Pinar del Río, Cuba
Examiner
Henrik Kusar
Department of Chemical Engineering and Technology Royal Institute of Technology (KTH)
Stockholm, Sweden

KE202X Master Thesis in Chemical Engineering Preparation of Activated Carbon from Caribbean Pine by Chemical Activation
3
Abstract Activated carbon, AC, is a porous material derived from a feedstock containing carbon that has been activated to open up millions of small pores between the carbon atoms. The structure of the material enables the material to effectively adsorb both gaseous and liquid compounds. Examples of different kinds of raw materials are nutshells, wood, some polymers and coal. In this project the activated carbon will be produced from the tree Caribbean Pine, which is a very common plant on Cuba. The consumption of activated carbon is increasing worldwide and therefore is the importance of research is great. It is of interest to investigate from which renewable sources activated carbon can be produced.
In the first section of experiments the physical properties of the raw material, saw dust from the plant, were determined. The analyzed properties were humidity, ash content and volatile matter. The activated carbon was then produced by chemical activation with phosphoric acid as an impregnation agent that was applied during varied time and heated at different temperatures.
The main purpose for this project was to, by varying the parameters temperature (400 ˚C and 500 ˚C), acid concentration (10%, 25% and 40%), relative impregnation (0.75, 1.35 and 2.0) and impregnation time (1 h, 2 h and 3 h), evaluate which parameters that affect the product. Also, an investigation was made to determine the interaction of the different parameters. This was done by analysing the properties of the AC with gas adsorption of gasoline and ammonia. Liquid adsorption was analysed with iodine number and the yield of the AC was calculated with two different methods.
In general an increasing of the temperature and the impregnation time results in a higher iodine number and higher capacity to absorb gasoline in the produced activated carbon. When the conditions were too strong the iodine number and the capacity to absorb gasoline decreased. The pore structure of the activated carbon is destroyed by too strong conditions.
The results were also analysed with a computer program to establish statistical evidence of influence from the parameters indicating that temperature has strong effect on iodine number of the produced activated carbon. If the AC from Caribbean Pine would be commercially produced the recommended design is to keep all parameters low. This is both cost effective and energy efficient.
Based on the experimental results it was determined that the AC from Caribbean Pine is better suited for adsorbing gasoline compared with ammonia. Furthermore, the adsorption of gasoline is increasing with an increasing temperature. An industrial manufactured AC was compared with the AC produced from Caribbean Pine and it had a better liquid and gas adsorption showing that more research and optimization of AC from Caribbean Pine must be done before commercializing the product.
A suggestion for further research is to use the time in the oven as a parameter to be varied in the experimental setup. This could be valuable in order to determine the influence of the time in the oven both concerning the yield but also the adsorption ability of the AC.

KE202X Master Thesis in Chemical Engineering Preparation of Activated Carbon from Caribbean Pine by Chemical Activation
4
Sammanfattning Aktivt kol, AK, är ett poröst material som utvinns från ett råmaterial som innehåller kol som aktiveras för att öppna upp miljontals små porer mellan kolatomerna. Strukturen hos materialet gör det möjligt för materialet att effektivt adsorbera både gasformiga och flytande föreningar. Exempel på olika typer av råvaror är nötskal, trä, vissa polymerer och kol. I detta projekt kommer det aktiva kolet framställas från trädet karibisk tall, en mycket vanlig växt på Kuba. Förbrukningen av aktivt kol ökar i världen och därför är betydelsen av forskning stor. Det är också av intresse att undersöka från vilka förnybara källor aktivt kol kan produceras.
I de första experimenten bestämdes de fysikaliska egenskaperna hos råvaran, sågspån från karibisk tall. De analyserade egenskaperna var fukthalt, askhalt och andel flyktiga ämnen. Det aktiva kolet framställdes därefter genom kemisk aktivering, med fosforsyra som ett impregneringsmedel som tillsattes under en varierad tid och värmdes vid olika temperaturer.
Det huvudsakliga syftet med projektet var att, genom att variera parametrarna temperatur, koncentrationen av syra, relativ impregnering och impregneringstid, utvärdera vilka parametrar som påverkar produkten. Dessutom gjordes en undersökning för att bestämma interaktionen av de olika parametrarna. Detta gjordes genom att analysera egenskaperna hos AK med gasadsorption av bensin och ammoniak. Adsorptionen av ämnena i vätskefas analyserades med jodtal och utbytet beräknades med två olika metoder.
Allmänt en ökande av temperaturen och impregneringstid resulterade i ett högre jodtal och högre kapacitet att absorbera bensin hos det producerade aktiva kolet. När förhållandena är alltför starka, minskar jodtalet och förmåga att absorbera bensin. Den porstrukturen hos det aktiva kolet förstörs av för starka förhållanden.
Resultaten analyserades med ett datorprogram för att fastställa statistiska bevis för påverkan från parametrarna. Resultaten visade att temperaturen har en stark effekt på jodtalet hos det producerade aktiva kolet. Om AK från karibisk tall skulle tillverkas rekommenderas därför att alla parametrar hålls låga. Detta är bra både ur ett kostnads‐ och energi perspektiv.
Baserat på de experimentella resultaten fastställdes att det aktiva kolet är bättre lämpat för adsorption av bensin än ammoniak. Vidare ökar adsorptionen av bensin med en ökande temperatur. Ett industriellt tillverkat AK jämfördes med AK från karibisk tall och det hade en bättre vätske‐ och gasadsorption vilket visar att mer forsking och optimering måste göras innan AK från karibisk tall kan kommersialiseras.
Ett förslag för kommande forskning är att använda tiden i ugnen som en variabel. Detta kan vara värdefullt för att bestämma hur tiden i ugnen påverkar utbyte och adsorptionsförmågan.

KE202X Master Thesis in Chemical Engineering Preparation of Activated Carbon from Caribbean Pine by Chemical Activation
5
Acknowledgement This project had not been able to be accomplished without help from our supervisor at the Royal Institute of Technology, KTH, Rolando Zanzi Vigouroux. We would like to give a special thanks to our supervisor, who helped us with the scholarship to make the trip to Pinar del Río University on Cuba possible, who gave us information regarding flights, transfers, accommodation and visa. He also supplied us with all the necessary equipment we needed to finish our laboratory work at KTH in Stockholm. He has also been a support in that manner that he has always had time for us to exchange ideas, results and much more. Thanks also to our supervisors on Cuba; Leonardo Aguiar, Julián Triana Dopico and Boris who had patience with us during our experimentation time on Cuba. Finally, thanks to the entire laboratory team that helped us with materials, equipment and chemicals.

KE202X Master Thesis in Chemical Engineering Preparation of Activated Carbon from Caribbean Pine by Chemical Activation
6
Contents
1 Introduction ..................................................................................................................................... 8
1.1 Aim and objective .................................................................................................................... 8
1.2 Limitations ............................................................................................................................... 8
2 Background ...................................................................................................................................... 9
2.1 Caribbean Pine ........................................................................................................................ 9
2.2 Activated carbon ..................................................................................................................... 9
2.2.1 Usage ............................................................................................................................... 9
2.2.2 Activated carbon on Cuba ............................................................................................... 9
2.3 Principle of activated carbon adsorption .............................................................................. 10
2.4 Emissions which can be reduced with activated carbon ....................................................... 10
2.4.1 Nitrogen oxides, NOx ..................................................................................................... 10
2.4.2 Sulphur oxides ............................................................................................................... 10
2.5 Factors that influence the activated carbon ability to adsorb .............................................. 11
2.6 Methods for production of activated carbon ........................................................................ 11
2.6.1 Physical reactivation ...................................................................................................... 11
2.6.2 Chemical activation ....................................................................................................... 11
3 Methodology ................................................................................................................................. 12
3.1 Feed stock .............................................................................................................................. 12
3.2 Design computer program .................................................................................................... 12
3.3 Optimizing of parameters...................................................................................................... 12
4 Experimental setup ....................................................................................................................... 13
4.1 Humidity ................................................................................................................................ 13
4.1.1 Calculations of humidity ................................................................................................ 13
4.2 Ash content ........................................................................................................................... 13
4.2.1 Calculations of ash content ........................................................................................... 13
4.3 Volatility ................................................................................................................................ 14
4.3.1 Calculations of volatility ................................................................................................ 14
4.4 Preparation of activated carbon ........................................................................................... 15
4.4.1 Phosphoric acid ............................................................................................................. 15
4.4.2 Chemical activation ....................................................................................................... 15
4.4.3 Parameters and influence ............................................................................................. 16
4.4.4 Preparations of the acids ............................................................................................... 16
5 Analysis .......................................................................................................................................... 17

KE202X Master Thesis in Chemical Engineering Preparation of Activated Carbon from Caribbean Pine by Chemical Activation
7
5.1 Adsorption ............................................................................................................................. 17
5.1.1 Gas phase adsorption .................................................................................................... 17
5.1.2 Liquid adsorption ........................................................................................................... 20
5.2 Yield ....................................................................................................................................... 21
5.2.1 Product yield .................................................................................................................. 22
6 Results ........................................................................................................................................... 24
6.1 Influence of temperature on gasoline adsorption ................................................................ 25
6.2 Influence of relative impregnation on gasoline adsorption .................................................. 27
6.3 Influence of impregnation time on gasoline adsorption ....................................................... 29
6.4 Influence of acid concentration time on gasoline adsorption .............................................. 31
6.5 Influence of temperature on iodine number ........................................................................ 33
6.6 Influence of relative impregnation on iodine number .......................................................... 35
6.7 Influence of impregnation time on iodine number ............................................................... 37
6.8 Influence of acid concentration on iodine number ............................................................... 39
7 Discussion ...................................................................................................................................... 41
7.1 Preparation of activated carbon ........................................................................................... 41
7.2 Yield ....................................................................................................................................... 41
7.3 Gas adsorption ...................................................................................................................... 41
7.3.1 Adsorption of ammonia................................................................................................. 42
7.3.2 Adsorption of gasoline .................................................................................................. 42
7.4 Liquid adsorption ................................................................................................................... 42
7.4.1 Iodine number ............................................................................................................... 42
8 Conclusions .................................................................................................................................... 43
9 Bibliography ................................................................................................................................... 44
10 Appendix .................................................................................................................................... 46
10.1 Design Expert results for ammonia. ...................................................................................... 46
10.2 Design Expert results for the yield. ....................................................................................... 47
10.3 Design Expert results for the product yield. .......................................................................... 48
10.4 Design Expert results for gasoline. ........................................................................................ 49
10.5 Design Expert results for iodine number. .............................................................................. 50

KE202X Master Thesis in Chemical Engineering Preparation of Activated Carbon from Caribbean Pine by Chemical Activation
8
1 Introduction Activated carbon, AC, is a porous material derived from feedstock containing carbon. The structure of the material enables the material to effectively adsorb both gaseous and liquid compounds. Different raw material can be used to produce activated carbon such as coal, wood, lignite, shells from varying fruits and nuts and some polymers. (T. Vernersson, 2001) The consumption of activated carbon is increasing worldwide and therefor the importance of research is great. Also it is of interest to investigate from which renewable sources activated carbon can be produced. (Department of Agriculture, Fisheries and Forestry, 2010)
This project was dived in two parts. First different sets of activated carbon were prepared from Caribbean Pine at Universidad de Pinar del Río in Pinar del Río on Cuba. Analysis of the AC, adsorption of gasoline and ammonia, was also conducted on Cuba. The samples of AC were later analysed in Sweden at KTH, both adsorption of gasoline, ammonia and iodine number were performed.
This report contains a short description of activated carbon, its characteristics and applications, an explanation of the experimental setup and analysis of the results and conclusion.
1.1 Aim and objective In this project the aim was to suggest how to design the parameter setup when producing activated carbon from the tree Caribbean Pine and determine if the raw material is suitable for production of AC. In order to meet this goal the objective was to prepare activated carbon with different parameters and evaluate which parameters affect the product. Also the object was to investigate the interaction of the different parameters.
1.2 Limitations For this study the feed stock to analyse was Caribbean Pine. The parameters investigated were temperature, acid concentration, impregnation time and relative impregnation and the values of these criteria were decided in a previous laboratory setup. Also, the only impregnation agent investigated was phosphoric acid. For analysis a computer program tool was suggested to be used. However, additional manual analyses have been made comparing the parameters in graphs.

KE202X Master Thesis in Chemical Engineering Preparation of Activated Carbon from Caribbean Pine by Chemical Activation
9
2 Background To improve the understanding of the investigation of activated carbon is it important to have a general knowledge about the field. Therefore will the background section of the report contain information about the raw material, Caribbean Pine, its properties, which areas the AC is useful in, which compounds that could be reduced and further more.
2.1 Caribbean Pine Caribbean Pine, Pinus Carribea, is distributed in Central America, Cuba and the Bahamas. It is also grown on plantations worldwide. One region on Cuba were it is native is in Pinar del Río, that is a province that is located in the west of Cuba. The Pine is around 20‐30 m tall, has a diameter about 0.6‐1.0 m and an average dried weight close to 625 kg/m3. (Department of Agriculture, Fisheries and Forestry, 2010) (Caribbean Pine, 2013) Cuba has a varied humidity during the different seasons. During the period when the experiments were conducted was the relative humidity high; during March it was around 75%, compared with Sweden, Stockholm, when it is around 55‐65% during the same period. (Weather history, 2013) The two main sectors that the Caribbean Pine are used in are purification and within the construction sector. Caribbean Pine is a decorative wood and an important timber tree that has many uses as a material for production and for construction. Applications are in furniture’s, plywood, for frames, laminated beams, flooring and playground equipment. Other applications for Caribbean Pine are as scaffold planks, wood wool and paper products. (Department of Agriculture, Fisheries and Forestry, 2010) (Pinus caribaea (Caribbean pine))
2.2 Activated carbon Activated carbon, AC, may also be called activated charcoal or activated coal. AC is a worldwide expanding product and the usage of it is likewise increasing. AC is created from a various numbers of carboneous materials that is treated with oxygen to open up millions of small pores between the carbon atoms. Examples of different kinds of raw materials are nutshells, wood, some polymers and coal. In this project will the activated coal be produced from the tree Caribbean Pine, a very common plant on Cuba. Factors that affects if the activated carbon is suitable manufacturing or not is a combination of factors such as; economy, AC capability and its characteristics. (Anne Marie Helmenstine)
2.2.1 Usage The main reason why the usage of AC is expanding in the world is because of its complexness. AC is suitable to remove a variety of compounds in streams depending if the stream is in a gaseous or a liquid phase. The purpose for the material is to increase the surface area and to form a porous area were the adsorption and chemical reactions can occur. A higher amount of adsorbed compounds and a larger number of chemical reactions will achieve a higher purification and separation with the activated carbon which is highly desirable. (Ohlson)
2.2.2 Activated carbon on Cuba In order to decrease the extensive import of activated carbon to Cuba a factory to produce AC opened in 1998. Still there is a large import to the country, around 600 ton every year for a cost of 8 million dollars (Ingenieros escoceses buscan la solución para una pesadilla cubana, 2012). The raw material used today is coconut because of its low ash content and high iodine number. The capacity of the plant is said to be 500 ton produced AC per year, but the limiting factor is access to raw material and the highest amount produced is 100 ton per year leaving Cuba importing AC with a high capital investment. (Baracao, 2010)

KE202X Master Thesis in Chemical Engineering Preparation of Activated Carbon from Caribbean Pine by Chemical Activation
10
Activated carbon is an important product that is used in several areas on Cuba. The main industrial processes are medicine‐, sugar‐, and beverage production. It is also used within biotechnology and water treatment. (Baracao, 2010) In medicine it can be used to selectively remove/absorb toxic compounds. Another application is to use AC in waste water treatment as a cleaning step. (Anne Marie Helmenstine)
New research shows that AC also can be used in the production of batteries with high energy content at a low cost since the material conduct electricity. (Ingenieros escoceses buscan la solución para una pesadilla cubana, 2012; Lars Ivar Elding, 2013)
2.3 Principle of activated carbon adsorption The separation occurs when the gas comes in contact with a solid porous phase, adsorbent, and the pollutants in the gas phase bind to the surface. Forces that enable the molecules in the gas phase to connect to the adsorbent can be physical, van der Waal, or chemical, ionic ‐ or covalent bond. The chemical force is stronger than the physical due to the properties of the bonds. The performance of the adsorption depends on the fluid‐solid equilibrium and mass transfer rates. (Anne Marie Helmenstine)
There are several common adsorbents such as activated carbon, silica, aluminium oxide, zeolites and polymeric adsorbents. Which adsorbent that is applied depend on the components that is going to be separated. (Kan‐Carbon Private Limited, 2011)
2.4 Emissions which can be reduced with activated carbon Pollutants that can be treated with AC are mainly nitrogen‐ and sulphur oxides. These have negative impact on different environmental systems. (Ohlson)
2.4.1 Nitrogen oxides, NOx Nitrogen monoxide and nitrogen dioxide, out of the seven known nitrogen oxides, ΝΟ/ ΝΟ2/ ΝΟ3/ Ν2Ο/Ν2Ο3/ Ν2Ο4 / Ν2Ο5, are the two compounds that are significantly important for atmospheric pollution problems. For this reason is the name NOx commonly used. Nitrogen monoxide, NO, is a colourless and tasteless gas while nitrogen dioxide, ΝΟ2, has a red brown colour and is soluble in water, is a powerful oxidant and has a peculiar odour. NO and NO2 contributes to the formation of ground level ozone and acidic rain. Nitrogen compounds also contribute to the eutrophication. (Hansson).
2.4.2 Sulphur oxides Sulphur dioxide, SO2, is a colourless gas, odourless in low concentration but with an intense irritant odour in very high concentrations. It is know that SO2 has a bad influence on the health of people with respiratory problems either by itself or together with particular matter. The main sources of this pollutant in the atmosphere are energy producing plants, oil refineries, chemical plants and paper plants. It can cause alterations in vegetation and material, as well as decreases visibility and increases acidity in lakes and rivers. Sulphur dioxide is one of the elements that form acid rain. (Sabelström, 2013)

KE202X Master Thesis in Chemical Engineering Preparation of Activated Carbon from Caribbean Pine by Chemical Activation
11
2.5 Factors that influence the activated carbon ability to adsorb When activated carbon is going to be used it is important to consider factors that might influence the result. There are several factors that impact the effectiveness of the AC. The absorption of the AC depends on the pore size and distribution varies depending on the source of the carbon and the manufacturing process. General is larger organic molecules easier for the AC to absorb compared with smaller molecules. The adsorption capability tends to increase as the surrounding pH and temperature decrease. Contaminants are also removed more effectively if they are in contact with the activated carbon during longer time, which means that the flow rate through the carbon affects the filtration. (Anne Marie Helmenstine)
2.6 Methods for production of activated carbon There are two different methods, physical ‐and chemical activation. The processes are described below.
2.6.1 Physical reactivation The activated carbon is produced by carbonization and activation of the raw material using different gases. First the material is carbonized by pyrolysis at high temperatures, 500‐900°C, in absence of air. The activating step also known as oxidation occurs when the material is exposed to an oxidizing surrounding, carbon dioxide, oxygen or steam, during high temperatures, 800‐100°C. (Mansooreh Soleimani, 2007) The first step, carbonization, is performed to remove non‐carbon‐elements from the raw material and in the activating stage the desired porosity of the material is developed. (Joana M. Dias, 2007)
2.6.2 Chemical activation In the chemical activation the material is impregnated before carbonation with an acid or base. This is done to lowering the activation temperature and assists to create the porosity of the AC by dehydration and degradation. This is a one‐step method and these steps occur simultaneously. (Joana M. Dias, 2007)
Advantages with this method compared to physical reactivation are higher yield and lower energy cost as a result of the lower activation temperatures. Furthermore the porosity increases and activation time decreases. (Joana M. Dias, 2007)
The main problems with this method are higher costs and residues of the chemical substance used can stay in the product, corrosiveness and a cleaning stage is necessary to remove the chemical agent. (Mansooreh Soleimani, 2007)
KE202X Master Thesis in Chemical Engineering Preparation of Activated Carbon from Caribbean Pine by Chemical Activation
12
3 Methodology
3.1 Feed stock The raw material that was used to produce the activated carbon is a common plant in Cuba named Caribbean Pine, in latin Pinus Caribaea. It grows easily and does not demand extensive amounts of care. These features are preferred if the purpose of the AC is to be commercialized. (Caribbean Pine)
3.2 Design computer program The computer program that was used is called Design Expert Stat‐Ease and the software is developed in England, New Castle. It is a multifunctional program that preferably is applied in situations where a company wants to improve the quality in an experiment, develop efficient experiments, quickly solve manufacturing problems and make breakthroughs in processes. (History of Stat‐Ease)
Stat‐Ease is a program that uses statistical simulations methods. In this project it minimized the numbers of experiment that had to be performed to get a valid result. The purpose of the program was to generate a flow sheet for the analysis. It calculated the minimum respectively the maximum value of each of the four factors, temperature, concentration, impregnation time and relative impregnation that should be analysed. (History of Stat‐Ease)
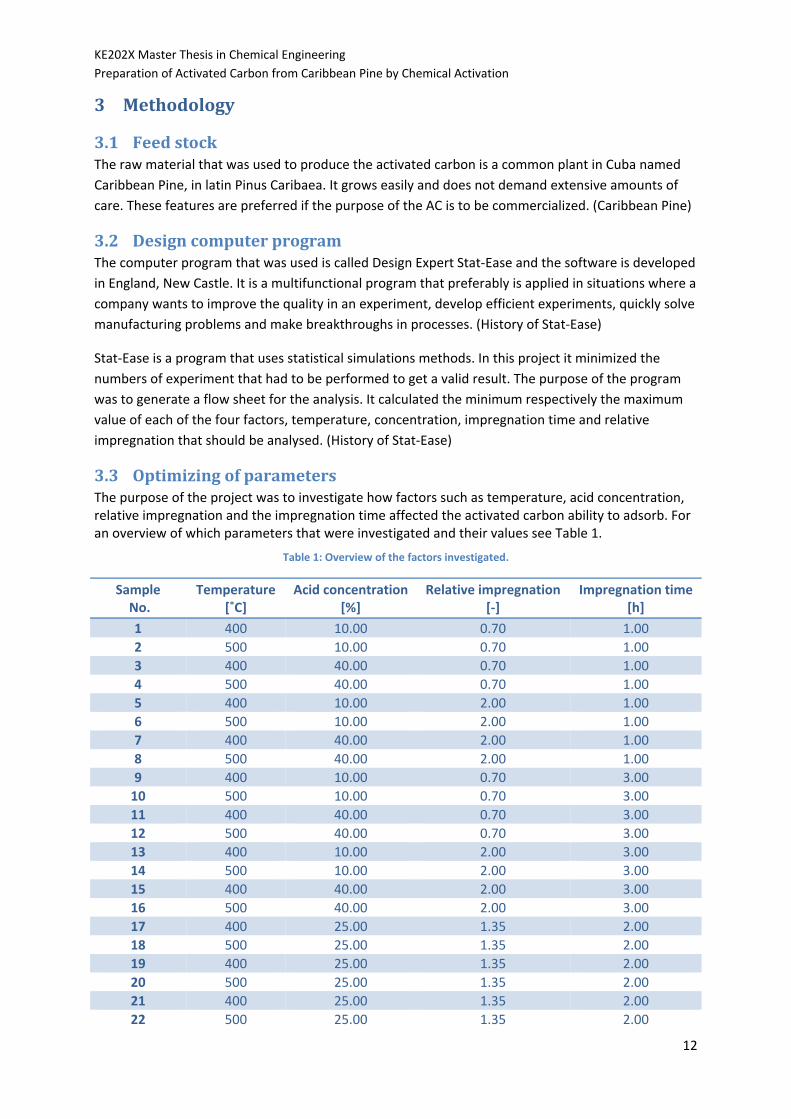
3.3 Optimizing of parameters The purpose of the project was to investigate how factors such as temperature, acid concentration, relative impregnation and the impregnation time affected the activated carbon ability to adsorb. For an overview of which parameters that were investigated and their values see Table 1.
Table 1: Overview of the factors investigated.
Sample No.
Temperature [˚C]
Acid concentration [%]
Relative impregnation [‐]
Impregnation time [h]
1 400 10.00 0.70 1.00 2 500 10.00 0.70 1.00 3 400 40.00 0.70 1.00 4 500 40.00 0.70 1.00 5 400 10.00 2.00 1.00 6 500 10.00 2.00 1.00 7 400 40.00 2.00 1.00 8 500 40.00 2.00 1.00 9 400 10.00 0.70 3.00 10 500 10.00 0.70 3.00 11 400 40.00 0.70 3.00 12 500 40.00 0.70 3.00 13 400 10.00 2.00 3.00 14 500 10.00 2.00 3.00 15 400 40.00 2.00 3.00 16 500 40.00 2.00 3.00 17 400 25.00 1.35 2.00 18 500 25.00 1.35 2.00 19 400 25.00 1.35 2.00 20 500 25.00 1.35 2.00 21 400 25.00 1.35 2.00 22 500 25.00 1.35 2.00

KE202X Master Thesis in Chemical Engineering Preparation of Activated Carbon from Caribbean Pine by Chemical Activation
13
4 Experimental setup The first stage was to determine the physical properties of the raw material, saw dust from the plant Caribbean Pine. The analyzed properties were humidity, ash content and volatile matter.
4.1 Humidity Cuba is a country with a high ‐and a varied level of humidity in the air, therefore is it of importance that the humid is calibrated before each new experiment. The humidity, residual moisture, was calculated by following steps:
1. The oven was set to 107 ˚C, when the temperature was obeyed were the empty crucible placed in the oven during 8 min.
2. Then were it placed in a desiccator during 15 min and the empty crucible was weighed, mcrucible. 3. The raw material mass was placed in the crucible and measured, m before, and after that placed in
the oven again during one hour. 4. Finally the crucible with the heated mass weight, mafter, was weighed and the humidity residual
moisture, R, could be calculated with Equation 1.
4.1.1 Calculations of humidity mcrucible=22. 6332 [g] mbefore= 29. 8252 [g] mafter= 29. 2947 [g]
mdifference= mafter‐ mbefore= 29.8252 – 29.2947= 0.5305 [g]
100
29.8252 29.2947 100 7.376[%] 7.4[%]29.8252 22.6332
before after
before crucible
m mR
m m
R
−= ⋅
−
−→ = ⋅ = ≈
−
Equation 1
4.2 Ash content 1. The oven was installed to 107 ˚C were the two empty crucibles was reserved during 5 min. 2. Then was the crucibles kept in the desiccator during 15 min and then separately weight. 3. 2 g of the raw material was weight in each one of the crucibles. 4. Then were they putted in the oven in 580˚C during three hours and finally were the oven installed
to 60C so that the crucibles that contain the mass were cooling down. 5. When they were at room temperature was they placed in the desiccator during 15 min again and
lastly weight.
4.2.1 Calculations of ash content See Equation 2 for the calculated ash content.
mcrucible1= 20. 4200 [g] mcrucibel2= 18. 6142 [g]
mbefore1= 1. 9809 [g] mbefore2= 1. 9867 [g]
mafter1= 20. 4317 [g] mafter2= 18. 6247 [g]

KE202X Master Thesis in Chemical Engineering Preparation of Activated Carbon from Caribbean Pine by Chemical Activation
14
100[%]after crucible
before
m mA
m−
= ⋅ Equation 2
20.4317 20.42001 100 100 0.5906[%]1.9809
after crucible
before
m mA
m− −
→ = ⋅ = ⋅ =
18.6247 18.61422 100 100 0.5286[%]1.9867
after crucible
before
m mA
m− −
→ = ⋅ = ⋅ =
4.3 Volatility 1. The oven was set to 107 ˚C, when the temperature was obeyed were the empty crucible placed in
the oven during 8 min. 2. Then were it placed in a desiccator during 15 min and the empty crucible was weigh, mcrucible. 3. The raw material mass was placed in the crucible and measured, m before, and after that placed in
the oven again at 900 ˚C during 7 min. 4. The crucible was then cooled on a metal tray and after that placed in the desiccator. 5. Finally were the crucible with the sample was weighed, mafter, and the volatile content could be
calculated with Equation 3.
4.3.1 Calculations of volatility Mcrucible= 33. 2452 [g] mbefore= 34. 2456 [g] mafter= 33. 3743 [g]
100( )
34.2456 33.3743 7.37625 79.4845[%]34.2456 33.2452
before after
before cruicble
m mV R
m m
V
−= −
−
−→ = − =
−
Equation 3
The total composition of the raw material, saw dust from Caribbean Pine, is shown in Figure 1.
Figure 1: Summary of sawdust composition.
Volatiles [%]79,5%
Ash [%]0,6%
Moisture [%]7,4%
Fixed carbon [%]12,6%
Sawdust composition

KE202X Master Thesis in Chemical Engineering Preparation of Activated Carbon from Caribbean Pine by Chemical Activation
15
4.4 Preparation of activated carbon As written before the activated carbon was derived from the common tree on Cuba Caribbean Pine. The wood had to be completely dried and thereafter grated finely in order to be used in the experiments.
4.4.1 Phosphoric acid In this investigation was chemical activation used and the impregnation agent was phosphoric acid. Earlier research shows that this method as well as using phosphoric acid is to prefer according to similar experimental setups. (Birbas, 2011)
Phosphoric acid, H3PO4, is a medium power colorless acid. In waters solution it is not as reactive as other acids. Not the acid or the salts derived from it are poisonous. (Lars Ivar Elding, 2013)
4.4.2 Chemical activation In general, activated carbon is formed when the carbon rich raw material is treated with acid and then heated. This procedure creates the porous structure crucial for the activated carbon. In this case approximately 10 g of the saw dust were put in a crucible and the acid was added with the concentration and relation according to the design scheme. Saw dust and acid is mixed and then impregnated for a period of time. The sample was then placed in the oven at 400°C or 500°C for 20 minutes. Formation of the active carbon is now realized. When the 20 minutes had passed the sample was cooled in room temperature for five minutes then placed in a desiccator for 15 minutes. The samples are weighed and the yield is calculated. After is the AC is washed with distillated water until the pH reaches 6 or above. The samples are then dried in the oven at 60°C during 40 minutes and placed in closed containers to be analyzed later. The different samples are displayed in Figure 2.
Figure 2: Samples of activated carbon for analysis.

KE202X Master Thesis in Chemical Engineering Preparation of Activated Carbon from Caribbean Pine by Chemical Activation
16
4.4.3 Parameters and influence Four parameters were varied in order to show if an influence of the separated parameters could be displayed, temperature of the oven, acid concentration, impregnation relation and time of impregnation. Also the interaction of the parameters was investigated. The highest and the lowest value were put into the design program and the middle value was calculated by the program. The temperature of the oven was set to 400°C respectively 500°C. The concentration of the phosphoric acid was set to 10%, 25% and 40%. The relative impregnation was set to 0.7, 1.35 and 2.0 which is a volume ratio of the acid and the raw material. The impregnation time was set to one hour, two hours and three hours.
4.4.4 Preparations of the acids In order to vary the acid concentration in the samples three different solutions of the phosphoric acid were made. The concentrations were set at 10%, 25% and 40%. To vary the relative impregnation different amounts of the acids were mixed with the saw dust. This ratio was calculated using volume as a reference. 10 grams of sawdust corresponds to 35 ml acid. Therefor a ratio of 0.7 corresponds to 24.5 ml acid, 1.35 corresponds to 47.25 ml acid and 2.0 correspond to 70 ml acid.
KE202X Master Thesis in Chemical Engineering Preparation of Activated Carbon from Caribbean Pine by Chemical Activation
17
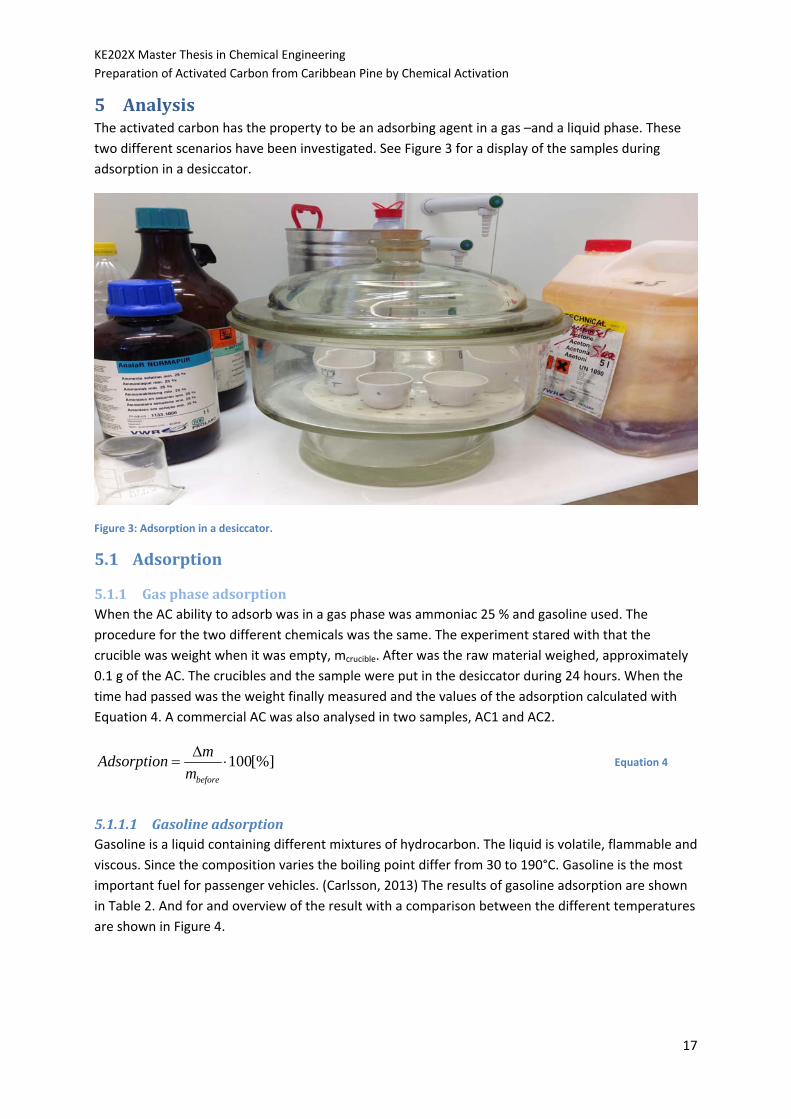
5 Analysis The activated carbon has the property to be an adsorbing agent in a gas –and a liquid phase. These two different scenarios have been investigated. See Figure 3 for a display of the samples during adsorption in a desiccator.
Figure 3: Adsorption in a desiccator.
5.1 Adsorption
5.1.1 Gas phase adsorption When the AC ability to adsorb was in a gas phase was ammoniac 25 % and gasoline used. The procedure for the two different chemicals was the same. The experiment stared with that the crucible was weight when it was empty, mcrucible. After was the raw material weighed, approximately 0.1 g of the AC. The crucibles and the sample were put in the desiccator during 24 hours. When the time had passed was the weight finally measured and the values of the adsorption calculated with Equation 4. A commercial AC was also analysed in two samples, AC1 and AC2.
100[%]before
mAdsorptionmΔ
= ⋅ Equation 4
5.1.1.1 Gasoline adsorption Gasoline is a liquid containing different mixtures of hydrocarbon. The liquid is volatile, flammable and viscous. Since the composition varies the boiling point differ from 30 to 190°C. Gasoline is the most important fuel for passenger vehicles. (Carlsson, 2013) The results of gasoline adsorption are shown in Table 2. And for and overview of the result with a comparison between the different temperatures are shown in Figure 4.

KE202X Master Thesis in Chemical Engineering Preparation of Activated Carbon from Caribbean Pine by Chemical Activation
18
Table 2: Experiment results of gasoline adsorption.
Sample No.
mcrucible
[g] mbefore
[g] mafter
[g] Δm [g]
Adsorption [%]
1 21.87 1.00 22.84 0.97 96.42 2 21.81 1.00 22.36 0.55 55.00 3 25.37 1.00 25.95 0.58 58.39 4 22.34 1.00 23.35 1.01 100.85 5 20.95 1.00 21.48 0.53 53.08 6 22.85 1.00 23.74 0.89 89.17 7 27.37 1.00 27.78 0.41 40.93 8 27.36 1.00 28.04 0.68 68.24 9 22.85 1.00 23.82 0.97 97.11 10 20.95 1.00 21.87 0.92 92.05 11 22.84 1.00 23.80 0.96 95.80 12 25.36 1.00 26.38 1.02 101.57 13 21.81 1.00 22.72 0.91 90.77 14 21.87 1.00 22.97 1.10 109.59 15 21.87 1.00 22.88 1.01 101.23 16 21.81 1.00 22.84 1.03 102.64 17 25.36 1.00 26.37 1.01 100.46 18 22.84 1.00 23.94 1.10 109.95 19 20.95 1.00 21.95 1.00 99.80 20 22.85 1.01 24.26 1.41 139.66 21 27.37 1.00 28.20 0.83 82.82 22 27.36 1.00 28.68 1.32 132.08 AC 1 27.36 1.00 28.70 1.34 134.24 AC 2 23.31 1.00 24.70 1.39 138.70
Figure 4: Gasoline adsorption, comparison between 400°C and 500°C.
0
20
40
60
80
100
120
140
160
1 2 3 4 5 6 7 8 9 10 11 12 13 14 15 16 17 18 19 20 21 22
Adsorption [%
]
Sample No.
Gasoline adsorption
T= 400 °C
T= 500 °C

KE202X Master Thesis in Chemical Engineering Preparation of Activated Carbon from Caribbean Pine by Chemical Activation
19
5.1.1.2 Ammonia adsorption Ammonia, NH3, is a colorless gas in room temperature with a density lower than air. The odor is intense and at low concentration irritating for the eyes and respiratory system. At high concentration NH3 is dangerous and poisonous for the mucous membrane and respiratory system if inhaled. The gas is easily soluble in water releasing heat. Ammonia is one of the most produced chemical components with the highest applications within fertilization, explosives and plastic industry. (Elding, 2013) The results of ammonia adsorption are shown in Table 3.
Table 3: Experiment results of ammonia adsorption.
Sample No.
mcrucible
[g] mbefore
[g] mafter
[g] Δm [g]
Adsorption [%]
1 23.83 0.96 24.87 0.09 8.88 2 21.04 1.00 22.11 0.07 6.71 3 21.10 1.01 22.20 0.10 9.64 4 20.29 1.00 21.38 0.09 8.75 5 22.63 1.00 23.65 0.02 1.62 6 21.93 0.95 22.93 0.05 5.07 7 23.35 1.08 24.47 0.04 3.51 8 21.28 0.98 22.30 0.05 4.66 9 15.17 1.01 16.28 0.10 9.67 10 23.02 1.00 23.87 ‐0.15 ‐15.16 11 21.03 1.07 22.17 0.07 6.72 12 21.09 1.01 22.15 0.06 5.59 13 20.28 1.01 21.32 0.03 3.29 14 22.63 1.02 23.73 0.08 7.42 15 21.27 0.99 22.33 0.07 7.20 16 23.34 1.01 24.45 0.09 9.33 17 21.93 1.01 23.04 0.10 10.33 18 15.16 1.11 16.37 0.10 8.97 19 23.31 1.00 24.25 ‐0.06 ‐6.02 20 29.42 1.00 30.72 0.29 29.15 21 26.69 1.00 27.60 ‐0.09 ‐8.76 22 28.28 1.00 29.46 0.18 18.08 AC 1 21.27 1.00 22.50 0.22 22.11 AC 2 27.26 1.00 28.49 0.23 22.52

KE202X Master Thesis in Chemical Engineering Preparation of Activated Carbon from Caribbean Pine by Chemical Activation
20
5.1.2 Liquid adsorption To investigate the quality of the AC further liquid adsorption was tested.
5.1.2.1 Iodine number In order to evaluate the liquid adsorption of the AC the DIN 53582 standard method for determining the iodine number was used. This number corresponds to the porosity and surface area of the AC. The more iodide adsorbed the larger porosity and surface area. A 0.04N Na2S2O3 solution was titrated with 10 ml iodine mixture containing the AC sample. The iodine mixture was prepared by taking 25 ml 0.5 N of iodine solution mixing it with approximately 0.1 g AC and filtrating it before titration. The volume of Na2S2O3 required in the titration was noted and used in the calculations. For values and results see Table 4 and to calculate the Iodine number Equation 5 was used. The solutions used are displayed in Figure 5.
Figure 5: Solutions used to determine iodine number.
( )2 2 325 12 0.05 126.9044
12Na S O
sampleAC
vIodine number
m
⎡ ⎤⋅ − ⋅ ⋅⎣ ⎦=⋅
Equation 5
25 = ml iodine solution
12 = ml Na2S2O3 solution used for titration of 10 ml iodine solution as reference
VNa2S2O3 = ml of thiosulfate solution used for titration of 10 ml iodine mixture.
msampleAC = weight of AC sample [g]
126.9044 = molar weight of iodine [g/mol]
0.05 = iodine concentration [N]

KE202X Master Thesis in Chemical Engineering Preparation of Activated Carbon from Caribbean Pine by Chemical Activation
21
Table 4: Results of Iodine number analysis.
Sample No.
m sample
[g] vsol [ml]
Inumber
[mg/g]
1 0.10 11.20 105.65 2 0.10 10.60 180.56 3 0.11 9.80 274.88 4 0.10 9.70 298.37 5 0.10 11.10 119.93 6 0.10 9.90 274.31 7 0.10 11.10 120.42 8 0.10 10.20 233.51 9 0.10 10.45 200.10 10 0.10 10.35 212.38 11 0.10 10.10 251.42 12 0.10 9.70 305.26 13 0.10 11.00 132.99 14 0.10 9.50 325.92 15 0.10 10.45 205.10 16 0.10 10.00 260.99 17 0.10 10.20 234.89 18 0.10 9.20 362.17 19 0.10 10.30 222.28 20 0.10 8.50 456.28 21 0.10 10.45 204.69 22 0.10 8.20 501.33 AC 1 0.10 7.60 580.48 AC 2 0.10 7.90 533.98
5.2 Yield To determine the quantity of activated carbon that was produced the yield was calculated. The activated carbon was weighed before washing away the acid, therefor this number do not show the yield of the end product. See Equation 6 for the equation that was used to calculate the yield and Table 5 for the measured values.
100 [%]sample crucible
after crucible
m mYield
m m−
= ⋅−
Equation 6

KE202X Master Thesis in Chemical Engineering Preparation of Activated Carbon from Caribbean Pine by Chemical Activation
22
Table 5: Values and results in yield calculations.
Sample No.
mcrucible
[g] mbefore
[g] mafter
[g] Yield [%]
1 56.25 10.01 63.35 70.882 56.29 10.00 61.91 56.223 45.87 10.00 59.81 139.404 45.87 10.00 57.88 120.135 63.47 10.00 82.77 192.956 68.08 10.00 78.03 99.547 68.41 10.00 112.64 442.348 68.08 10.00 99.06 309.769 67.80 10.00 74.29 64.8710 63.47 10.00 68.85 53.7111 56.26 10.00 70.36 140.9612 63.51 10.00 75.46 119.4413 68.13 10.00 93.62 254.8614 68.47 10.00 77.78 93.1215 67.80 10.00 108.40 405.9616 68.04 10.00 98.08 300.3117 69.06 10.00 88.23 191.7518 58.57 10.00 72.65 140.7519 66.43 10.00 83.23 167.9820 68.12 10.00 81.64 135.2021 69.05 10.00 85.35 162.9922 58.62 10.00 72.55 139.22
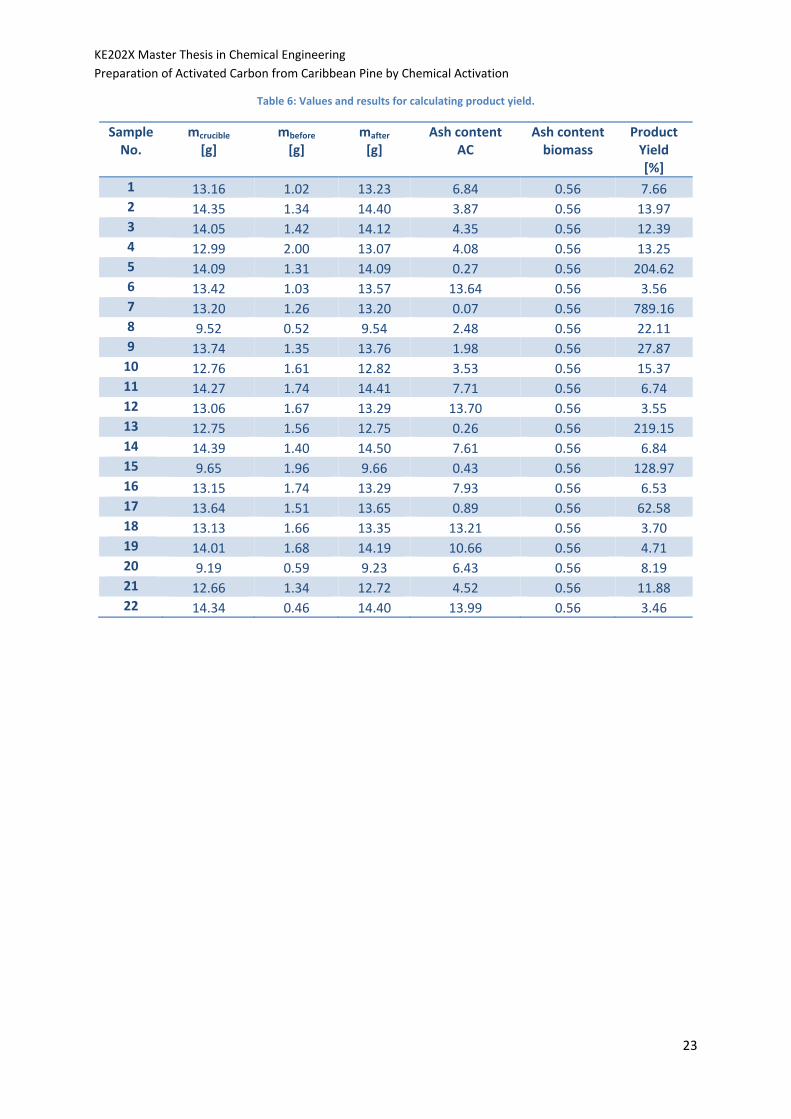
5.2.1 Product yield To calculate the yield in another manner as mentioned above the product yield was used. This is to take away the uncertainties when it comes to impurities in the samples such as remains from the acid. This was done in order to investigate if the values shown are more useful.
The crucibles and samples were weighed and placed in an oven at 600°C during three hours then the oven were cooled to room temperature and the crucibles and samples were weighed again.
Equation 7 (Rolando Zanzi, 1996) was used to calculate the product yield with values from Table 6. The equation is based on the assumption that the inlet ash content correspond to the outlet ash content. This means that the total ash amount correspond to the ash in the activated carbon. This is not true in reality since acid is added to the ash, therefore cannot the assumption be true but in this case is it a valid approximation.
100Product yeild 100 [%]1
100
biomass biomass
AC
biomass
a aa
a
−= ⋅
− Equation 7
KE202X Master Thesis in Chemical Engineering Preparation of Activated Carbon from Caribbean Pine by Chemical Activation
23
Table 6: Values and results for calculating product yield.
Sample No.
mcrucible [g]
mbefore [g]
mafter
[g] Ash content
AC Ash content biomass
Product Yield [%]
1 13.16 1.02 13.23 6.84 0.56 7.66 2 14.35 1.34 14.40 3.87 0.56 13.97 3 14.05 1.42 14.12 4.35 0.56 12.39 4 12.99 2.00 13.07 4.08 0.56 13.25 5 14.09 1.31 14.09 0.27 0.56 204.62 6 13.42 1.03 13.57 13.64 0.56 3.56 7 13.20 1.26 13.20 0.07 0.56 789.16 8 9.52 0.52 9.54 2.48 0.56 22.11 9 13.74 1.35 13.76 1.98 0.56 27.87 10 12.76 1.61 12.82 3.53 0.56 15.37 11 14.27 1.74 14.41 7.71 0.56 6.74 12 13.06 1.67 13.29 13.70 0.56 3.55 13 12.75 1.56 12.75 0.26 0.56 219.15 14 14.39 1.40 14.50 7.61 0.56 6.84 15 9.65 1.96 9.66 0.43 0.56 128.97 16 13.15 1.74 13.29 7.93 0.56 6.53 17 13.64 1.51 13.65 0.89 0.56 62.58 18 13.13 1.66 13.35 13.21 0.56 3.70 19 14.01 1.68 14.19 10.66 0.56 4.71 20 9.19 0.59 9.23 6.43 0.56 8.19 21 12.66 1.34 12.72 4.52 0.56 11.88 22 14.34 0.46 14.40 13.99 0.56 3.46

KE202X Master Thesis in Chemical Engineering Preparation of Activated Carbon from Caribbean Pine by Chemical Activation
24
6 Results According to the computer program, Design Expert, that evaluated with mathematical calculations whether the design parameters were significant or not, the only significant parameter was the temperature when the iodine number was considered. This means that the temperature has affect on adsorption ability of the activation carbon. A higher temperature, 500°C, gave a higher iodine number which indicates a more porous structure and a better liquid adsorption. When adsorption of ammonia and gasoline were evaluated no significant parameters were found. The same result was given in the yield analysis, no parameters affected the outcome. See Table 7 for the summary of the most important results.
The best gasoline and ammonia adsorption was obtained in sample number 20 and the highest yield was obtained in sample number 15. Sample number 22 had the highest iodine number and the same parameter conditions as number 20.
Commercial activated carbon was also analyzed in order to compare the activated carbon derived from Caribbean Pine. These tests showed that the commercial AC had a higher iodine number and better gas adsorption ability.
Table 7: Summary of the highest and lowest results.
Analysis [%] Sample No.
Temperature[˚C]
Acid concentration[%]
Relative impregnation [%]
Impregnationtime [h]
Gasoline adsorption
Highest 139.65 20 500.0 25.0 1.35 2.00
Lowest 54.99 2 500.0 10.0 0.70 1.00
Ammonia adsorption
Highest 29.15 20 500.0 25.0 1.35 2.00
Lowest ‐15.16 10 500.0 10.0 0.70 3.00
Iodine number
Highest 501.3 22 500.0 25.0 1.35 2.00
Lowest 105.6 1 400.0 10.0 0.70 1.00
Yield Highest 405.96 15 400.0 40.0 2.00 3.00
Lowest 53.71 10 500.0 10.0 0.70 3.00
Product yield
Highest 62.58 17 400.0 25.0 1.35 2.00
Lowest 3.46 22 500.0 25.0 1.35 2.00
In the following chapters the influences of the parameters are illustrated in several graphs. The samples were divided into groups depending on the characteristics of the experimental setup. First gasoline adsorption is evaluated and later iodine number. In this analyse the ammonia adsorption was not considered because of the low adsorption values.

KE202X Master Thesis in Chemical Engineering Preparation of Activated Carbon from Caribbean Pine by Chemical Activation
25
6.1 Influence of temperature on gasoline adsorption The samples 1, 2, 3 and 4 were compared in Figure 6. The impregnation time was one hour and the relative impregnation was 0.7. This does not show noticeable influence.
Figure 6: Influence of temperature on gasoline adsorption (impregnation time: 1 hour; relative impregnation: 0.7).
The samples 5, 6, 7 and 8 were compared in Figure 7. The impregnation time was one hour and the relative impregnation was 2.0. This shows that the temperature had an affect on the gasoline adsorption all though a higher acid concentration did not give a higher adsorption.
Figure 7: Influence of temperature on gasoline adsorption (impregnation time: 1 hour; relative impregnation: 2).
0
20
40
60
80
100
120
350 400 450 500 550
Gasoline ad
sorption
[%]
Temperature [°C]
Influence of temperature on gasoline adsorption
10%
40%
0
20
40
60
80
100
350 400 450 500 550
Gasoline ad
sorption
[%]
Temperature [°C]
Influence of temperature on gasoline adsorption
10%
40%

KE202X Master Thesis in Chemical Engineering Preparation of Activated Carbon from Caribbean Pine by Chemical Activation
26
The samples 9, 10, 11 and 12 were compared in Figure 8. The impregnation time was three hours and the relative impregnation was 0.7. The temperature had a positive affect in the case when the acid concentration was 40% but a negative affect when the acid concentration was 10%.
Figure 8: Influence of temperature on gasoline adsorption (impregnation time: 3 hours; relative impregnation: 0.7).
The samples 13, 14, 15 and 16 were compared in Figure 9. The impregnation time was three hours and the relative impregnation was 2.0. The gasoline adsorption increases slightly when the temperature increases.
Figure 9: Influence of temperature on gasoline adsorption (impregnation time: 3 hours; relative impregnation: 2).
90
92
94
96
98
100
102
104
350 400 450 500 550
Gasoline ad
sorption
[%]
Temperature [°C]
Influence of temperature on gasoline adsorption
10%
40%
80859095
100105110115120
350 400 450 500 550
Gasoline ad
sorption
[%]
Temperature [°C]
Influence of temperature on gasoline adsorption
10%
40%

KE202X Master Thesis in Chemical Engineering Preparation of Activated Carbon from Caribbean Pine by Chemical Activation
27
6.2 Influence of relative impregnation on gasoline adsorption The samples 1, 5, 9 and 13 were compared in Figure 10. The Figure 26Figure 25 temperature was 400°C and the acid concentration 10%. This shows that the relative impregnation was too strong at 2.0 giving a lower gasoline adsorption.
Figure 10: Influence of relative impregnation on gasoline adsorption (temperature: 400°C.; acid concentration 10%)
The samples 2, 6, 10 and 14 were compared in Figure 11Figure 27Figure 26Figure 25. The temperature was 500°C and the acid concentration 10%. This shows that the gasoline adsorption increases with the relative impregnation and impregnation time.
Figure 11: Influence of relative impregnation on gasoline adsorption (temperature: 500°C.; acid concentration 10%).
40
50
60
70
80
90
100
0,5 1,0 1,5 2,0 2,5
Gasoline ad
sorption
[%]
Relative impregnation [‐]
Influence of relative impregnation on gasoline adsorption
1h
3h
405060708090
100110120
0,5 1,0 1,5 2,0 2,5
Gasoline ad
sorption
[%]
Relative impregnation [‐]
Influence of relative impregnation on gasoline adsorption
1h
3h

KE202X Master Thesis in Chemical Engineering Preparation of Activated Carbon from Caribbean Pine by Chemical Activation
28
The samples 3, 7, 11 and 15 were compared in Figure 28 . The temperature was 400°C and the acid concentration 40%. This shows that the relative impregnation do not affect the gasoline adsorption significantly.
Figure 12: Influence of relative impregnation on gasoline adsorption (temperature: 400°C.; acid concentration 40%).
The samples 4, 8, 12 and 16 were compared in Figure 29Figure 28. The temperature was 500°C and the acid concentration 40%. An increase of the relative impregnation does not increase the gasoline adsorption.
Figure 13: Influence of relative impregnation on gasoline adsorption (temperature: 500°C.; acid concentration 40%).
0
20
40
60
80
100
120
0,5 1,0 1,5 2,0 2,5
Gasoline ad
sorption
[%]
Relative impregnation [‐]
Influence of relative impregnation on gasoline adsorption
1h
3h
60
70
80
90
100
110
0,5 1,0 1,5 2,0 2,5
Gasoline ad
sorption
[%]
Relative impregnation [‐]
Influence of relative impregnation on gasoline adsorption
1h
3h

KE202X Master Thesis in Chemical Engineering Preparation of Activated Carbon from Caribbean Pine by Chemical Activation
29
6.3 Influence of impregnation time on gasoline adsorption The samples 1, 9, 3 and 11 were compared in Figure 14Figure 27Figure 26Figure 25. The temperature was 400°C and the relative impregnation is 0.7. The impregnation time affect the gasoline adsorption when 40% acid concentration was used. When the acid concentration was 40% the gasoline adsorption was lower compared with the case of 10%.
Figure 14: Influence of impregnation time on gasoline adsorption (temperature: 400°C.; acid relative impregnation: 0.7)
The samples 2, 10, 4 and 12 were compared in Figure 31Figure 30Figure 27Figure 26Figure 25Figure 15 . The temperature was 500°C and the relative impregnation is 0.7. This shows that the impregnation time has a positive influence on the gasoline adsorption when 10% acid concentration was used. Higher acid concentration gives a higher adsorption.
Figure 15: Influence of impregnation time on gasoline adsorption (temperature: 500°C.; acid relative impregnation: 0.7).
50
60
70
80
90
100
0,5 1,0 1,5 2,0 2,5 3,0 3,5
Gasoline ad
sorption
[%]
Impregnation time [h]
Influence of impregnation time on gasoline adsorption
10%
40%
40
50
60
70
80
90
100
110
0,5 1,0 1,5 2,0 2,5 3,0 3,5
Gasoline ad
sorption
[%]
Impregnation time [h]
Influence of impregnation time on gasoline adsorption
10%
40%

KE202X Master Thesis in Chemical Engineering Preparation of Activated Carbon from Caribbean Pine by Chemical Activation
30
The samples 5, 13, 7 and 15 were compared in Figure 16Figure 32. The temperature was 400°C and the relative impregnation is 2.0. This shows that the impregnation time has a positive influence on the gasoline adsorption. At shorter times the acid concentration of 10% gives a better adsorption, but with a longer impregnation time the higher acid concentration gave a higher adsorption.
Figure 16: Influence of impregnation time on gasoline adsorption (temperature: 400°C.; acid relative impregnation: 2).
The samples 6, 14, 8 and 16 were compared in Figure 16Figure 17. The Figure 31Figure 30Figure 27Figure 26Figure 25temperature was 500°C and the relative impregnation is 2.0. This also shows that a long impregnation time has a positive influence on the gasoline adsorption. The lower acid concentration gave higher gasoline adsorption.
Figure 17: Influence of impregnation time on gasoline adsorption (temperature: 500°C.; acid relative impregnation: 2).
30405060708090
100110
0,5 1,0 1,5 2,0 2,5 3,0 3,5
Gasoline ad
sorption
[%]
Impregnation time [h]
Influence of impregnation time on gasoline adsorption
10%
40%
60
70
80
90
100
110
120
0,5 1,0 1,5 2,0 2,5 3,0 3,5
Gasoline ad
sorption
[%]
Impregnation time [h]
Influence of impregnation time on gasoline adsorption
10%
40%
KE202X Master Thesis in Chemical Engineering Preparation of Activated Carbon from Caribbean Pine by Chemical Activation
31
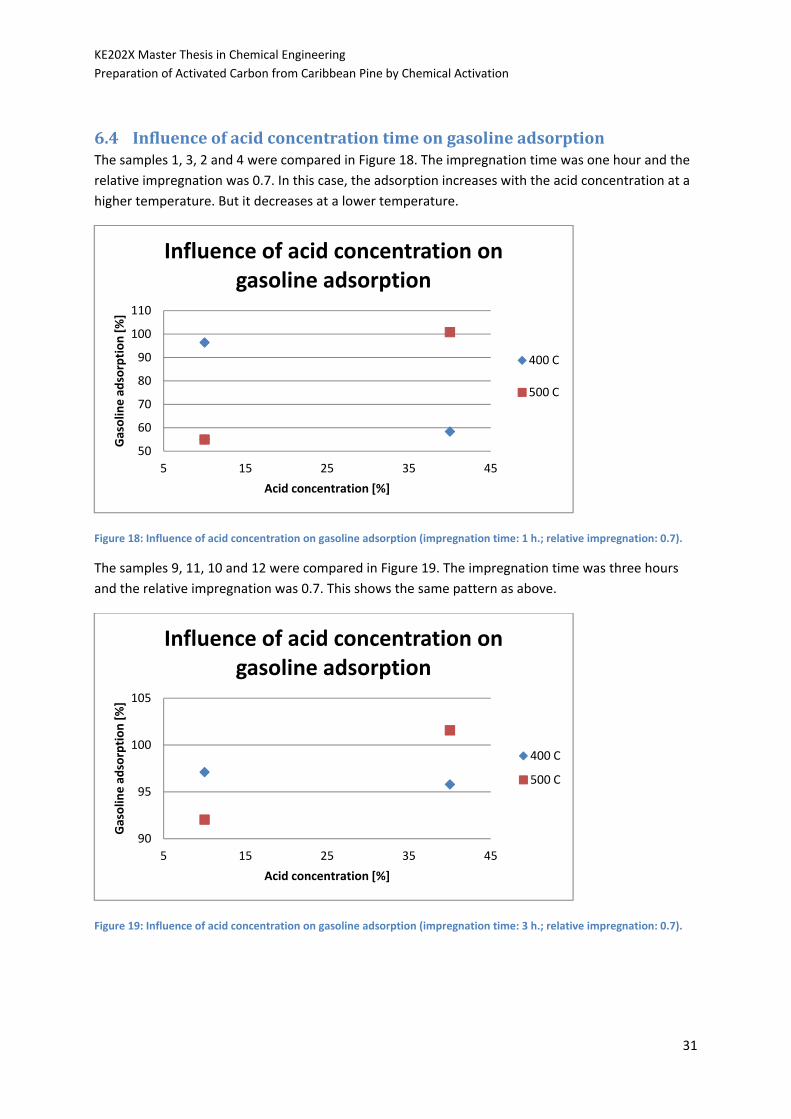
6.4 Influence of acid concentration time on gasoline adsorption The samples 1, 3, 2 and 4 were compared in Figure 18. The impregnation time was one hour and the relative impregnation was 0.7. In this case, the adsorption increases with the acid concentration at a higher temperature. But it decreases at a lower temperature.
Figure 18: Influence of acid concentration on gasoline adsorption (impregnation time: 1 h.; relative impregnation: 0.7).
The samples 9, 11, 10 and 12 were compared in Figure 19. The impregnation time was three hours and the relative impregnation was 0.7. This shows the same pattern as above.
Figure 19: Influence of acid concentration on gasoline adsorption (impregnation time: 3 h.; relative impregnation: 0.7).
50
60
70
80
90
100
110
5 15 25 35 45
Gasoline ad
sorption
[%]
Acid concentration [%]
Influence of acid concentration on gasoline adsorption
400 C
500 C
90
95
100
105
5 15 25 35 45
Gasoline ad
sorption
[%]
Acid concentration [%]
Influence of acid concentration on gasoline adsorption
400 C
500 C

KE202X Master Thesis in Chemical Engineering Preparation of Activated Carbon from Caribbean Pine by Chemical Activation
32
The samples 5, 7, 6 and 8 were compared in Figure 20. The impregnation time was one hour and the relative impregnation was 2.0. This shows a decrease of gasoline adsorption when increasing the acid concentration indicating an environment too strong at 40% acid concentration. However a higher time gives a higher adsorption.
Figure 20: Influence of acid concentration on gasoline adsorption (impregnation time: 1 h.; relative impregnation: 2).
.
The samples 13, 15, 14 and 16 were compared in Figure 21. The impregnation time was three hours and the relative impregnation was 2.0. In this case, the adsorption increases with the acid concentration at lower temperatures. But it decreases at higher temperatures indicating a too strong conditions.
Figure 21: Influence of acid concentration on gasoline adsorption (impregnation time: 3 h.; relative impregnation: 2).
30
40
50
60
70
80
90
5 15 25 35 45
Gasoline ad
sorption
[%]
Acid concentration [%]
Influence of acid concentration on gasoline adsorption
400C
500C
90
95
100
105
110
5 15 25 35 45
Gasoline ad
sorption
[%]
Acid concentration [%]
Influence of acid concentration on gasoline adsorption
400 C
500 C

KE202X Master Thesis in Chemical Engineering Preparation of Activated Carbon from Caribbean Pine by Chemical Activation
33
6.5 Influence of temperature on iodine number The samples 1, 2, 3 and 4 were compared in Figure 22. The impregnation time was one hour and the relative impregnation was 0.7. This shows that iodine number increases with the temperature and the acid concentration.
Figure 22: Influence of temperature on iodine number (impregnation time: 1 hour; acid relative impregnation: 0.7).
The samples 5, 6, 7 and 8 were compared in Figure 23. The impregnation time was one hour and the relative impregnation was 2.0. This also showed that the iodine number increased with the temperature and the acid concentration.
Figure 23: Influence of temperature on iodine number (impregnation time: 1 hour; acid relative impregnation: 2).
50
100
150
200
250
300
350
350 400 450 500 550
Iodine
num
ber [‐]
Temperature [°C]
Influence of temperature on iodine number
10%
40%
50
100
150
200
250
300
350
350 400 450 500 550
Iodine
num
ber [‐]
Temperature [°C]
Influence of temperature on iodine number
10%
40%

KE202X Master Thesis in Chemical Engineering Preparation of Activated Carbon from Caribbean Pine by Chemical Activation
34
The samples 9, 10, 11 and 12 were compared in Figure 24. The impregnation time was three hours and the relative impregnation was 0.7. This also showed that the iodine number increased with the temperature and the acid concentration.
Figure 24: Influence of temperature on iodine number (impregnation time: 3 hours; acid relative impregnation: 0.7).
The samples 13, 14, 15 and 16 were compared in Figure 25. The impregnation time was three hours and the relative impregnation was 2.0. In this case the environment became too strong displayed by a lower iodine number at 40% than at 10%.
Figure 25: Influence of temperature on iodine number (impregnation time: 3 hours; acid relative impregnation: 2).
50
100
150
200
250
300
350
350 400 450 500 550
Iodine
num
ber [‐]
Temperature [°C]
Influence of temperature on iodine number
10%
40%
50
100
150
200
250
300
350
350 400 450 500 550
Iodine
num
ber [‐]
Temperature [°C]
Influence of temperature on iodine number
10%
40%

KE202X Master Thesis in Chemical Engineering Preparation of Activated Carbon from Caribbean Pine by Chemical Activation
35
6.6 Influence of relative impregnation on iodine number The samples 1, 5, 9 and 13 were compared in Figure 26.Figure 25 The temperature was 400°C and the acid concentration 10%. This shows that the relative impregnation does not affect the iodine number in a positive manner when the impregnation time was 3 h.
Figure 26: Influence of relative impregnation on iodine number (temperature: 400°C; acid concentration: 10%).
.
The samples 2, 6, 10 and 14 were compared in Figure 27.Figure 26Figure 25 The temperature was 500°C and the acid concentration 10%. This shows that the iodine number increases with the relative impregnation and impregnation time.
Figure 27: Influence of relative impregnation on iodine number (temperature: 500°C; acid concentration: 10%).
100
120
140
160
180
200
0,5 1 1,5 2 2,5
Iodine
num
ber [‐]
Relative impregnation [‐]
Influence of relative impregnation on iodine number
1h
3h
170190210230250270290310330
0,5 1 1,5 2 2,5
Iodine
num
ber [‐]
Relative impregnation [‐]
Influence of relative impregnation on iodine number
1h
3h

KE202X Master Thesis in Chemical Engineering Preparation of Activated Carbon from Caribbean Pine by Chemical Activation
36
The samples 3, 7, 11 and 15 were compared in Figure 28. Figure 27Figure 26Figure 25 The temperature was 400°C and the acid concentration 40%. This shows that the relative impregnation does not affect the iodine number in a positive manner. Instead, the iodine number decreases due to an environment with too strong parameters when the relative impregnation was increased from 0.7 to 2.
Figure 28: Influence of relative impregnation on iodine number (temperature: 400°C; acid concentration: 40%).
The samples 4, 8, 12 and 16 were compared in Figure 29.Figure 28 Figure 27Figure 26Figure 25 The temperature was 500°C and the acid concentration 40%. This shows the same tendencies as the case above.
Figure 29: Influence of relative impregnation on iodine number (temperature: 500°C; acid concentration: 40%).
110130150170190210230250270290
0,5 1 1,5 2 2,5
Iodine
num
ber [‐]
Relative impregnation [‐]
Influence of relative impregnation on iodine number
1h
3h
220
240
260
280
300
0,5 1 1,5 2 2,5
Iodine
num
ber [‐]
Relative impregnation [‐]
Influence of relative impregnation on iodine number
1h
3h

KE202X Master Thesis in Chemical Engineering Preparation of Activated Carbon from Caribbean Pine by Chemical Activation
37
6.7 Influence of impregnation time on iodine number The samples 1, 9, 3 and 11 were compared in Figure 30.Figure 27Figure 26Figure 25 The temperature was 400°C and the relative impregnation is 0.7. In the case were the acid concentration was 10% the iodine number increased with the impregnation time, but in the other case with the concentration of 40% the iodine number decreased. This shows that the environment became too strong affecting the adsorption ability negatively.
Figure 30: Influence of impregnation time on iodine number (temperature: 400°C; relative impregnation is 0.7).
The samples 2, 10, 4 and 12 were compared in Figure 31.Figure 30Figure 27Figure 26Figure 25 The temperature was 500°C and the relative impregnation is 0.7. This shows that a longer impregnation time and acid concentration gives a higher iodine number.
Figure 31: Influence of impregnation time on iodine number (temperature: 500°C; relative impregnation is 0.7).
100120140160180200220240260280
0,5 1 1,5 2 2,5 3 3,5
Iodine
num
ber [‐]
Impregnation time [h]
Influence of impregnation time on iodine number
10%
40%
170
190
210
230
250
270
290
310
0,5 1 1,5 2 2,5 3 3,5
Iodine
num
ber [‐]
Impregnation time [h]
Influence of impregnation time on iodine number
10%
40%

KE202X Master Thesis in Chemical Engineering Preparation of Activated Carbon from Caribbean Pine by Chemical Activation
38
The samples 5, 13, 7 and 15 were compared in Figure 32 Figure 31Figure 30Figure 27Figure 26Figure 25 the temperature was 400°C and the relative impregnation is 2.0. This shows the same tendency as the test above.
Figure 32: Influence of impregnation time on iodine number (temperature: 400°C; relative impregnation is 2).
The samples 6, 14, 8 and 16 were compared in Figure 33. Figure 31Figure 30Figure 27Figure 26Figure 25 The temperature was 500°C and the relative impregnation is 2.0. This also shows the same tendency as the two cases above.
Figure 33: Influence of impregnation time on iodine number (temperature: 500°C; relative impregnation is 2).
110
130
150
170
190
210
0,5 1 1,5 2 2,5 3 3,5
Iodine
num
ber [‐]
Impegnation time [h]
Influence of impregnation time on iodine number
10%
40%
230
250
270
290
310
330
0,5 1 1,5 2 2,5 3 3,5
Iodine
num
ber [‐]
Impregnation time [h]
Influence of impregnation time on iodine number
10%
40%

KE202X Master Thesis in Chemical Engineering Preparation of Activated Carbon from Caribbean Pine by Chemical Activation
39
6.8 Influence of acid concentration on iodine number The samples 1, 3, 2 and 4 were compared in Figure 34. The impregnation time was one hour and the relative impregnation was 0.7. This shows that the acid concentration has a positive affect on the iodine number. Also, a higher temperature gives a higher iodine number.
Figure 34: Influence of acid concentration on iodine number (impregnation time: 1 hour; relative impregnation is 0.7).
The samples 9, 11, 10 and 12 were compared in Figure 35. The impregnation time was three hours and the relative impregnation was 0.7. This shows the same pattern as above.
Figure 35: Influence of acid concentration on iodine number (impregnation time: 3 hours; relative impregnation is 0.7).
80
120
160
200
240
280
320
5 15 25 35 45
Iodine
num
ber [‐]
Acid concentration [%]
Influence of acid concentration on iodine number
400 C
500 C
110
160
210
260
310
5 15 25 35 45
Iodine
num
ber [‐]
Acid concentration [%]
Influence of acid concentration on iodine number
400 C
500 C
KE202X Master Thesis in Chemical Engineering Preparation of Activated Carbon from Caribbean Pine by Chemical Activation
40
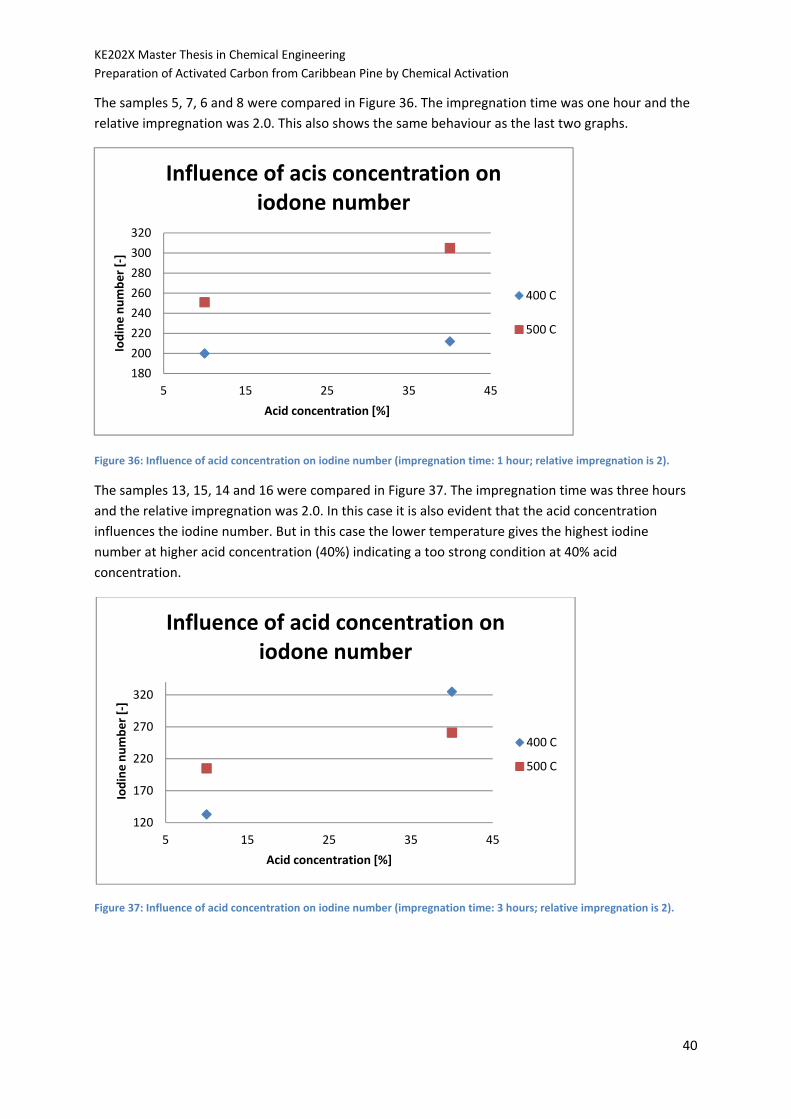
The samples 5, 7, 6 and 8 were compared in Figure 36. The impregnation time was one hour and the relative impregnation was 2.0. This also shows the same behaviour as the last two graphs.
Figure 36: Influence of acid concentration on iodine number (impregnation time: 1 hour; relative impregnation is 2).
The samples 13, 15, 14 and 16 were compared in Figure 37. The impregnation time was three hours and the relative impregnation was 2.0. In this case it is also evident that the acid concentration influences the iodine number. But in this case the lower temperature gives the highest iodine number at higher acid concentration (40%) indicating a too strong condition at 40% acid concentration.
Figure 37: Influence of acid concentration on iodine number (impregnation time: 3 hours; relative impregnation is 2).
180
200
220
240
260
280
300
320
5 15 25 35 45
Iodine
num
ber [‐]
Acid concentration [%]
Influence of acis concentration on iodone number
400 C
500 C
120
170
220
270
320
5 15 25 35 45
Iodine
num
ber [‐]
Acid concentration [%]
Influence of acid concentration on iodone number
400 C
500 C

KE202X Master Thesis in Chemical Engineering Preparation of Activated Carbon from Caribbean Pine by Chemical Activation
41
7 Discussion Several stages were involved in the experimental setup and therefor the degree of uncertainty is considered being high. Activated carbon is very sensitive to moisture and humidity in the air and exposure to humidity is regarded as the most important issues when handling with AC. On Cuba the relative humidity is high; when the experiments were conducted the relative humidity was around 75% (Weather history, 2013). This could have a negative effect since the samples were inevitable exposed to the air. To minimize this after washing the samples were dried in an oven and stored in closed cans. In Sweden the relative humidity varies from 50‐60 % during the summer (Weather history, 2013). This is a considerable lower value compared with on Cuba.
7.1 Preparation of activated carbon When producing the activated carbon the samples were exposed to air between the inter stages. For example after the activation in the hot oven the samples needed to be cooled to some extent in order to place them in the beaker. This could contribute to a higher amount of moisture stored in the AC affecting the adsorption negatively.
7.2 Yield To calculate the yield the samples were weighed before washing. This is not preferably since a lot of not burnt material was weighed as well as residues from the acid. The yield results cannot be considered to be reliable since a high result could indicate a high amount of unreacted material. Another factor that can affect the product yield is that there is a possibility that ash from the material is washed away. Because of this the value of the yield cannot be reliable. The amount of the ash in the product will decrease which leads to a higher yield value.
A higher temperature should give a higher yield. However, the yield was calculated by comparing the weight of the raw material and the weight for the product. Not measuring the amount of product given. It was obvious in some cases that the conversion to activated carbon was not complete since the final colour of the sample was light brown. See Figure 2 for an overview of the different samples. Probably the time spent in the oven was too short because the biomass did not enough time to convert. A suggestion for further research is therefore to use the time in the oven as a parameter to be varied in the experimental setup. This could be valuable in order to determine the influence of the time in the oven both concerning the yield but also the adsorption ability of the AC.
7.3 Gas adsorption In order to avoid toxic fumes the weighing of the samples were performed in a fume. The draft could cause deviation in the results if the scale was influenced by the slight draft.
If the temperature increases the pores of the AC get larger and the adsorption increases. There is a maximum of adsorption and it is reached when the pores gets large enough to affect the adsorption negatively. In the experimental set up in this project it is presumed that the adsorption maximum was reached and passed when the strong environments were used since the strongest parameters gave a lower value of adsorption.
KE202X Master Thesis in Chemical Engineering Preparation of Activated Carbon from Caribbean Pine by Chemical Activation
42
7.3.1 Adsorption of ammonia The analysis of ammonia adsorption was partly redone in Sweden due to the low adsorption results obtained on Cuba. It is not established if the ammonia solutions had the same concentration because of unlabeled chemicals in the laboratory on Cuba. In Sweden an ammonia solution of 25 % was used. The results still showed a negative absorption and in theory this is not possible. The AC cannot lose weight when adsorbing. One explanation for this could be moisture in the AC leaving the material during the adsorption time.
7.3.2 Adsorption of gasoline The analyses were done ones more in Sweden because the tests showed some negative adsorption values which in theory are not possible. One explanation to this is the humidity exposure. The AC had adsorbed water before placed in the beaker and it evaporated before the gasoline could adsorb. In Sweden there were no negative results and one trend that could be seen was the increase of adsorption when the temperature increased. The plotted graphs displayed an inconsistent result weather the parameters influence the outcome or not. It is not evident that a stronger environment gives higher adsorption ability. In fact, in several cases the lower value of the parameter gave a higher adsorption. This may be explained by the results not being linear.
7.4 Liquid adsorption
7.4.1 Iodine number When analyzing iodine number with Design Expert, the only significant parameter was given. The temperature had an influence of the adsorption. This indicates that a higher temperature gives a better adsorption. According to the plotted graphs increasing temperature, acid concentration and relative impregnation affect the adsorption positively as long as the environment not is too strong.

KE202X Master Thesis in Chemical Engineering Preparation of Activated Carbon from Caribbean Pine by Chemical Activation
43
8 Conclusions Based on the experiment it was determined that the AC from Caribbean Pine is more suitable for adsorbing gasoline than NH3 which can be seen in Table 2 and Table 3. Also the adsorption of gasoline is increasing with increasing temperature see Figure 4.
Results in Figures 6, 7, 8 and 9 showed that the temperature has a positive influence on gasoline adsorption both at impregnation time at one and three hours. When the parameters were at the highest setting the temperature did not have the same impact on the adsorption. The impregnation time had an influence on the gasoline adsorption. The adsorption increases with an increased impregnation time; this can be seen in Figures 14, 15, 16 and 17.
The liquid adsorption analysed with iodine number showed that an increasing acid concentration and increasing relative impregnation increases the adsorption. It is also evident that the adsorption maximum was reached in some cases, showing that too strong environment affect the adsorption negatively due to too large pores in the AC. Furthermore a high iodine number corresponds to a high gasoline adsorption.
It is shown that the iodine number increases when in increasing the temperature at the analysed settings which can be seen in Figures 22, 23, 24 and 25. Figures 30, 31, 32 and 33 showed that the impregnation time influenced the iodine number in the same behaviour as when gasoline adsorption was analysed. A consistent trend when analysing the influence of the acid concentration on iodine number was that a higher acid concentration gave a higher iodine number. This is presented in Figures 34, 35, 36 and 37. When the relative impregnation is concerned, this parameter did not show the same impact on the gasoline adsorption and iodine number as impregnation time and temperature. These two parameters had a more significant influence.
According to the computer simulation program Design Expert none, except the temperature in the liquid adsorption, of the parameters had any influence of adsorption and yield. This implies there is no statistical evidence of influence of the tested parameters. Also the interaction between the parameters could not be shown evident. The computer program may be more suitable for evaluation of the influence of the parameters when they affect the product linear. In this case the adsorption increased with increasing parameters to some extent. When the parameters became high the adsorption decreased showing an adoption maximum had been reached. Therefor an evaluation with Design Expert applied on this case become less reliable.
The industrial manufactured AC had a better liquid ‐and gas adsorption compared with the AC from Caribbean Pine. The AC from Caribbean Pine had the best adsorption quality in sample 20 and 22 with the conditions; temperature at 500°C, relative impregnation at 1.35, acid concentration at 25 % and an impregnation time two hours.
Since none of the computer analyzed parameters showed any influence accept for the temperature in iodine number the recommend design if the AC from Caribbean Pine would be commercially produced is to keep all parameters low. This is both cost effective and energy efficient.
A suggestion for further research is to use the time in the oven as a parameter to be varied in the experimental setup. This could be valuable in order to determine the influence of the time in the oven both concerning the yield but also the adsorption ability of the AC.

KE202X Master Thesis in Chemical Engineering Preparation of Activated Carbon from Caribbean Pine by Chemical Activation
44
9 Bibliography Anne Marie Helmenstine, P. (n.d.). Chemistry Guide. Retrieved 04 05, 2013, from
http://chemistry.about.com/od/chemistryfaqs/f/charcoal.htm
Baracao. (2010, 06 14). Retrieved 07 09, 2013, from Vemceremos Cuba: http://www.venceremos.cu/pags/varias/baracoa/carbon_activado_3024288.html
Birbas, D. (2011). Preparation of Activated Carbon: Forrest residues avtivated with phosphoric acid and zinc sulfate. Stockholm: KTH.
Caribbean Pine. (n.d.). Retrieved 08 13, 2013, from The Wood Database: http://www.wood‐database.com/lumber‐identification/softwoods/caribbean‐pine/
Caribbean Pine. (2013). Retrieved 07 08, 2013, from The Wood Database : http://www.wood‐database.com/lumber‐identification/softwoods/caribbean‐pine/
Carlsson, M. (2013). Bensin. Retrieved 08 29, 2013, from Nationalencyklopedin: http://www.ne.se/lang/bensin
Department of Agriculture, Fisheries and Forestry. (2010, 08 04). Retrieved 07 08, 2013, from Queensland Goverment: http://www.daff.qld.gov.au/forestry/using‐wood‐and‐its‐benefits/wood‐properties‐of‐timber‐trees/caribbean‐pine
Elding, L. I. (2013). Ammoniak. Retrieved 08 29, 2013, from Nationalencyklopedin: http://www.ne.se/lang/ammoniak
Hansson, G. K. (n.d.). Kväveoxider. Retrieved 08 24, 2013, from Nationalencyklopedin: http://www.ne.se/lang/kv%C3%A4veoxider?i_h_word=kv%C3%A4veoxid
History of Stat‐Ease. (n.d.). Retrieved 08 03, 2013, from Stat‐Ease: http://www.statease.com/history.html
Ingenieros escoceses buscan la solución para una pesadilla cubana. (2012, 01 24). Retrieved 07 09, 2013, from BBC Mundo: http://www.bbc.co.uk/mundo/noticias/2012/01/120124_cuba_marabu_escocia_am.shtml
Joana M. Dias, M. C.‐F.‐U.‐P. (2007). Waste Material for activated carbon preparation and its use in aqueous‐phase treatment. Journal of Environmental Management, 833‐864.
Kan‐Carbon Private Limited. (2011). Retrieved 04 05, 2013, from Activated Carbon: www.activatedcarbonindia.com
Lars Ivar Elding, R. O. (2013). Fosforsyra. Retrieved 09 29, 2013, from Nationalencyklopedin: http://www.ne.se/lang/fosforsyra
Mansooreh Soleimani, T. K. (2007). Agricultural Waste Conversion to Activated Carbon by Chamical Activation with Phosphoric Acid. InterScience, 649‐653.
Ohlson, R. (n.d.). Aktivt kol. Retrieved 08 12, 2013, from Nationalencyklopedin: http://www.ne.se/lang/aktivt‐kol

KE202X Master Thesis in Chemical Engineering Preparation of Activated Carbon from Caribbean Pine by Chemical Activation
45
Pinus caribaea (Caribbean pine). (n.d.). Retrieved 07 08, 2013, from KEV Royal Botanic Gardens: http://www.kew.org/plants‐fungi/Pinus‐caribaea.htm
Rolando Zanzi, K. S. (1996). Rapid high‐temperature purolysis of biomass in a free‐fall reactor. Fuel, 545‐550.
Sabelström, H. (2013, 02 28). Miljökvalitetsnormer för svaveldioxid i utomhusluft . Retrieved 08 24, 2013, from Naturvårdsverket: http://www.naturvardsverket.se/Stod‐i‐miljoarbetet/Vagledning‐amnesvis/Miljokvalitetsnormer/Miljokvalitetsnormer‐for‐utomhusluft/Miljokvalitetsnormer‐for‐svaveldioxid‐i‐utomhusluft/
Stat‐Ease. (n.d.). Stat‐ Ease Software. Retrieved 07 02, 2013, from http://www.statease.com/software.html
T. Vernersson, P. B. (2001). Arundo donax cane as a precursor for activated carbons preparation by phosphoric acid activation. Bioresource Technology, 95‐104.
Weather history. (2013, 04). Retrieved 07 09, 2013, from Weather Online: http://www.weatheronline.co.uk/weather/maps/city

KE202X Master Thesis in Chemical Engineering Preparation of Activated Carbon from Caribbean Pine by Chemical Activation
46
10 Appendix
10.1 Design Expert results for ammonia.
Source Squares df Square Value Prob > F
Model 128724,7888 15 8581,652585 3,255616292 0.1313 not significant A‐Temp 28969,75054 1 28969,75054 10,99023654 0.0295 B‐Conc 9906,225877 1 9906,225877 3,758118852 0.1246 C‐Impreg 1510,102709 1 1510,102709 0,572886741 0.4912 D‐Time impreg 5131,303881 1 5131,303881 1,946659615 0.2354 AB 2213,269661 1 2213,269661 0,839646758 0.4113 AC 7733,113829 1 7733,113829 2,933706663 0.1619 AD 162,0606654 1 162,0606654 0,061480856 0.8164 BC 13478,08734 1 13478,08734 5,113173749 0.0866 BD 568,1589481 1 568,1589481 0,215542113 0.6666 CD 281,6408943 1 281,6408943 0,106845934 0.7602 ABC 1773,93519 1 1773,93519 0,672976708 0.4581 ABD 0,48219136 1 0,48219136 0,000182929 0.9899 ACD 11,58010273 1 11,58010273 0,004393136 0.9503 BCD 2264,612509 1 2264,612509 0,859124663 0.4064 ABCD 2226,045817 1 2226,045817 0,84449364 0.4101 Curvature 73812,95007 2 36906,47504 14,00118686 0.0156 significant Pure Error 10543,81329 4 2635,953323 Cor Total 213081,5521 21

KE202X Master Thesis in Chemical Engineering Preparation of Activated Carbon from Caribbean Pine by Chemical Activation
47
10.2 Design Expert results for the yield.
Source Sum of squares
df Mean square
F value p‐value Prob > F
Model 196081,8604 15 13072,12403 1,669553125 0.3309 not significant A‐Temp 19,02130785 1 19,02130785 0,002429374 0.9631 B‐Conc 16071,7792 1 16071,7792 2,052664826 0.2252 C‐Impreg 2482,703676 1 2482,703676 0,317087389 0.6034 D‐Time impreg 20044,85788 1 20044,85788 2,560100795 0.1848 AB 3261,142118 1 3261,142118 0,416508442 0.5538 AC 37739,19194 1 37739,19194 4,819996025 0.0931 AD 2306,72285 1 2306,72285 0,294611368 0.6161 BC 12932,56439 1 12932,56439 1,651728767 0.2681 BD 7791,921737 1 7791,921737 0,995173184 0.3749 CD 6431,421023 1 6431,421023 0,821411964 0.4160 ABC 20736,61693 1 20736,61693 2,64845128 0.1790 ABD 2550,24222 1 2550,24222 0,325713316 0.5987 ACD 59789,0754 1 59789,0754 7,636175842 0.0507 BCD 375,9073522 1 375,9073522 0,048010353 0.8373 ABCD 673,2100063 1 673,2100063 0,085981426 0.7839 Curvature 15093,66445 2 7546,832226 0,963870699 0.4553 not significantPure Error 31318,85731 4 7829,714328 Cor Total 242494,3822 21

KE202X Master Thesis in Chemical Engineering Preparation of Activated Carbon from Caribbean Pine by Chemical Activation
48
10.3 Design Expert results for the product yield.
Source Sum of squares
df Mean square
F value p‐value Prob > F
Model 572808,4251 15 38187,22834 76,21435595 0.0004 significant A‐Temp 107482,5976 1 107482,5976 214,5145722 0.0001 B‐Conc 14618,78918 1 14618,78918 29,17628879 0.0057 C‐Impreg 102423,256 1 102423,256 204,4171005 0.0001 D‐Time impreg 26545,21707 1 26545,21707 52,97914278 0.0019 AB 13939,02084 1 13939,02084 27,81960206 0.0062 AC 104706,4592 1 104706,4592 208,9739345 0.0001 AD 23294,5204 1 23294,5204 46,49137804 0.0024 BC 18331,252 1 18331,252 36,58564985 0.0038 BD 33354,67281 1 33354,67281 66,56950546 0.0012 CD 27574,96701 1 27574,96701 55,03432541 0.0018 ABC 14398,93188 1 14398,93188 28,73749594 0.0058 ABD 28109,11221 1 28109,11221 56,10037639 0.0017 ACD 26914,60144 1 26914,60144 53,71636286 0.0018 BCD 26945,58359 1 26945,58359 53,77819726 0.0018 ABCD 25689,14119 1 25689,14119 51,27058013 0.0020 Curvature 47973,8544 2 23986,9272 47,87328872 0.0016 significantPure Error 2004,201328 4 501,0503319 Cor Total 622786,4808 21
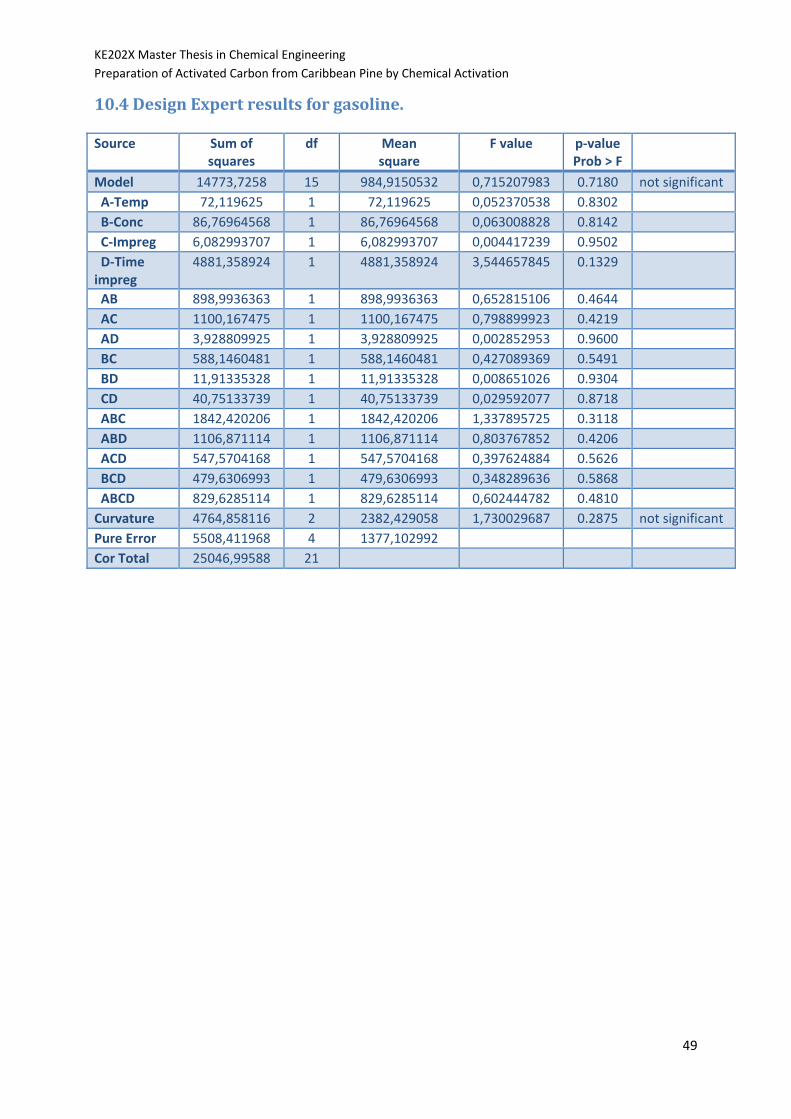
KE202X Master Thesis in Chemical Engineering Preparation of Activated Carbon from Caribbean Pine by Chemical Activation
49
10.4 Design Expert results for gasoline.
Source Sum of squares
df Mean square
F value p‐value Prob > F
Model 14773,7258 15 984,9150532 0,715207983 0.7180 not significant A‐Temp 72,119625 1 72,119625 0,052370538 0.8302 B‐Conc 86,76964568 1 86,76964568 0,063008828 0.8142 C‐Impreg 6,082993707 1 6,082993707 0,004417239 0.9502 D‐Time impreg
4881,358924 1 4881,358924 3,544657845 0.1329
AB 898,9936363 1 898,9936363 0,652815106 0.4644 AC 1100,167475 1 1100,167475 0,798899923 0.4219 AD 3,928809925 1 3,928809925 0,002852953 0.9600 BC 588,1460481 1 588,1460481 0,427089369 0.5491 BD 11,91335328 1 11,91335328 0,008651026 0.9304 CD 40,75133739 1 40,75133739 0,029592077 0.8718 ABC 1842,420206 1 1842,420206 1,337895725 0.3118 ABD 1106,871114 1 1106,871114 0,803767852 0.4206 ACD 547,5704168 1 547,5704168 0,397624884 0.5626 BCD 479,6306993 1 479,6306993 0,348289636 0.5868 ABCD 829,6285114 1 829,6285114 0,602444782 0.4810 Curvature 4764,858116 2 2382,429058 1,730029687 0.2875 not significant Pure Error 5508,411968 4 1377,102992 Cor Total 25046,99588 21

KE202X Master Thesis in Chemical Engineering Preparation of Activated Carbon from Caribbean Pine by Chemical Activation
50
10.5 Design Expert results for iodine number.
Source Sum of squares df Mean square
F value p‐value Prob > F
Model 128724,7888 15 8581,652585 3,255616292 0.1313 not significant A‐Temp 28969,75054 1 28969,75054 10,99023654 0.0295 B‐Conc 9906,225877 1 9906,225877 3,758118852 0.1246 C‐Impreg 1510,102709 1 1510,102709 0,572886741 0.4912 D‐Time impreg 5131,303881 1 5131,303881 1,946659615 0.2354 AB 2213,269661 1 2213,269661 0,839646758 0.4113 AC 7733,113829 1 7733,113829 2,933706663 0.1619 AD 162,0606654 1 162,0606654 0,061480856 0.8164 BC 13478,08734 1 13478,08734 5,113173749 0.0866 BD 568,1589481 1 568,1589481 0,215542113 0.6666 CD 281,6408943 1 281,6408943 0,106845934 0.7602 ABC 1773,93519 1 1773,93519 0,672976708 0.4581 ABD 0,48219136 1 0,48219136 0,000182929 0.9899 ACD 11,58010273 1 11,58010273 0,004393136 0.9503 BCD 2264,612509 1 2264,612509 0,859124663 0.4064 ABCD 2226,045817 1 2226,045817 0,84449364 0.4101 Curvature 73812,95007 2 36906,47504 14,00118686 0.0156 significant Pure Error 10543,81329 4 2635,953323 Cor Total 213081,5521 21