
PREPARATION AND CHARACTERIZATION OF COPPER...
67
1 PREPARATION AND CHARACTERIZATION OF COPPER MATRIX REINFORCED WITH COPPER-COATED SILICON CARBIDE COMPOSITES FOR ELECTRONIC PACKAGING AZIDA BINTI AZMI FACULTY OF ENGINEERING UNIVERSITY OF MALAYA KUALA LUMPUR 2012
Transcript of PREPARATION AND CHARACTERIZATION OF COPPER...

1
PREPARATION AND CHARACTERIZATION OF COPPER
MATRIX REINFORCED WITH COPPER-COATED SILICON
CARBIDE COMPOSITES FOR ELECTRONIC PACKAGING
AZIDA BINTI AZMI
FACULTY OF ENGINEERING
UNIVERSITY OF MALAYA
KUALA LUMPUR
2012

2
PREPARATION AND CHARACTERIZATION OF
COPPER/COPPER-COATED SILICON CARBIDE
COMPOSITES FOR ELECTRONIC PACKAGING
AZIDA BINTI AZMI
RESEARCH REPORT SUBMITTED IN PARTIAL
FULFILLMENT OF THE REQUIREMENT FOR THE
DEGREE OF MASTER OF ENGINEERING
FACULTY OF ENGINEERING
UNIVERSITY OF MALAYA
KUALA LUMPUR
2012

3
ABSTRACT
Metal matrix composites (MMCs) have great potentials as packaging materials
among other composite groups because the properties can be engineered to the design
needs. Copper matrix reinforced with silicon carbide particles has greater potential due
to the fact that it has higher thermal conductivity compared to the widely used
aluminum. However, the bonding between the copper matrix and the SiC reinforcement
must be improved since there is interface issues which affect the thermophysical
properties of the CuSiC composites. Therefore, the SiC is coated with a thin copper film
via electroless coating technique which is least expensive, simple and can provide
homogenous copper deposits. The SiC is first need to be cleaned, etched, sensitized and
activated to prepare the SiC particles surface for copper to be deposited onto it. Then, an
electroless copper coating bath is prepared and the SiC is coated under suitable
temperature and pH to obtain a good coating on SiC particles. Then, the CuSiC
composites are fabricated via powder metallurgy methodology by ball milling to mix
the copper matrix and SiC reinforcement. Then the mixture is pressed under uniaxial
compaction loading and sintered at 925oC for 2 hours. Then the samples are ready for
characterization and testing.
The SEM images showed the difference between the raw SiC and cleaned SiC
after ultrasonically cleaned in solvent. After sensitizing and activation process, the SEM
image showed that it has the catalytic elements during the activation process. Then, the
SEM image after coating process showed the copper deposits on the SiC particles
surface. The particle size distribution has increased from 45.639µm before cleaning to
45.993µm after cleaning. Then the size increased to 46.750µm after sensitizing and
activation process. Then, the size increased to 48.100µm after coating process.

4
The CuSiC composite is lighter compared to the pure metal. Density for copper
is 8.93g/cm3. The density of CuSiC composites with Cu-coated SiC particles
reinforcement is range from 7.48g/cm3 to 3.44g/cm3 with the volume fraction of the
reinforcement varies from 0.1, 0.2, 0.3, 0.4, 0.5, 0.6 and 0.7. The percentage of porosity
is increased with the increment of reinforcement volume fraction due to entrapped H2
during coating process of the SiC particles reinforcement.
ABSTRAK
Komposit matrik logam (MMCs) mempunyai potensi besar sebagai bahan
pembungkusan berbanding kumpulan-kumpulan komposit yang lain kerana sifat-

5
sifatnya yang boleh disesuaikan mengikut keperluan rekabentuk. Matriks kuprum yang
dicampur dengan tetulang zarah silicon karbida mempunyai potensi yang lebih besar
kerana ia mempunyai koduksi haba yang lebih tinggi berbanding aluminium yang
digunakan secara meluas. Walaubagaimanapun, ikatan di antara matriks kuprum dan
tetulang SiC perlu dipertingkatkan memandangkan terdapat masalah antara muka yang
memberi kesan kepada sifat-sifat termofizikal komposit CuSiC. Oleh itu, SiC disalut
dengan lapisan nipis kuprum melalui teknik salutan tanpa elektrik yang murah, mudah
dan dapat memberikan salutan kuprum yang homogen. SiC disalut dengan kuprum
dibawah suhu dan pH yang sesuai dalam satu larutan salutan kuprum. Kemudian
komposit CuSiC difabrikasikan dengan kaedah metalurgi serbuk dengan menggunakan
cara pengisaran bebola untuk mencampurkan matriks kuprum dan tetulang SiC.
Campuran tersebut ditekan dibawah beban pemadatan dan disinter pada suhu 925oC
selama 2 jam.
Imej SEM menunjukkan perbezaan diantara SiC asal dengan SiC yang telah
dibersihkan menggunakan acetone secara ultrasonik. Selepas proses pemekaan dan
pengaktifan, imej SEM menunjukkan ia mempunyai unsur-unsur pemangkin semasa
proses pengaktifan. Kemudian, imej SEM selepas proses salutan kuprum menunjukkan
ada deposit kuprum pada permukaan SiC. Taburan saiz zarah meningkat dari 45.639µm
sebelum dibersihkan kepada 45.993µm selepas dibersihkan. Kemudian saiz zarah
meningkat kepada 46.750µm selepas proses pemekaan dan pengaktifan. Kemudian saiz
zarah meningkat kepada 48.100µm selepas proses salutan kuprum.
Komposit CuSiC adalah lebih ringan berbanding logam kumprum tulen.
Ketumpatan bagi kuprum ialah 8.93g/cm3. Ketumpatan bagi komposit CuSiC dengan
tetulang zarah SiC bersalut kuprum adalah diantara 7.48g/cm3 dan 3.44g/cm3 dengan

6
pecahan isipadu tetulang meningkat dari 0.1, 0.2, 0.3, 0.4, 0.5, 0.6 dan 0.7. Peratusan
keliangan meningkat dengan kenaikan pecahan isipadu tetulang kerana terdapat H2 yang
terperangkap semasa proses salutan zarah tetulang SiC.
7
ACKNOWLEDGEMENT
In the name of Allah, the Most Gracious and the Most Merciful.
Alhamdulillah, all praises to Allah for the strengths and His blessing in
completing this research report. Special appreciation goes to my supervisor, Dr Ching
Yern Chee, for her supervision and constant support throughout this research project.
I would like to express my appreciation to the Dean, Faculty of Engineering, and
also to the Deputy Dean (Postgraduate Studies), Faculty of Engineering, for their
support and help towards my postgraduate affairs. My acknowledgement also goes to all
the office staffs of Postgraduate Studies, Faculty of Engineering for their co-operations.
Sincere thanks to all my friends especially En. Azmi Kamardin and En. Mohd
Tajuddin Mohd Idris for their kindness and moral support during my study. Their
invaluable help of constructive comments and suggestions throughout the experimental
and research works have contributed to the success of this research. Thanks for the
friendship and memories.
Last but not least, my deepest gratitude goes to my beloved mother, Pn. Maryam
binti Abd Rahman and also to my sisters; Azima, Azifa, Afiza and Anis and my brother
Anas, for their endless love, prayers and encouragement. To those who indirectly
contributed in this research, your kindness means a lot to me. Thank you very much.

8
TABLE OF CONTENTS
ABSTRACT ii
ABSTRAK iv
ACKNOWLEDGEMENT vi
TABLE OF CONTENTS vii
LIST OF FIGURES x
LIST OF TABLES xii
CHAPTER 1 – INTRODUCTION
1.1 Background 1
1.2 Problem Statement 5
1.3 Research objectives 5
1.4 Scope of works 6
CHAPTER 2 – LITERATURE REVIEW
2.1 Advanced packaging materials 7
2.2 Metal matrix composites (MMCs) 9
2.2.1 Fabrication of MMCs 9
2.2.2 Fabrication of copper composites via Powder Metallurgical
approach 12
2.3 Electroless metal deposition process 13
2.3.1 Pretreatments of nonmetallic substrates 15
2.3.2 Electroless copper deposition on SiC particles 16
CHAPTER 3 – METHODOLOGY

9
3.1 Raw materials 20
3.2 Electroless coating 21
3.2.1 Surface treatments 21
3.2.2 Electroless copper coating 24
3.3 Characterizations on copper coated silicon carbide particles 27
3.3.1 Scanning electron microscope (SEM) exanimation 27
3.3.2 X-ray diffraction (XRD) analysis 27
3.3.3 Particle analyzer analysis 28
3.4 Fabrication of CuSiCp composites 28
3.4.1 Preparation of green compacts 31
3.4.2 Sintering process 33
3.4.3 Density and porosity measurements 35
CHAPTER 4 – RESULTS AND DISCUSSIONS
4.1 XRD analysis on raw materials 37
4.2 Characterization of electroless coating on SiC 38
4.2.1 SiC surface treatments 38
4.2.2 Electroless copper coating 43
4.3 Fabrication of CuSiCp composites 45
4.4 Density and porosity measurement 47
CHAPTER 5 – CONCLUSION AND RECOMMENDATION
5.1 Conclusion 51
5.2 Recommendation 53
APPENDIX A
Result analysis report for particle size distribution using Malvern

10
Mastersizer2000 instrument.
APPENDIX B
Pycnometer results for Cu matrix reinforced with different volume
fraction of Cu-coated SiC particles.
APPENDIX C
Pycnometer results for Cu matrix reinforced with different volume
fraction of non-coated SiC particles.
BIBLIOGRAPHY

11
LIST OF FIGURES
Figure 1.1: An increase in power consumption in Intel's microprocessors (Krieg
2004).
Figure 1.2: The thermo physical properties of advanced packaging materials
(Zweben 2006).
Figure 3.1: The flow chart of the whole experimental process.
Figure 3.2: Ultrasonic cleaning of SiC particles.
Figure 3.3: Filtering the SiC particles after ultrasonic cleaning in acetone for 15
minutes.
Figure 3.4: Sensitization process of SiC particles.
Figure 3.5: Activation process of SiC particles.
Figure 3.6: Oven for drying process of SiC particles.
Figure 3.7: Electroless solution bath for coating process of SiC particles.
Figure 3.8: Electroless copper coating process of silicon carbide particles.
Figure 3.9: Mold and tool set used in green compaction process.
Figure 3.10: Ball mill process of the composite powders.
Figure 3.11: Compaction process using uniaxial Gotech 200kN UTM machine.
Figure 3.12: The tube furnace for sintering process.
Figure 3.13: The temperature profile for the sintering process.
Figure 3.14: Pycnometer for true density measurement.
Figure 3.15: Density meter for bulk density measurement.
Figure 4.1: (a) XRD pattern for raw spheroidal Cu powder.
Figure 4.1, continued: (b) XRD pattern for raw SiC particles and (c) XRD pattern for
CuSiC composite.
Figure 4.2: The acetone waste after SiC cleaning using ultrasonic bath.

12
Figure 4.3: The surface morphology of the SiC particles (a) and (b) before surface
cleaning, (c) and (d) after surface cleaning, (e) and (f) after sensitizing
and activation of the surface.
Figure 4.4: Particle size of the SiC particles (a) before surface cleaning, (b) after
surface cleaning, (c) after sensitizing and activation of the surface.
Figure 4.5: The surface morphology of the Cu-coated SiC particles (a) at 500x
magnification, (b) at 3000x magnification, and (c) at 10000x
magnification.
Figure 4.6: Particle size distribution for Cu-coated SiC.
Figure 4.7: (a) Successful compaction of CuSiC with Cu-coated SiC reinforcement
and (b) Unsuccessful compaction of CuSiC with non-coated SiC
reinforcement at volume fraction of 0.6.
Figure 4.8: Measured density for both Cu-coated SiC and non-coated SiC
reinforcement in CuSiC composites.
Figure 4.9: Bulk density for both Cu-coated SiC and non-coated SiC reinforcement
in CuSiC composites.
Figure 4.10: Density measured using pycnometer for both Cu-coated SiC and non-
coated SiC reinforcement in CuSiC composites.
Figure 4.11: Percentage of porosity for both Cu-coated SiC and non-coated SiC
reinforcement in CuSiC composites.

13
LIST OF TABLES
Table 2.1: Properties of advanced materials with high thermal conductivity and low
coefficient of thermal expansion (Zweben 1999 &Zweben 2005).
Table 3.1: The basic characteristics of the powders as received from manufacturers.
Table 3.2: The compositions of the electroless copper bath.
Table 3.3: The amount of Cu and non-coated SiC powders required for the CuSiC
composites.
Table 3.4: The amount of Cu and SiCCu-coated powders required for the CuSiCCu-coated
composites.

14
CHAPTER 1
INTRODUCTION
1.1 Background
There has been a great market demand for electronic devices and systems for the
past few decades. Companiesandmarkets.com has reported on September 2011, the
thermal management market is expected to grow from $6.7 billion in 2011 to $9.1
billion by 2016. More than 80% of the total thermal management market is dominated
by the thermal management hardware such as heat sinks, fans and blowers. Therefore,
the progress of the technology in thermal management hardware is also expected to
increase due to the demands in increased functionality and miniaturization of each
single device unit. It is at the same time, have increased the need for new advanced
thermal management materials.
The microelectronic packaging is moving toward high density, high speed and
miniaturization, as predicted by Moore’s Law. The numbers of interconnections and
wire length have been reduced exponentially. At the same time, the amount of power
dissipation in a single device has been increased greatly as shown in Figure 1.1. These
have caused critical design issues related to the requirements of thermal management,
reliability, weight and cost of the electronics packaging (Zweben 2005). The
conventional packaging materials cannot fulfill the material requirements of these
complex designs. A high increase in the power consumption and heat dissipation also
leads to the high failure rate in electronic packaging. The studies of the electronic
industry have shown that, 55% of failures in electronics packaging come from
temperature dependent fault (Neubauer 2005). These failures can be caused by the

15
temperature of the chips and the thermal expansion mismatch between the board and
chip (Kowbel 2000). In order to solve these issues, varies of advanced packaging
materials have been developed. The thermo physical properties of these materials are
shown in Figure 1.2.
Figure 1.3: An increase in power consumption in Intel's microprocessors (Krieg 2004).
Figure 1.4: The thermo physical properties of advanced packaging materials (Zweben
2006).

16
Composites are the most common types of packaging materials. These advanced
packaging composites can be classified into three main groups; polymer matrix
composites (PMCs), carbon/carbon composites (CCCs) and metal matrix composites
(MMCs) (Zweben 2005). The key reinforcements of these composites are continuous
and discontinuous thermally conductive carbon fibers and thermally conductive
ceramics particles such as silicon carbide and beryllium oxide. Composites those
reinforced with fibers are strongly anisotropic. Where else, composites those reinforced
with particles are usually isotropic.
Metal matrix composites (MMCs) have great potentials as packaging materials
among the composite groups because the properties of MMCs can be engineered to
meet the above design needs. The coefficient thermal expansion (CTE) of the MMCs
can be altered to match the CTE of semiconductors, ceramics substrates and optical
fibers by controlling the percentages of each component in the composites. Thus the
thermal stresses and warpage issues can be minimized at the same time. At the time
being, the most interested MMC is aluminum matrix reinforced with silicon carbide
particle or Al-SiC. It is not only very cost effective thermal management material for
electronics packaging (Occhionero 2005) but also performs better than copper metal
(Romero 1995). The CTE of Al-SiC can be altered between 6.2 to 23 ppm/K however,
its thermal conductivity is limited to 220 W/m.k. Copper, in fact has almost double the
thermal conductivity of aluminum. Therefore, for heat sinks which require materials
with higher thermal conductivity, copper matrix reinforced with silicon carbide particle,
Cu-SiCp has a greater potential than Al-SiC.
Copper matrix reinforced with silicon carbide particles (Cu-SiCp) composites
and copper matrix reinforced with carbon fiber (Cu-Cf) composite are the most

17
interesting copper based MMCs in packaging materials industry. The Cu-SiCp
composites seem to have more potential as packaging materials as compared to Cu-Cf
due to the anisotropic behavior of the carbon fiber. However, Cu-SiCp system also
suffers the same interface problems as in the Cu-Cf system due to the absence of
bonding between the two constituents. In order to develop the Cu-SiCp interface, the
bonding between the matrix and the reinforcement phases must be improved. One of the
methods to improve the bonding is by coating the reinforcement with a metal film.
Coated reinforcement can produce more than 20% increase in the thermal diffusivity of
the composites as compared to the non-coated ones (Neubauer 2005). Significant
improvements in thermal conductivity and CTE of Cu-SiCp composites as compared to
the non-coated Cu-SiCp composites were also observed by Shu (2003) and Schubert
(2008).
There are many methods available to coat the surface of the nonmetallic
reinforcements, such as sputter coating (Kock 2007; Shubert 2008), chemical vapor
deposition (CVD) (Brendel 2005), physical vapor deposition (PVD) (Navinsek 1999),
sol-gel coating (Torres 2007; Rams 2006) and electroless plating (Sard 1970, Chan
1999 and Chang 1996, Li 2005, Han 2006 & Sharma 2006). Among all these methods,
electroless plating is the least expensive, simple and able to provide copper deposits
with excellent physical and metallurgical (Deckert 2002). Moreover, a homogeneous
copper film on the SiC particles can be obtained using electroless coating process to
promote bonding between copper and SiCp (Shu 2003). The improved bonding between
copper coated SiCp and copper matrix allowed applied load to be transferred more
efficiently and contributed to larger strain-to-failure figures (Davidson 2000).
Furthermore, these composites have relatively higher density, lower porosity and

18
mechanically more superior than those fabricated from uncoated powders (Moustafa
2002).
1.2 Problem statement
Copper matrix reinforced with silicon carbide particles (Cu-SiCp) composites
fabricated using powder metallurgy methods have inferior thermophysical properties
due to the absence of reaction between the copper matrix and the SiC reinforcement.
The bonding between the copper matrix and the SiC reinforcement must be improved in
order to improve the thermophysical properties of the Cu-SiCp composites. One of the
methods to improve the bonding is by coating the SiC particles with a homogeneous
copper film using electroless coating process. Numerous studies showed that a
continuous copper film can be developed on the surface of SiCp, but only a few were
directly studying the effects of the electroless copper coating on the density of the
CuSiCp composites. Therefore, it was substantial to fabricate the Cu-SiCp composites by
using electroless copper coating method. The properties of coated SiC in Cu-SiCp
composites can be evaluated by comparing the characteristics to those made from
uncoated SiC particles.
1.3 Research objectives
The thermophysical properties of Cu-SiCp composites can be optimized by
improving the bonding between the copper matrix and SiCp reinforcement. This can be
done using an electroless coating process. With these considerations in mind and the
statements made in the preceding introduction concerning the potentials of the Cu-SiCp

19
composites as thermal management materials, the present work is aimed for the
following objectives:
i. To prepare the copper coated SiC using electroless coating process to
achieve homogenous copper deposit on the SiC particles.
ii. To fabricate the composites with different volume content of SiC particle
reinforcement using powder metallurgy method.
iii. To characterize the Cu-coated SiCp reinforcement by using XRD, SEM
and particle analyzer. The density of the Cu-SiCp composites made from
copper coated SiC particles will be compared to those made from
uncoated SiC powders.
1.4 Scope of works
The scope of this research is quite narrow. It consists of the electroless copper
coating process of SiC particles and the fabrication process of Cu-SiCp composites
using a conventional powder metallurgical methodology. The electroless coating
process that is performed in this research study is not new but rather a reproduced
process which was published in numerous books and journals. However, a few
modifications were made in the coating process to improve the quality of the electroless
copper deposit. XRD and SEM analysis were performed to determine the homogeneity
and purity of the copper film on the SiC particles. Then, the powder metallurgical
methodology will be used to fabricate the Cu-SiCp composites at different volume
contents of SiC particles. The fabrication techniques involve the conventional uniaxial
powder pressing and sintering processes. The experimental data are analyzed to
determine the effects of volume content of non-coated SiC particles and coated SiC
particles on the density of the Cu-SiCp composites.

20
CHAPTER 2
LITERATURE REVIEW
2.1 Advanced packaging materials
Electronic packaging refers to the packaging of the integrated chips,
interconnections, encapsulations, cooling devices, power supply and the housing
(Chung 2000). Large attentions have been given to the integrated chips, resulted in a
rapid increase in the packing density of devices on the chip. Thus, the amount of heat
generated by each chip has increased greatly. As the power of electronics increases, the
heat dissipation problem becomes even more difficult to handle. The traditional
packaging materials such as Invar, Kovar, copper-tungsten and copper molybdenum
have limited thermal conductivities and need to be replaced. Therefore, new advanced
packaging materials have been developed.
High thermal conductivity and low thermal expansion requirements have been
the driving force for the development of new advanced packaging materials. These
advanced materials can be categorized into three different groups; composites,
monolithic carbonaceous materials, advanced metallic alloys (Zweben 2005). Most of
these advanced packaging materials are composites. Composite is a combination of two
or more distinct materials, having a recognizable interface between them (Miracle &
Donaldson 2001). Based on Zweben (2005), the most important packaging composites
consist of carbon/carbon composites (CCCs), ceramics matrix composites (CMCs),
polymer matrix composites (PMCs) and metal matrix composites (MMCs). The most
typical reinforcements are continuous and discontinuous fibers and ceramic particles
such as diamond, silicon carbide, beryllium oxide and graphite flakes. Carbon fiber

21
reinforced composites are strongly anisotropic while the particles reinforced composites
tend to have isotropic properties. The properties of these advanced composites are listed
in Table 2.1.
Table 2.2: Properties of advanced materials with high thermal conductivity and low coefficient of thermal expansion (Zweben 1999 & Zweben 2005).
Matrix Reinforcement Thermal
conductivity
(W/m.K)
CTE
(ppm/K)
Specific
gravity
CVD diamond - 1100 – 1800 1 – 2 3.52
Highly Oriented
Pyrolytic Graphite
- 1300 – 1700 -1.0 2.3
Natural graphite - 150 – 500 -1.0 -
Aluminum - 218 23 2.7
Copper - 400 17 8.9
Tungsten Copper 157 – 190 5.7 – 8.3 15 – 17
Epoxy natural graphite 370 -2.4 1.94
Polymer continuous
carbon fibers
330 -1 1.8
Copper discontinuous
carbon fibers
300 6.5 – 9.5 6.8
Copper continuous
carbon fibers
400 – 420 0.5 – 16 5.3 – 8.2

22
Copper SiC particles 320 7 – 10.9 6.6
Aluminum graphite flake 400 – 600 4.5 – 5.0 2.3
2.2 Metal matrix composites (MMCs)
The important characteristic of MMCs is their thermal properties can be altered
to required value. For example, the thermal conductivity of carbon fiber reinforced
MMCs can be as high as 900 W/m.K, making them competitive to heat pipes over a
short distance. Alternatively, the particles reinforced MMCs can be used as heat
spreaders for highly isotropic in plane conductivities.
For electronic packaging, the matrices of MMCs can be aluminum, magnesium,
cobalt, copper, and silver. The reinforcements include continuous and discontinuous
carbon fibers, graphite flakes, silicon carbide (SiC), diamond, and beryllia particles. SiC
particle reinforced with aluminum composite (Al-SiC) has been used widely as
packaging materials for a few decades. The advantages of Al-SiC are its CTE can be as
low as 6.2 ppm/K and it can be a very cost effective packaging material due to its low
density. The only disadvantage of Al-SiC is its thermal conductivity is limited to 220
W/m.K. For that reason, Cu-SiCp composites seem to have a greater potential than Al-
SiC because copper has almost double the thermal conductivity of aluminum.
2.2.1 Fabrication of MMCs
MMCs can be fabricated using a wide variety of fabrication methods such as
solid state, liquid state, deposition and in-situ. The solid state methods can be further

23
classified into diffusion bonding and powder metallurgy (PM). In diffusion bonding,
metal matrix in the form of foil is consolidated with the reinforcement by applying heat
and pressure. However, in PM approach, discontinuous, whisker, or particulate
reinforcements are mixed with metal powders, pressed and consolidate at a temperature
below the melting points of the constituents. The consolidation process can be done
with or without pressure assistance. Many MMCs can be fabricated by using
pressureless consolidation process via PM approach such as SiCp reinforced copper-
aluminum composites (Wang et. al. 2008).
Traditionally, the powders were compacted by using uniaxial compression
techniques. The temperature of the sintering process has significant effects on the final
properties of the PM products. For an example, there was a significant increase in the
hardness of CuSiCp composites as the sintering temperature was increased from 900oC
to 950oC (Celebi Efe et. al. 2011). But high sintering temperature also has negative
impact to the PM products. For an example, in the fabrication of SiCp reinforced
titanium composites, the formation of silicides was observed after the samples were
sintered at elevated temperature for a long time (Poletti et. al. 2008). Furthermore, a
range of mechanical working methods, such as forging, rolling and extrusion, maybe
applied to achieve full densification. Hot pressing method is also typically used to
improve the final density of the MMCs. CuSiC composites with high vol.% of SiCp
were successfully fabricated by using a hot press method (Pelleg et. al. 1996& Schubert
et. al. 2007).
In the liquid state, the reinforcements are wetted by the molten metal matrix
during the consolidation process which is adapted from the conventional casting
techniques. The reinforcements can be mixed with molten metal during melt stirring

24
process but the volume content of the reinforcement is limited to approximately 20
vol.%. Beyond this value, the dispersion of the reinforcement becomes difficult. Most of
the liquid state processes involve the use of pre-form reinforcement which molten metal
must infiltrate. The process can be carried out at atmospheric pressure where it relies
solely on the capillary action for infiltration. The infiltration process can also be
performed with the assistance of an external pressure. This type of liquid state process is
called squeeze casting process. The squeeze casting process can also be employed to
fabricate MMCs such as CuSiC composites (Zhu et. al. 2005),AlSiC composites
(Elomari et. al. 1998) and SiCp reinforced aluminum-copper alloy composites (Onat,
Akbulut & Yilmaz 2007). However, the same interfacial problem that was observed in
the pressureless infiltration process of AlSiC was also observed in the CuSiC
composites which were fabricated by pressure assisted infiltration process due to the
formation of Cu3Si (Xing et. al. 2005).
In the deposition process, the reinforcement particles are mixed with atomized
metal and sprayed by fine droplets. Then the metal and the substrate are co-deposited
onto a substrate and left to solidify. Many available methods have been used in the
fabrication of MMCs, such as chemical and physical vapor depositions, electroplating,
sputtering and plasma spraying. Based on Brendelet. al. (2007), the electroplating of Cu
layer on SiC fiber can be done in a copper (II) sulphate (CuSO4) bath at room
temperature. The effects of the electroless copper deposit on tensile strength of CuSiCp
composites was studied by Davidson & Regener (2001) by pressureless sintering
process. Their experimental results revealed enhanced failure strain in the Cu coated
CuSiCp composites compared to their uncoated equivalents. In-situ SEM observations
of the fracture process also showed improved bonding between the Cu coated SiCp and
the Cu matrix. A thin titanium layer deposited by electroplating process on the SiC

25
fibers can improve the tensile strength of the SiC fiber reinforced Cu composites (Luo
et. al. 2007). The application of magnetron sputtering to deposit chromium and tungsten
interlayers on SiC fibers were demonstrated by Kock, Brendel& Bolt (2007).
For in-situ processes, the MMCs are fabricated via the unidirectional
solidification of eutectic alloys which leads to the formations of two different
microstructures. Most of the time, the matrix is a solid solution and the reinforcement
phase is an intermetallic compound or carbide (Matthews & Rawlings 1999). By
definition, unidirectional solidified eutectics are not true composite materials.
Nevertheless, they behave closely to that of composites with aligned fibers.
2.2.2 Fabrication of copper composites via PM approach
There are three main types of copper MMCs; diamond particles reinforced
copper composites, carbon fiber reinforced copper composites (Cu-Cf), and SiC
particles reinforced copper composites (Cu-SiCp) (Neubauer 2005). Diamond particles
reinforced copper composites are good candidates for heat sink applications due to the
combination of high thermal conductivity of 640 W/m.K and low CTE of 9x10⁻⁶ K-1
(Schubert et. al. 2008). The thermal conductivity of diamond particles reinforced copper
composites depends greatly on the volume content and particle size of the diamond
particles (Yoshida & Morigami 2004). Cu-Cf composites are also good candidates for
packaging materials due to the combination of low CTE and weight of the carbon fiber.
The CTE of Cu-Cf composites can be engineered preferably by the volume content and
average length of the fibers (Korb, Buchgraber & Shubert 1998). Furthermore, the CTE
of Cu-Cf composites can be tailored to be approximately equal to that of silicon, thus the
composites can be soldered directly to the silicon wafers (Kuniya et. al. 1983). These
26
Cu-Cf composites can be economically fabricated via conventional powder metallurgy
approaches followed by a hot press process. The final properties of these Cu-Cf
composites suffer from the weak interface between the copper matrix and the carbon
fiber reinforcement, and the inhomogeneous dispersion of carbon fibers in the copper
matrix. Moreover, the properties of the Cu-Cf composites are anisotropic thus they have
a limited use in the thermal management application.
Due to the anisotropic behavior of Cu-Cf composites, the use of SiC particles as
reinforcements in copper MMCs becomes a great interest. Cu-SiCp composites can also
be fabricated by using hot press process via powder metallurgical approach (Chang &
Lin 1996). The CTE of Cu-SiCp composites can be tailored by controlling the volume
content (Prakasan, Palaniappan & Seshan 1997) and the size of SiCp (Elomari 1998 and
Zhu et. a. 2005). But similar to Cu-Cf composites, Cu-SiCp composites also suffer from
similar bonding problem. In order to develop and strengthen the bond between Cu
matrix and SiCp reinforcement, the bonding between the matrix and the reinforcement
phases must be improved. One of the methods to improve the bonding is by coating SiC
reinforcement with Cu film. With an addition of 20 vol.% of SiC, the mechanical
properties of the composites can be improved three times better than pure copper (Chan
& Lin 1996).
2.3 Electroless metal deposition process
The basic components for the electroless plating bath are a metal salt and a
reducing agent. But most of the time, a complexing agent, stabilizers, accelerators, or
inhibitors, are also required to control the rate and stability of the plating process.
Furthermore, the plating process must be performed under controlled pH and
27
temperature. The metal salt is the source of the metal ions which during the electroless
plating, is reduced by the reducing agent. The complexing agent acts as a buffer which
reduces the concentration of free metal ions thus decreasing the rate of the reaction.
Without the presence of the complexing agent, spontaneous precipitation of metal salt
can occurs especially when the electroless plating process is performed at an elevated
temperature. Besides the complexing agent, the stabilizer is also an important addition
to the plating solution. It prevents the spontaneous decomposition of the plating bath
due to a sudden increase of hydrogen gas during the plating process. The concentration
of the stabilizer must be controlled carefully to prevent plate-out of metal on the walls
of the plating tank. The temperature of the plating bath must be controlled at a certain
range to prevent solution plate-out or even decomposition. The temperature of the bath
is also critical in controlling the voids in the metal deposit. Large amount of voids was
observed on electroless copper deposit from plating baths containing formaldehyde and
glyoxylic acid as reducing agents at low temperature (Wu and Sha 2009).
The surface cleaning is critical in developing good bonding between the
substrate and the metal deposit. The removal of foreign contaminants such as dirt, soil,
grease and tarnish can be done by using acetone or commercial alkaline cleaners. The
removal of oxide surface can be done through chemical attack or etching, acid pickling
solutions and alkaline deoxidizing materials.
Electroless plating has been used extensively in many industries such as
aerospace, automotive, chemical processing, oil and gas, mining and military
applications. For an example, electroless nickel coatings improve inherent
characteristics by adding hardness, wear resistance, corrosion protection and
solderability of aluminum components in aerospace industry. In the automotive

28
industry, the use of electroless nickel on carburetors, fuel supply systems and fuel
pumps has gained wide acceptance. Corrosion related problems in the chemical
processing industries can also be minimized by means of electroless nickel coating. Oil
and gas industry is also an important market due to the corrosion and wear of various
drilling and piping components. Besides these industries, other applications such as
molds and dyes, foundry tooling and printing industry are also taking advantages of the
unique properties of the electroless plating processes.
2.3.1 Pretreatments of nonmetallic substrates
The main difference between metallic and nonmetallic substrates resides in the
nature of the bond between the substrate and the metal deposits. Nonmetallic substrates
require further treatments involving microetching, sensitizing and activation after
surface cleaning process because the nonmetallic substrates lack of catalytic properties
and therefore require activating treatment that will render them catalytic. The
microetching process basically roughens the substrate surface where crater-like
impressions are created. These will provide a large surface area with many sites for
mechanical interlocking of the metal deposits. Then the sensitization process is applied.
In this process, clusters of Sn are adsorbed onto the substrate surface in its oxidized
forms (Sn2+ and/or Sn4+) to form a continuous film. Other Sn2+ ions are then directly
oxidized to form layers of stannic compounds over the surface (Natividad 2004). Next
in the activation process, a small amount of palladium is chemically deposited on the
substrate surface. The palladium acts as a catalyst for the eletcroless metal depositon to
occur.

29
The Sn2+ ions will reduce the Pd2+ to precipitate catalytic palladium seeds on the
substrate surface. The insoluble stannic hydroxide reacts with hydrochloride acid to
form soluble stannous and stannic chlorides which are removed from the substrate
surface via thorough rinsing process. With the exposure of the active palladium nuclei,
the substrate is ready for electroless plating process.
2.3.2 Electroless copper deposition on SiC particles
The electroless copper plating techniques are mostly conducted in the fabrication
of electronic parts and printed circuit boards. But recently, it has been introduced in the
fabrication of metal matrix composites to improve the bonding between the metal
matrix and the nonmetallic reinforcements. The theoretical basis of the electroless
copper deposition has been studied and published in many papers and journals.
Basically, the typical electroless copper solution contains a source of copper ions, a
reducing agent, a complexant, an inhibitor, an exaltant and/or a stabilizer. Copper salts
such as copper sulphate chloride or nitrate are mostly used as copper ions sources.
Formaldehyde in the other hand is widely used as a reducing agent.
The presences of copper ions and a reducing agent are enough to initiate
thermodynamically stable electroless copper deposition process. But in actual condition,
a slight change in the pH of the solution might lead to the total precipitation of copper
ions. In order to overcome this difficulty, a complexing agent is added to the solution.
Complexing agents such as Rochelle salt, EDTA, glycolic acid and triethanol amine
(TEA) are widely used in electroless plating baths. The possibility of using sacharose as
a Cu (II) ligand in electroless copper systems has also been established (Norkus et. al.
2007). These complexing agents depress the concentration of free copper ions thus
stabilize the pH of the solution during the electroless plating process. Each complexing

30
agent has different effect on the reduction rate of Cu(II) ions and the oxidation rate of
formaldehyde (Lin & Yen 2001). The presence of complexing agents therefore has
profound effects on the structure of the metal deposit. However, the selection and
concentration of the complexing agent must be considered very carefully to ensure
sufficient free copper ions are available for the electroless plating process.
With the presence of complexing agent in the plating solution, the plating rate
will be lowered. A small addition of exaltants or accelerators will increase the plating
rate without causing any instability to the plating bath. For an example, a small addition
of ammonia accelerates effectively the autocatalytic reduction of Cu (II) ions by
formaldehyde in EDTA solution (Vaskelis et. al. 2007). Another critical parameter to
consider is the pH of the solution. The formation of byproducts such as hydrogen (H+)
or hydroxyl (OH-) ions will change the pH of the solution during the copper deposition
process. The dependence of the change in OH- concentration on the rate of the catalytic
process is markedly influenced by the rate of H2 evolution (Valkelis 1987). Nonetheless,
the presence of hydrogen has insignificant effects on the mechanical properties of the
copper deposit because the solubility of hydrogen in copper is very small (Nakahara
1988). In order to stabilize the pH of the solution, buffers such as carboxylic acids are
added into the solution. The addition of 2-MTB in tartarate and EDTA based plating
baths also increase the copper plating rate (Hanna et. al. 2003). Other stabilizers such as
2,2’-dipyridyl has inhibiting effects on the electroless metal deposition. It increases the
potential of the reduction reaction thus reducing the copper deposition rate (Li et. al.
2004). The presence of potassium ferrocyanide (K4Fe(CN)6) in the plating bath
promotes defects free and smooth copper surface (Veleva 1986) which is preferred in
most practical application in electronics industry (Norkus 2006). Cyanide ions are likely
to adsorb strongly on copper surface and facilitate the desorption of hydrogen gas from

31
the deposit surface, thus promote the ductility of the copper deposits (Nakahara &
Okinaka 1983). Some additives are also required to suppress the spontaneous oxidation
reaction in the plating solution to prevent a very coarse and poor adhesive copper film
from being developed (Oh & Chung 2006). However, the stabilizer must not be used
excessively because too much stabilizers will totally shield the substrate surface and
prevent the copper deposition from happening. At 10 mM concentration, most of the
strong inhibitors caused a complete inhibition of the copper deposition (Bielinski 1987).
Most electroless copper solutions employ formaldehyde as the reducing agent.
The reduction potential and the rate of oxidation are strongly dependent to the pH of the
solution. For practical electroless copper deposition, the pH of the plating bath should
be above 11. This pH restriction imposes the use of complexed copper ions in order to
prevent the precipitation of copper (II) hydroxide. Furthermore, the additives also show
significant effects on the cathodic reduction of the copper ions. The effects can be
accelerating or inhibiting, depends on the type and concentration of the additive.
The bonding formed via electroless copper deposition process is not of an
atomic nature because chemical bonding cannot be formed between the metal deposit
and the nonmetallic substrates. Therefore there is only mechanical bonding exists
between the metal deposit and the nonmetallic substrate.

32
CHAPTER 3
RESEARCH METHODOLOGY
This study concentrates on preparing the electroless copper coating on silicon
carbide particles (SiCp) and fabricate the copper matrix reinforced with copper coated
silicon carbide particles (CuSiCp) and non-coated silicon carbide particles composites.
Then the effects of such coating on the final density and microstructure of the fabricated
Cu-SiCp composites is studied.
The experimental activities are divided into three major stages as shown in
Figure 3.1. In the first stage, an electroless metal coating technique was carried out to
coat SiCp with thin copper film. Then in the second stage, CuSiCp composites were
fabricated with varying volume fractions of SiC using the conventional powder
metallurgical methodology. Finally in the third stage, the physical and microstructural
characterization of the composites was performed. The effects of the electroless copper
coating on the final density of the composites were investigated. Microstructural
analysis was conducted to study the copper coating on the SiCp and the composites.
Throughout the experimental work, different methods and tests were used.

33
Figure 3.1: The flow chart of the whole experimental process.
3.1 Raw materials
The raw materials which were utilized for the experiments were angular shaped
abrasive grade silicon carbide (SiC) powder from PRESI and 99% purity spheroidal
copper (Cu) powder from Sigma Aldrich. Table 3.1 shows the characteristics of the raw
materials received, as reported by the respective manufacturers.
Electroless copper coating
Powder compaction
Sintering
Density measurements
SiC particulates
Cu powders
STAGE 1
ELECTROLESS COATING
STAGE 2
CHARACTERIZATION
STAGE 3
POWDER METALLURGY &
TESTING
SEM / XRD / PARTICLE
ANALYZER

34
Table 3.1: The basic characteristics of the powders as received from
manufacturers.
Properties Unit Silicon carbide
PRESI
Copper powder
Sigma Aldrich
Particle shape - Angular Spheroidal
Purity % - 99
Crystal structure - - FCC
Particle size, D50 µm 45.6 -
3.2 Electroless coating
3.2.1 Surface treatments
The cleanliness surface of the SiC particle is critical to ensure flawless Cu
deposition during the electroless coating process. The treatments used to prepare the
surface of SiC particles are generally similar to those used for the preparation of base
metals in electroplating process. In order to obtain a homogeneous copper deposit on the
surface of the SiC particles, the following steps were carried out:
First, 20g of SiC particles was cleaned using Ultramet 2003 Sonic Cleaner
Buehler ultrasonic bath in 400ml of industrial grade acetone for 15 minutes as shown in
Figure 3.2. Then the SiC particles were filtered by using Whatman® qualitative grade 4
(20-25 µm) filter papers as in Figure 3.3. The cleaning process was repeated three times.

35
Then, the clean filtered silicon carbide particles were dried in the oven at 75oC for 4
hours.
Figure 3.2: Ultrasonic cleaning of SiC particles.
Figure 3.3: Filtering the SiC particles after ultrasonic cleaning in
acetone for 15 minutes.
After the cleaned SiC particles completely dry, the particles were etched in a
diluted solution of nitric acid (65%) for 30 minutes using ultrasonic bath. Then, the SiC

36
particles were rinsed with 500ml of deionized water for three times. Next, the SiC
particles were sensitized in a solution containing 40ml of hydrochloric acid (37%), 10g
of tin (II) chloride dehydrate (SnCl2) and 1000ml of deionized water. The sensitization
process was performed at 40oC for 2 hours as in Figure 3.4. The solution was
continuously stirred. Then, the SiC particles were slowly rinsed with 1000ml of
deionized water.
Figure 3.4: Sensitization process of SiC particles.
After rinse, the SiC particles were activated in a solution containing 1000ml of
deionized water, 3ml of hydrochloric acid (37%) and 0.25g of palladium (II) chloride
(PdCl2). The activation process was performed at 40oC for 1 hour under continuous
stirring condition as in Figure 3.5. Then, the SiC particles were slowly rinsed with
1000ml of deionized water for three times to prevent contamination of the solution.
Finally the activated SiC particles were dried in the oven at 85oC for 4 hours as shown
in Figure 3.6.

37
Figure 3.5: Activation process of SiC particles.
Figure 3.6: Oven for drying process of SiC particles.
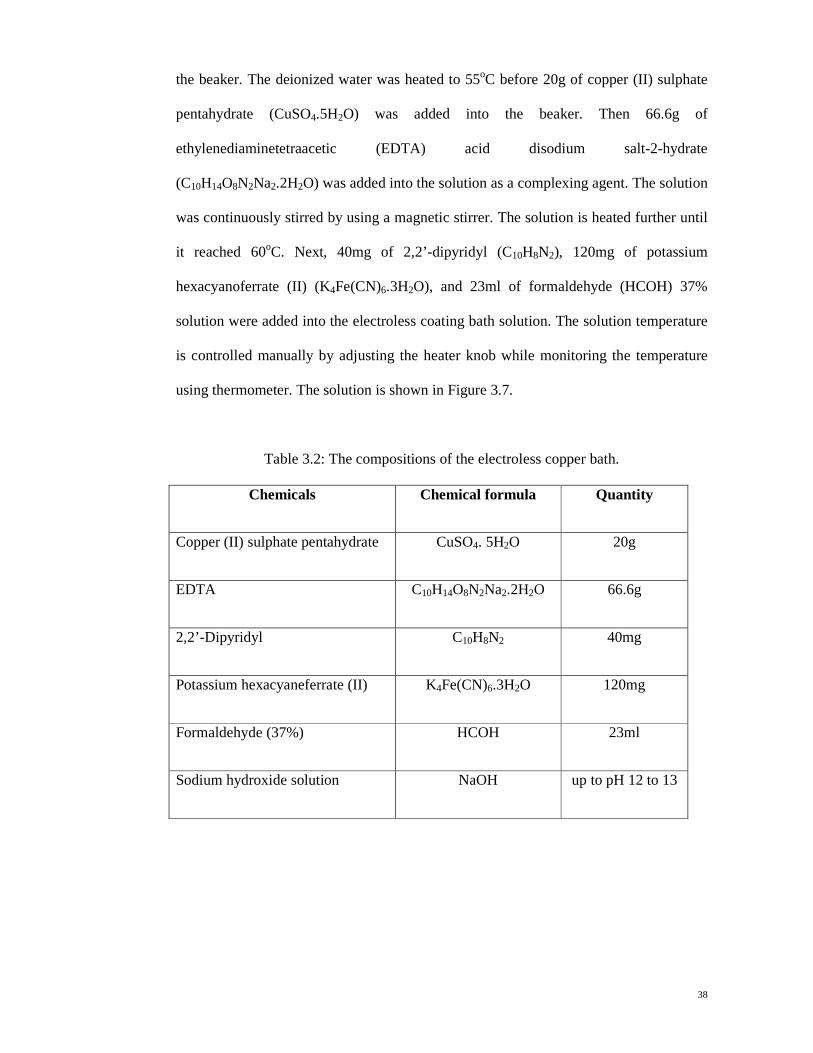
3.2.2 Electroless copper coating
The electroless coating bath was prepared and the compositions of the bath
solution are presented in Table 3.2. First, 2000ml of deionized water was poured into
38
the beaker. The deionized water was heated to 55oC before 20g of copper (II) sulphate
pentahydrate (CuSO4.5H2O) was added into the beaker. Then 66.6g of
ethylenediaminetetraacetic (EDTA) acid disodium salt-2-hydrate
(C10H14O8N2Na2.2H2O) was added into the solution as a complexing agent. The solution
was continuously stirred by using a magnetic stirrer. The solution is heated further until
it reached 60oC. Next, 40mg of 2,2’-dipyridyl (C10H8N2), 120mg of potassium
hexacyanoferrate (II) (K4Fe(CN)6.3H2O), and 23ml of formaldehyde (HCOH) 37%
solution were added into the electroless coating bath solution. The solution temperature
is controlled manually by adjusting the heater knob while monitoring the temperature
using thermometer. The solution is shown in Figure 3.7.
Table 3.2: The compositions of the electroless copper bath.
Chemicals Chemical formula Quantity
Copper (II) sulphate pentahydrate CuSO4. 5H2O 20g
EDTA C10H14O8N2Na2.2H2O 66.6g
2,2’-Dipyridyl C10H8N2 40mg
Potassium hexacyaneferrate (II) K4Fe(CN)6.3H2O 120mg
Formaldehyde (37%) HCOH 23ml
Sodium hydroxide solution NaOH up to pH 12 to 13

39
Figure 3.7: Electroless solution bath for coating process of SiC particles.
After that, by using a small pump, air was bubbled into the solution. The pH of
the electroless coating bath was adjusted in between 12 to 13 by adding sodium
hydroxide (NaOH) solution. Then, the temperature of the bath was increased to 75oC.
When the temperature reached 75oC, 15g of activated SiC particles was put into the bath
and the electroless Cu deposition would occurs immediately as shown in Figure 3.8.
The electroless coating process were performed for 30 minutes with the temperature
maintained at 75oC and the pH of the electroless bath maintained in between 12 to 13.
After the coating process was completed, the Cu coated SiC particles were slowly rinsed
with 400ml of hot water that was heated at 75oC. The rinsing process was repeated for
five times to remove all contaminations. Then, the Cu coated SiC particles were rinsed
again with 500ml of acetone twice and left to dry under room temperature. Finally the
coated silicon carbide particles were dried in a tube furnace at 600oC for 2 hours under
argon atmosphere.

40
Figure 3.8: Electroless copper coating process of silicon carbide particles.
3.3 Characterizations on copper coated silicon carbide particles
3.3.1 Scanning electron microscope (SEM) examination
The surface structure of the raw, cleaned, sensitized, activated and coated silicon
carbide particles were examined by using JEOL JSM-6460LA scanning electron
microscope (SEM).
3.3.2 X-ray diffraction (XRD) analysis
X-ray diffraction (XRD) analysis was performed on the purchased SiC particles.
The analysis was done by using Shimadzu XRD-6000 x-ray diffractometer.

41
3.3.3 Particle analyzer analysis
The mean particle size, D50 and the particle size distribution were performed on
the cleaned, sensitized, activated and Cu coated SiC particles. The analysis was done
using of Malvern Mastersizer2000 particle size analyzer.
3.4 Fabrication of CuSiCp composites
The Cu powder was mixed with different volume fractions of SiC powder (vSiC):
0.1, 0.2, 0.3, 0.4, 0.5, 0.6 and 0.7. The vSiC is defined as the ratio of the volume of the
SiC powder VSiC to the volume of CuSiC composite (VCuSiC). The volume fraction of Cu
powder is also defined the same way.
���� =����
������
and ��� =���
������
where VCu is the volume of Cu powder. The volume of the CuSiC composite, VCuSiC was
calculated based on a cylindrical green-compact with 11mm diameter and 10mm
thickness, which is theoretically equivalent to 0.95cm3. It was noted that
���� + ��� = 1 and ���� + ��� = ������
The weight fraction of SiC powder (wSiC) and Cu powder (wCu) are defined as the ratio
of the weight of the constituents to the weight of the CuSiC composite (WCuSiC).
���� =����
������
and��� =���
������
It was noted that
���� + ��� = 1 ��� ���� + ��� = ������
Since v and W are related to density (ρ) as follow
�� = �

42
Therefore ������������ = ������ + ��������
������ = ������
������+ ����
����
������
������ = ������ + ��������
where ρCuSiC,ρCu and ρSiC are the density of the CuSiC composite, Cu powder and SiC
powder respectively. The weight fraction of SiC powder (wSiC) can therefore be related
to its volume fraction as the following.
���� =����
������
=��������
������������=
����
����������
In the same way, the weight fraction of Cu powder (wCu) is also given by
��� =���
������
=������
������������=
���
���������
Since the volumes of the CuSiC composites were fixed at 0.95cm3, the values for WCu
and WSiC for the CuSiC composites at different volume fractions of SiC powder are
given in Table 3.3.
Table 3.3: The amount of Cu and non-coated SiC powders required for the CuSiC
composites.
��� ���� ���� �� �����
0.0 8.93 0.0000 8.9314 8.9314
0.1 8.36 0.3223 8.0378 8.3601
0.2 7.79 0.6436 7.1447 7.7883
0.3 7.22 0.9654 6.2518 7.2172
0.4 6.64 1.2873 5.3586 6.6459

43
0.5 6.07 1.6093 4.4653 6.0746
0.6 5.50 1.9306 3.5729 5.5035
0.7 4.93 2.2528 2.6794 4.9322
However, for the Cu coated SiC particles (SiCCu-coated), the volume of the Cu deposit on
the SiC particles (Vx) is considered as a fraction of the total volume of Cu in the Cu-
coated CuSiC (CuSiCCu-coated) composites. For that reason, the weight fraction of Cu in
the SiCCu-coated (wc) must be determined prior to green compact preparation. Knowing
the value of wc, the required weight of SiCCu-coated (Wy) and the required weight of Cu
powder (Wx) can be calculated by the using the following equations:
���� = � − ���
��� = �� + ���
where wcWy is the weight of Cu deposit on the SiC particles. Both equations are only
valid if the value of Wx ≥ 0. At Wx = 0, the value of WCu is solely contributed by the Cu
deposit on the SiC particles. In the case of VCuSiC = 0.95cm3 and wc = 0.25, the values
for Wy and Wx for CuSiCCu-coated composites at different volume fractions of SiC powder
are given in Table 3.4.
Table 3.4: The amount of Cu and SiCCu-coated powders required for the CuSiCCu-coated
composites.
��� ���� ���� ��
0.0 8.93 0.0000 8.9307
0.1 8.36 0.4293 7.9308
0.2 7.79 0.8584 6.9307

44
0.3 7.22 1.2876 5.9296
0.4 6.64 1.7169 4.9292
0.5 6.07 2.1456 3.9296
0.6 5.50 2.5743 2.9293
0.7 4.93 3.0037 1.9285
3.4.1 Preparation of green compacts
The weight of SiC and Cu powders are determined theoretically based on the
same compact volumes as in Table 3.3 and Table 3.4. Figure 3.9 shows the mold set
used in green compaction process.
Figure 3.9: Mold and tool set used in green compaction process.
The weighted Cu and SiC powders are placed in a customized milling container.
Ball milling method was used using Zirconia balls with diameter of 10mm to mix both
powders slowly at a fixed speed for 10 minutes as in Figure 3.10. The milling speed and

45
milling time were determined through try-and-error method to obtain the homogeneity
mixing of both powders.
Figure 3.10: Ball mill process of the composite powders.
After the milling process, the powders were uniaxial compressed in a tool steel
mold with inner diameter of 12mm under 50kN of load. Gotech 200kN UTM machine
was used to perform the compaction process. The compaction process is shown as in
Figure 3.11. After the compaction process, the weight, diameter and thickness of the
green compacts composites were measured by using an analytical balance and a digital
vernier caliper. Then the green density of each compact was calculated.

46
Figure 3.11: Compaction process using uniaxial Gotech 200kN UTM machine.
3.4.2 Sintering process
The green compacts composites were sintered in the furnace at 925oC for 2
hours in an argon atmosphere. In order to control precisely the heating rate, sintering
temperature and cooling rate during the sintering process, VT tube furnace was used as
shown in Figure 3.12. The temperature of the furnace was raised slowly at 5oC per
minute to prevent thermal shock and minimize temperature gradient on the samples.

47
Figure 3.12: The tube furnace for sintering process.
The sintering temperature profile is shown in Figure 3.13. Once the sintering
process was completed, the final mass and volume of the samples were measured again.
Figure 3.13: The temperature profile for the sintering process.

48
3.4.3 Density and porosity measurements
The true densities of the specimens were measured in a Micromeritics AccuPyc
II 1340 pycnometer as shown in Figure 3.14. The pycnometer uses helium gas to
measure the volume of the specimen accurately. The sample was sealed in the specimen
compartment and then helium gas was passed into the compartment. Then, the pressures
before the expansion and after the expansion were measured. Then, the volume of the
sample was computed. The gas displacement density of the sample was then calculated
by dividing the sample weight to this volume. The average true density of the composite
was given by pycnometer calculation.
Figure 3.14: Pycnometer for true density measurement.
The bulk density can be obtained by measuring the specimens using density
meter as shown in Figure 3.15. The difference between bulk density and true density
will give the porosity percent in the specimens.

49
Figure 3.15: Density meter for bulk density measurement.

50
CHAPTER 4
RESULTS AND DISCUSSION
4.1 XRD analysis on raw material
The raw material received from the manufacturer was verified using X-ray
diffraction analysis. The XRD was performed on raw Cu powder and also the raw SiC
particles which later used as reinforcement in the CuSiC composites. Figure 4.1 (a)
shows the XRD peaks for Cu powder which gives the crystal structure of FCC Cu
powder. Figure 4.1 (b) shows the peak for raw SiC. In Figure 4.1 (c), the XRD was
performed on a CuSiC composite specimen to verify the existence of both constituents
in the sample. It shows both peak of Cu powder and SiC particles, which it proves that
both materials exist in the composite and they behave themselves as described by the
term of metal matrix composites (MMCs). This XRD result also proves that the copper
coated SiCp were free of contaminants because they were dissociated from the SiCp
surface through vigorous stirring of the electroless bath and repeated rinsing process.
Figure 4.1: (a) XRD pattern for raw spheroidal Cu powder.
(a)

51
Figure 4.1, continued: (b) XRD pattern for raw SiC particles and (c) XRD pattern for
CuSiC composite.
4.2 Characterization of electroless coating on SiC
4.2.1 SiC surface treatments
The bonding between the nonmetallic SiC surfaces and the Cu coating is only
mechanical in nature (Mallory & Hajdu 1990). In order to achieve good adhesion of Cu
deposit on surface of the SiC particles, the SiC particles were cleaned in acetone using
ultrasonic bath. The solvent helps in the dissolution of the unwanted contaminants on
the surface of the SiC particles. The ultrasonic cleaning uses sound waves passed at a
very high frequency through the acetone, which create an active scrubbing action on the
surface of the SiC particles. The cleaning process was repeated for a few times until
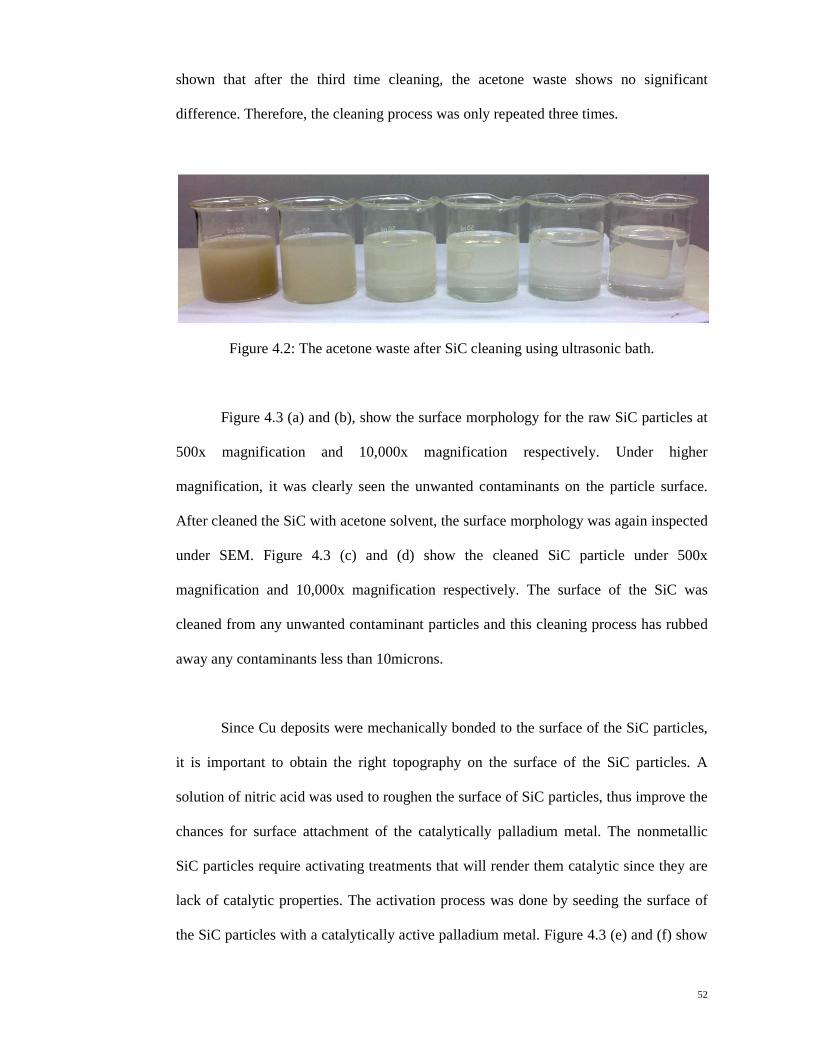
there is no significant difference in the turbidity of the acetone waste. In Figure 4.2, it is
(b)
(c)
52
shown that after the third time cleaning, the acetone waste shows no significant
difference. Therefore, the cleaning process was only repeated three times.
Figure 4.2: The acetone waste after SiC cleaning using ultrasonic bath.
Figure 4.3 (a) and (b), show the surface morphology for the raw SiC particles at
500x magnification and 10,000x magnification respectively. Under higher
magnification, it was clearly seen the unwanted contaminants on the particle surface.
After cleaned the SiC with acetone solvent, the surface morphology was again inspected
under SEM. Figure 4.3 (c) and (d) show the cleaned SiC particle under 500x
magnification and 10,000x magnification respectively. The surface of the SiC was
cleaned from any unwanted contaminant particles and this cleaning process has rubbed
away any contaminants less than 10microns.
Since Cu deposits were mechanically bonded to the surface of the SiC particles,
it is important to obtain the right topography on the surface of the SiC particles. A
solution of nitric acid was used to roughen the surface of SiC particles, thus improve the
chances for surface attachment of the catalytically palladium metal. The nonmetallic
SiC particles require activating treatments that will render them catalytic since they are
lack of catalytic properties. The activation process was done by seeding the surface of
the SiC particles with a catalytically active palladium metal. Figure 4.3 (e) and (f) show

the surcease of SiC after sensitizing
10,000x magnification respectively.
Figure 4.3: The surface morphology of the SiC particles (a) and (b) before surface
cleaning, (c) and (d) after surface cleaning, (e) and (f) after sensitizing and activation of
(a)
(c)
(e)
the surcease of SiC after sensitizing and activation process at 500x magnification and
10,000x magnification respectively.
: The surface morphology of the SiC particles (a) and (b) before surface
and (d) after surface cleaning, (e) and (f) after sensitizing and activation of
the surface.
(a) (b)
(c) (d)
(e) (f)
53
and activation process at 500x magnification and
: The surface morphology of the SiC particles (a) and (b) before surface
and (d) after surface cleaning, (e) and (f) after sensitizing and activation of

54
The effectiveness of the cleaning process can also be shown by comparing the
particle size distribution of SiC particles before and after the cleaning process. Figure
4.4 (a) shows the particle size distribution for the raw SiC as received from the
manufacturer. The mean particle size (D50) gives 45.693µm size. Figure 4.4 (b) shows
that, after SiC was ultrasonically cleaned in acetone, any particles with size less than 10
micron have been successfully filtered and removed. After the cleaning process, the
particle size distribution has been slightly shifted to the right where mean particle size
(D50) of the SiC particles has increased from 45.639µm to 45.993µm. However, the
change in the particle size distribution, should be considered as a change in the particle
size. The sizes of the SiC particles remain the same after the cleaning process. Only a
portion of the population of the SiC particles has been removed during repeated
cleaning and filtration processes. Figure 4.4 (c) shows the particle size distribution for
SiC after sensitizing and activation process. The mean particle size (D50) has increased
to 46.750µm after the SiC surface has been seeding with a catalytically active palladium
metal.

55
Figure 4.4: Particle size of the SiC particles (a) before surface cleaning, (b) after surface
cleaning, (c) after sensitizing and activation of the surface.
(a)
(b)
(c)

56
4.2.2 Electroless copper coating
The two step electrochemical mechanisms occur simultaneously on the activated
surface:
1. Anodic oxidation of formaldehyde
� �� + 3�� → � ��
+ 2��� + 2� ���� = 1.140�
2. Cathodic reduction of Cu ions
���+ 2� → ����
��� = 0.337�
where ���� and ��
��� are the standard potential energy. Therefore, the overall reaction
of the electroless Cu deposition in formaldehyde-based plating solution is
���+ 2� �� + 4��
→ ��+ 2� ��
+ 2��� + ��
The electroless Cu deposition is a thermodynamically favorable reaction since
the sum �� of the standard potential energy of anodic and cathodic is positive, and the
change in the free energy is negative since ∆��= −����. The spontaneous solution
decomposition does not occur because the electroless Cu deposition reaction is
kinetically inhibited (Diamand 1995). For Cu deposition to occur, the potential energy
of the reducing agent has to be more negative than that for the metal being deposited.
The potential energy for oxidation half reaction becomes more negative when the pH of
the electroless solution is increased (Oita 1997).
Figure 4.5 (a), (b) and (b) show the surface morphology of SiC deposited with
thin Cu after the electroless coating process under 500x magnification, 3,000x
magnification and 10,000x magnification respectively.

57
Figure 4.5: The surface morphology of the Cu-coated SiC particles (a) at 500x
magnification, (b) at 3000x magnification, and (c) at 10000x magnification.
(a)
(b)
(c)
58
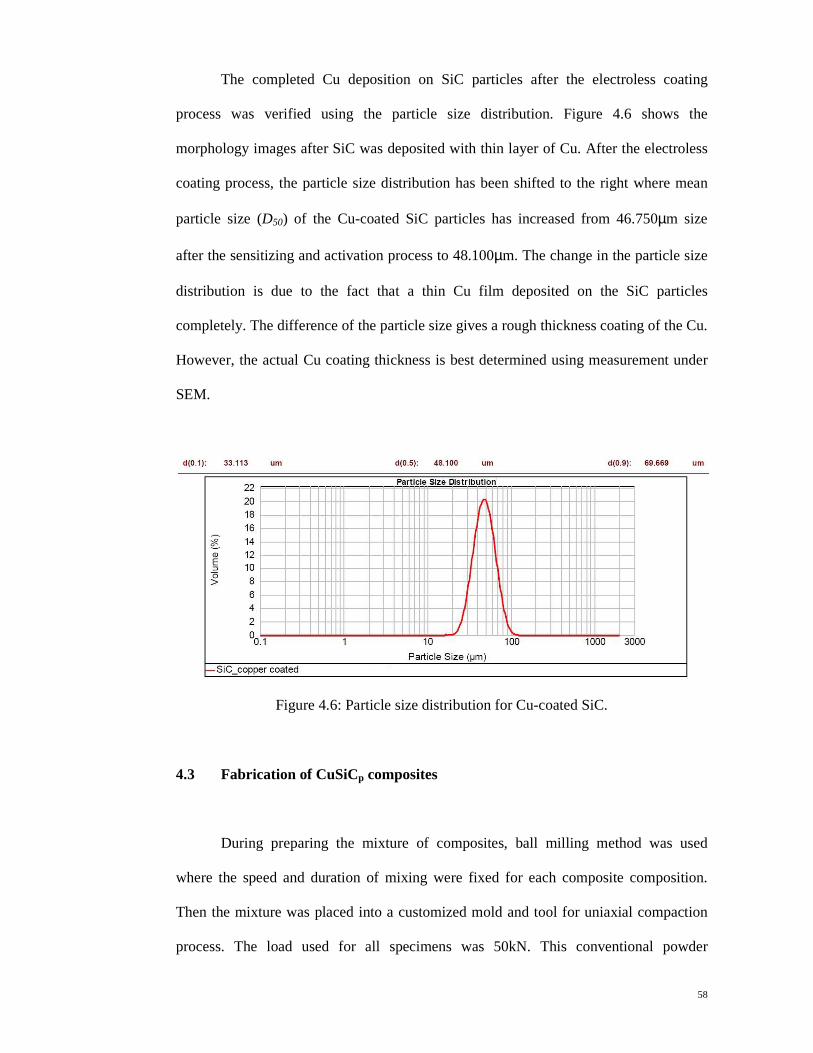
The completed Cu deposition on SiC particles after the electroless coating
process was verified using the particle size distribution. Figure 4.6 shows the
morphology images after SiC was deposited with thin layer of Cu. After the electroless
coating process, the particle size distribution has been shifted to the right where mean
particle size (D50) of the Cu-coated SiC particles has increased from 46.750µm size
after the sensitizing and activation process to 48.100µm. The change in the particle size
distribution is due to the fact that a thin Cu film deposited on the SiC particles
completely. The difference of the particle size gives a rough thickness coating of the Cu.
However, the actual Cu coating thickness is best determined using measurement under
SEM.
Figure 4.6: Particle size distribution for Cu-coated SiC.
4.3 Fabrication of CuSiCp composites
During preparing the mixture of composites, ball milling method was used
where the speed and duration of mixing were fixed for each composite composition.
Then the mixture was placed into a customized mold and tool for uniaxial compaction
process. The load used for all specimens was 50kN. This conventional powder

59
metallurgy technique was performed for both CuSiCCu-coatedSiC and CuSiCnon-coatedSiC
under different composition for comparisons.
The compaction was successful for all CuSiC composites with the Cu-coated
SiC reinforcement with volume fractions: 0.1, 0.2, 0.3, 0.4, 0.5, 0.6 and 0.7. It was due
to a good improved interface bonding between Cu matrix and Cu-coated reinforcement
of SiC as shown in Figure 4.7 (a). However, for CuSiC composites with non-coated SiC
reinforcement, the compacted specimen starts to chip and porous when volume fraction
of non-coated SiC reach 0.5 due to the poor interface bonding between the two
constituents as shown in Figure 4.7 (b). Therefore, for CuSiC with non-coated SiC
reinforcement composites, the samples can only be obtained for volume fraction 0.1,
0.2, 0.3 and 0.4.
Figure 4.7: (a) Successful compaction of CuSiC with Cu-coated SiC reinforcement and
(b) Unsuccessful compaction of CuSiC with non-coated SiC reinforcement at volume
fraction of 0.6.
(a) (b)

60
4.4 Density and porosity measurement
According to the overall reaction of the electroless Cu deposition in
formaldehyde-based plating solution equation, the deposition of one mole of Cu is
accompanied by the evolution of one mole of hydrogen (H2). This results in the
incorporation of H2 gas bubbles into the Cu deposit. The small H2 gas bubbles (20-
300A) are incorporated uniformly throughout the copper film while the large (25-30
µm) bubbles are trapped at the grain boundaries (Nakahara & Okinaka 1983). Thus, the
density of the electroless copper is expected to be lower than that of bulk copper due to
the presence of incorporated hydrogen.
The measured density of CuSiC composites were done by measuring the weight,
diameter and thickness of each specimen using an analytical balance and vernier caliper.
As the volume fraction of SiC reinforcement increase, the density of the specimen
decreases. Figure 4.8 shows the measured density for both composites with Cu-coated
SiC reinforcement and non-coated SiC reinforcement. When the volume fraction of Cu
matrix increases, while the volume fraction of SiC reinforcement decreases, the density
is in increasing trend. The same trend can be seen in Figure 4.9 for bulk density
measurement of the specimens using density meter. In this method, the specimens were
weighted in air and also in water. Then, the weight of specimen in air will be divided
with the volume obtained through the difference reading of mass in air and mass in
water and it will give the bulk density value for each specimen.
volume = massair – masswater
density = massair
(massair – masswater)

61
Figure 4.8: Measured density for both Cu-coated SiC and non-coated SiC reinforcement
in CuSiC composites.
Figure 4.9: Bulk density for both Cu-coated SiC and non-coated SiC reinforcement in
CuSiC composites.
0.00
1.00
2.00
3.00
4.00
5.00
6.00
7.00
8.00
9.00
0.2 0.3 0.4 0.5 0.6 0.7 0.8 0.9 1.0 1.1
De
nsity
(g/
cm3 )
Volume fraction of Cu matrix
coated SiC non-coated SiC
0.00
1.00
2.00
3.00
4.00
5.00
6.00
7.00
8.00
9.00
0.0 0.1 0.2 0.3 0.4 0.5 0.6 0.7 0.8 0.9 1.0 1.1
De
nsity
(g/
cm3 )
Volume fraction of Cu matrix
coated non coated

62
The true density is obtained by using a Micromeritics AccuPyc II 1340
pycnometer. Figure 4.10 shows the increasing of density value when the volume
fraction of Cu matrix increase, which the volume fraction of SiC reinforcement
decreased.
Figure 4.10: Density measured using pycnometer for both Cu-coated SiC and non-
coated SiC reinforcement in CuSiC composites.
For Cu-coated SiC reinforcement in the composites, the result obtained from all
measured, bulk or pycnometer showed slightly higher density compared to non-coated
SiC reinforcement. This might due to the better interface bonding between Cu matrix
and Cu-coated SiC in the composites as discussed previously in section 4.3.
0.00
1.00
2.00
3.00
4.00
5.00
6.00
7.00
8.00
9.00
0.0 0.1 0.2 0.3 0.4 0.5 0.6 0.7 0.8 0.9 1.0 1.1
De
nsity
(g/
cm3 )
Volume fraction of Cu matrix
coated non coated

63
The fraction of the total void volume or the porosity can be determined by the
equation (Shu 2003):
where Pf is the pore volume fraction, ρ is the measured density and ρo is the theoretical
density. Besides, the porosity also can be determined by the difference of bulk density
measured using density meter and the true density from pycnometer measurement.
Figure 4.11 showed the porosity percentage of the specimens. As the density
trend increases, the porosity percentage is expected to behave oppositely. This might be
due to the entrapped H2 gas during the electroless coating process.
Figure 4.11: Percentage of porosity for both Cu-coated SiC and non-coated SiC
reinforcement in CuSiC composites.
0.00
2.00
4.00
6.00
8.00
10.00
12.00
14.00
0.0 0.1 0.2 0.3 0.4 0.5 0.6 0.7 0.8 0.9 1.0 1.1
Por
osi
ty p
erc
ent
age
(%
)
Volume fraction of Cu matrix
coated non coated
Pf = 1 - ρ
ρo

64
CHAPTER 5
CONCLUSION AND RECOMMENDATION
5.1 Conclusion
Nowadays, aluminum matrix reinforced with silicon carbide particle (Al-SiC) is
widely used as the thermal management materials for electronics packaging. However,
it has limitation on the coefficient thermal expansion (CTE) properties since it only can
be altered between 6.2 to 23 ppm/K as well as the thermal conductivity which limited to
220 W/m.K. Therefore, the invention of copper matrix reinforced with silicon carbide
particles (Cu-SiC) is expected to improve on the thermal properties since copper has
almost double the thermal conductivity compared to aluminum.
CuSiC composites have the interface problem between the copper matrix and the
silicon carbide particles reinforcement due to no bonding between the two constituents.
In order to improve the bonding issue, the reinforcement is coated with a thin copper
film by using electroless coating technique to obtain homogeneous copper deposits on
SiC particles. Then, the Cu-SiC composite was fabricated by different volume fraction
of the SiC reinforcement to analyse the behavior of the properties. The composites is
compared between Cu-coated SiC particles reinforcement and non-coated SiC particles
reinforcement.
From the XRD pattern of a sample of CuSiC composite, the peaks that exist is
similar to the raw materials’ XRD peaks which are spheroidal Cu powder and SiC
particles. Before performing the electroless coating, the surface of SiC particles need to
be cleaned from unwanted contaminants through ultrasonic cleaning in a solvent. Then,

65
the surface is sensitized and activated to seed the surface for Cu deposits. Then, the
electroless coating technique is conducted in a electroless copper coating bath under
suitable temperature and pH of the coating solution. Then, the Cu-coated SiC particles
need to be dryed at 600oC for 2 hours. From SEM images on the raw SiC particles, the
unwanted contanminants can be seen. After ultrasonic cleaning in solvent, no
contaminant observed under SEM image. After activation process, SEM images have
shown the surface of SiC that already seeded with catalytic element for Cu deposits.
After coating process, the SEM image shows the Cu deposits on the SiC particles.
Particle size distribution is another characteristic which conducted in this
research work. The particles size distribution was performed on the raw SiC particles,
after ultrasonic cleaned SiC particles, after sensitizing and activation of the SiC particles
as well as after Cu-coating on SiC particles. The size distribution showed that, after
cleaned the SiC, no other contaminant less than 10 microns left in the powder. Then,
after sensitizing and activation, the mean distribution is slightly higher due to catalytic
elements which attached to the SiC particles. Then, after Cu-coating process, the mean
particle size distribution gow higher because of the Cu deposits on SiC particles.
Fabrication of the CuSiC composites is performed using powder metallurgy
methodology. The Cu matrix and SiC reinforcement (both Cu-coated and non-coated) is
mixed via ball milling method and pressed in a customized mold with 50kN uniaxial
compaction load. Then, the compacted samples are sintered at 925oC for 2 hours in
argon atmosphere. After that, the samples were measured for density using analytical
balance, vernier caliper, density meter and also pycnometer. The density trend shows
that, as the volume fraction of SiC reinforcement increased, the density decreased. For
Cu-coated SiC reinforcement, the density is slightly higher compare to the non-coated

66
SiC reinforcement. For the percentage of porosity, the trend shows oppositely of the
density trend. This is because, the higher the density, the lower the porosity.
5.2 Recommendation
Due to the time constrain, this research work still have a lot of areas to be
explored. The study on the thermal conductivity, CTE, and also the mechanical
properties of the CuSiC composites are recommended in future. With these further
studies and characterizations, the improved development of CuSiC via electroless
coating process can be achieved.

67
BIBLIOGRAPHY
Peter Krieg, The Red Brick Wall, Pile Systems 2004.
Carl Zweben, Thermal Materials Solve Power Electronics Challenges, Power
Electronics Technology, February 2006.
M.A. Occhionero, R.W. Adams, K.P. Fennessy, R.A. Hay, "Aluminum Silicon Carbide
(AlSiC) for Thermal Management Solutions and Functional Packaging Designs"
proceedings of the Annual IMAPS Conference, San Diego CA, October, 1998.
N. Koura, Electroless Plating of Silver, Electroless Plating: Fundamentals and
Applications, American Electroplaters and Surface Finishers Society, Chapter
17, Page 441, 1990.


![REQUEST FOR QUOTATION [RFQ] No CRAC-KGG-23749 ......Johannesburg, 2001 TFR RFQ No Crac-KGG-23749 For the Provision Of Hygiene, Deep Cleaning And Pest Control Services At Sasolburg,](https://static.fdocuments.us/doc/165x107/5f9659ef7018417ad548d826/request-for-quotation-rfq-no-crac-kgg-23749-johannesburg-2001-tfr-rfq.jpg)