PRELIMINARY STORM WATER REPORT FOR - … Hydrographs Extension for AutoCAD® Civil 3D® 2014 by...
30
PRELIMINARY STORM WATER REPORT FOR: WAFFLE HOUSE 2928 LONDON-GROVEPORT ROAD GROVE CITY, OHIO August 26, 2016 Prepared for: Waffle House, Inc. 5986 Financial Drive Norcross, Georgia 30071 (770) 326-7068 Prepared by: IBI Group 635 Brooksedge Blvd. Westerville, Ohio 43081 (614) 818-4900
-
Upload
hoangthien -
Category
Documents
-
view
219 -
download
1
Transcript of PRELIMINARY STORM WATER REPORT FOR - … Hydrographs Extension for AutoCAD® Civil 3D® 2014 by...

PRELIMINARY STORM WATER REPORT FOR:
WAFFLE HOUSE
2928 LONDON-GROVEPORT ROAD
GROVE CITY, OHIO
August 26, 2016
Prepared for:
Waffle House, Inc.
5986 Financial Drive
Norcross, Georgia 30071
(770) 326-7068
Prepared by:
IBI Group
635 Brooksedge Blvd.
Westerville, Ohio 43081
(614) 818-4900

635 Brooksedge Blvd. Project: Date: 7/26/2016Westerville, OH 43081 Job No.: 16-137 Revised:(F): 614-818-4902 Contact: Revised:
(V): 614-818-4900 Ext. 238 Revised:
Acreage (Ac.) Runoff CN
Hydrologic Soil Group
0.39 84 D0.003 97 D0.006 98 D
Composite Curve Number = 84.3
Acreage (Ac.) Runoff CN
Hydrologic Soil Group
0.140 84 D0.340 98 D
Composite Curve Number = 93.9
Acreage (Ac.) Runoff CN
Hydrologic Soil Group
Composite Curve Number =
IMPERVIOUS
Description
PRE-DEVELOPED
Sub Area I.D.PERVIOUSGRAVEL
IMPERVIOUS
Description
TYPE OVERALL DESCRIPTION HERE (i.e. POST DEVELOPED SITE)
Sub Area I.D.PERVIOUS
RUNOFF CURVE NUMBER CALCULATIONWaffle House
Eric Chenevey
Description
TYPE OVERALL DESCRIPTION HERE (i.e. POST DEVELOPED SITE)
Sub Area I.D.
635 Brooksedge Blvd. Project: Date: 7/26/2016Westerville, OH 43081 Job No.: 16-137 Revised: 8/26/2016(F): 614-818-4902 Contact: Revised:
(V): 614-818-4900 Ext. 238 Revised:
Project Location:
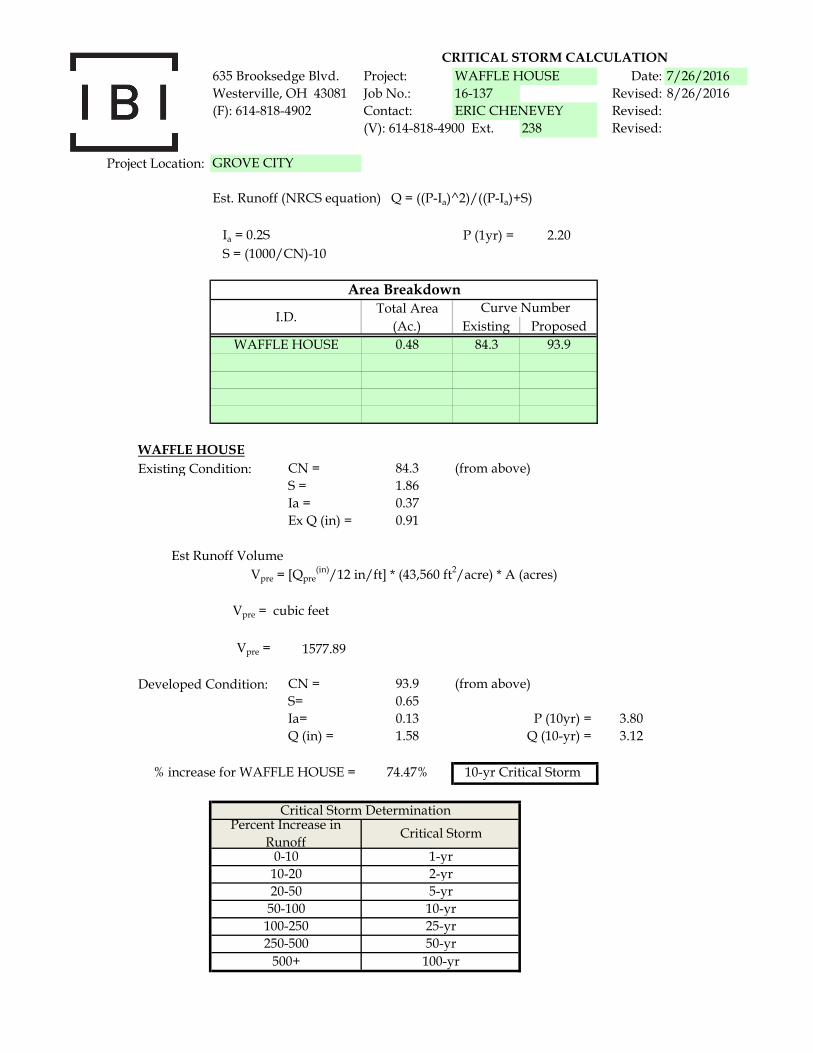
Ia = 0.2S P (1yr) = 2.20 S = (1000/CN)-10
Total Area(Ac.) Existing Proposed0.48 84.3 93.9
WAFFLE HOUSEExisting Condition: CN = 84.3 (from above)
S = 1.86Ia = 0.37Ex Q (in) = 0.91
Est Runoff Volume
Vpre = 1577.89
Developed Condition: CN = 93.9 (from above)S= 0.65Ia= 0.13 P (10yr) = 3.80Q (in) = 1.58 Q (10-yr) = 3.12
% increase for WAFFLE HOUSE = 74.47% 10-yr Critical Storm
100-yr
50-100100-250250-500
500+
1-yr2-yr5-yr
10-yr25-yr50-yr
Percent Increase in Runoff
Critical Storm
Critical Storm Determination
0-1010-2020-50
CRITICAL STORM CALCULATION
Est. Runoff (NRCS equation) Q = ((P-Ia)^2)/((P-Ia)+S)
Curve NumberArea Breakdown
I.D.
ERIC CHENEVEY
WAFFLE HOUSE
Vpre = [Qpre(in)/12 in/ft] * (43,560 ft2/acre) * A (acres)
Vpre = cubic feet
GROVE CITY
WAFFLE HOUSE

Soil Map—Franklin County, Ohio
Natural ResourcesConservation Service
Web Soil SurveyNational Cooperative Soil Survey
7/21/2016Page 1 of 3
4412
040
4412
050
4412
060
4412
070
4412
080
4412
090
4412
100
4412
110
4412
120
4412
130
4412
140
4412
150
4412
160
4412
040
4412
050
4412
060
4412
070
4412
080
4412
090
4412
100
4412
110
4412
120
4412
130
4412
140
4412
150
4412
160
321720 321730 321740 321750 321760 321770 321780 321790 321800 321810
321720 321730 321740 321750 321760 321770 321780 321790 321800 321810
39° 50' 26'' N83
° 5
' 1'' W
39° 50' 26'' N
83° 4
' 57'
' W
39° 50' 22'' N
83° 5
' 1'' W
39° 50' 22'' N
83° 4
' 57'
' W
N
Map projection: Web Mercator Corner coordinates: WGS84 Edge tics: UTM Zone 17N WGS840 30 60 120 180
Feet0 5 10 20 30
MetersMap Scale: 1:621 if printed on A portrait (8.5" x 11") sheet.

MAP LEGEND MAP INFORMATION
Area of Interest (AOI)Area of Interest (AOI)
SoilsSoil Map Unit Polygons
Soil Map Unit Lines
Soil Map Unit Points
Special Point FeaturesBlowout
Borrow Pit
Clay Spot
Closed Depression
Gravel Pit
Gravelly Spot
Landfill
Lava Flow
Marsh or swamp
Mine or Quarry
Miscellaneous Water
Perennial Water
Rock Outcrop
Saline Spot
Sandy Spot
Severely Eroded Spot
Sinkhole
Slide or Slip
Sodic Spot
Spoil Area
Stony Spot
Very Stony Spot
Wet Spot
Other
Special Line Features
Water FeaturesStreams and Canals
TransportationRails
Interstate Highways
US Routes
Major Roads
Local Roads
BackgroundAerial Photography
The soil surveys that comprise your AOI were mapped at 1:15,800.
Warning: Soil Map may not be valid at this scale.
Enlargement of maps beyond the scale of mapping can causemisunderstanding of the detail of mapping and accuracy of soil lineplacement. The maps do not show the small areas of contrastingsoils that could have been shown at a more detailed scale.
Please rely on the bar scale on each map sheet for mapmeasurements.
Source of Map: Natural Resources Conservation ServiceWeb Soil Survey URL: http://websoilsurvey.nrcs.usda.govCoordinate System: Web Mercator (EPSG:3857)
Maps from the Web Soil Survey are based on the Web Mercatorprojection, which preserves direction and shape but distortsdistance and area. A projection that preserves area, such as theAlbers equal-area conic projection, should be used if more accuratecalculations of distance or area are required.
This product is generated from the USDA-NRCS certified data as ofthe version date(s) listed below.
Soil Survey Area: Franklin County, OhioSurvey Area Data: Version 13, Sep 26, 2015
Soil map units are labeled (as space allows) for map scales 1:50,000or larger.
Date(s) aerial images were photographed: Feb 27, 2012—Mar10, 2012
The orthophoto or other base map on which the soil lines werecompiled and digitized probably differs from the backgroundimagery displayed on these maps. As a result, some minor shiftingof map unit boundaries may be evident.
Soil Map—Franklin County, Ohio
Natural ResourcesConservation Service
Web Soil SurveyNational Cooperative Soil Survey
7/21/2016Page 2 of 3

Map Unit Legend
Franklin County, Ohio (OH049)
Map Unit Symbol Map Unit Name Acres in AOI Percent of AOI
CrA Crosby silt loam, Southern OhioTill Plain, 0 to 2 percentslopes
1.3 67.8%
Ko Kokomo silty clay loam, 0 to 2percent slopes
0.6 32.2%
Totals for Area of Interest 2.0 100.0%
Soil Map—Franklin County, Ohio
Natural ResourcesConservation Service
Web Soil SurveyNational Cooperative Soil Survey
7/21/2016Page 3 of 3

Hydraflow Table of Contents 16-137-HYDRAFLOW.gpw
Hydraflow Hydrographs Extension for AutoCAD® Civil 3D® 2014 by Autodesk, Inc. v10.3 Friday, 08 / 26 / 2016
2 - YearHydrograph Reports................................................................................................................... 1
Hydrograph No. 2, Rational, PRE............................................................................................ 1Hydrograph No. 4, Rational, POST.......................................................................................... 2Hydrograph No. 6, Rational, DIRECT DISCHARGE................................................................ 3Hydrograph No. 8, Reservoir, PARKING LOT STORAGE....................................................... 4
Pond Report - PARKING LOT STORAGE........................................................................... 5
5 - YearHydrograph Reports................................................................................................................... 6
Hydrograph No. 2, Rational, PRE............................................................................................ 6Hydrograph No. 4, Rational, POST.......................................................................................... 7Hydrograph No. 6, Rational, DIRECT DISCHARGE................................................................ 8Hydrograph No. 8, Reservoir, PARKING LOT STORAGE....................................................... 9
10 - YearHydrograph Reports................................................................................................................. 10
Hydrograph No. 2, Rational, PRE.......................................................................................... 10Hydrograph No. 4, Rational, POST........................................................................................ 11Hydrograph No. 6, Rational, DIRECT DISCHARGE.............................................................. 12Hydrograph No. 8, Reservoir, PARKING LOT STORAGE..................................................... 13
25 - YearHydrograph Reports................................................................................................................. 14
Hydrograph No. 2, Rational, PRE.......................................................................................... 14Hydrograph No. 4, Rational, POST........................................................................................ 15Hydrograph No. 6, Rational, DIRECT DISCHARGE.............................................................. 16Hydrograph No. 8, Reservoir, PARKING LOT STORAGE..................................................... 17
100 - YearHydrograph Reports................................................................................................................. 18
Hydrograph No. 2, Rational, PRE.......................................................................................... 18Hydrograph No. 4, Rational, POST........................................................................................ 19Hydrograph No. 6, Rational, DIRECT DISCHARGE.............................................................. 20Hydrograph No. 8, Reservoir, PARKING LOT STORAGE..................................................... 21

Hydrograph Report
Hydraflow Hydrographs Extension for AutoCAD® Civil 3D® 2014 by Autodesk, Inc. v10.3 Friday, 08 / 26 / 2016
Hyd. No. 2
PRE
Hydrograph type = Rational Peak discharge = 0.917 cfsStorm frequency = 2 yrs Time to peak = 5 minTime interval = 1 min Hyd. volume = 275 cuftDrainage area = 0.480 ac Runoff coeff. = 0.38*Intensity = 5.030 in/hr Tc by User = 5.00 minIDF Curve = GROVE CITY IDF.IDF Asc/Rec limb fact = 1/1
* Composite (Area/C) = [(0.060 x 0.90) + (0.030 x 0.40) + (0.390 x 0.30)] / 0.480
1
0 1 2 3 4 5 6 7 8 9 10
Q (cfs)
0.00 0.00
0.10 0.10
0.20 0.20
0.30 0.30
0.40 0.40
0.50 0.50
0.60 0.60
0.70 0.70
0.80 0.80
0.90 0.90
1.00 1.00
Q (cfs)
Time (min)
PRE
Hyd. No. 2 -- 2 Year
Hyd No. 2

Hydrograph Report
Hydraflow Hydrographs Extension for AutoCAD® Civil 3D® 2014 by Autodesk, Inc. v10.3 Friday, 08 / 26 / 2016
Hyd. No. 4
POST
Hydrograph type = Rational Peak discharge = 1.738 cfsStorm frequency = 2 yrs Time to peak = 5 minTime interval = 1 min Hyd. volume = 521 cuftDrainage area = 0.480 ac Runoff coeff. = 0.72*Intensity = 5.030 in/hr Tc by User = 5.00 minIDF Curve = GROVE CITY IDF.IDF Asc/Rec limb fact = 1/1
* Composite (Area/C) = [(0.340 x 0.90) + (0.140 x 0.30)] / 0.480
2
0 1 2 3 4 5 6 7 8 9 10
Q (cfs)
0.00 0.00
1.00 1.00
2.00 2.00
Q (cfs)
Time (min)
POST
Hyd. No. 4 -- 2 Year
Hyd No. 4

Hydrograph Report
Hydraflow Hydrographs Extension for AutoCAD® Civil 3D® 2014 by Autodesk, Inc. v10.3 Friday, 08 / 26 / 2016
Hyd. No. 6
DIRECT DISCHARGE
Hydrograph type = Rational Peak discharge = 0.121 cfsStorm frequency = 2 yrs Time to peak = 5 minTime interval = 1 min Hyd. volume = 36 cuftDrainage area = 0.080 ac Runoff coeff. = 0.3*Intensity = 5.030 in/hr Tc by User = 5.00 minIDF Curve = GROVE CITY IDF.IDF Asc/Rec limb fact = 1/1
* Composite (Area/C) = [(0.080 x 0.30)] / 0.080
3
0 1 2 3 4 5 6 7 8 9 10
Q (cfs)
0.00 0.00
0.05 0.05
0.10 0.10
0.15 0.15
0.20 0.20
0.25 0.25
0.30 0.30
0.35 0.35
0.40 0.40
0.45 0.45
0.50 0.50
Q (cfs)
Time (min)
DIRECT DISCHARGE
Hyd. No. 6 -- 2 Year
Hyd No. 6

Hydrograph Report
Hydraflow Hydrographs Extension for AutoCAD® Civil 3D® 2014 by Autodesk, Inc. v10.3 Friday, 08 / 26 / 2016
Hyd. No. 8
PARKING LOT STORAGE
Hydrograph type = Reservoir Peak discharge = 0.666 cfsStorm frequency = 2 yrs Time to peak = 8 minTime interval = 1 min Hyd. volume = 521 cuftInflow hyd. No. = 4 - POST Max. Elevation = 827.71 ftReservoir name = PARKING LOT STORAGE Max. Storage = 278 cuft
Storage Indication method used.
4
0 2 4 6 8 10 12 14 16 18 20 22
Q (cfs)
0.00 0.00
1.00 1.00
2.00 2.00
Q (cfs)
Time (min)
PARKING LOT STORAGE
Hyd. No. 8 -- 2 Year
Hyd No. 8 Hyd No. 4 Total storage used = 278 cuft

Pond Report 5
Hydraflow Hydrographs Extension for AutoCAD® Civil 3D® 2014 by Autodesk, Inc. v10.3 Friday, 08 / 26 / 2016
Pond No. 1 - PARKING LOT STORAGE
Pond Data
UG Chambers -Invert elev. = 824.79 ft, Rise x Span = 1.25 x 1.25 ft, Barrel Len = 116.00 ft, No. Barrels = 1, Slope = 0.40%, Headers = NoContours -User-defined contour areas. Conic method used for volume calculation. Begining Elevation = 826.51 ft
Stage / Storage Table
Stage (ft) Elevation (ft) Contour area (sqft) Incr. Storage (cuft) Total storage (cuft)
0.00 824.79 n/a 0 00.17 824.96 n/a 2 20.34 825.13 n/a 7 90.51 825.30 n/a 16 260.69 825.48 n/a 22 470.86 825.65 n/a 24 711.03 825.82 n/a 24 951.20 825.99 n/a 22 1171.37 826.16 n/a 16 1331.54 826.33 n/a 7 1401.71 826.50 n/a 2 1421.72 826.51 08 0 1422.78 827.57 08 8 1512.79 827.58 08 0 1513.50 828.29 2,764 691 842
Culvert / Orifice Structures Weir Structures
[A] [B] [C] [PrfRsr] [A] [B] [C] [D]
Rise (in) = 12.00 4.00 0.00 0.00
Span (in) = 12.00 4.00 0.00 0.00
No. Barrels = 1 1 0 0
Invert El. (ft) = 824.79 824.79 0.00 0.00
Length (ft) = 50.00 0.00 0.00 0.00
Slope (%) = 0.50 0.00 0.00 n/a
N-Value = .013 .013 .013 n/a
Orifice Coeff. = 0.60 0.60 0.60 0.60
Multi-Stage = n/a Yes No No
Crest Len (ft) = 0.00 0.00 0.00 0.00
Crest El. (ft) = 0.00 0.00 0.00 0.00
Weir Coeff. = 3.33 3.33 3.33 3.33
Weir Type = --- --- --- ---
Multi-Stage = No No No No
Exfil.(in/hr) = 0.000 (by Contour)
TW Elev. (ft) = 0.00
Note: Culvert/Orifice outflows are analyzed under inlet (ic) and outlet (oc) control. Weir risers checked for orifice conditions (ic) and submergence (s).
0.00 0.08 0.16 0.24 0.32 0.40 0.48 0.56 0.64 0.72 0.80
Stage (ft)
0.00 824.79
1.00 825.79
2.00 826.79
3.00 827.79
4.00 828.79
Elev (ft)
Discharge (cfs)
Stage / Discharge
Total Q

Hydrograph Report
Hydraflow Hydrographs Extension for AutoCAD® Civil 3D® 2014 by Autodesk, Inc. v10.3 Friday, 08 / 26 / 2016
Hyd. No. 2
PRE
Hydrograph type = Rational Peak discharge = 1.117 cfsStorm frequency = 5 yrs Time to peak = 5 minTime interval = 1 min Hyd. volume = 335 cuftDrainage area = 0.480 ac Runoff coeff. = 0.38*Intensity = 6.125 in/hr Tc by User = 5.00 minIDF Curve = GROVE CITY IDF.IDF Asc/Rec limb fact = 1/1
* Composite (Area/C) = [(0.060 x 0.90) + (0.030 x 0.40) + (0.390 x 0.30)] / 0.480
6
0 1 2 3 4 5 6 7 8 9 10
Q (cfs)
0.00 0.00
1.00 1.00
2.00 2.00
Q (cfs)
Time (min)
PRE
Hyd. No. 2 -- 5 Year
Hyd No. 2

Hydrograph Report
Hydraflow Hydrographs Extension for AutoCAD® Civil 3D® 2014 by Autodesk, Inc. v10.3 Friday, 08 / 26 / 2016
Hyd. No. 4
POST
Hydrograph type = Rational Peak discharge = 2.117 cfsStorm frequency = 5 yrs Time to peak = 5 minTime interval = 1 min Hyd. volume = 635 cuftDrainage area = 0.480 ac Runoff coeff. = 0.72*Intensity = 6.125 in/hr Tc by User = 5.00 minIDF Curve = GROVE CITY IDF.IDF Asc/Rec limb fact = 1/1
* Composite (Area/C) = [(0.340 x 0.90) + (0.140 x 0.30)] / 0.480
7
0 1 2 3 4 5 6 7 8 9 10
Q (cfs)
0.00 0.00
1.00 1.00
2.00 2.00
3.00 3.00
Q (cfs)
Time (min)
POST
Hyd. No. 4 -- 5 Year
Hyd No. 4

Hydrograph Report
Hydraflow Hydrographs Extension for AutoCAD® Civil 3D® 2014 by Autodesk, Inc. v10.3 Friday, 08 / 26 / 2016
Hyd. No. 6
DIRECT DISCHARGE
Hydrograph type = Rational Peak discharge = 0.147 cfsStorm frequency = 5 yrs Time to peak = 5 minTime interval = 1 min Hyd. volume = 44 cuftDrainage area = 0.080 ac Runoff coeff. = 0.3*Intensity = 6.125 in/hr Tc by User = 5.00 minIDF Curve = GROVE CITY IDF.IDF Asc/Rec limb fact = 1/1
* Composite (Area/C) = [(0.080 x 0.30)] / 0.080
8
0 1 2 3 4 5 6 7 8 9 10
Q (cfs)
0.00 0.00
0.05 0.05
0.10 0.10
0.15 0.15
0.20 0.20
0.25 0.25
0.30 0.30
0.35 0.35
0.40 0.40
0.45 0.45
0.50 0.50
Q (cfs)
Time (min)
DIRECT DISCHARGE
Hyd. No. 6 -- 5 Year
Hyd No. 6

Hydrograph Report
Hydraflow Hydrographs Extension for AutoCAD® Civil 3D® 2014 by Autodesk, Inc. v10.3 Friday, 08 / 26 / 2016
Hyd. No. 8
PARKING LOT STORAGE
Hydrograph type = Reservoir Peak discharge = 0.677 cfsStorm frequency = 5 yrs Time to peak = 8 minTime interval = 1 min Hyd. volume = 635 cuftInflow hyd. No. = 4 - POST Max. Elevation = 827.81 ftReservoir name = PARKING LOT STORAGE Max. Storage = 369 cuft
Storage Indication method used.
9
0 2 4 6 8 10 12 14 16 18 20 22 24 26
Q (cfs)
0.00 0.00
1.00 1.00
2.00 2.00
3.00 3.00
Q (cfs)
Time (min)
PARKING LOT STORAGE
Hyd. No. 8 -- 5 Year
Hyd No. 8 Hyd No. 4 Total storage used = 369 cuft

Hydrograph Report
Hydraflow Hydrographs Extension for AutoCAD® Civil 3D® 2014 by Autodesk, Inc. v10.3 Friday, 08 / 26 / 2016
Hyd. No. 2
PRE
Hydrograph type = Rational Peak discharge = 1.237 cfsStorm frequency = 10 yrs Time to peak = 5 minTime interval = 1 min Hyd. volume = 371 cuftDrainage area = 0.480 ac Runoff coeff. = 0.38*Intensity = 6.779 in/hr Tc by User = 5.00 minIDF Curve = GROVE CITY IDF.IDF Asc/Rec limb fact = 1/1
* Composite (Area/C) = [(0.060 x 0.90) + (0.030 x 0.40) + (0.390 x 0.30)] / 0.480
10
0 1 2 3 4 5 6 7 8 9 10
Q (cfs)
0.00 0.00
1.00 1.00
2.00 2.00
Q (cfs)
Time (min)
PRE
Hyd. No. 2 -- 10 Year
Hyd No. 2
Hydrograph Report
Hydraflow Hydrographs Extension for AutoCAD® Civil 3D® 2014 by Autodesk, Inc. v10.3 Friday, 08 / 26 / 2016
Hyd. No. 4
POST
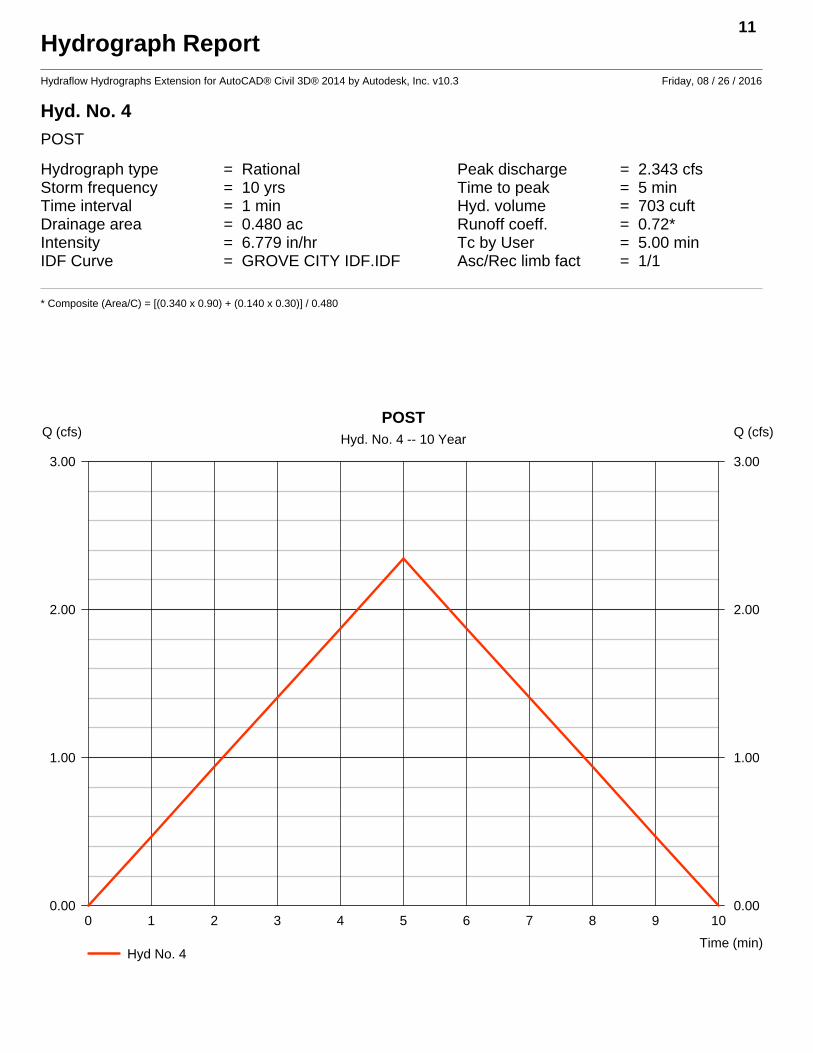
Hydrograph type = Rational Peak discharge = 2.343 cfsStorm frequency = 10 yrs Time to peak = 5 minTime interval = 1 min Hyd. volume = 703 cuftDrainage area = 0.480 ac Runoff coeff. = 0.72*Intensity = 6.779 in/hr Tc by User = 5.00 minIDF Curve = GROVE CITY IDF.IDF Asc/Rec limb fact = 1/1
* Composite (Area/C) = [(0.340 x 0.90) + (0.140 x 0.30)] / 0.480
11
0 1 2 3 4 5 6 7 8 9 10
Q (cfs)
0.00 0.00
1.00 1.00
2.00 2.00
3.00 3.00
Q (cfs)
Time (min)
POST
Hyd. No. 4 -- 10 Year
Hyd No. 4

Hydrograph Report
Hydraflow Hydrographs Extension for AutoCAD® Civil 3D® 2014 by Autodesk, Inc. v10.3 Friday, 08 / 26 / 2016
Hyd. No. 6
DIRECT DISCHARGE
Hydrograph type = Rational Peak discharge = 0.163 cfsStorm frequency = 10 yrs Time to peak = 5 minTime interval = 1 min Hyd. volume = 49 cuftDrainage area = 0.080 ac Runoff coeff. = 0.3*Intensity = 6.779 in/hr Tc by User = 5.00 minIDF Curve = GROVE CITY IDF.IDF Asc/Rec limb fact = 1/1
* Composite (Area/C) = [(0.080 x 0.30)] / 0.080
12
0 1 2 3 4 5 6 7 8 9 10
Q (cfs)
0.00 0.00
0.05 0.05
0.10 0.10
0.15 0.15
0.20 0.20
0.25 0.25
0.30 0.30
0.35 0.35
0.40 0.40
0.45 0.45
0.50 0.50
Q (cfs)
Time (min)
DIRECT DISCHARGE
Hyd. No. 6 -- 10 Year
Hyd No. 6

Hydrograph Report
Hydraflow Hydrographs Extension for AutoCAD® Civil 3D® 2014 by Autodesk, Inc. v10.3 Friday, 08 / 26 / 2016
Hyd. No. 8
PARKING LOT STORAGE
Hydrograph type = Reservoir Peak discharge = 0.684 cfsStorm frequency = 10 yrs Time to peak = 9 minTime interval = 1 min Hyd. volume = 703 cuftInflow hyd. No. = 4 - POST Max. Elevation = 827.86 ftReservoir name = PARKING LOT STORAGE Max. Storage = 421 cuft
Storage Indication method used.
13
0 2 4 6 8 10 12 14 16 18 20 22 24 26
Q (cfs)
0.00 0.00
1.00 1.00
2.00 2.00
3.00 3.00
Q (cfs)
Time (min)
PARKING LOT STORAGE
Hyd. No. 8 -- 10 Year
Hyd No. 8 Hyd No. 4 Total storage used = 421 cuft

Hydrograph Report
Hydraflow Hydrographs Extension for AutoCAD® Civil 3D® 2014 by Autodesk, Inc. v10.3 Friday, 08 / 26 / 2016
Hyd. No. 2
PRE
Hydrograph type = Rational Peak discharge = 1.432 cfsStorm frequency = 25 yrs Time to peak = 5 minTime interval = 1 min Hyd. volume = 429 cuftDrainage area = 0.480 ac Runoff coeff. = 0.38*Intensity = 7.849 in/hr Tc by User = 5.00 minIDF Curve = GROVE CITY IDF.IDF Asc/Rec limb fact = 1/1
* Composite (Area/C) = [(0.060 x 0.90) + (0.030 x 0.40) + (0.390 x 0.30)] / 0.480
14
0 1 2 3 4 5 6 7 8 9 10
Q (cfs)
0.00 0.00
1.00 1.00
2.00 2.00
Q (cfs)
Time (min)
PRE
Hyd. No. 2 -- 25 Year
Hyd No. 2

Hydrograph Report
Hydraflow Hydrographs Extension for AutoCAD® Civil 3D® 2014 by Autodesk, Inc. v10.3 Friday, 08 / 26 / 2016
Hyd. No. 4
POST
Hydrograph type = Rational Peak discharge = 2.713 cfsStorm frequency = 25 yrs Time to peak = 5 minTime interval = 1 min Hyd. volume = 814 cuftDrainage area = 0.480 ac Runoff coeff. = 0.72*Intensity = 7.849 in/hr Tc by User = 5.00 minIDF Curve = GROVE CITY IDF.IDF Asc/Rec limb fact = 1/1
* Composite (Area/C) = [(0.340 x 0.90) + (0.140 x 0.30)] / 0.480
15
0 1 2 3 4 5 6 7 8 9 10
Q (cfs)
0.00 0.00
1.00 1.00
2.00 2.00
3.00 3.00
Q (cfs)
Time (min)
POST
Hyd. No. 4 -- 25 Year
Hyd No. 4

Hydrograph Report
Hydraflow Hydrographs Extension for AutoCAD® Civil 3D® 2014 by Autodesk, Inc. v10.3 Friday, 08 / 26 / 2016
Hyd. No. 6
DIRECT DISCHARGE
Hydrograph type = Rational Peak discharge = 0.188 cfsStorm frequency = 25 yrs Time to peak = 5 minTime interval = 1 min Hyd. volume = 57 cuftDrainage area = 0.080 ac Runoff coeff. = 0.3*Intensity = 7.849 in/hr Tc by User = 5.00 minIDF Curve = GROVE CITY IDF.IDF Asc/Rec limb fact = 1/1
* Composite (Area/C) = [(0.080 x 0.30)] / 0.080
16
0 1 2 3 4 5 6 7 8 9 10
Q (cfs)
0.00 0.00
0.05 0.05
0.10 0.10
0.15 0.15
0.20 0.20
0.25 0.25
0.30 0.30
0.35 0.35
0.40 0.40
0.45 0.45
0.50 0.50
Q (cfs)
Time (min)
DIRECT DISCHARGE
Hyd. No. 6 -- 25 Year
Hyd No. 6

Hydrograph Report
Hydraflow Hydrographs Extension for AutoCAD® Civil 3D® 2014 by Autodesk, Inc. v10.3 Friday, 08 / 26 / 2016
Hyd. No. 8
PARKING LOT STORAGE
Hydrograph type = Reservoir Peak discharge = 0.697 cfsStorm frequency = 25 yrs Time to peak = 9 minTime interval = 1 min Hyd. volume = 814 cuftInflow hyd. No. = 4 - POST Max. Elevation = 827.97 ftReservoir name = PARKING LOT STORAGE Max. Storage = 523 cuft
Storage Indication method used.
17
0 2 4 6 8 10 12 14 16 18 20 22 24 26 28 30
Q (cfs)
0.00 0.00
1.00 1.00
2.00 2.00
3.00 3.00
Q (cfs)
Time (min)
PARKING LOT STORAGE
Hyd. No. 8 -- 25 Year
Hyd No. 8 Hyd No. 4 Total storage used = 523 cuft

Hydrograph Report
Hydraflow Hydrographs Extension for AutoCAD® Civil 3D® 2014 by Autodesk, Inc. v10.3 Friday, 08 / 26 / 2016
Hyd. No. 2
PRE
Hydrograph type = Rational Peak discharge = 1.712 cfsStorm frequency = 100 yrs Time to peak = 5 minTime interval = 1 min Hyd. volume = 513 cuftDrainage area = 0.480 ac Runoff coeff. = 0.38*Intensity = 9.383 in/hr Tc by User = 5.00 minIDF Curve = GROVE CITY IDF.IDF Asc/Rec limb fact = 1/1
* Composite (Area/C) = [(0.060 x 0.90) + (0.030 x 0.40) + (0.390 x 0.30)] / 0.480
18
0 1 2 3 4 5 6 7 8 9 10
Q (cfs)
0.00 0.00
1.00 1.00
2.00 2.00
Q (cfs)
Time (min)
PRE
Hyd. No. 2 -- 100 Year
Hyd No. 2

Hydrograph Report
Hydraflow Hydrographs Extension for AutoCAD® Civil 3D® 2014 by Autodesk, Inc. v10.3 Friday, 08 / 26 / 2016
Hyd. No. 4
POST
Hydrograph type = Rational Peak discharge = 3.243 cfsStorm frequency = 100 yrs Time to peak = 5 minTime interval = 1 min Hyd. volume = 973 cuftDrainage area = 0.480 ac Runoff coeff. = 0.72*Intensity = 9.383 in/hr Tc by User = 5.00 minIDF Curve = GROVE CITY IDF.IDF Asc/Rec limb fact = 1/1
* Composite (Area/C) = [(0.340 x 0.90) + (0.140 x 0.30)] / 0.480
19
0 1 2 3 4 5 6 7 8 9 10
Q (cfs)
0.00 0.00
1.00 1.00
2.00 2.00
3.00 3.00
4.00 4.00
Q (cfs)
Time (min)
POST
Hyd. No. 4 -- 100 Year
Hyd No. 4
Hydrograph Report
Hydraflow Hydrographs Extension for AutoCAD® Civil 3D® 2014 by Autodesk, Inc. v10.3 Friday, 08 / 26 / 2016
Hyd. No. 6
DIRECT DISCHARGE
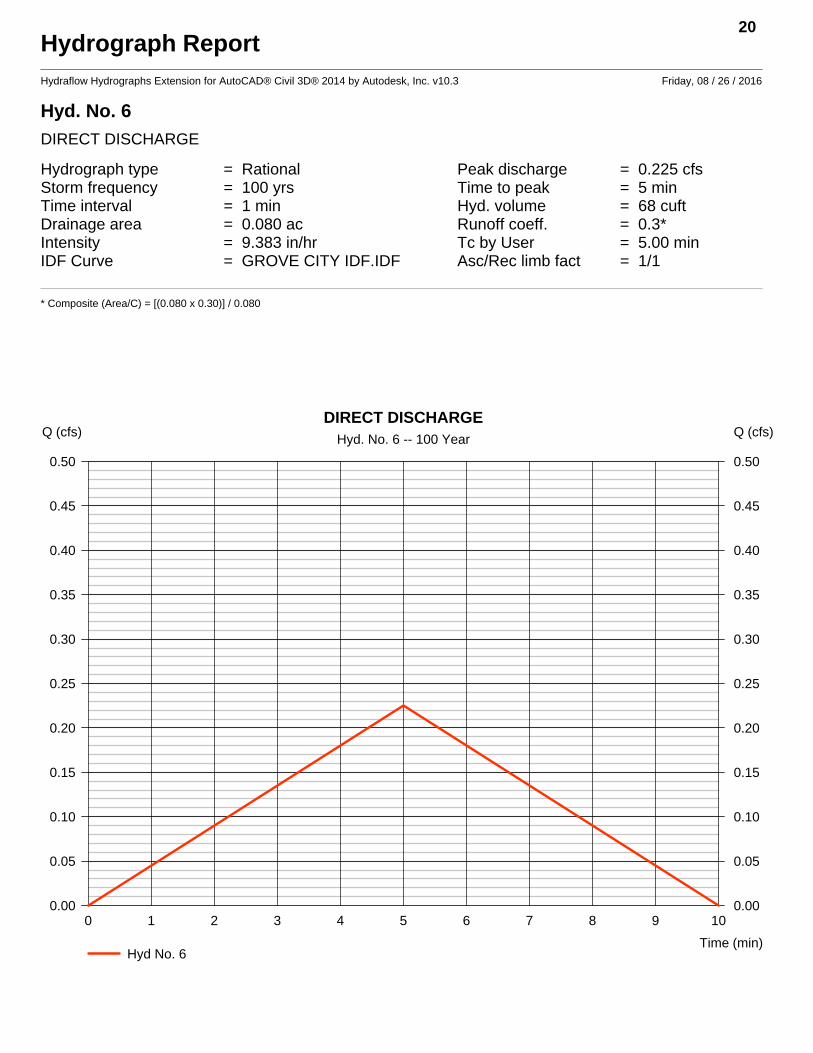
Hydrograph type = Rational Peak discharge = 0.225 cfsStorm frequency = 100 yrs Time to peak = 5 minTime interval = 1 min Hyd. volume = 68 cuftDrainage area = 0.080 ac Runoff coeff. = 0.3*Intensity = 9.383 in/hr Tc by User = 5.00 minIDF Curve = GROVE CITY IDF.IDF Asc/Rec limb fact = 1/1
* Composite (Area/C) = [(0.080 x 0.30)] / 0.080
20
0 1 2 3 4 5 6 7 8 9 10
Q (cfs)
0.00 0.00
0.05 0.05
0.10 0.10
0.15 0.15
0.20 0.20
0.25 0.25
0.30 0.30
0.35 0.35
0.40 0.40
0.45 0.45
0.50 0.50
Q (cfs)
Time (min)
DIRECT DISCHARGE
Hyd. No. 6 -- 100 Year
Hyd No. 6

Hydrograph Report
Hydraflow Hydrographs Extension for AutoCAD® Civil 3D® 2014 by Autodesk, Inc. v10.3 Friday, 08 / 26 / 2016
Hyd. No. 8
PARKING LOT STORAGE
Hydrograph type = Reservoir Peak discharge = 0.715 cfsStorm frequency = 100 yrs Time to peak = 9 minTime interval = 1 min Hyd. volume = 973 cuftInflow hyd. No. = 4 - POST Max. Elevation = 828.12 ftReservoir name = PARKING LOT STORAGE Max. Storage = 670 cuft
Storage Indication method used.
21
0 2 4 6 8 10 12 14 16 18 20 22 24 26 28 30 32
Q (cfs)
0.00 0.00
1.00 1.00
2.00 2.00
3.00 3.00
4.00 4.00
Q (cfs)
Time (min)
PARKING LOT STORAGE
Hyd. No. 8 -- 100 Year
Hyd No. 8 Hyd No. 4 Total storage used = 670 cuft

Page: 1/1216-137-WaffleHouse-Calcs.xls
635 Brooksedge Blvd. Project: Waffle House Date: 7/26/16Westerville, OH 43081 Job No.: 16-137 Revised: 8/26/16(F): 614-818-4902 Contact: Eric Chenevey Revised:
(V): 614-818-4900 Ext. 238 Revised: 10 Yr Design Storm n = 0.013
Num
ber
Type
Stat
ion
Trib
utar
y A
rea
Cum
ulat
ive
Are
a
Runo
ff C
oeffi
cien
t
Cum
ulat
ive
C
* A
D T
ime
(m
in)
S T
ime
(min
)
Inte
nsity
(in/h
r)
Des
ign
Q
(c
fs)
Leng
th
(ft)
Dia
met
er
(in
)
Slop
e
(%)
Vel
ocity
(fp
s)
Cap
acity
(cfs
)
Stat
us
Dow
nstr
eam
In
vert
Ups
trea
m
Inve
rt
Top
of
Cas
ting
N/A
N/A
YD1 YD 204.00 0.03 0.03 0.30 10.00 10.00 4.88 0.04 828.290.00 0.90 0.01 N/A 38.00 8 1.500% 4.24 1.48 OK 826.40 826.40
2 CB 166.00 0.02 0.21 0.30 0.15 10.15 4.87 0.77 827.580.16 0.90 0.16 N/A 116.00 15 0.400% 3.33 4.09 OK 825.25 825.83
1 CB 50.00 0.01 0.40 0.30 0.58 10.73 4.78 1.55 827.580.18 0.90 0.32 N/A 50.00 12 0.500% 3.21 2.52 OK 824.79 824.79
EX3 MH 0.00 0.00 0.40 0.30 0.26 10.99 4.75 1.54 828.340.00 0.90 0.32 N/A 10.00 18 0.810% 5.35 9.46 OK 824.54 824.54
N/A
YD2 YD 82.00 0.02 0.02 0.30 10.00 10.00 4.88 0.03 828.710.00 0.00 0.01 N/A 82.00 8 1.000% 3.46 1.21 OK 826.65 826.65
2 CB 0.00 0.00 0.02 0.30 0.39 10.39 4.84 0.03 827.580.00 0.90 0.01 N/A 116.00 15 0.400% 3.33 4.09 OK 825.25 825.83
N/A
YD3 TYD 77.00 0.01 0.01 0.30 10.00 10.00 4.88 0.01 828.790.00 0.90 0.00 N/A 77.00 8 1.500% 4.24 1.48 OK 826.28 826.28
1 CB 0.00 0.00 0.01 0.30 0.30 10.30 4.84 0.01 827.580.00 0.90 0.00 N/A 50.00 12 0.500% 3.21 2.52 OK 824.79 825.12
N/A
N/A
N/A
N/A
1.75' Cover
1.67' Cover
0.94' Cover
1.4' Cover
2.11' Cover
1.3' Cover
0.94' Cover
Structure Data Drainage Area Calculations Time of Conc. Flow Data Pipe Data Pipe / Structure Data
1.13' Cover
STORM SEWER DESIGN SHEET
City of Columbus, OH
Remarks

Page: 1A/12A16-137-WaffleHouse-Calcs.xls635 Brooksedge Blvd. Project: Waffle House Date:
Westerville, OH 43081 Job No.: 16-137 Revised: (F): 614-818-4902 Contact: Eric Chenevey Revised:
(V): 614-818-4900 Ext. 238 Revised: 10 Yr Design Storm n = 0.013
Remarks
Num
ber
Stat
ion
Cum
ulat
ive
C *
A
S T
ime
(min
)
Inte
nsity
(in/h
r)
Des
ign
Q
(cfs
)
Leng
th
Dia
met
er
Slop
e
(%
)
S f
(%)
S f *
L
Tailw
ater
El
evat
ion
or
0.80
* D
iam
eter
Hea
dwat
er
Elev
atio
n
Cri
tical
El
evat
ion
/N/A
/N/A
YD1 204.00 0.01 10.00 4.88 0.04 826.83 / 826.93 826.93 828.29N/A 38.00 8 1.500% 0.00% 0.00 OK
2 166.00 0.16 10.15 4.87 0.77 825.85 / 826.83 826.83 827.58N/A 116.00 15 0.400% 0.01% 0.02 OK
1 50.00 0.32 10.73 4.78 1.55 825.83 / 825.59 825.83 827.58N/A 50.00 12 0.500% 0.19% 0.09 OK
EX3 0.00 0.32 10.99 4.75 1.54 0.00 / 825.74 825.74 828.34N/A 10.00 18 0.810% 0.02% 0.00 OK
/N/A
YD2 82.00 0.01 10.00 4.88 0.03 826.83 / 827.18 827.18 828.71N/A 82.00 8 1.000% 0.00% 0.00 OK
2 0.00 0.01 10.39 4.84 0.03 0.00 / 826.83 826.83 827.58N/A 116.00 15 0.400% 0.00% 0.00 OK
/N/A
YD3 77.00 0.00 10.00 4.88 0.01 825.92 / 826.81 826.81 828.79N/A 77.00 8 1.500% 0.00% 0.00 OK
1 0.00 0.00 10.30 4.84 0.01 0.00 / 825.92 825.92 827.58N/A 50.00 12 0.500% 0.00% 0.00 OK
/N/A
/N/A
/N/A
/N/A
Pipe DataStructure Data Drainage Calculations Hydraulic Grade Line Calculations Hydraulic Grade Line
HYDRAULIC GRADE LINE CALCULATIONS
City of Columbus, OH
7/26/20168/26/2016