Preliminary statistical analysis of the international ... › system › files › Annex II... ·...
34
Preliminary statistical analysis of the international eventing results 2014 Madrid 23/1/15
Transcript of Preliminary statistical analysis of the international ... › system › files › Annex II... ·...

Preliminary statistical analysis of
the international eventing
results 2014
Madrid 23/1/15
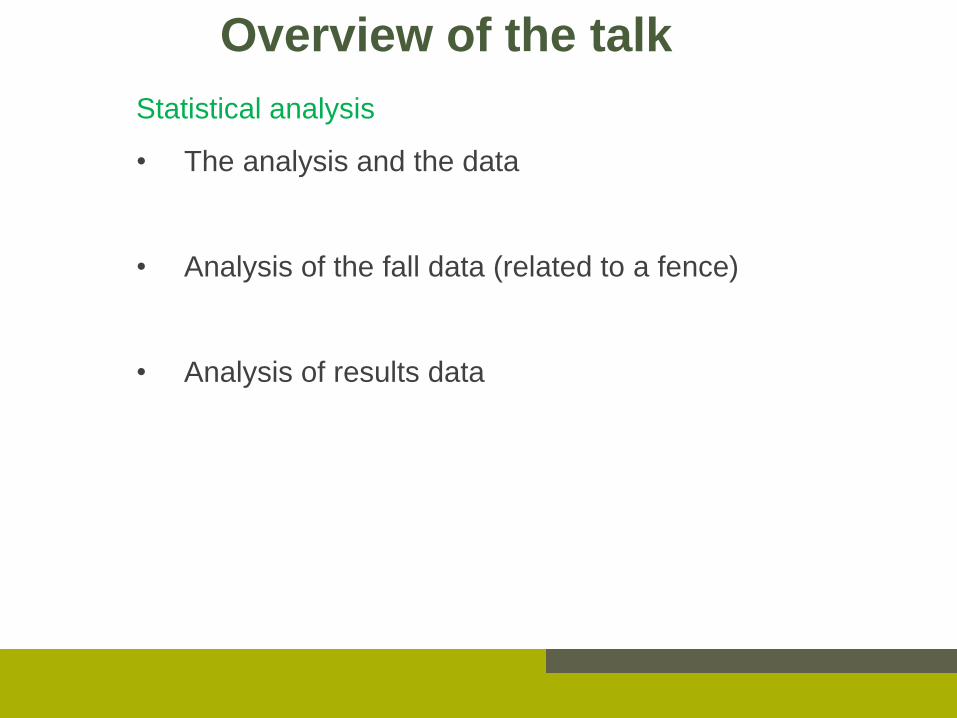
Overview of the talk
Statistical analysis
• The analysis and the data
• Analysis of the fall data (related to a fence)
• Analysis of results data

What are the factors that on their own and as a combination are correlated with
good results, Refusals, EL, Horse Fall, Unseated Rider ?
Age of horse and rider, barely qualified, previous results, competing at
international level since when, average number of successful / unsuccessful
competitions per year at that level, number of competition as a combination, …
Are there parameters that significantly alter the probability of a fall?
1. The questions addressed in this analysis
Homework: questions / interesting points raised during the seminar
Possibility to distinguish XC profiles??

The major steps in a statistical analysis
• Define the interesting questions and factors, that might affect risk
• Query the FEI database and compose file with data
• Encode data for statistical analysis
• Perform the analysis
• Interpretation of the results

Giuseppe’s slide

Excel file with data on each international starter 161 000 rows
and 650 columns
2. The data file
Profile of rider:
age
# different horses
# starts 1*, 2*, 3*, 4*
# MER 1*, 2*, 3*, 4*
Profile horse:
age
# different horses
# starts 1*, 2*, 3*, 4*
# MER 1*, 2*, 3*, 4*
Multidimensional
highly correlated
dataset
Low dimensional
uncorrelated
datasetPCA, FA
Profile of competition
CCI or CIC
Star-level
SJ before XC
Speed
Distance
Result
Dressage: pen
XC: pen, EL (R, Fall) RET,WD
SJ: pen, EL, RET,WD
Profile of fall
38 columns
977 rows
Identifications, Date,
Officials, …
File: 2004-2014 but focus on 2014

Fall analysis
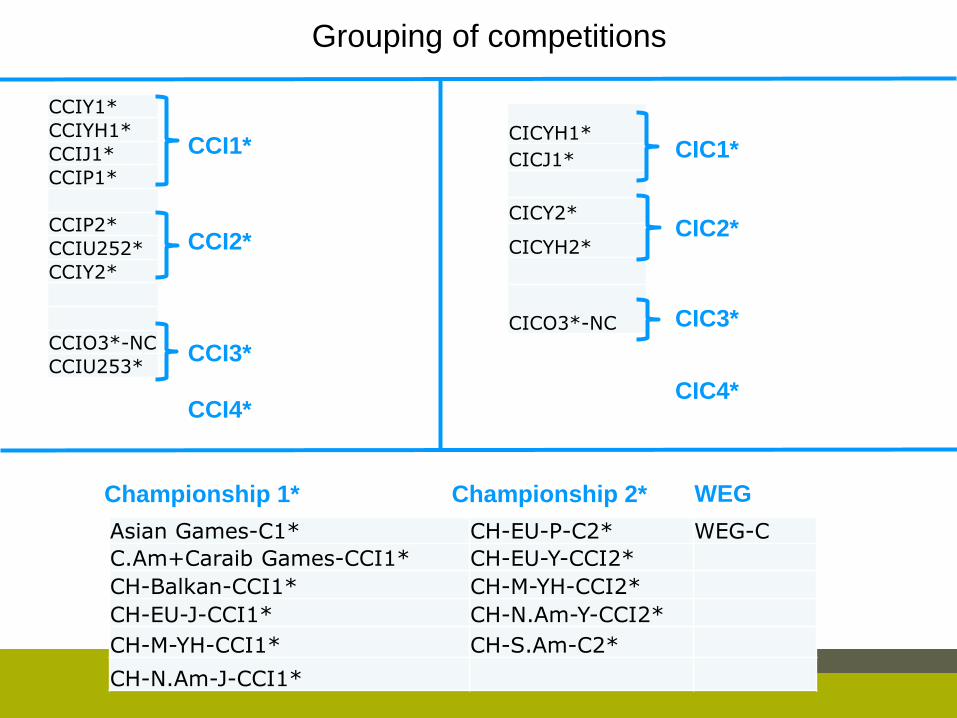
Grouping of competitions
CCIY1*
CCIYH1*
CCIJ1*
CCIP1*
CCIP2*
CCIU252*
CCIY2*
CCIO3*-NC
CCIU253*
CICYH1*
CICJ1*
CICY2*
CICYH2*
CICO3*-NC
CCI1*
CCI2*
CCI3*
CCI4*
CIC1*
CIC2*
CIC3*
CIC4*
Asian Games-C1* CH-EU-P-C2* WEG-C
C.Am+Caraib Games-CCI1* CH-EU-Y-CCI2*
CH-Balkan-CCI1* CH-M-YH-CCI2*
CH-EU-J-CCI1* CH-N.Am-Y-CCI2*
CH-M-YH-CCI1* CH-S.Am-C2*
CH-N.Am-J-CCI1*
Championship 1* Championship 2* WEG
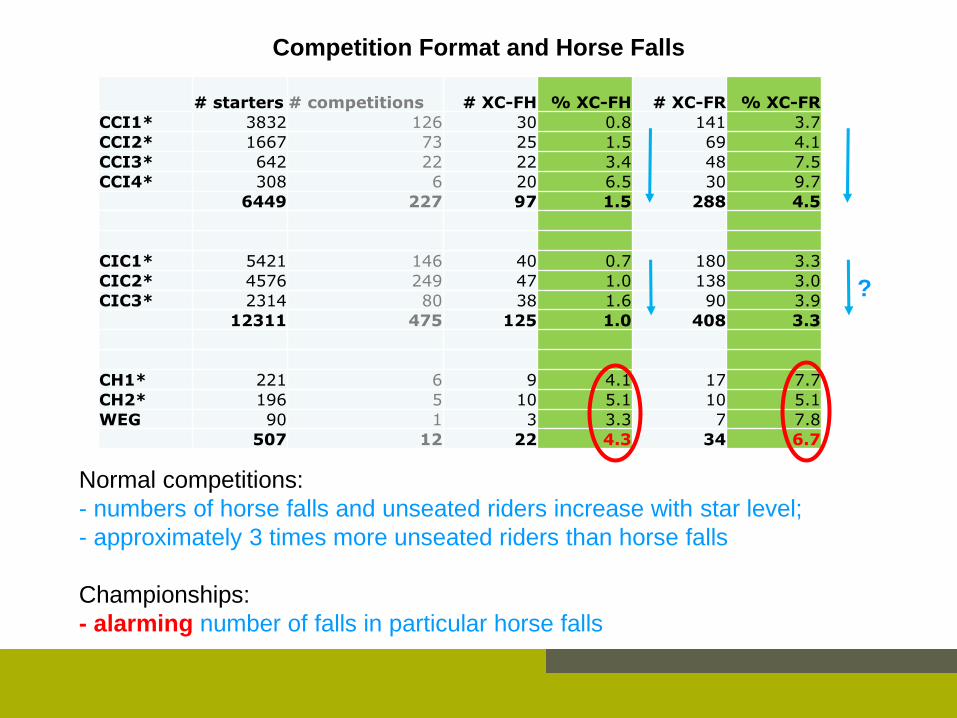
# starters # competitions # XC-FH % XC-FH # XC-FR % XC-FR
CCI1* 3832 126 30 0.8 141 3.7
CCI2* 1667 73 25 1.5 69 4.1
CCI3* 642 22 22 3.4 48 7.5
CCI4* 308 6 20 6.5 30 9.7
6449 227 97 1.5 288 4.5
CIC1* 5421 146 40 0.7 180 3.3
CIC2* 4576 249 47 1.0 138 3.0
CIC3* 2314 80 38 1.6 90 3.9
12311 475 125 1.0 408 3.3
CH1* 221 6 9 4.1 17 7.7
CH2* 196 5 10 5.1 10 5.1
WEG 90 1 3 3.3 7 7.8
507 12 22 4.3 34 6.7
Competition Format and Horse Falls
?
Normal competitions:
- numbers of horse falls and unseated riders increase with star level;
- approximately 3 times more unseated riders than horse falls
Championships:
- alarming number of falls in particular horse falls
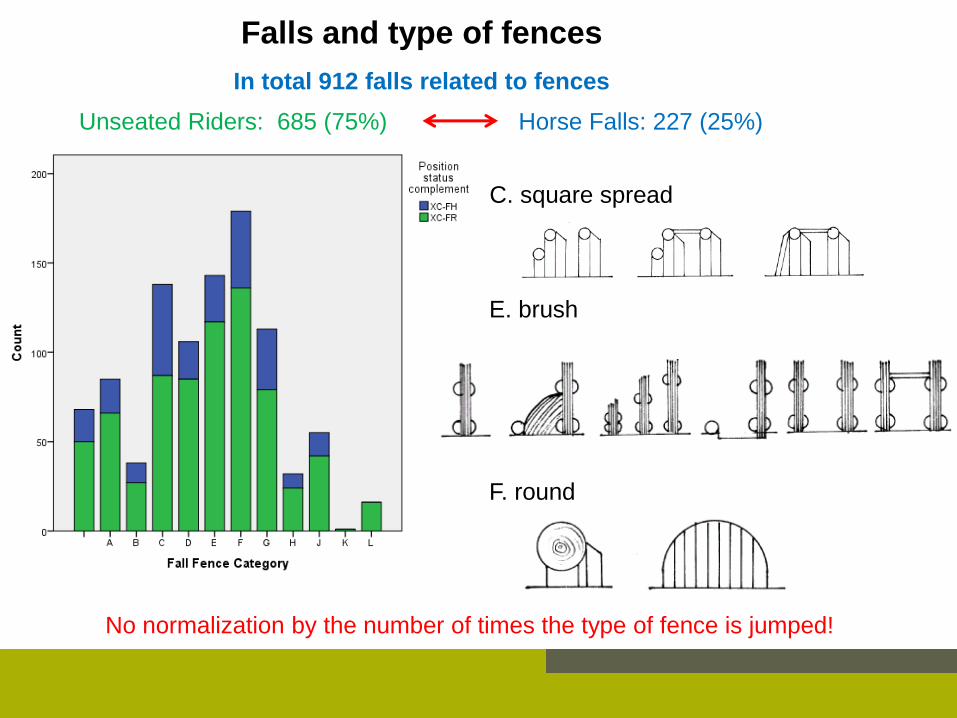
Falls and type of fences
No normalization by the number of times the type of fence is jumped!
C. square spread
E. brush
F. round
In total 912 falls related to fences
Unseated Riders: 685 (75%) Horse Falls: 227 (25%)
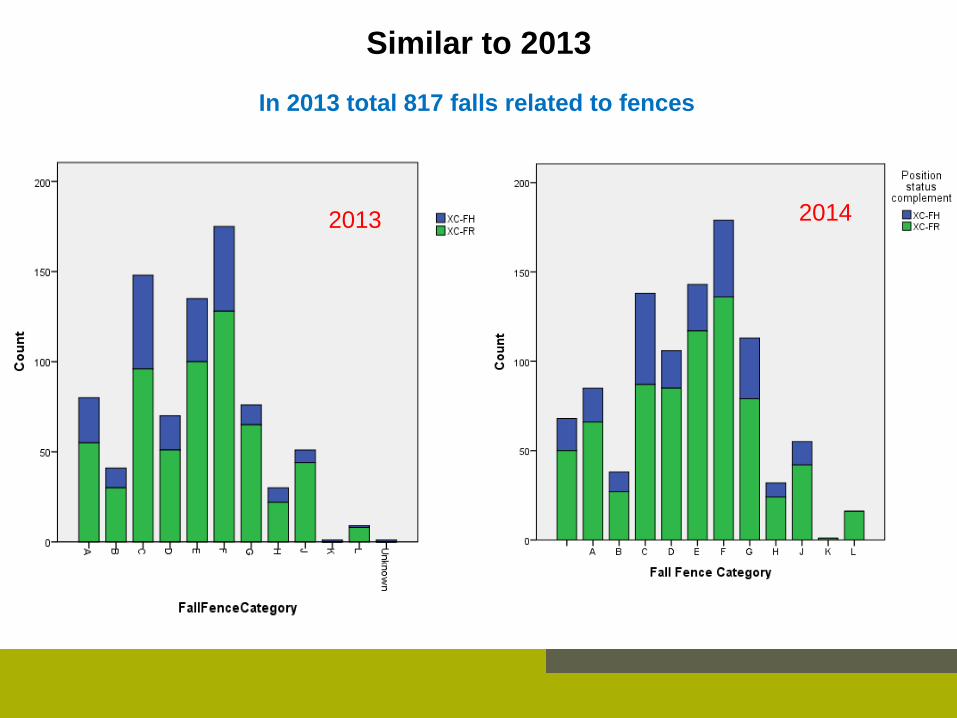
Similar to 2013
In 2013 total 817 falls related to fences
2013 2014
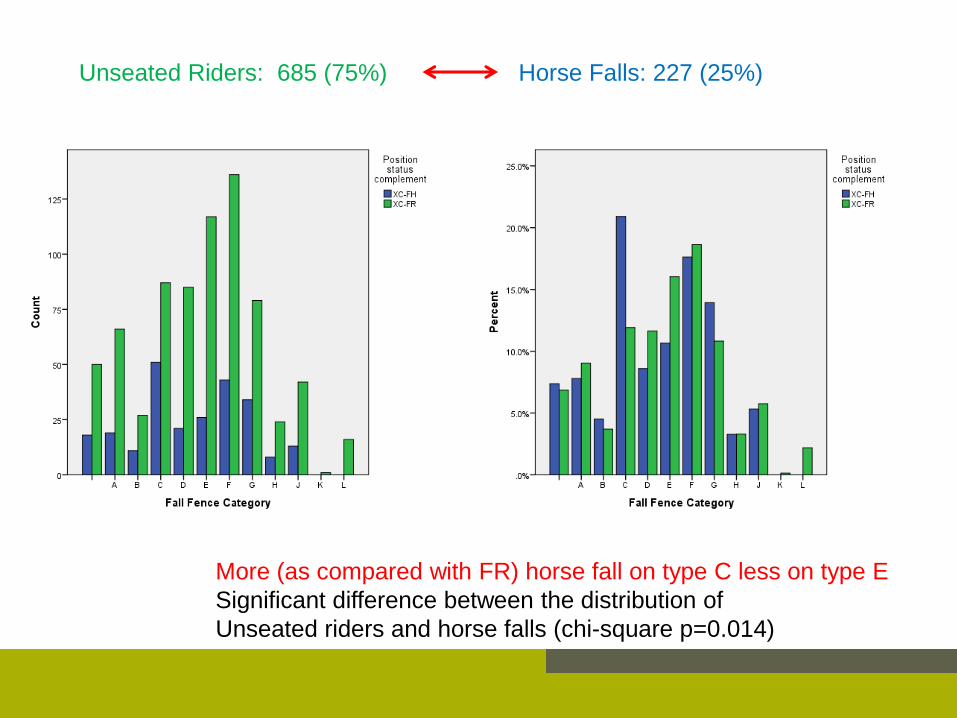
More (as compared with FR) horse fall on type C less on type E
Significant difference between the distribution of
Unseated riders and horse falls (chi-square p=0.014)
Unseated Riders: 685 (75%) Horse Falls: 227 (25%)
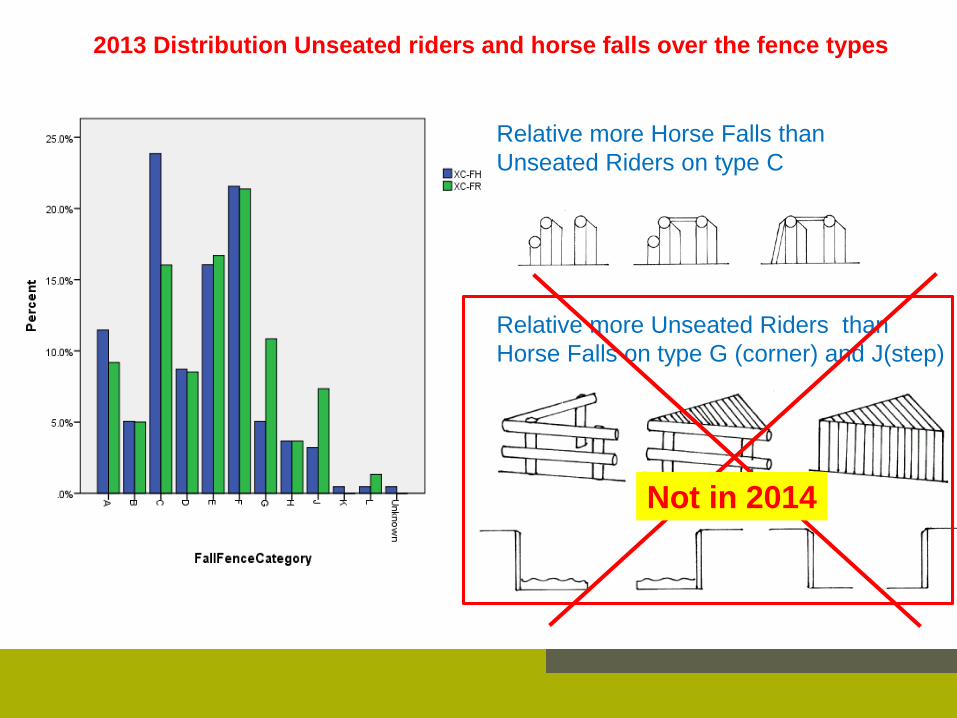
2013 Distribution Unseated riders and horse falls over the fence types
Relative more Horse Falls than
Unseated Riders on type C
Relative more Unseated Riders than
Horse Falls on type G (corner) and J(step)
Not in 2014
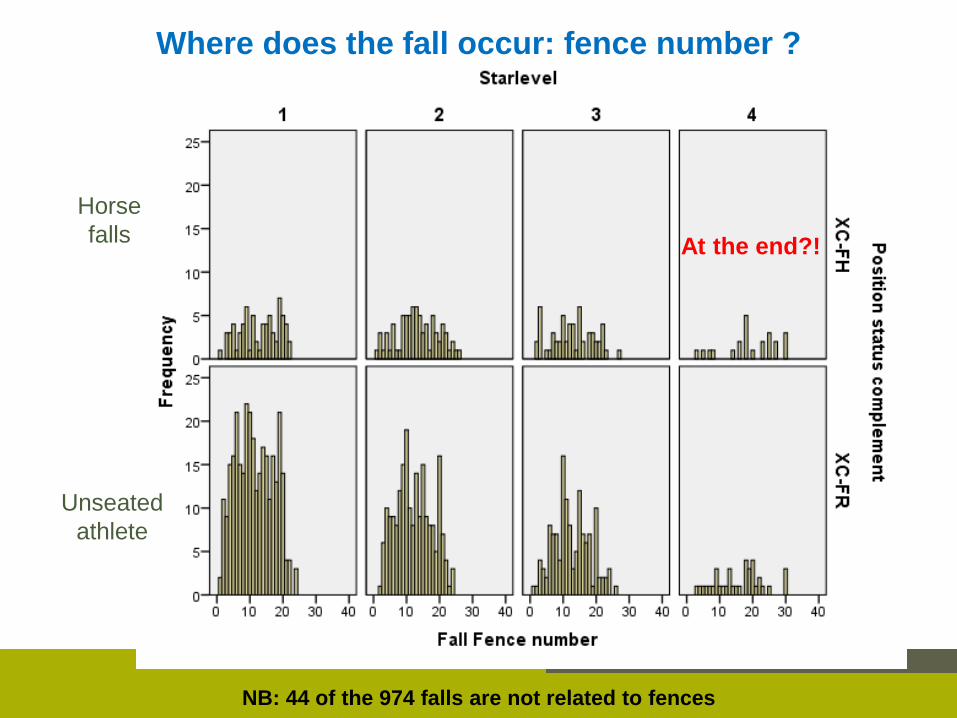
At the end?!
Horse
falls
Unseated
athlete
NB: 44 of the 974 falls are not related to fences
Where does the fall occur: fence number ?
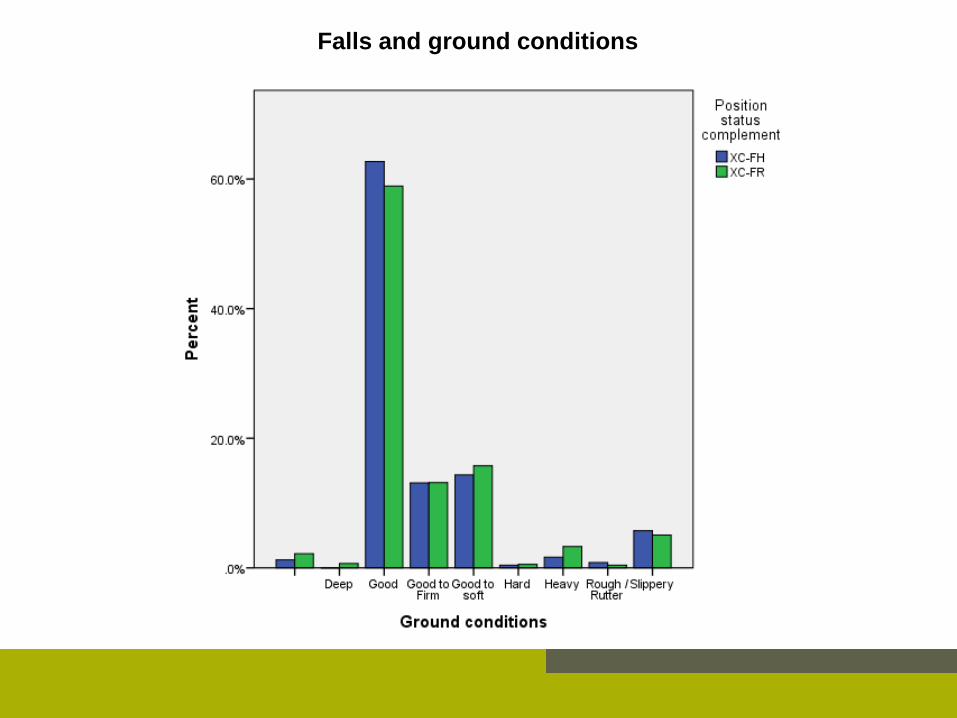
Falls and ground conditions

FALSE TRUE valid
Combination 370 542 912
Fence Type
Option 901 11 912
Frangible 841 71 912
Portable 477 435 912
Related to water 728 246 974
Terrain 443 531 974
Ground Line 196 716 912
Off a Bend 629 345 974
Air Jacket worn 303 545 848
Air Jacket activated 452 504 956
Frangible break 5
Horse fell or tread on Rider 923 33 956
Accident Type 661 295 956
Horse slipped? 883 73 956
Wind 839 117 956
Poor Visibility 949 7 956
Horse refused? 674 238 912
Horse hit Fence? 411 563 974
Horse tipped portable? 4
Horse broke fence? 880 32 912
Horse somersaulted? 880 32 912
Inexperience 624 350 974
Rider fatigue 953 3 956
Horse out of control 937 19 956
Horse too fast 851 105 956
Horse too slow 887 69 956
Light situation 905 39 944
Horse impaired by health 953 3 956
Horse fatigued 936 20 956
Horse distracted 945 11 956
Other fall characteristics: frequencies of individual parameters

Component
1 2 3 4 5
Fall Fence Combination 0.513
Fall Fence Portable -0.572
Fall Fence Related to water 0.457
Fall Fence Ground line -0.341
Fall Fence Off a bend 0.468 -0.463
Did horse fall on or tread on athlete
Did the horse slip
Injury level 0.421 -0.316
Did horse refuse -0.548 0.364
Did horse hit the fence 0.684
Did horse break the fence 0.448
Did horse somersault 0.345
Inexperience 0.435
Athlete impaired by fatigue
Horse out of control -0.527
Horse too fast -0.524 0.444
Horse too slow 0.384 0.565
Horse fatigued
Horse distracted 0.346
Four (to 5) possible classes of falls related to a fence
NB: falls not related to fence are not included in this analysis
Falls in relation to other results
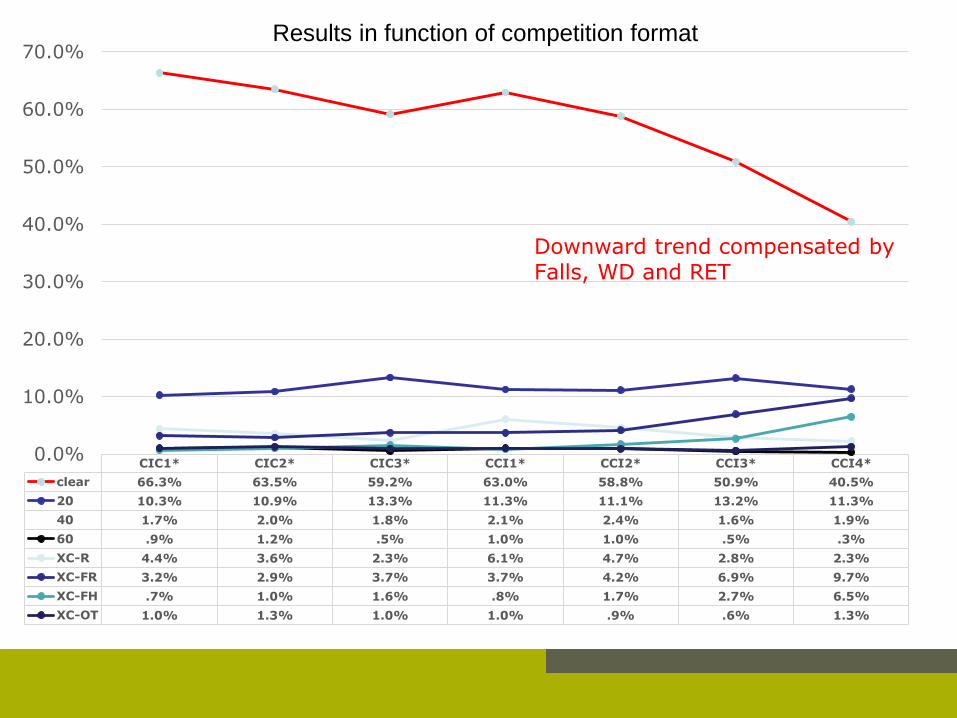
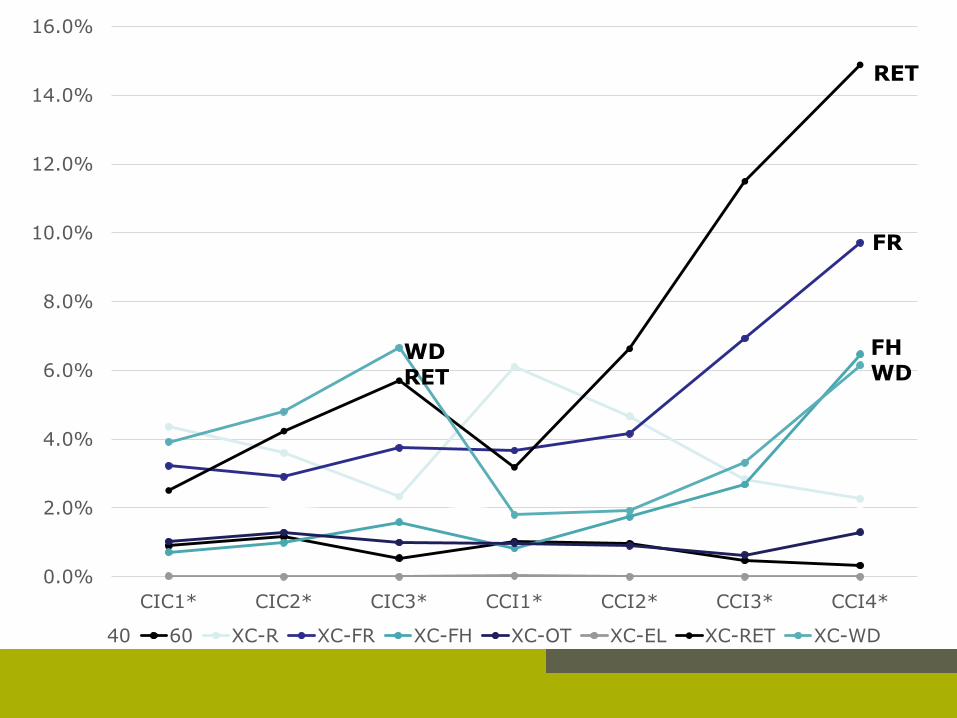
CIC1* CIC2* CIC3* CCI1* CCI2* CCI3* CCI4*
clear 66.3% 63.5% 59.2% 63.0% 58.8% 50.9% 40.5%
20 10.3% 10.9% 13.3% 11.3% 11.1% 13.2% 11.3%
40 1.7% 2.0% 1.8% 2.1% 2.4% 1.6% 1.9%
60 .9% 1.2% .5% 1.0% 1.0% .5% .3%
XC-R 4.4% 3.6% 2.3% 6.1% 4.7% 2.8% 2.3%
XC-FR 3.2% 2.9% 3.7% 3.7% 4.2% 6.9% 9.7%
XC-FH .7% 1.0% 1.6% .8% 1.7% 2.7% 6.5%
XC-OT 1.0% 1.3% 1.0% 1.0% .9% .6% 1.3%
0.0%
10.0%
20.0%
30.0%
40.0%
50.0%
60.0%
70.0%
Downward trend compensated by Falls, WD and RET
Results in function of competition format
0.0%
2.0%
4.0%
6.0%
8.0%
10.0%
12.0%
14.0%
16.0%
CIC1* CIC2* CIC3* CCI1* CCI2* CCI3* CCI4*
40 60 XC-R XC-FR XC-FH XC-OT XC-EL XC-RET XC-WD
RET
FHWD
FR
WDRET
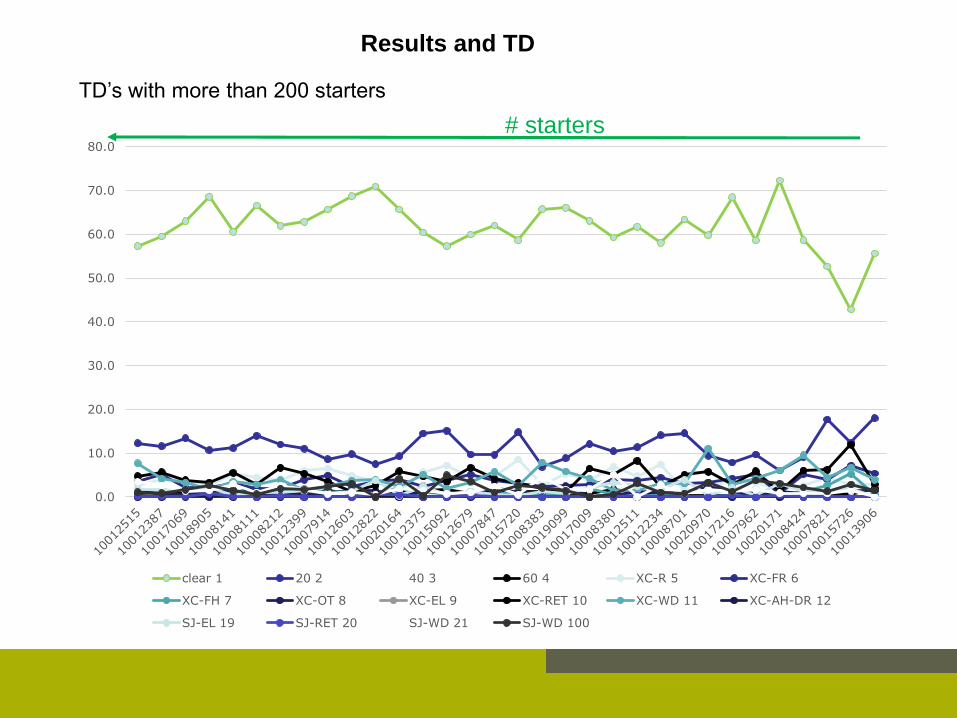
TD’s with more than 200 starters
Results and TD
0.0
10.0
20.0
30.0
40.0
50.0
60.0
70.0
80.0
clear 1 20 2 40 3 60 4 XC-R 5 XC-FR 6
XC-FH 7 XC-OT 8 XC-EL 9 XC-RET 10 XC-WD 11 XC-AH-DR 12
SJ-EL 19 SJ-RET 20 SJ-WD 21 SJ-WD 100
# starters

TD’s with more than 200 starters
Falls and TD
# starters
0.0
1.0
2.0
3.0
4.0
5.0
6.0
7.0
8.0
XC-FR 6 XC-FH 7
118 of 210 CCI4*

CD’s with more than 300 starters
Results and CD
# starters
0.0
10.0
20.0
30.0
40.0
50.0
60.0
70.0
80.0
clear 20 40 60 XC-R XC-FR
XC-FH XC-OT XC-EL XC-RET XC-WD XC-AH-DR
SJ-EL SJ-RET SJ-WD rest
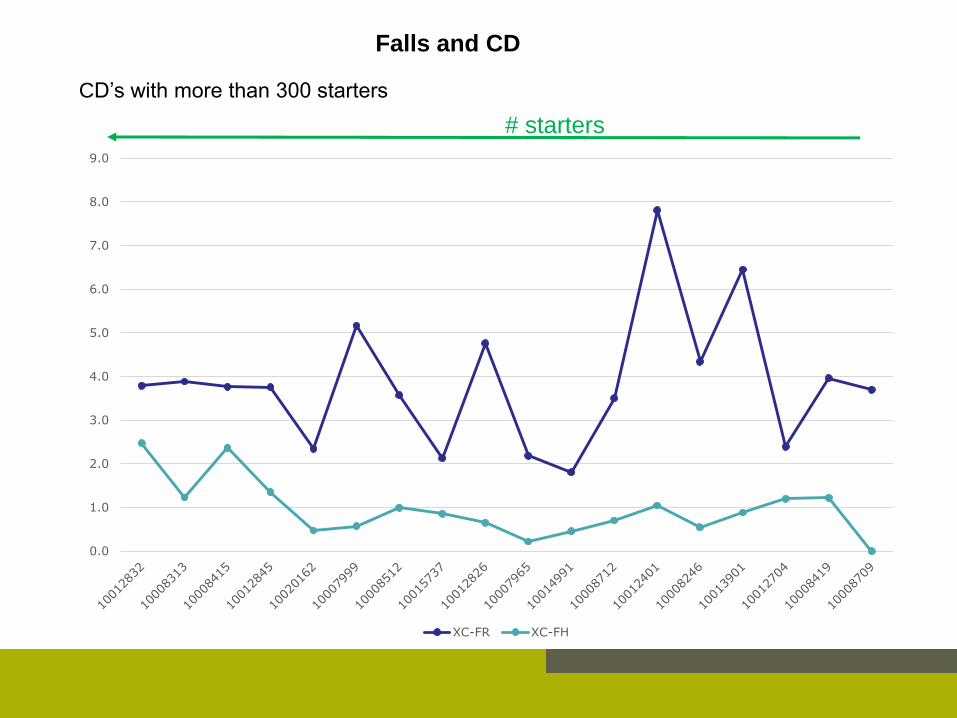
CD’s with more than 300 starters
Falls and CD
# starters
0.0
1.0
2.0
3.0
4.0
5.0
6.0
7.0
8.0
9.0
XC-FR XC-FH
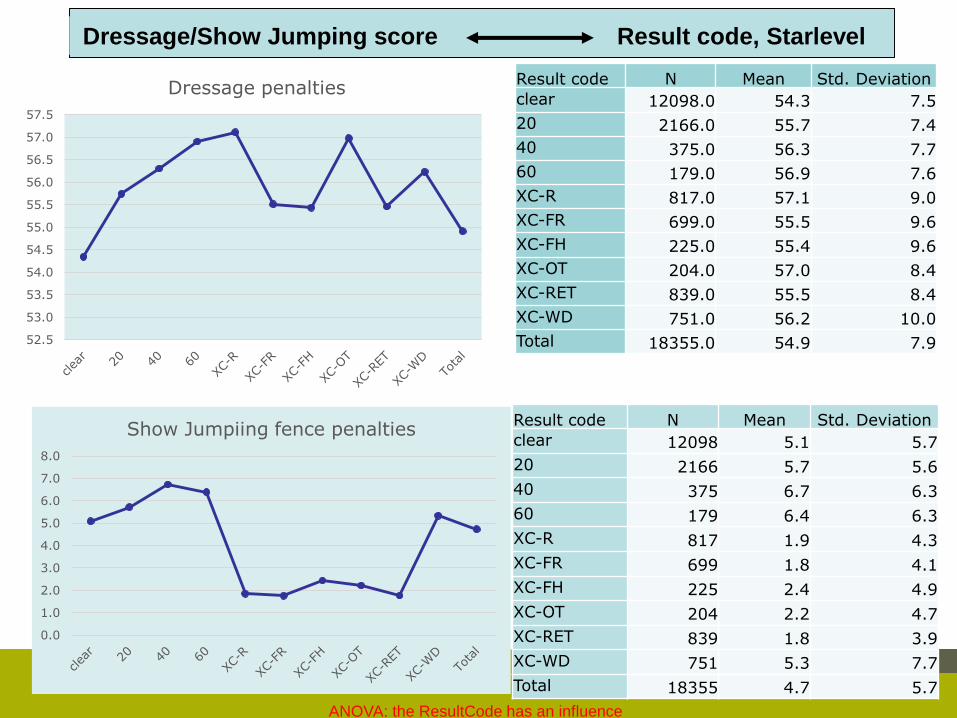
ANOVA: the ResultCode has an influence
Dressage/Show Jumping score Result code, Starlevel
Result code N Mean Std. Deviation
clear 12098.0 54.3 7.5
20 2166.0 55.7 7.4
40 375.0 56.3 7.7
60 179.0 56.9 7.6
XC-R 817.0 57.1 9.0
XC-FR 699.0 55.5 9.6
XC-FH 225.0 55.4 9.6
XC-OT 204.0 57.0 8.4
XC-RET 839.0 55.5 8.4
XC-WD 751.0 56.2 10.0
Total 18355.0 54.9 7.952.5
53.0
53.5
54.0
54.5
55.0
55.5
56.0
56.5
57.0
57.5
Dressage penalties
Result code N Mean Std. Deviation
clear 12098 5.1 5.7
20 2166 5.7 5.6
40 375 6.7 6.3
60 179 6.4 6.3
XC-R 817 1.9 4.3
XC-FR 699 1.8 4.1
XC-FH 225 2.4 4.9
XC-OT 204 2.2 4.7
XC-RET 839 1.8 3.9
XC-WD 751 5.3 7.7
Total 18355 4.7 5.7
0.0
1.0
2.0
3.0
4.0
5.0
6.0
7.0
8.0
Show Jumpiing fence penalties
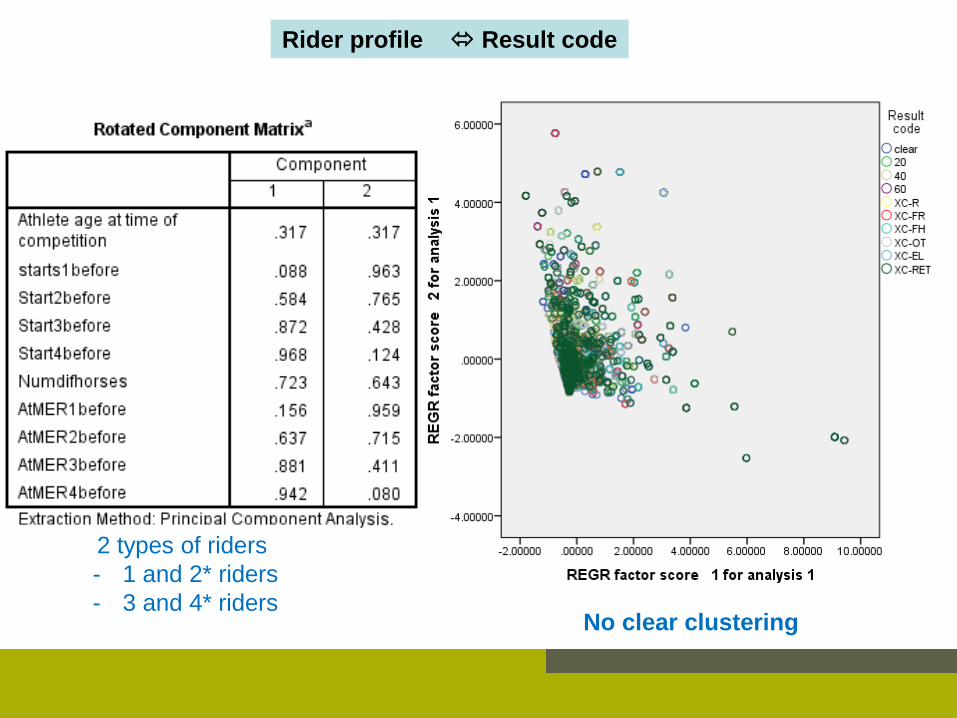
Rider profile Result code
2 types of riders
- 1 and 2* riders
- 3 and 4* ridersNo clear clustering
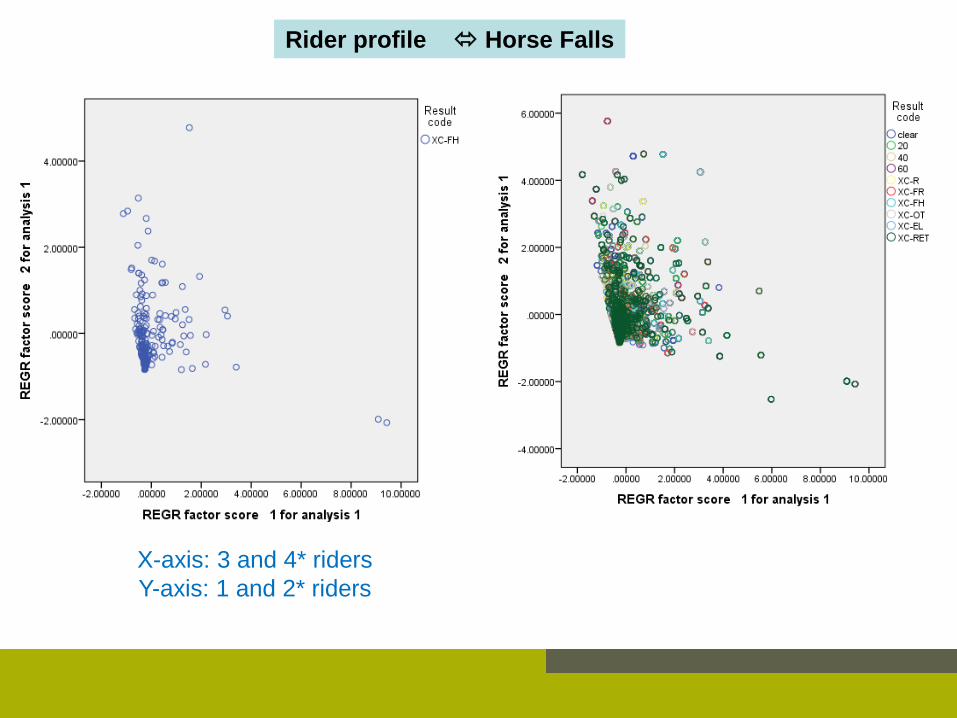
Rider profile Horse Falls
X-axis: 3 and 4* riders
Y-axis: 1 and 2* riders
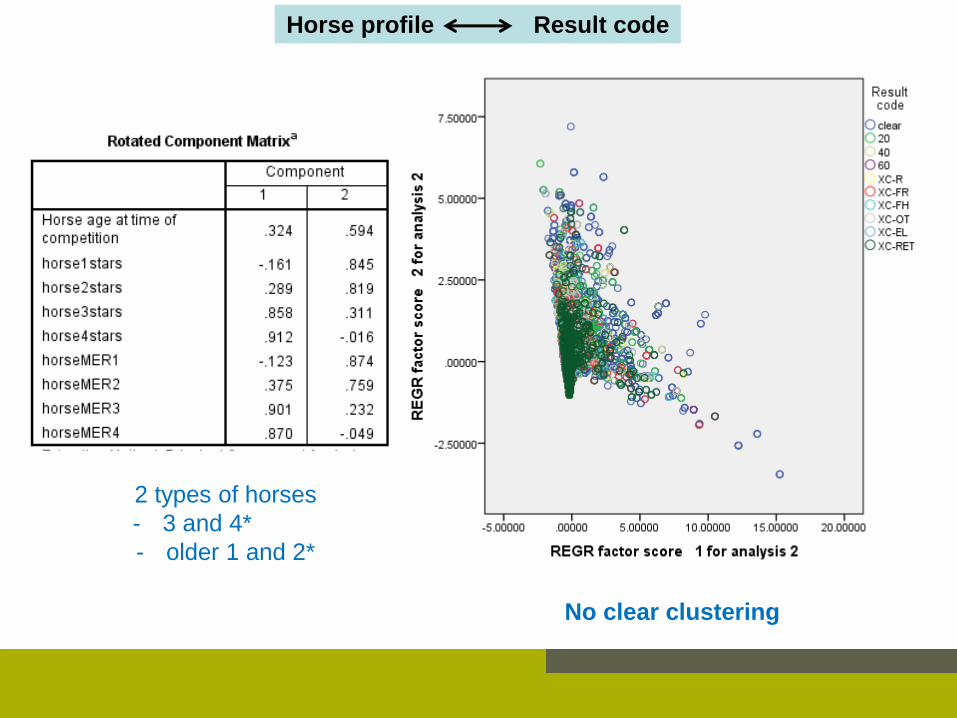
Horse profileHorse profile Result code
2 types of horses
- 3 and 4*
- older 1 and 2*
No clear clustering

Horse profileHorse profile Horse Faslls
X-axis: 3 and 4* riders
Y-axis: 1 and 2* riders
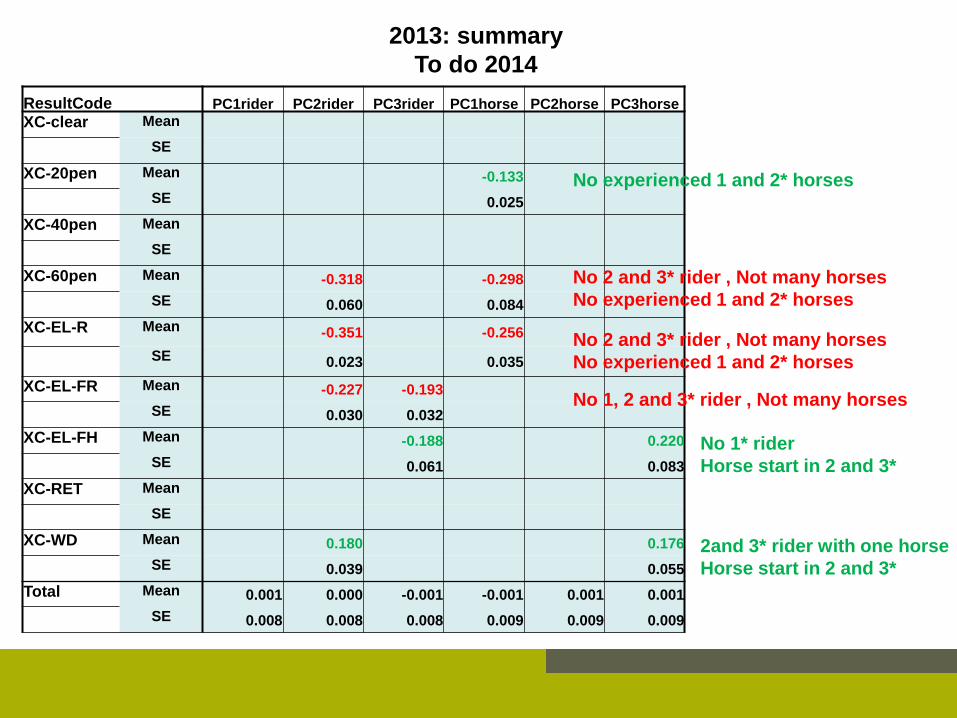
ResultCode PC1rider PC2rider PC3rider PC1horse PC2horse PC3horse
XC-clear Mean
SE
XC-20pen Mean -0.133
SE 0.025
XC-40pen Mean
SE
XC-60pen Mean -0.318 -0.298
SE 0.060 0.084
XC-EL-R Mean -0.351 -0.256
SE 0.023 0.035
XC-EL-FR Mean -0.227 -0.193
SE 0.030 0.032
XC-EL-FH Mean -0.188 0.220
SE 0.061 0.083
XC-RET Mean
SE
XC-WD Mean 0.180 0.176
SE 0.039 0.055
Total Mean 0.001 0.000 -0.001 -0.001 0.001 0.001
SE 0.008 0.008 0.008 0.009 0.009 0.009
No experienced 1 and 2* horses
No 2 and 3* rider , Not many horses
No experienced 1 and 2* horses
No 2 and 3* rider , Not many horses
No experienced 1 and 2* horses
No 1, 2 and 3* rider , Not many horses
No 1* rider
Horse start in 2 and 3*
2and 3* rider with one horse
Horse start in 2 and 3*
2013: summary
To do 2014
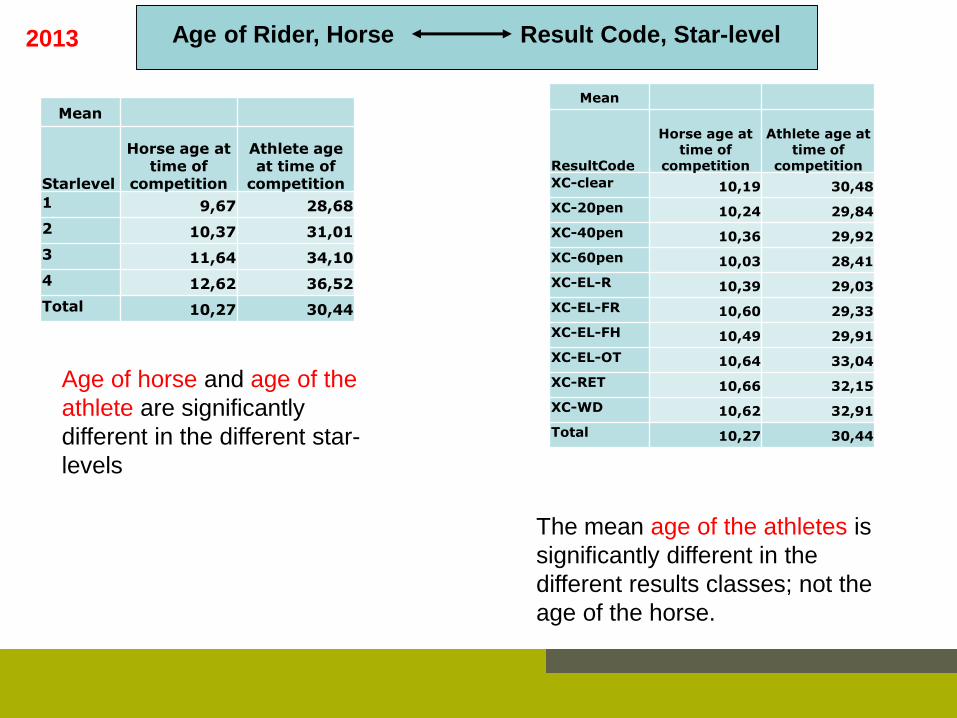
Age of Rider, Horse Result Code, Star-level
Mean
Starlevel
Horse age at time of
competition
Athlete age at time of
competition
1 9,67 28,68
2 10,37 31,01
3 11,64 34,10
4 12,62 36,52
Total 10,27 30,44
Mean
ResultCode
Horse age at time of
competition
Athlete age at time of
competition
XC-clear 10,19 30,48
XC-20pen 10,24 29,84
XC-40pen 10,36 29,92
XC-60pen 10,03 28,41
XC-EL-R 10,39 29,03
XC-EL-FR 10,60 29,33
XC-EL-FH 10,49 29,91
XC-EL-OT 10,64 33,04
XC-RET 10,66 32,15
XC-WD 10,62 32,91
Total 10,27 30,44
Age of horse and age of the
athlete are significantly
different in the different star-
levels
The mean age of the athletes is
significantly different in the
different results classes; not the
age of the horse.
2013

Gender analysis
Significantly more women in CIC1* No difference in results
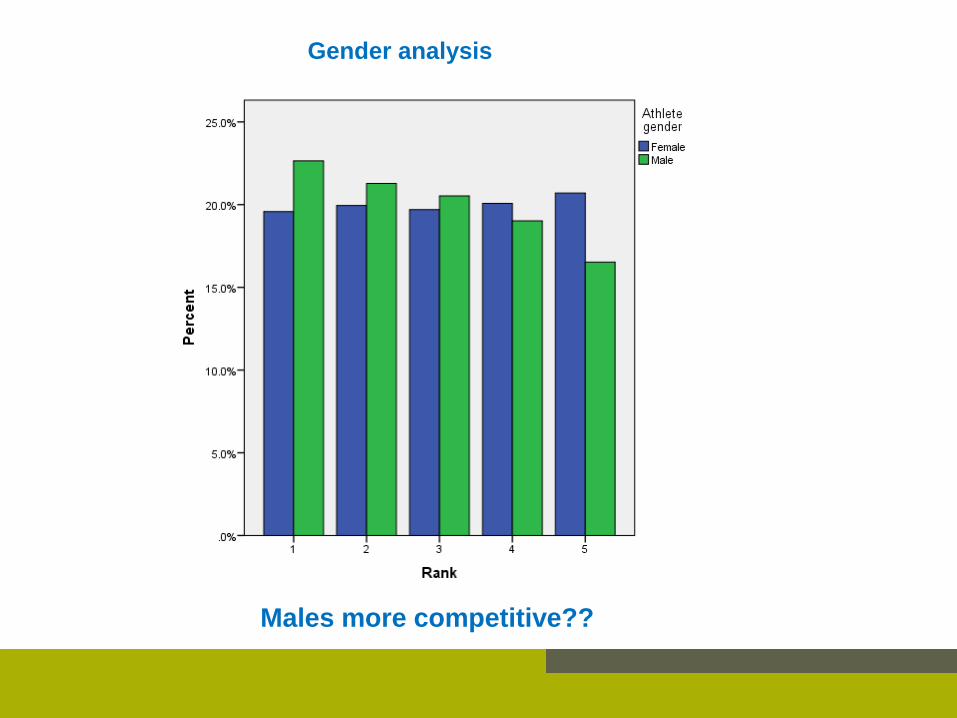
Gender analysis
Males more competitive??

Acknowledgements
FEI-eventing department: Giuseppe, Catrin, Nathalie
FEI-IT department: Jérôme Begey


![Forest Hills Dayflower Wrap - Cascade Yarns · flower Motif] x 2, k1. Rows 3-16: Work as Rows 1-2, working Dayflower Motif Rows 3-16. Repeat Rows 1 - 16 29 more times, or until wrap](https://static.fdocuments.us/doc/165x107/5edb252e210a9a20dc49b279/forest-hills-dayflower-wrap-cascade-flower-motif-x-2-k1-rows-3-16-work-as.jpg)