PRELIMINARY RESULTS OF USING SENTINEL-1 SAR...
17
European Journal of Geography Volume 6, Number 3:52 -68, September 2015 ©Association of European Geographers European Journal of Geography-ISSN 1792-1341 © All rights reserved 52 PRELIMINARY RESULTS OF USING SENTINEL-1 SAR DATA FOR DSM GENERATION Konstantinos NIKOLAKOPOULOS University of Patras, Department of Geology, Rio, Patras, Greece [email protected] Aggeliki KYRIOU University of Patras, Department of Geology, , Rio, Patras, Greece [email protected] Abstract Digital Surface Model (DSM) generation can be achieved through radar interferometry, utilizing the phase difference between the representations of the interferometric pairs. Interferometry is a widely used height information acquisition technique for large areas. Sentinel-1 continues the C-band SAR Earth Observation heritage of the European Space Agency satellites like ERS-1, ERS-2 and ENVISAT. This paper discusses DSM generation utilizing Sentinel-1 radar data through interferometric process in two different study areas in Greece. DSMs generated from Sentinel-1 data were analyzed and compared to freely available DSMs like ASTER GDEM and SRTM DEM, to DSMs created from optical remote sensing data and to DEMs created from digitized contours from the 1/50.000 topographic maps. The influence of the interferometric pairs baseline and the role of the different tracks to the DSM vertical accuracy was examined. Points of known elevation have been used to estimate the accuracy of the DSMs. 2D RMSE, correlation and the percentile value were computed and the results are presented. Keywords: interferometry, Sentinel-1, DSM generation, accuracy 1. INTRODUCTION In the nineties, the theoretical part of SAR interferometry was well understood, whereas the software task was still investigated due to developing problems during the interferometric processing and failure generating high precision Digital Elevation Models (DEM) (Gens & Van Genderen, 1996). Interferometric technique has a wide variety of applications such as topographic mapping, digital elevation modeling, classification of land surfaces, volcanic hazards and seismic events, as well as land subsidence monitoring. Land subsidence monitoring utilizing SAR data from ERS satellites, took place in Germany, Mexico and Italy, aiming to represent deformations (Strozzi T. et al., 2001). In addition, deformation monitoring using InSAR technique
Transcript of PRELIMINARY RESULTS OF USING SENTINEL-1 SAR...

European Journal of Geography Volume 6, Number 3:52 -68, September 2015 ©Association of European Geographers
European Journal of Geography-ISSN 1792-1341 © All rights reserved 52
PRELIMINARY RESULTS OF USING SENTINEL-1 SAR DATA FOR DSM GENERATION
Konstantinos NIKOLAKOPOULOS University of Patras, Department of Geology, Rio, Patras, Greece
Aggeliki KYRIOU University of Patras, Department of Geology, , Rio, Patras, Greece
Abstract
Digital Surface Model (DSM) generation can be achieved through radar interferometry, utilizing the phase difference between the representations of the interferometric pairs. Interferometry is a widely used height information acquisition technique for large areas. Sentinel-1 continues the C-band SAR Earth Observation heritage of the European Space Agency satellites like ERS-1, ERS-2 and ENVISAT. This paper discusses DSM generation utilizing Sentinel-1 radar data through interferometric process in two different study areas in Greece. DSMs generated from Sentinel-1 data were analyzed and compared to freely available DSMs like ASTER GDEM and SRTM DEM, to DSMs created from optical remote sensing data and to DEMs created from digitized contours from the 1/50.000 topographic maps. The influence of the interferometric pairs baseline and the role of the different tracks to the DSM vertical accuracy was examined. Points of known elevation have been used to estimate the accuracy of the DSMs. 2D RMSE, correlation and the percentile value were computed and the results are presented.
Keywords: interferometry, Sentinel-1, DSM generation, accuracy
1. INTRODUCTION
In the nineties, the theoretical part of SAR interferometry was well understood, whereas the software task was still investigated due to developing problems during the interferometric processing and failure generating high precision Digital Elevation Models (DEM) (Gens & Van Genderen, 1996). Interferometric technique has a wide variety of applications such as topographic mapping, digital elevation modeling, classification of land surfaces, volcanic hazards and seismic events, as well as land subsidence monitoring. Land subsidence monitoring utilizing SAR data from ERS satellites, took place in Germany, Mexico and Italy, aiming to represent deformations (Strozzi T. et al., 2001). In addition, deformation monitoring using InSAR technique

Nikolakopoulos K.& Kyriou A. / European Journal of Geography 6 3 52–68 (2015)
European Journal of Geography-ISSN 1792-1341 © All rights reserved 53
was applied in a Czech area, using ERS, Envisat ASAR data and a limited set of high resolution TerraSAR-X data (Lazecký M. et al., 2014).
Concerning digital elevation modeling, there are several studies involved with extraction DEM using interferometry and seeking the accuracy of the results. The development of satellites systems and their constantly improved resolution capacity, combined with the increasingly accurate results of the interferometric processing. First attempts take place with interferometric data from the ERS-1/ ERS-2 missions, focusing on land deformation measurement (Gens & Van Genderen, 1996). Furthermore, ERS SAR image pairs were utilized to generate DEM, which was compared with a reference DEM and the results showed that DEM quality was directly related to image coherence (Crosetto & Crippa, 2000). In a similar study, images provided by ERS, were taken in order to generate an interferometric DEM using DORIS software (Geymen, 2012). Particularly, DEM extracted by interferommetric approach, were compared with DEMs of photogrammetric survey, proving that the accuracy of interferometric DEM was related on local surface features and high-precision elevation models were still a goal. A view to achieve the aim of accuracy, an another approach was occurred, claiming that external DEMs during InSAR DEM generation could confine the errors in interferometric processing (Chunxia et al., 2005). Subsequently, in another study, the main analysis proceedings of differential SAR interferometry were presented using spaceborne data by ERS-1, ERS-2, ASAR-Envisat, TerraSAR-X and Cosmo-Skymed sensors, revealing the growing experience on interferometric technique (Crosetto et al., 2011).
Specifically, most of the results demonstrated the validation of DInSAR analysis proceedings, especially these that were acquired by TerraSAR-X and Cosmo-Skymed sensors (Sefercik et al., 2013), (Jiang et al., 2014). In a relative study, SAR pairs were derived from Cosmo-Skymed and they were processed for the production of a DEM, aiming to inspect the accuracy of the final product and investigated the decreasing of atmospheric artifacts, which associated with the interferometric phase (Nitti et al., 2013).
In addition, high quality digital elevation models are extracted by high resolution TerraSAR-X data, covering Barcelona area, Spain and the final results appear a quite good coherent with the local topography (Sefercik U.G. et al., 2012). Furthermore, another study utilized TerraSAR-X data, covering Berlin area, was focused on the influence of temporal baseline at the vertical absolute accuracy of the created DSM (Sefercik U.G. & Soergel U., 2014). The newer Sentinel-1 mission provides immediately SAR pairs due to short revisit cycle. Owing to that, mission offers high resolution images covering wide areas and therefore precise DEM, as well as timely data (Russi et al., 2012).
The specific study presents some preliminary results of using of Sentinel-1 SAR data for DSM creation using interferometric techniques. Particular emphasis has been given to the influence that may occur to the vertical accuracy of the DSMs due to the interferometric pairs baseline increase or due to different tracks. DSMs from high resolution remote sensing data, airphotos, freely available elevation data, and topographic maps have been used in order to assess the vertical accuracy of the Sentinel-1 derived products. The remainder of the current paper is structured as follows. In the next section the study areas and the available data are described. In section 3 the results are reported. Section 4 contains a discussion on the results and finally in section 5 the conclusions are presented.

Nikolakopoulos K.& Kyriou A. / European Journal of Geography 6 3 52–68 (2015)
European Journal of Geography-ISSN 1792-1341 © All rights reserved 54
2. DATA AND STUDY AREAS
Two Greek Islands, Mykonos and Lesvos (figure 1) were selected in order to perform the evaluation of the vertical accuracy of DSMs created from Sentinel-1 data.
2.1 Mykonos area
Mykonos island belongs to the Cyclades complex and its capital, Chora is located on the western side of the island. Mykonos covers an area of 86,125 sq. km and it has a coastline of 89 km. The relief of the island is mostly rocky and slightly smooth with two mountains the Anomeritis (east) and Vorniotis (north). The highest peak of the mountains is called the "Prophet Elias" and it reaches 375 m. Mykonos lacks forests and it is covered by sparse undergrowth.
2.1.1 Data sets
The DSM from the Sentinel data was compared to respective DSMs created from optical data like ALOS PRISM and airphotos and to a DEM created from digitized contours from the 1/50.000 topographic maps.
2.1.2 Sentinel-1 SAR data
In the case of Mykonos Island, interferometric process took place investigating how baseline affects the derived DSMs. Twenty-one interferometric pairs acquired from October 2014 till January 2015, were used in order to extract DSMs. The interferometric pairs were divided into two major classes (Table 1 and 2) accordingly to the baseline extent. The first group includes all the interferometric pairs independently of the baseline extent (Figure 2 upper part), while the second one contains only the small baseline pairs (Figure 2 lower part).
Table 1. All the Interferometric pairs independently of the baseline extent
1st image 2nd image Baseline (values in m)
1 IW_SLC__1SDV 19/10/2014 IW_SLC__1SDV 31/10/2014 175 2 IW_SLC__1SDV 19/10/2014 IW_SLC__1SDV 24/11/2014 525 3 IW_SLC__1SDV 19/10/2014 IW_SLC__1SDV 06/11/2014 700 4 IW_SLC__1SDV 19/10/2014 IW_SLC__1SDV 18/12/2014 875 5 IW_SLC__1SDV 19/10/2014 IW_SLC__1SDV 30/12/2014 1050 6 IW_SLC__1SDV 19/10/2014 IW_SLC__1SDV 11/01/2015 1225 7 IW_SLC__1SDV 31/10/2014 IW_SLC__1SDV 24/11/2014 350 8 IW_SLC__1SDV 31/10/2014 IW_SLC__1SDV 06/11/2014 525 9 IW_SLC__1SDV 31/10/2014 IW_SLC__1SDV 18/12/2014 700 10 IW_SLC__1SDV 31/10/2014 IW_SLC__1SDV 30/12/2014 875 11 IW_SLC__1SDV 31/10/2014 IW_SLC__1SDV 11/01/2015 1050 12 IW_SLC__1SDV 24/11/2014 IW_SLC__1SDV 06/11/2014 175 13 IW_SLC__1SDV 24/11/2014 IW_SLC__1SDV 18/12/2014 350 14 IW_SLC__1SDV 24/11/2014 IW_SLC__1SDV 30/12/2014 525 15 IW_SLC__1SDV 24/11/2014 IW_SLC__1SDV 11/01/2015 700 16 IW_SLC__1SDV 06/11/2014 IW_SLC__1SDV 18/12/2014 175

Nikolakopoulos K.& Kyriou A. / European Journal of Geography 6 3 52–68 (2015)
European Journal of Geography-ISSN 1792-1341 © All rights reserved 55
17 IW_SLC__1SDV 06/11/2014 IW_SLC__1SDV 30/12/2014 350 18 IW_SLC__1SDV 06/11/2014 IW_SLC__1SDV 11/01/2015 525 19 IW_SLC__1SDV 18/12/2014 IW_SLC__1SDV 30/12/2014 175 20 IW_SLC__1SDV 18/12/2014 IW_SLC__1SDV 11/01/2015 350 21 IW_SLC__1SDV 30/12/2014 IW_SLC__1SDV 11/01/2015 175
Table 2. Interferometric pairs presenting small baseline
1st image 2nd image Baseline (values in
m)
1 IW_SLC__1SDV 19/10/2014 IW_SLC__1SDV 31/10/2014 175 2 IW_SLC__1SDV 31/10/2014 IW_SLC__1SDV 24/11/2014 350 3 IW_SLC__1SDV 24/11/2014 IW_SLC__1SDV 06/11/2014 175 4 IW_SLC__1SDV 24/11/2014 IW_SLC__1SDV 18/12/2014 350 5 IW_SLC__1SDV 06/11/2014 IW_SLC__1SDV 18/12/2014 175 6 IW_SLC__1SDV 06/11/2014 IW_SLC__1SDV 30/12/2014 350 7 IW_SLC__1SDV 18/12/2014 IW_SLC__1SDV 30/12/2014 175 8 IW_SLC__1SDV 18/12/2014 IW_SLC__1SDV 11/01/2015 350 9 IW_SLC__1SDV 30/12/2014 IW_SLC__1SDV 11/01/2015 175 Interferometric process creates a DSM for each interferometric pair. According to
Gens and Van Genderen (1996) there are several parameters that affect the final result of the interferometric process. The accuracy of the DEM achieved using only one interferometric pair is usually very low. In order to produce an accurate mosaic DEM, the fusion of multiple interferometric-based DEMs is applied. More information about the mosaic technique appeared in Choussiafis et. al. (2012) and Nikolakopoulos et. al. (2015).
Figure 1. The two study areas.

Nikolakopoulos K.& Kyriou A. / European Journal of Geography 6 3 52–68 (2015)
European Journal of Geography-ISSN 1792-1341 © All rights reserved 56
Figure 2. Sentinel-1 DSM independent baseline (upper part) and Sentinel-1 small baseline DSM (lower part).
2.1.3 ALOS PRISM DSM
ALOS satellite was launched in January 2006, in order to monitoring changes and natural disasters, mapping areas and surveying resources. It is equipped with three instruments, a panchromatic radiometer (PRISM), a visible and near-infrared radiometer (VNIR-2) and a synthetic aperture radar (PALSAR).
In this study, ALOS PRISM data were used. The PRISM sensor onboard ALOS contains three independent optical systems (radiometers) that allow for viewing in the Nadir direction, as well as forward and backward directions. This allows for the production of a stereoscopic image along the satellite’s track. Forward and backward radiometers are inclined + and – 23.8 degrees from nadir to realize a base-to-height ratio of one. PRISM data is collected in a single band (panchromatic) with a wavelength of 0.52 to 0.77 micrometers. The spatial resolution of PRISM is 2.5m (when viewing in the Nadir direction). Swath width of PRISM is 70km when viewing in the Nadir direction, and 35km when in triplet mode. According to Nikolakopoulos and Vaiopoulos (2010) ALOS stereopairs produce quite accurated DSMs. In general the ALOS DSM accuracy ranges between two and five pixels.

Nikolakopoulos K.& Kyriou A. / European Journal of Geography 6 3 52–68 (2015)
European Journal of Geography-ISSN 1792-1341 © All rights reserved 57
Figure 3. DSM from ALOS PRISM (forward-backward)
2.1.4 Hellenic Cadastre DSM
In order to compare the generated DSMs from Sentinel -1, a DSM created by Hellenic Cadastre was used. The specific DSM is created from high resolution airphotos with classical photogrammetric techniques. The DSM covering the area of Mykonos island is presented in Figure 4. The final DSM has a pixel size of 5m. The nominal vertical accuracy is better than 2m.
Figure 4. DSM from Hellenic Cadastre
2.1.5 DEM from the 1/50.000 topographic maps

Nikolakopoulos K.& Kyriou A. / European Journal of Geography 6 3 52–68 (2015)
European Journal of Geography-ISSN 1792-1341 © All rights reserved 58
The most popular data sources for the creation of DEM are the digitized contours derived from topographic maps. In this study the 1/50.000 topographic maps of the Hellenic Army Geographical Service that covers the broader area were used. These maps present a nominal horizontal accuracy of 20 meters and a nominal vertical accuracy of 10 meters with 90% confidence. The data were in most cases extracted with photogrammetric techniques from aerial stereo-photographs during the 80’s. The usual update rate for these maps ranges from ten to twenty years. A DEM with a pixel size of 7.5m was created (TOPO50K DEM) and presented in Figure 5.
Figure 5. Topo DEM
2.2 Lesvos area
Lesvos is an island in the northeastern Aegean with an area of 1,636 square kilometers and a coastline 371 km. The island’s capital is Mytilene. The terrain of Lesvos is mountainous and hilly, with the highest peaks of Mount Olympus (968m.) and Lepetymnos (969m.). Also, forests cover almost one fifth of its surface and olive groves, the fourth of its extent. Contrariwise, the western part of the island is dry and barren.
2.2.1 Data sets
The DSM from the Sentinel data was compared freely available DSMs like ASTER GDEM and SRTM DEM and to a DEM created from digitized contours from the 1/50.000 topographic maps.
2.2.2 Sentinel-1 SAR data
In the case of Lesvos island, it was examined the effect of the track (ascending or descending) on DSM generation through interferometric process using Sentinel-1 data. Particularly, they were used Interferometric Wide Swath mode data with 5x20m resolution over a narrow swath of 250km. Nine interferometric pairs from the ascending track 29, acquired from December 2014 till March 2015 were used to produce a DSM, while fourteen interferometric pairs from the descending track 109, obtained between January and March 2015 were used to produce another DSM

Nikolakopoulos K.& Kyriou A. / European Journal of Geography 6 3 52–68 (2015)
European Journal of Geography-ISSN 1792-1341 © All rights reserved 59
(Figure 6). It worth to mention that, in each case of track (ascending or descending), it was investigating the affect of the baseline (small baseline) at the DSM generation.
Figure 6. Above: Sentinel-1 DSM of ascending track (29), Bottom: Sentinel-1 DSM of descending
track (109).
2.2.3 Aster GDEM
In order to compare the generated DSMs from Sentinel -1, a DSM created by ASTER GDEM data was used. The DSM covers the area of Lesvos island (Figure 7). According to the official release documents the ASTER GDEM covers land surfaces between 83°N and 83°S and is comprised of 22,600 1°-by-1° tiles. Tiles that contain at least 0.01% land area are included. The ASTER GDEM is in GeoTIFF format with geographic lat/long coordinates and a 1 arcsecond (approximately 30 m) grid. It is referenced to the WGS84/EGM96 geoid. Pre-production estimated (but not guaranteed) accuracies for this global product were 20 m at 95 % confidence for vertical data and 30 m at 95 % confidence for horizontal data. Some tiles have substantially better than 20 m accuracy, and some tiles have substantially worse than 20 m vertical accuracy. Those accuracies are in harmony with the results of previous studies (Fujisada et al., 2005; Nikolakopoulos and Tsombos, 2010).

Nikolakopoulos K.& Kyriou A. / European Journal of Geography 6 3 52–68 (2015)
European Journal of Geography-ISSN 1792-1341 © All rights reserved 60
Figure 7. DSM from ASTER GDEM
2.2.4 SRTM DEM
Another one DSM was used, aiming to compare the extracted DSMs from Sentinel-1. The SRTM mission was equipped with two radar antennas, covering the Earth's surface between the parallels 60o N and 56o S. The radars operating in the C (l = 5,6cm) and X (l = 3,1cm) bands. The data is georeferenced in WGS84 using UTM projection and adjusted according to the geoid. The spatial resolution is 90m and the vertical accuracy of the generated DSM should be better than 16m according to the specifications. According to Nikolakopoulos et al. (2006) the vertical accuracy of the SRTM DEM is worst than 30m and depends on the morphology of the study area.
Figure 8. DSM from SRTM

Nikolakopoulos K.& Kyriou A. / European Journal of Geography 6 3 52–68 (2015)
European Journal of Geography-ISSN 1792-1341 © All rights reserved 61
2.2.5 DEM from the 1/50.000 topographic maps
Another one DEM was used, aiming to compare the extracted DSMs from Sentinel-1. That DEM was created by digitizing contours from topographic maps and it is presented in Figure 9.
Figure 9. DEM from the maps
3. RESULTS
The assessment of the SENTINEL-1 DSMs for Mykonos Island can be divided in three stages. A first visual control of the DSMs is performed and in the next step the statistical parameters of the DSMs are evaluated. In the third step points of certified elevation are used in order to calculate the 2D Root Mean Square Error (2D RMSE).
3.1. Mykonos Island
3.1.1 Visual Comparison
In the area of study, the generated DSMs from Sentinel-1, ALOS PRISM and Hellenic Cadastre, as well as the topo DEM were compared visually. The DSM of the Hellenic Cadastre gives a very good representation of terrain surface and drainage network. Comparing that DSM with the respective of Sentinel-1(Small baseline DSM and Independent baseline DSM), we conclude that DSMs give a quite good representation of the study area. Especially the DSMs of Sentinel-1(both cases) are visual similar and they present small differentiations locally. On the other hand, the DEM created by digitizing contours and ALOS PRISM DSM includes local areas, where the representation is blurred.

Nikolakopoulos K.& Kyriou A. / European Journal of Geography 6 3 52–68 (2015)
European Journal of Geography-ISSN 1792-1341 © All rights reserved 62
3.1.2 Statistical Comparison
The statistical parameters of the DSMs were considered, as appear in Table 3. The statistical values of the DSMs present intense fluctuations. Although, the minimum values of Sentinel-1 DSM all baselines, topo DEM and Hellenic Cadastre DSM are similar, the maximum values are ranging from 360m to 392m. On the other hand statistical values of ALOS PRISM DSMs present a large deviation compared with the respective values of the other DSMs. Generally, it can be deduced that Sentinel-1 DSMs (Small baseline DSM and Independent baseline DSM), present the same statistical values, which are closer with the corresponding values of Hellenic Cadastre DSM. Furthermore, the most unlike statistical values were developed between Topo DEM, ALOS PRISM DSM and Hellenic Cadastre DSM.
Table 3. Statistical parameters of the DSMs and the topo DEM (values in meters)
Mean St. Dev Min Max Sentinel-1 small baseline DSM 13,58 44,22 0 392,22
Sentinel-1 DSM 13,59 44,23 0 392,75
Topo DEM 32,27 56,92 0 360
Hellenic Cadastre DSM 18,39 45,31 -0,944 375,79
Alos fb DSM 14,80 52,56 -14,42 361,76
Alos nb DSM 34,05 50,07 -31,57 373,38
Alos nf DSM 30,55 63,08 -26,66 370,03
3.1.3 Accuracy Control
a. Control Points
In order to estimate the accuracy of the DSMs, we utilized a data set of ground control points with certified elevation. Those points cover the whole area of the study (Figure 10).
Figure 10. Allocation of the control points
Nikolakopoulos K.& Kyriou A. / European Journal of Geography 6 3 52–68 (2015)
European Journal of Geography-ISSN 1792-1341 © All rights reserved 63
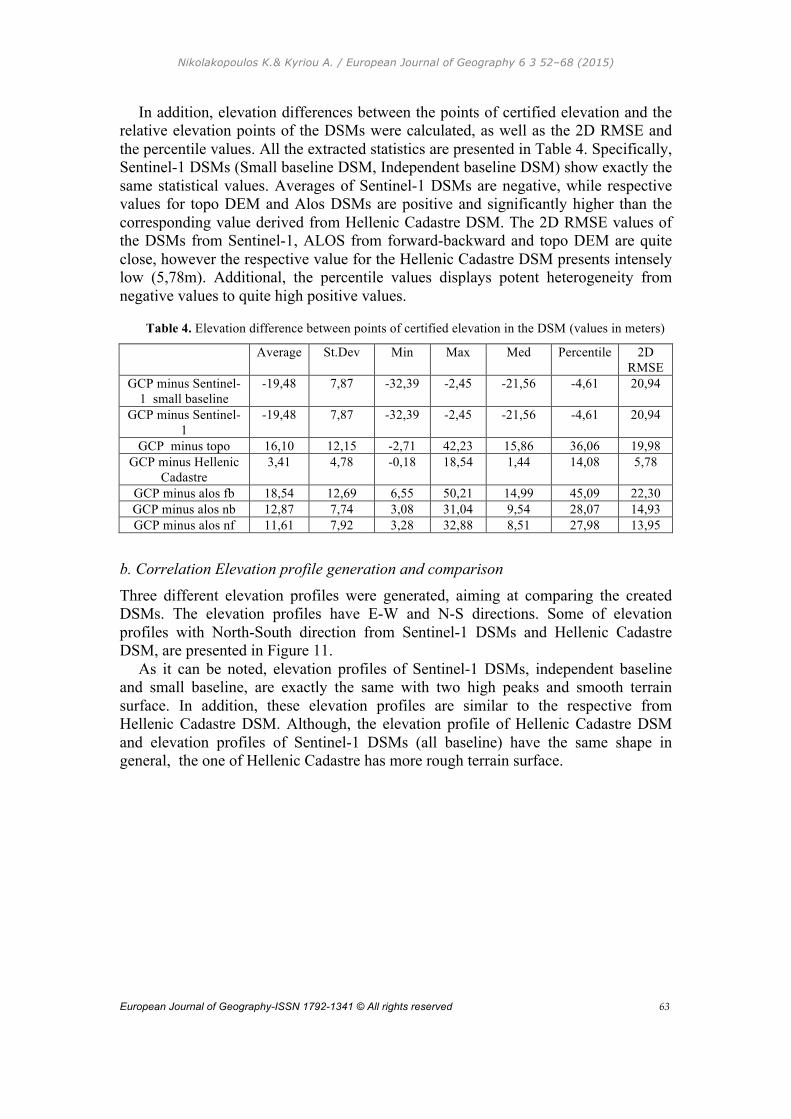
In addition, elevation differences between the points of certified elevation and the relative elevation points of the DSMs were calculated, as well as the 2D RMSE and the percentile values. All the extracted statistics are presented in Table 4. Specifically, Sentinel-1 DSMs (Small baseline DSM, Independent baseline DSM) show exactly the same statistical values. Averages of Sentinel-1 DSMs are negative, while respective values for topo DEM and Alos DSMs are positive and significantly higher than the corresponding value derived from Hellenic Cadastre DSM. The 2D RMSE values of the DSMs from Sentinel-1, ALOS from forward-backward and topo DEM are quite close, however the respective value for the Hellenic Cadastre DSM presents intensely low (5,78m). Additional, the percentile values displays potent heterogeneity from negative values to quite high positive values.
Table 4. Elevation difference between points of certified elevation in the DSM (values in meters)
Average St.Dev Min Max Med Percentile 2D RMSE
GCP minus Sentinel-1 small baseline
-19,48 7,87 -32,39 -2,45 -21,56 -4,61 20,94
GCP minus Sentinel-1
-19,48 7,87 -32,39 -2,45 -21,56 -4,61 20,94
GCP minus topo 16,10 12,15 -2,71 42,23 15,86 36,06 19,98 GCP minus Hellenic
Cadastre 3,41 4,78 -0,18 18,54 1,44 14,08 5,78
GCP minus alos fb 18,54 12,69 6,55 50,21 14,99 45,09 22,30 GCP minus alos nb 12,87 7,74 3,08 31,04 9,54 28,07 14,93 GCP minus alos nf 11,61 7,92 3,28 32,88 8,51 27,98 13,95
b. Correlation Elevation profile generation and comparison
Three different elevation profiles were generated, aiming at comparing the created DSMs. The elevation profiles have E-W and N-S directions. Some of elevation profiles with North-South direction from Sentinel-1 DSMs and Hellenic Cadastre DSM, are presented in Figure 11.
As it can be noted, elevation profiles of Sentinel-1 DSMs, independent baseline and small baseline, are exactly the same with two high peaks and smooth terrain surface. In addition, these elevation profiles are similar to the respective from Hellenic Cadastre DSM. Although, the elevation profile of Hellenic Cadastre DSM and elevation profiles of Sentinel-1 DSMs (all baseline) have the same shape in general, the one of Hellenic Cadastre has more rough terrain surface.

Nikolakopoulos K.& Kyriou A. / European Journal of Geography 6 3 52–68 (2015)
European Journal of Geography-ISSN 1792-1341 © All rights reserved 64
Figure 11. Elevation profiles of Sentinel-1 DSM independent baseline (above), Sentinel-1 small
baseline (middle) and Hellenic Cadastre (bottom).
3.2. Lesvos Island
The assessment of the SENTINEL-1 DSMs for Lesvos Island can be divided in three stages. A first visual control of the DSMs is performed and in the next step the statistical parameters of the DSMs are evaluated. In the third step points of certified elevation are used in order to calculate the 2D Root Mean Square Error (2D RMSE).
3.2.1 Visual Comparison
Initially, a visual comparison of the generated DSMs was implemented. It was noted that the DSM from Sentinel-1 (on both tracks) and Aster DSM are similar, showing quite good representation of the terrain surface and the drainage network of Lesvos.

Nikolakopoulos K.& Kyriou A. / European Journal of Geography 6 3 52–68 (2015)
European Journal of Geography-ISSN 1792-1341 © All rights reserved 65
Furthermore, DSMs from Sentinel-1, independently track, were predominated in the imprinting of shoreline in comparison with Aster DSM. In addition, DEM from maps presents a smoother terrain surface with less mountainous areas in compared with the other DSMs. Contrariwise, DSM from SRTM was characterized by blurred areas and intense turbidity.
3.2.2 Statistical Comparison
DSMs were compared statistically and their statistical values are presenting at Table 5. Although, the minimum values of DSMs are the same, the maximum values are ranging from 920m to 989m. The mean values and standard deviation values of Sentinel-1 DSMs in both tracks are similar and quite different from the respective values of Aster GDEM, SRTM DSM and DEM from maps. Generally, Aster GDEM and SRTM DSM present closer statistical values. Furthermore, statistical values of Sentinel-1 DSM of each track are similar to the corresponding values of Sentinel-1 DSM with small baseline. Also, it can be noted that, the DSM from Sentinel-1 data in ascending track (29) is more relevant to DEM from maps, however the mean value present an intense fluctuation.
Table 5. Statistical parameters of the DSMs (values in meters)
Mean St. Dev Min Max Sentinel-1 DSM (track 29) 80,266 150,889 0 972,64
Sentinel-1 DSM (track 29, small baseline) 80,360 150,965 0 969,25 Sentinel-1 DSM (track 109) 80,554 151,934 0 989,96
Sentinel-1 (track 109, small baseline) 74,153 146,778 0 991,42 Aster DSM 52,813 122,874 0 942,00
SRTM DSM 60,334 130,894 0 920,00 Topo DEM 214,33 167,99 1 960,00
3.2.3 Accuracy Control
In order to estimate the accuracy of the DSMs, we utilize a data set of ground control points of certified elevation. Those points cover the whole study area as it is shown in Figure 12.
Figure 12. Allocation of the control points of Sentinel-1 descending track (109).
Nikolakopoulos K.& Kyriou A. / European Journal of Geography 6 3 52–68 (2015)
European Journal of Geography-ISSN 1792-1341 © All rights reserved 66
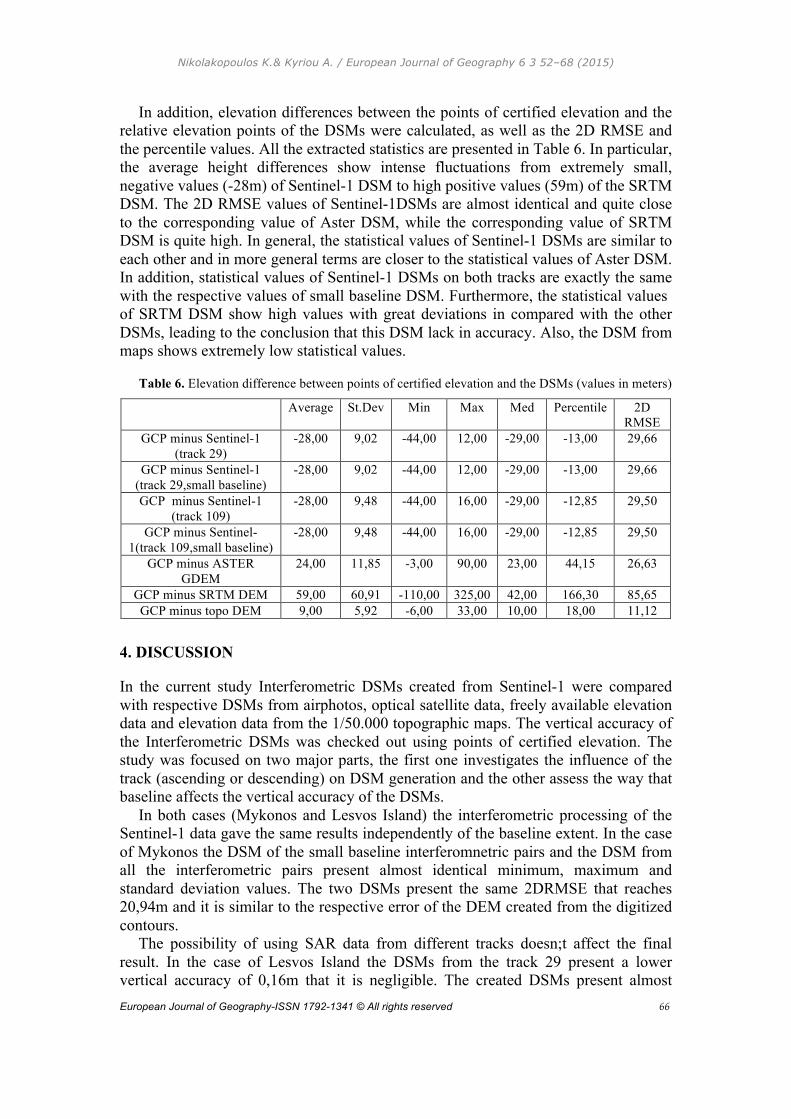
In addition, elevation differences between the points of certified elevation and the relative elevation points of the DSMs were calculated, as well as the 2D RMSE and the percentile values. All the extracted statistics are presented in Table 6. In particular, the average height differences show intense fluctuations from extremely small, negative values (-28m) of Sentinel-1 DSM to high positive values (59m) of the SRTM DSM. The 2D RMSE values of Sentinel-1DSMs are almost identical and quite close to the corresponding value of Aster DSM, while the corresponding value of SRTM DSM is quite high. In general, the statistical values of Sentinel-1 DSMs are similar to each other and in more general terms are closer to the statistical values of Aster DSM. In addition, statistical values of Sentinel-1 DSMs on both tracks are exactly the same with the respective values of small baseline DSM. Furthermore, the statistical values of SRTM DSM show high values with great deviations in compared with the other DSMs, leading to the conclusion that this DSM lack in accuracy. Also, the DSM from maps shows extremely low statistical values.
Table 6. Elevation difference between points of certified elevation and the DSMs (values in meters)
Average St.Dev Min Max Med Percentile 2D RMSE
GCP minus Sentinel-1 (track 29)
-28,00 9,02 -44,00 12,00 -29,00 -13,00 29,66
GCP minus Sentinel-1 (track 29,small baseline)
-28,00 9,02 -44,00 12,00 -29,00 -13,00 29,66
GCP minus Sentinel-1 (track 109)
-28,00 9,48 -44,00 16,00 -29,00 -12,85 29,50
GCP minus Sentinel-1(track 109,small baseline)
-28,00 9,48 -44,00 16,00 -29,00 -12,85 29,50
GCP minus ASTER GDEM
24,00 11,85 -3,00 90,00 23,00 44,15 26,63
GCP minus SRTM DEM 59,00 60,91 -110,00 325,00 42,00 166,30 85,65 GCP minus topo DEM 9,00 5,92 -6,00 33,00 10,00 18,00 11,12
4. DISCUSSION
In the current study Interferometric DSMs created from Sentinel-1 were compared with respective DSMs from airphotos, optical satellite data, freely available elevation data and elevation data from the 1/50.000 topographic maps. The vertical accuracy of the Interferometric DSMs was checked out using points of certified elevation. The study was focused on two major parts, the first one investigates the influence of the track (ascending or descending) on DSM generation and the other assess the way that baseline affects the vertical accuracy of the DSMs.
In both cases (Mykonos and Lesvos Island) the interferometric processing of the Sentinel-1 data gave the same results independently of the baseline extent. In the case of Mykonos the DSM of the small baseline interferomnetric pairs and the DSM from all the interferometric pairs present almost identical minimum, maximum and standard deviation values. The two DSMs present the same 2DRMSE that reaches 20,94m and it is similar to the respective error of the DEM created from the digitized contours.
The possibility of using SAR data from different tracks doesn;t affect the final result. In the case of Lesvos Island the DSMs from the track 29 present a lower vertical accuracy of 0,16m that it is negligible. The created DSMs present almost

Nikolakopoulos K.& Kyriou A. / European Journal of Geography 6 3 52–68 (2015)
European Journal of Geography-ISSN 1792-1341 © All rights reserved 67
idedntical statistical values for both track 29 and track 109. All the Sentinel-1 DSMs of Lesvos Island present the same 2DRMSE that reaches 29m and it is similar to the respective error of the ASTER DEM.
5. CONCLUSIONS
In the current study DSMs generated from Sentinel-1 data were compared with respective DSMs from airphotos, satellite data, freely available elevation data and topographic maps. The accuracy of the DSMs was checked out using ground control points of certified elevation. It was proved that Sentinel-1 data create exactly the same Digital Elevation Model, independently of the baseline extent and independently of the ascending or descending track. In general the vertical accuracy of the DSMs from Sentinel-1 data seems to comparable to the vertical accuracy of ASTER GDEM.
REFERENCES
Choussiafis C., Karathanassi V., Nikolakopoulos K., 2012. Mosaic Methods for Improving the Accuracy of Interferometric Based Digital Elevation Models. In Proceedings of EARSeL 2012-Advances in Geosciences, pp. 552-560
Chunxia, Z., Linlin, G., Dongchen, E.., Hsingchung, C., 2005. A case study of using external DEM in InSAR DEM generation. Geo-spatial Information Science 8(1), pp. 14–18.
Crosetto, M., Crippa, B., 2000. Quality assessment of interferometric SAR DEMs. International Archives of Photogrammetry and Remote Sensing, vol. XXXIII, part B1, pp. 46-53.
Crosetto, M., Monserrat, O., Cuevas, M.., Crippa, B., 2011. Spaceborne differential SAR interferometry: Data analysis tools for deformation measurement. Remote Sensing (3), pp. 305–318.
Gens, R, Van Genderen, J. L., 1996. SAR interferometry—issues, techniques, applications. International Journal of Remote Sensing (17), pp. 1803–1835.
Geymen, A., 2012. Digital elevation model (DEM) generation using the SAR interferometry technique. Arabian Journal of Geoscience (7), pp. 827–837.
Fujisada H., G. B. Bailey, G. G. Kelly, S. Hara, and M. J. Abrams, 2005. ASTER DSM Performance. IEEE Transactions On Geoscience And Remote Sensing. 43, No. 12, pp. 2707-2714.
Jiang, H., Zhang, L., Wang, Y.., Liao, M., 2014. Fusion of high-resolution DEMs derived from COSMO-SkyMed and TerraSAR-X InSAR datasets. J. Geod. (88), pp. 587–599.
Lazeckýa M., Rapanta P., Perissinb D., Bakoň M., 2014. Deformations of highway over undermined Ostrava-Svinov area monitored by InSAR using limited set of SAR images. In Proceedings of CENTERIS 2014 conference.
Nikolakopoulos G. Konstantinos, Emmanuel K. Kamaratakis & Nektarios Chrysoulakis 2006. SRTM vs ASTER Elevation Products. Comparison for two Regions in Crete, Greece. International Journal of Remote Sensing, ISSN: 0143-1161, Vol 27, No 21-22, p. 4819-4838.

Nikolakopoulos K.& Kyriou A. / European Journal of Geography 6 3 52–68 (2015)
European Journal of Geography-ISSN 1792-1341 © All rights reserved 68
Nikolakopoulos Konstantinos G. & Panagiotis Tsombos 2010. Accuracy control of ASTER GDEM and comparison to DSM created with classical photogrammetric techniques, In Proceedings of 30th EARSeL Symposium: Remote Sensing for Science, Education and Culture', Rainer Reuter (Editor), EARSeL 2010, p.515-520.
Nikolakopoulos K., Choussiafis C., Karathanassi V., 2015. Assessing the quality of DSM from ALOS optical and radar data for automatic drainage extraction. Earth Science Informatics, p.1-15, Springer-Verlag Berlin Heidelberg, DOI 10.1007/s12145-014-0199-6.
Nikolakopoulos Konstantinos G. & Aristides D Vaiopoulos, 2011. Validation of ALOS DSM. Proc. of SPIE, Vol. 8181 8181031-11.
Nitti, D. O., Bovenga, F., Nutricato, R., Intini, F.., Chiaradia, M. T., 2013. On the use of COSMO/SkyMed data and weather models for interferometric DEM generation. European Journal of Remote Sensing (46), pp. 250–271.
Rucci, A., Ferretti, A., Monti Guarnieri, A., Rocca, F., 2012. Sentinel 1 SAR interferometry applications: The outlook for sub millimeter measurements. Remote Sensing of Environment (120), pp. 156–163.
Sefercik U.G., Schunert A., Soergel U., Watanabe K., 2012. Validation of DEMs derived from high resolution DAR data: A case study on Barceelona. Remote Sensing and Spatial Information Sciences, Volume I-7, pp. 49-54.
Sefercik U.G, Soergel U., 2014. Infuence or temporal baseline on the vertical absolute accuracies of TSX HS interferometric DSMs: Case study on Berlin. Remote Sensing and Spatial Information Sciences, Volume XL-7, pp. 155-160.
Sefercik, U. G., Yastikli, N.., Dana, I., 2013. DEM Extraction in Urban Areas Using High-Resolution TerraSAR-X Imagery. Journal of Indian Society of Remote Sensing (42), pp. 279–290.
Strozzi T., Wegmiiller U., Tosl L., Bitelli G., Spreckels V., 2001. Land Subsidence Monitoring with Differential SAR Interferometry. Photogrammetric Engineering & Remote Sensing Vol. 67, No. 11, pp. 1261-1270.