Preliminary Results from the Alternative Fuel Effects on … · 2017-11-06 · Aircraft Separation...
16
Richard Moore, Michael Shook, Edward Winstead, Lee Thornhill, Glenn Diskin, Robert Martin, Charles Hudgins, John Barrick, Andreas Beyersdorf, Suzanne Crumeyrolle, Luke Ziemba, and Bruce Anderson NASA Langley Aerosol Research Group (LARGE), Science Directorate Brian Beaton NASA LaRC, Aeronautics Research Directorate Dale Bowser, Craig Cleckner, Dean Riddick, Greg Slover, Robert White, and Richard Yaskey NASA LaRC, Research Services Directorate Dan Bulzan and Ruben Del Rosario NASA GRC, Fundamental Aeronautics Program, Fixed Wing Project July 18, 2013 Preliminary Results from the Alternative Fuel Effects on Contrails & Cruise Emissions (ACCESS) Flight Experiment
Transcript of Preliminary Results from the Alternative Fuel Effects on … · 2017-11-06 · Aircraft Separation...

Richard Moore, Michael Shook, Edward Winstead, Lee Thornhill,Glenn Diskin, Robert Martin, Charles Hudgins, John Barrick, Andreas Beyersdorf,
Suzanne Crumeyrolle, Luke Ziemba, and Bruce AndersonNASA Langley Aerosol Research Group (LARGE), Science Directorate
Brian BeatonNASA LaRC, Aeronautics Research Directorate
Dale Bowser, Craig Cleckner, Dean Riddick, Greg Slover, Robert White, and Richard Yaskey
NASA LaRC, Research Services Directorate
Dan Bulzan and Ruben Del RosarioNASA GRC, Fundamental Aeronautics Program, Fixed Wing Project
July 18, 2013
Preliminary Results from the Alternative Fuel Effects on Contrails & Cruise Emissions
(ACCESS) Flight Experiment

Project Overview
Flight experiment with the LaRC Falcon chasing the Dryden DC-8, which burned both traditional and alternative fuels
Ground test experiment behind the Dryden DC-8, which burned both traditional and alternative fuels at multiple power settings

800
700
600
500
400CO
2 (
pp
m)
23:14 23:15 23:16 23:17 23:18
101
102
103
104
105
Np (
cm
-3)
300
200
100
0
NO
2 (
pp
b)
50
403020
100
Nc
lou
d (cm
-3)
60
40
20
0Ab
s (
Mm
-1)
6
7
8
9
1
Dp
(m
m)
Crown-Mounted Sample Probe:
Right-Wing-Mounted Cloud Probe:
Ultrafine Particles Fine Particle Concentration Non-Volatile Particle Concentration
Absorption (blue) Absorption (green) Absorption (red)
#2 EngineCrown
#3 EngineCrown
#3 EngineRight Wing
12 April 2013 Flight TimeseriesBackground
#2 EngineCrown
#3 EngineRight Wing
#3 EngineCrown
Flight Data

Blending does not change the overall aerosol emissions index, but does reduce non-volatile particles by 30-50%.
Flight Data

1
2
4
6
810
2
4
6
8100
2
4
6
81000
Ice
Cry
sta
l N
um
be
r C
on
ce
ntr
ati
on
(c
m-3
)
550500450400350300250
Aircraft Separation Distance (m)
11.2
11.0
10.8
10.6
Altitu
de
(km
)
12 April 2013
Crystal concentrations dilute with increasing separation, but not clear trend inice crystal size (which trends with altitude). Crystals appear to be spherical.
6
7
8
9
1
2
Av
era
ge
Ic
e C
rys
tal
Dia
me
ter
(um
)
550500450400350300250
Aircraft Separation Distance (m)
11.2
11.0
10.8
10.6
Altitu
de
(km
)
12 April 2013
Flight Data
Ground tests enable additional measurements,aircraft power settings, and traceability to past results
• Probe stands mounted at 30 m behind both inboard engines
• Falcon instrument payload + the LARGE mobile step van with additional instruments (shown at right)
• Cycle through fuels, power settings overan approximately 4-hr. experiment
Probes
LARGEMobile Lab
LaRC Falcon

Top-down view of the ground test pad at NASA Dryden with wind rose plot

100
90
80
70
60
50
40
30
20
10
0
N1
6000500040003000200010000
Fuel Flow Rate (kg h-1
)
50:50 JP8-HEFA Blend Pure JP8
Cruise Conditions(33,000-37,000 feet)
Ground Test
800
750
700
650
600
550
500
450
400E
GT
(d
eg
. C
)6000500040003000200010000
Fuel Flow Rate (kg h-1
)
50:50 JP8-HEFA Blend Pure JP8
Cruise Conditions(33,000-37,000 feet)
Ground Test
Flight “cruise conditions” are not an apples-to-apples comparison with “ground conditions”.
Ground & Flight Data

Lower particle number EIs observed at cruise conditions: Potential ice-particle scavenging?
Ground & Flight Data
Need to Revise

Particle number reductions more apparent from size distribution plots versus CPC-based number EIs
Ground Data
1.4x10¹⁷
1.2
1.0
0.8
0.6
0.4
0.2
0.0dE
I N/d
log
DP (
kg
-fu
el-1
)
102 3 4 5 6 7 8 9
100
Mobility Diameter (nm)
Pure JP8 50:50 JP8-HEFA Blend
4% Power 1.4x10
17
1.2
1.0
0.8
0.6
0.4
0.2
0.0dE
I N/d
log
DP (
kg
-fu
el-1
)
102 3 4 5 6 7 8 9
100
Mobility Diameter (nm)
30% Power
5.0x10¹⁶
4.0
3.0
2.0
1.0
0.0dE
I N/d
log
DP (
kg
-fu
el-1
)
102 3 4 5 6 7 8 9
100
Mobility Diameter (nm)
85% Power 1.4x10
17
1.2
1.0
0.8
0.6
0.4
0.2
0.0dE
I N/d
log
DP (
kg
-fu
el-1
)
102 3 4 5 6 7 8 9
100
Mobility Diameter (nm)
45% Power
5.0x10¹⁶
4.0
3.0
2.0
1.0
0.0dE
I N/d
log
DP (
kg
-fu
el-1
)
102 3 4 5 6 7 8 9
100
Mobility Diameter (nm)
65% Power
1.4x10¹⁷
1.2
1.0
0.8
0.6
0.4
0.2
0.0dE
I N/d
log
DP (
kg
-fu
el-1
)10
2 3 4 5 6 7 8 9
100
Mobility Diameter (nm)
7% Power
Note the changing y-axis scaling!

5.0x10¹¹
4.0
3.0
2.0
1.0
0.0
dE
I V/d
log
DP (
um
3 k
g-f
ue
l-1)
102 3 4 5 6 7
1002
Mobility Diameter (nm)
4% Power
Pure JP8 50:50 JP8-HEFA
Blend
Now in aerosol volume space: emergence of a larger, soot mode at higher engine power is apparent
4.0x10¹¹
3.0
2.0
1.0
0.0
dE
I V/d
log
DP (
um
3 k
g-f
ue
l-1)
102 3 4 5 6 7
1002
Mobility Diameter (nm)
7% Power
3.5x10¹¹
3.0
2.5
2.0
1.5
1.0
0.5
0.0
dE
I V/d
log
DP (
um
3 k
g-f
ue
l-1)
102 3 4 5 6 7
1002
Mobility Diameter (nm)
30% Power
2.4x10¹¹
2.0
1.6
1.2
0.8
0.4
0.0
dE
I V/d
log
DP (
um
3 k
g-f
ue
l-1)
102 3 4 5 6 7
1002
Mobility Diameter (nm)
45% Power 1.4x10
11
1.2
1.0
0.8
0.6
0.4
0.2
0.0
dE
I V/d
log
DP (
um
3 k
g-f
ue
l-1)
102 3 4 5 6 7
1002
Mobility Diameter (nm)
65% Power
3.5x10¹¹
3.0
2.5
2.0
1.5
1.0
0.5
0.0
dE
I V/d
log
DP (
um
3 k
g-f
ue
l-1)
102 3 4 5 6 7
1002
Mobility Diameter (nm)
85% Power
Note the changing y-axis scaling!Ground Data

Fuel blending reduces overall particle mass emissions index by 30-50%, both soot and SO4 mass are decreased by two-fold.
Ground Data
160
140
120
100
80
60
40
20
0
Ma
ss
Em
iss
ion
s I
nd
ex
(mg
kg
-fu
el-1
)
8070605040302010
Engine Power (%)
NH4 NO3 Black Carbon (BC) Org SO4
Pure JP8:
50:50 JP8-HEFA Blend:160
140
120
100
80
60
40
20
0
Ma
ss
Em
iss
ion
s I
nd
ex
(mg
kg
-fu
el-1
)
8070605040302010
Engine Power (%)
NH4 NO3 Black Carbon (BC) Org SO4
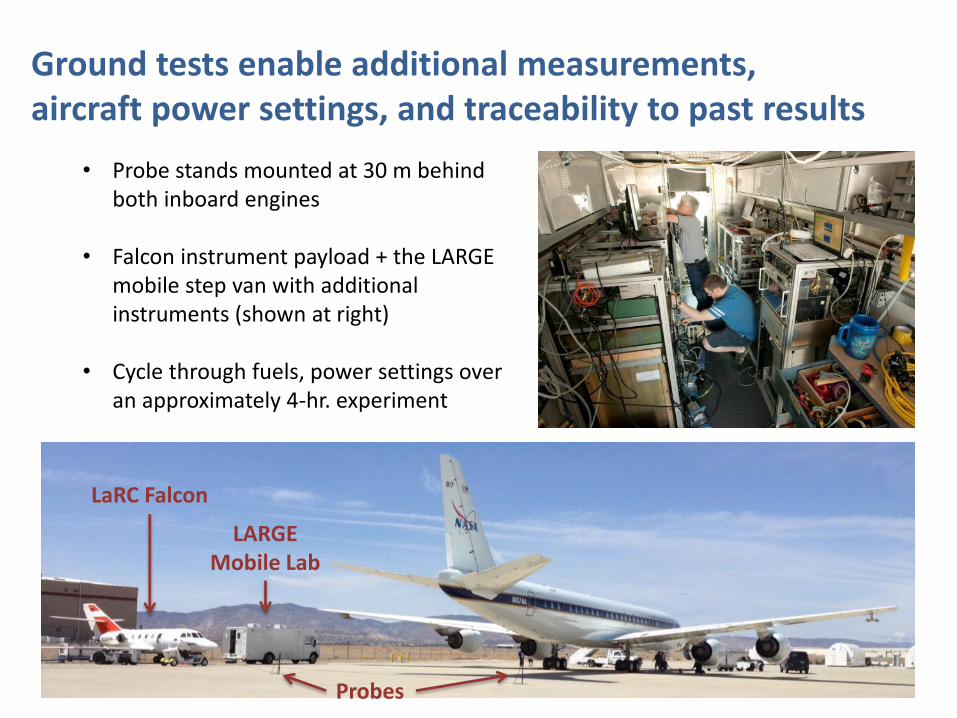
Additional instruments during the ground test can probe soot density and shape, but are not suitable for flight.
JP-8/BiofuelBlend
1.8
1.7
1.6
1.5
1.4
1.3
1.2
1.1
1.0
0.9
Eff
ecti
ve D
en
sit
y (
g c
m-3
)
7060504030
Particle Mobility Diameter (nm)
1.8
1.7
1.6
1.5
1.4
1.3
1.2
1.1
1.0
0.9
Eff
ecti
ve D
en
sit
y (
g c
m-3
)
Engine Power: 7% 30% 45% 65% 85%
95% Confidence Intervals: 7% Power 85% Power
JP-8
Atomic force microscopy image of soot particles, which appear to be coated with liquid organics or sulfuric acid (smooth, rounded edges)
Higher density soot observed at lower power settings (again likely due to liquid-like morphology)Ground Data

Large soot agglomerate:45% EnginePower
Individual nucleation-modeparticles:4% EnginePower
Probe individual particle size/morphology using atomic force microscopy (AFM).
Ground Data
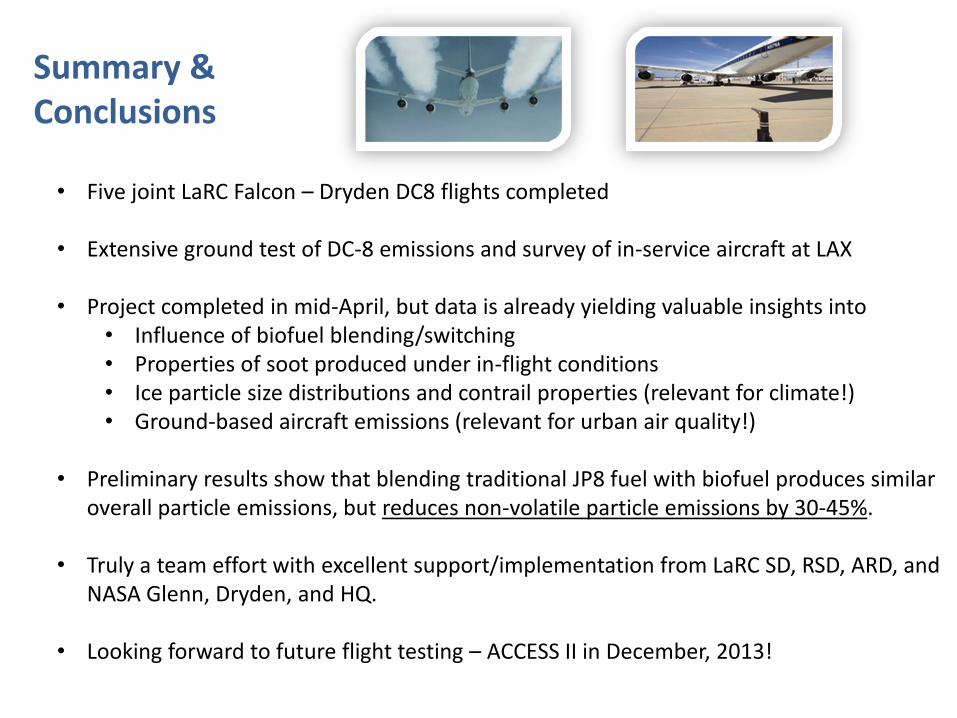
Summary &Conclusions
• Five joint LaRC Falcon – Dryden DC8 flights completed
• Extensive ground test of DC-8 emissions and survey of in-service aircraft at LAX
• Project completed in mid-April, but data is already yielding valuable insights into• Influence of biofuel blending/switching• Properties of soot produced under in-flight conditions• Ice particle size distributions and contrail properties (relevant for climate!)• Ground-based aircraft emissions (relevant for urban air quality!)
• Preliminary results show that blending traditional JP8 fuel with biofuel produces similar overall particle emissions, but reduces non-volatile particle emissions by 30-45%.
• Truly a team effort with excellent support/implementation from LaRC SD, RSD, ARD, and NASA Glenn, Dryden, and HQ.
• Looking forward to future flight testing – ACCESS II in December, 2013!

Questions?