Preliminary Results - enterprise-inns Group Website...Preliminary Results 2008 Financial highlights...
33
Preliminary Results 2008 Preliminary Results 30 September 2008 VISIT OUR WEBSITE www.enterpriseinns.com
Transcript of Preliminary Results - enterprise-inns Group Website...Preliminary Results 2008 Financial highlights...

Preliminary Results 2008
Preliminary Results
30 September 2008
VISIT OUR WEBSITE www.enterpriseinns.com

Preliminary Results 2008
Financial highlights 12 months to 30 September 2008
EBITDA reduced by 3% to £512m
Profit before tax and exceptional items fell by 13% to £263m
Adjusted earnings per share down just 1% to 39.2 pence
Full year dividend up 4% to 16.2 pence
Flexible financing structure in place

Preliminary Results 2008
EBITDA EBITDA of £512m
12 months to
30 September Variance
£m 2008 Pro forma
2007 %
Revenue 880 918 (4)%
Cost of sales (336) (358) 6%
Gross profit 544 560 (3)%
Administrative expenses (32) (34) 6%
EBITDA 512 526 (3)%

Preliminary Results 2008
Profit & loss account Adjusted EPS down just 1% 12 Months to
30 September
£m 2008 2007
Revenue 880 921
EBITDA 512 528
Depreciation (8) (7)
Interest (241) (220)
PBT (pre exceptional items) 263 301
Taxation (68) (85)
Profit after tax (pre exceptional items) 195 216
Adjusted EPS (p) 39.2 39.6
Weighted average no. of shares (m) 497.4 545.0
Dividend per share (p) 16.2 15.6

Preliminary Results 2008
Gross margin analysis Increased margin on beer sales
£m Beer, cider &
fabs
Licensee discounts Wines, spirits & minerals
Rent Machines & other Total
Contractual Special 2007/08
Turnover 618 (44) (6) 32 258 22 880
Cost of sales (305) - - (25) (6) - (336)
Gross profit 313 (44) (6) 7 252 22 544
Gross margin % 50.6% 61.8%
2006/07 – Proforma
Turnover 651 (50) (1) 33 260 25 918
Cost of sales (325) - (26) (7) - (358)
Gross profit 326 (50) (1) 7 253 25 560
Gross margin % 50.1% 61.0%

Preliminary Results 2008
Cash flow statement Free cash inflow of £62m
12 months to
30 September
£m 2008 2007
Operating profit 502 521
Operating cash inflow 536 523
Interest (246) (220)
Tax (77) (71)
Free cash flow pre investment 213 232
Dividends (81) (79)
Pub capital expenditure (68) (75)
Other capital expenditure (2) (3)
Free cash inflow 62 75
Preliminary Results 2008
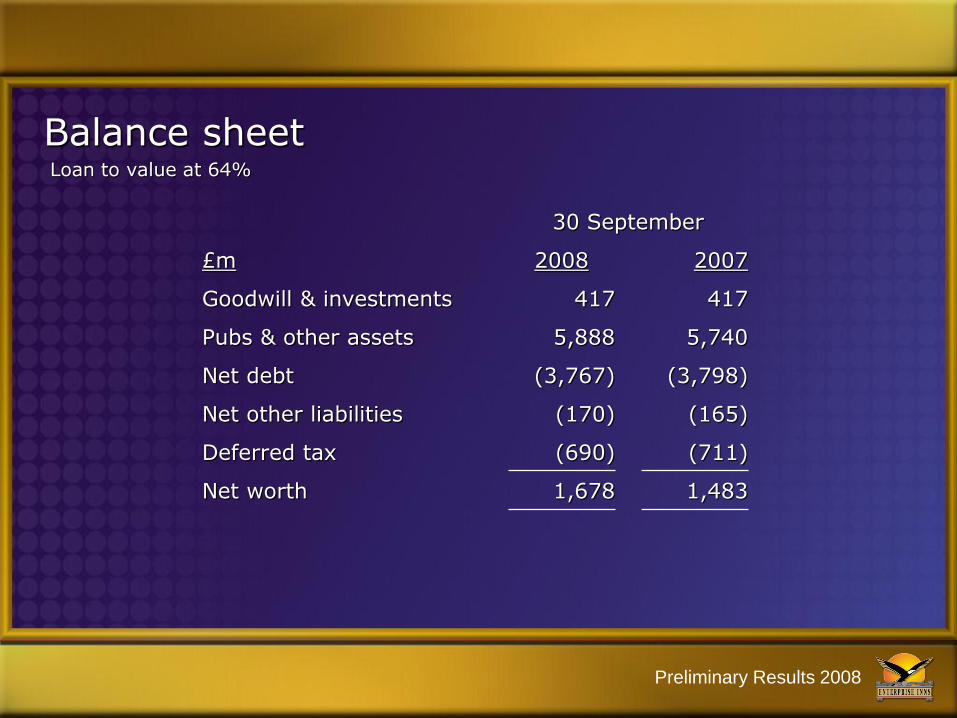
Balance sheet Loan to value at 64%
30 September
£m 2008 2007
Goodwill & investments 417 417
Pubs & other assets 5,888 5,740
Net debt (3,767) (3,798)
Net other liabilities (170) (165)
Deferred tax (690) (711)
Net worth 1,678 1,483

Preliminary Results 2008
Debt structure Underlying net debt reduced by £12m
As at 30 September
£m 2008 2007
Bank debt (1,031) (1,035)
Corporate bonds (1,185) (1,185)
Securitised bonds (1,586) (1,586)
Gross debt (3,802) (3,806)
Cash 98 90
Underlying net debt (3,704) (3,716)
Other (including mark to market of swaps) (63) (82)
Net debt (3,767) (3,798)

Preliminary Results 2008
Weighted average life & cost of debt 89% fixed at 6.5% for an average of 10 years
As at 30 Sept 2008
Facility Weighted
average life
Weighted
average cost
Bank debt 3 yrs 6.2%
Corporate bonds 14 yrs 6.5%
Securitised bonds 12 yrs 6.4%
Total 10 yrs 6.5%

Preliminary Results 2008
Three pronged financing Flexible debt structure
Bank debt Corporate bonds Securitised bonds
£m

Preliminary Results 2008
Three pronged financing Loan to value at 64%
£m
Corporate bonds Bank debt Securitised bonds
Gross
debt
Pub
value
Gross
debt
Pub
value
Gross
debt
Pub
value

Preliminary Results 2008
ETI pub value headroom Pub value headroom of 17%
Headroom
£m
Bank debt
Pub value
secured
against debt
Corporate bonds Total ETI
Gross
debt
Gross
debt
Gross
debt
• No pub value covenant in the securitised bonds

Preliminary Results 2008
Bank debt Headroom of £94m
£m
As at 30 Sept 2008 As at 30 Sept 2007
Facility Drawn Headroom Facility Drawn Headroom
Club facility
1,000 1,000 - 1,000 1,000 -
Committed facility
100 31 69 - - -
Uncommitted facility
- -
- 100 35 65
Total
1,100 1,031 69 1,100 1,035 65
Overdraft*
25 - 25 25 9 16
* Additional borrowing of a further £100m allowed under the bank facility

Preliminary Results 2008
Bank debt Comfortable covenant headroom
Annualised as at
Covenant 30 Sept 2008
31 March 2008
30 Sept 2007
Net debt : EBITDA* 6.5x 5.80x 5.71x 5.74x
Interest cover 2.0x 2.62x 2.75x 3.09x
First charge assets ratio 1.0x 1.44x 1.43x 1.34x
Total property assets ratio 1.5x 2.00x 1.92x 1.82x
* EBITDA includes dividends from Unique of circa £70m per annum
Covenants tested semi annually on a MAT basis

Preliminary Results 2008
Corporate bonds Flexibility to match actual leverage to covenant
At 30 September 2008 Asset cover Income cover
Bond Covenant Actual Covenant Actual
1. £60m due 2014 1.50x 1.58x 1.50x 2.39x
2. £600m due 2018 1.67x 1.80x 2.00x 2.00x
3. £125m due 2021 1.50x 1.75x 1.50x 1.85x
4. £125m due 2025 1.50x 1.73x 1.50x 1.84x
5. £275m due 2031 1.67x 1.70x 1.50x 1.90x
• Post substitution of pubs
• Pubs withdrawn or introduced as necessary to ensure covenant compliance
• Covenants tested annually on a MAT basis

Preliminary Results 2008
Securitised bonds £115m of debt prepaid
Next mandatory repayments: June 2010 £2m, Sept 2010 £7m.
£m
A2N
201m
A4
£535m
A3
£435m

Preliminary Results 2008
Securitised bonds Significant liquidity and headroom on covenants
Covenant Sept 2008 March 2008 Sept 2007
Debt Service Cover Ratio (DSCR) 1.10x 2.06x 2.15x 2.14x
Net worth £m 150 1,448 1,401 1,385
Covenants
Liquidity
Liquidity facility - £190m
Cash balance of £89m at 30 September 2008
• No pub value covenant
• DSCR cash trap test at 1.5x
• Covenants tested quarterly on a MAT basis

Preliminary Results 2008
Debt reduction programme Significant debt reduction potential
£m 2008 Actual
2009 Scoping
Comments
From To
Free cash flow pre investment 213 150 200 For illustrative purposes, not a forecast
Capital on existing estate (68) (50) (40) Normal capital expenditure of c£45m
Acquisition of pubs (48) (5) (5) Acquisitions team redeployed to sell non viable pubs
Disposals of pubs 30 50 100
Potential cash generation 127 145 255
Preliminary Results 2008
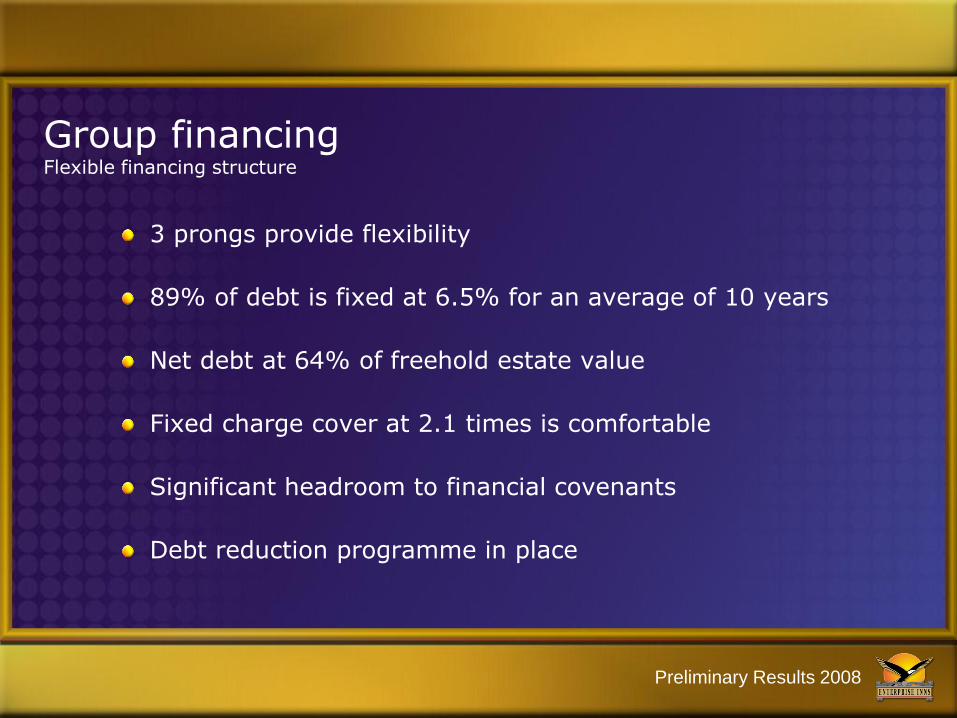
Group financing Flexible financing structure
3 prongs provide flexibility
89% of debt is fixed at 6.5% for an average of 10 years
Net debt at 64% of freehold estate value
Fixed charge cover at 2.1 times is comfortable
Significant headroom to financial covenants
Debt reduction programme in place

Preliminary Results 2008
Operating highlights 12 months to 30 September 2008
Group EBITDA of £512m, operating cash inflow £536m
Solid performance in a tough market
Increased support for licensees through discounts and concessions
Average EBITDA per pub up 2% in 82% of estate let on substantive agreements
£68m capital expenditure invested into the estate
58 high quality acquisitions for £48m
Surplus land, underperforming & HAUV pubs sold for £30m

Preliminary Results 2008
Adjusted earnings per share Resilient performance in a tough market
% increase in adj EPS 33% 17% 16% (1%)
Dividend 9.0p 13.5p 15.6p 16.2p
% increase in dividend 50% 50% 16% 3.8%
Dividend cover (adj EPS) 3.2x 2.5x 2.5x 2.4x
Preliminary Results 2008
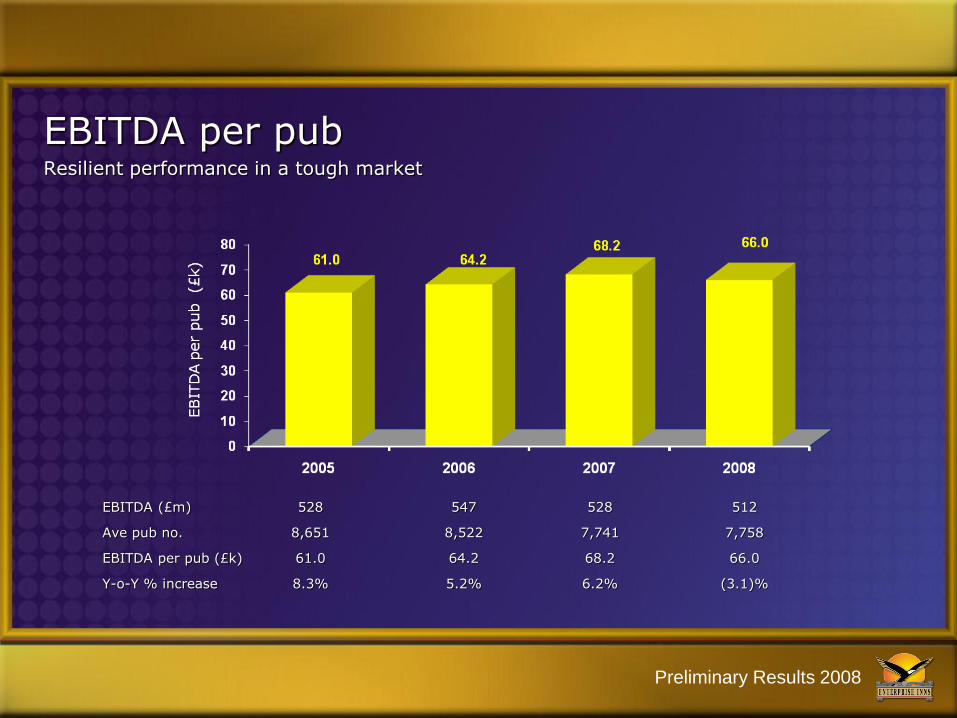
EBITDA (£m) 528 547 528 512
Ave pub no. 8,651 8,522 7,741 7,758
EBITDA per pub (£k) 61.0 64.2 68.2 66.0
Y-o-Y % increase 8.3% 5.2% 6.2% (3.1)%
EBITDA per pub Resilient performance in a tough market

Preliminary Results 2008
Top quality pub estate Enterprise secured the best available pub assets
Original pubs
acquired
Pubs at Sept 08
% retained
Historic* cost (£m)
Current value (£m)
Income % of
historic cost
Income % of
current value
Pre float 490 174 36% 34 93 29% 10%
Other 2,267 1,150 51% 436 745 17% 10%
2001 Managed pubs (Whitbread and S&N) 840 685 82% 467 631 13% 10%
2002 Laurel (Whitbread leases) 1,860 1,634 88% 882 1,263 13% 9%
2004 Unique (Grand Met and M&B) 3,955 3,498 88% 2,165 2,672 12% 10%
Individual acquisitions 726 622 86% 363 458 10% 8%
Scotland 141 - 0%
TOTAL 10,279 7,763 76% 4,347 5,861 13% 10%
• Historic cost includes post acquisition capital expenditure

Preliminary Results 2008
Pub estate valuation No of pubs
£m £m Value/pub
£k
Pub value as at 30 Sept 07 7,763 5,713 736
Capital investment & churn 76
Impact of year end estate valuation:
Increase/no change in value 5,283 318
Reduction in value 2,480 (246)
Revaluation increase 72
Pub value as at 30 Sept 08 7,763 5,861 755
Pub estate valuation: Financial statements:
Increase in revaluation reserve (Balance Sheet) 123
Pubs valued below historic cost (P&L exceptional item) (51)
Revaluation increase 72

Preliminary Results 2008
Capital investment Consistent investment targeting 12% return
12 months to 30 Sept 2008
Investment
spend
Total
Investment*
(£m)
No of
projects
£200k + 22 69
£100-£200k 16 115
£50-£100k 13 186
£10-£50k 17 734
£5-£10k 7 483
Total 75 1,587
Projects
£m No.
Sept 05 49 1,093
Sept 06 54 1,390
Sept 07 75 1,594
Sept 08 68 1,587
* Value of projects completed £75m, cash paid out £68m.

Preliminary Results 2008
Acquisitions & disposals Effective estate churn
£m
58 acquisitions (48)
Disposals (inc land) 30
Net cash outflow (18)
Acquisitions Disposals
No. £m No. £m
FY05 21 14 158 47
FY06 95 80 107 48
FY07 108 91 17 13
FY08 58 48 58 30
• FY06 excludes sale of 769 pubs to Admiral Taverns for £318m
• FY07 excludes sale of 137 pubs to Retail & Licensed Properties Ltd for £115m

Preliminary Results 2008
Estimate of potential licensee profitability
£’000 2008 % of T/O
2007 % of T/O
% change
Turnover Wet 236 232
Food 65 60
Other 13 14
Total turnover 314 306 3%
Gross margin 172 55% 168 55%
Overheads (103) 33% (95) 31%
Pre rent profit 69 22% 73 24% (5)%
Rent (34) (36)
Cash profit 35 37 (5)%
Domestic accommodation 10 10
Post rent licensee profit 45 14% 47 15% (4)%
Source: Estates Review – completed September 2008

Preliminary Results 2008
Estimate of potential licensee profitability
£’000
All Bands £15-30k £30-45k £45-60k £60-75k Over £75k
Turnover 314 201 269 353 443 607
Gross margin 172 101 142 197 255 366
Overheads (103) (66) (86) (115) (147) (211)
Pre rent profit 69 35 56 82 108 155
Rent (34) (16) (28) (41) (54) (76)
Cash profit 35 19 28 41 54 79
Domestic accommodation 10 8 9 11 12 16
Post rent licensee profit 45 27 37 52 66 95
No of pubs* 1,502 3,130 1,767 815 483
Source: Estates Review – completed September 2008
* Excludes 66 pubs, the majority of which are closed pending disposal

Preliminary Results 2008
Estimate of actual licensee profitability
£’000 2008
Estimated Actual
Memo: 2008 FMT Potential
2008 Actual assumptions
Turnover 292 314 Wet turnover is based on actual sales and food income broadly steady at c20% of sales.
Gross margin 162 172
Overheads (100) (103) Fixed costs in line with FMT potential with moderate savings in variable costs
Pre rent profit 62 69
Rent (31) (34) Actual annual rent at September 08
Cash profit 31 35
Domestic accommodation 10 10
Post rent licensee profit 41 45
Source: Estates Review – completed September 2008

Preliminary Results 2008
Licensee profitability What’s it really like out there?
7,161 enquiries converted to 1,566 formal applications
577 fully screened applicants on the database
80% of estate let on long term assignable leases
483 lease assignments, average premium £63k (£79k including tenants fixtures
and fittings)
Rent concessions increased to 2.1% of rent roll at the year end
915 rent reviews were completed at an average annual increase of 2.2%
Overdue balances at less than 1% of turnover, bad debts low at 0.1% of
turnover

Preliminary Results 2008
Plan for 2008-09
Maximise pub estate potential
Support licensees as appropriate
Minimal acquisitions
Return to normal levels of capital investment
Accelerate the disposal programme
Manage cash flows and debt profile

Preliminary Results 2008
Summary
1% decline in adjusted earnings per share
Best quality pub estate
Tenanted model remains robust and fair
Strong cash generation
Debt reduction programme in place
Well placed to benefit from recovery