A combined wear and crack nucleation–propagation methodology for fretting fatigue prediction

Page 1 of 33
Preliminary Modelling of Crack Nucleation and
Propagation in SiC/SiC Accident-Tolerant Fuel
during Routine Operational Transients
using Peridynamics
T.A. Haynes1, D. Shepherd2 & M.R. Wenman1,*
1 Department of Materials & Centre for Nuclear Engineering,
Imperial College London, Exhibition Road, London, SW7 2AZ
2 National Nuclear Laboratory (NNL), NNL Preston Laboratory,
Springfields Works, Salwick, Preston, Lancashire, PR4 0XJ
Abstract
Silicon carbide fibre in silicon carbide matrix composites (SiC/SiC) are a promising cladding for
use in accident tolerant fuels (ATF) in current light water reactor (LWR) designs. However, as
they are a radically different material from current metal clads, current thermomechanical
simulation methods struggle to accurately predict their behaviour, especially regarding the
potential development of cracks. Thus, a new peridynamic model for SiC/SiC cladding has been
developed in the Abaqus finite element code. The material model was isotropic and considers
matrix cracking and fibre pull-out. The thermal expansion, swelling and the degradation of the
thermal conductivity are modelled under typical LWR irradiation conditions. The swelling on the
outer surface is predicted to be greater than the inner surface due to the lower irradiation
temperature, causing a tensile stress on the inside of the cladding; tension being more challenging
for a ceramic than a metal. This stress increases during the decrease in power at the start of a typical
pressurised water reactor refuelling outage and causes microcracking of the matrix on the cladding
inner surface. In models without fibres, cracks would propagate through the cladding. If fibres are
modelled, matrix cracking will extend to a depth of around 20% through the cladding from the
inner surface, which is unlikely to be an acceptable design. If an inner monolith of SiC is
additionally modelled, cracking propagates through the monolith and acts as a stress raiser for
matrix cracking in the composite, and therefore does not constitute a design improvement. If an
outer SiC monolith is modelled, fibre pull-out strain on the inner surface of the cladding was
increased by just under 70%. No cracks are predicted in an outer monolith which may therefore
remain gas-tight and thus a more suitable design. These predictions are consistent with
experimental findings.
Highlights
• Irradiation of accident tolerant SiC/SiC cladding is modelled using peridynamics.
• Due to swelling, a tensile stress is predicted on the inside of the cladding.
• In the absence of a monolith, micro-cracking extends to 20% from the inner surface.
• Cracks in an inner monolith are a stress raiser in the composite.
• No cracks are predicted in an outer monolith, hence it’s the most promising design.
Page 2 of 33
1 Introduction
1.1 Background
1.1.1 The Need for Accident Tolerant Fuels
Historically, light water reactor (LWR) claddings have been fabricated using zirconium alloyed with
Fe, Cr, Sn, Nb and other elements. Whilst zirconium alloys offer excellent thermal, neutronic and
corrosion performance during routine operation and design basis accidents [1], their performance is less
good during severe accidents. The oxidisation of the zirconium alloys in high temperature steam is
highly exothermic [2] and hydrogen is produced. The impact of the increased heat and hydrogen
production were seen at Fukushima Daiichi [3]. Developing an accident tolerant fuel (ATF) cladding
would allow increased ‘grace time’ for response to an accident.
1.1.2 Architecture of SiC/SiC Compsites
SiC/SiC composites have been proposed as a cladding for LWR ATFs. The most recent ‘Generation
III’ composites typically consist of near-stochiometric β-phase SiC fibres reinforcing a near-
stochiometric β-phase SiC matrix with a pyrocarbon (PyC) interphase between the fibres and matrix [4,
5] .The matrix is introduced by either nano-infiltration transient eutectic-phase (NITE) or chemical
vapour infiltration (CVI), whilst the monolith is typically formed by chemical vapour deposition (CVD)
- effectively the same process as CVI except that deposition is on a surface rather within a weave of
fibres [6]. Some cladding architectures incorporate inner and/or outer monoliths of β-phase SiC. Inner
monoliths are proposed as an improved barrier to gaseous fission product egress than the SiC/SiC
composite structure, whilst outer monoliths are also intended to improve water corrosion at high
temperatures [7, 8]. Aside from their proposed role as a cladding for nuclear fuel, SiC/SiC composites
have been proposed for power-generation turbines, aircraft engines and fusion reactors [9, 10].
1.1.3 Challenges to the Introduction of SiC/SiC Cladding
Despite its promise as an ATF cladding, from a fuel performance perspective, a number of challenges
remain [11] to the introduction of SiC/SiC cladding:
• Irradiated, porous SiC/SiC composites have a lower thermal conductivity than zirconium
alloys, which have a typical thermal conductivity of 13 W m-1 K-1 at 600 K. Whilst thermal
conductivity of highly pure & dense single-/poly-crystals can be incredibly high (up to
165 W m-1 K-1 at room temperature [12]), Katoh et al. have reported that the thermal
conductivity of SiC/SiC composites reduced from 16.3 W m-1 K-1 at room temperature to
1.2 W m-1 K-1 after irradiation at 600 K after a neutron dose of 0.1 dpa [13]. This is comparable
with the order of magnitude reduction in thermal conductivity associated with a neutron dose
of 0.1 dpa reported by Snead et al. [12]. Reduced thermal conductivity will give rise to larger
temperature changes across the cladding, and potentially higher fuel temperatures and fuel pin
pressures [14].
• Zirconium based claddings creep onto the fuel over a number of years, reducing the fuel
temperature and fission gas release in higher burnup fuel. SiC/SiC claddings have a much
slower creep rate and so will result in a largely elastic cladding response and much lower
contact [8].
• SiC/SiC claddings have a greater swelling rate than zirconium alloys. The swelling saturates
rapidly with fast neutron fluence (E>0.1 MeV). Typically, saturation occurs by around 0.1-1.0
dpa and is highly temperature dependent, being greater at lower irradiation temperatures [15].
• Finally, the thermal conductivity is strongly dependent upon the swelling strain [11].
Aside from the challenges described above, there are a number [2, 16] of other topics under
investigation, including issues over joining [17]; maintaining the hermetic seal in the presence of micro-
cracking [18]; and, hydrothermal dissolution [19-21].

Page 3 of 33
1.2 Peridynamics
Peridynamics is a non-local modelling technique that allows crack patterns and growth to be predicted
[22]. Crack patterns do not need to be imposed a priori at the start of the simulation and the technique
allows for the easier prediction of complex crack patterns, with features such crack coalescence and
branching than techniques such as extended finite element analysis (XFEM) [23, 24]. This is possible
since peridynamics utilises an integral approach to determine the displacement of material points rather
than a differential approach [25]. It is therefore able to model discontinuities in material properties and
displacement fields.
In peridynamics, a component is considered as being broken up into a number of ‘material points’. The
behaviour of each material point is dependent upon those in a horizon surrounding the material point,
not just its nearest neighbours. An example of this is shown in Figure 1.
Equation (1) gives an expression of Newton’s second law for a material point in a peridynamic body,
where ρ is the density and u the displacement the material point at position x as a result of interactions
between other material points at positions x′ within a horizon H, with volume Vx′.The first term
represents the internal forces, f, resulting from displacement at x′ and the second term represents
external forces, b(x), exerted on x itself.
𝜌 = ∫ [𝒇(𝒖(𝒙′) − 𝒖(𝒙), 𝒙′ − 𝒙)]𝑑𝑉𝑥′ + 𝒃(𝒙)
𝐻
(1)
Bond-based’ peridynamics, as shown in Figure 1, considers a number of bonds connecting a material
point to surrounding material points. The force function, f, can be expressed using (2) as a function of
the initial separation of the two ends of the bond, ξ, analogous to the bond length, and their relative
displacement, η. Expansion of the material due to either swelling or thermal expansion can be included
by ω whilst c is termed the ‘micro-modulus’ of the bond and represents the elastic response.
|𝒇| = 𝑐 (
|𝜼|
|𝝃|+ 𝜔)
(2)
𝜼 = 𝒖(𝒙′) − 𝒖(𝒙) 𝝃 = 𝒙′ − 𝒙′
These equations can be readily introduced into a finite element code [26-28] and the full range of
material properties available in a finite element model employed. For this reason, a bond-based
implementation of peridynamics in the commercial finite element code Abaqus 6.14 was chosen for
this work.
1.3 Modelling SiC/SiC Cladding Performance
A number of authors have sought to model the thermo-mechanical performance of SiC/SiC claddings
using both conventional fuel performance codes [11, 29, 30] and bespoke finite element based software
[31] under normal operation [30]. All of the authors reported significant stresses within the cladding,
particularly tensile stresses on the inner surface of the cladding. The tensile stresses are caused by
greater irradiation swelling on the outside surface of the cladding compared to the inner surface due to
the lower temperature of the outer surface. The magnitude of the stress increased under cold shutdown
conditions [30, 32] due to the removal of the thermal strain, which is greater on the inner surface. As
an example, Stone et al. give a hoop stress of +10 MPa on the inner surface and -180 MPa on the outer
surface at the end of the first power cycle; during the shut-down, the hoop stress increases to +190 and
-125 MPa respectively [32]. One of the key challenges to the use of an internal monolith is its structural
integrity under these tensile stresses [14, 33]. Outer monoliths are expected to remain in compression
and therefore not lose their integrity [14, 32]. More recently, Alabdullah and Ghoniem have shown

Page 4 of 33
using continuum damage mechanics, that damage is likely to occur on the inner surface of the cladding
[34].
In this paper, we applied an Abaqus-based implementation of bond-based peridynamics to capture in
more detail, the cracking behaviour of the material. Bond-based peridynamics was chosen for the
obvious similarity between the peridynamic bonds and fibres. It should however be remembered that
the fibres and bonds are at a different length scale. Although the material was treated as being isotropic
in this work, there is the possibility of including anisotropy at a later stage. The finite element code
Abaqus was employed so as to use as much of the code’s underlying capability as possible. Previous
work has shown that an Abaqus-based implementation of peridynamics is comparable in speed and
predictive capability to bespoke codes such as EMU [26].
We examined three possible cladding architectures (composite with an inner monolith, an outer
monolith and no monolith) and compare their fracture performance to a model in which fibre pull-out
was not included. Operating conditions were focused upon routine pressurised water reactor (PWR)
operations and include irradiation-induced swelling, degradation of cladding thermal conductivity and
thermal expansion.
Page 5 of 33
2 Methodology
2.1 Material Properties
2.1.1 Elastic Modulus
The Young’s modulus of bulk SiC/SiC cladding was assumed to be 282 GPa. This was based upon the
mechanical data obtained by Jacobsen [35] from expanding mandrel tests on prototype General Atomics
LWR claddings. In common with the work of Stone et al.[32], both of these values were assumed to be
isotropic. This data source was chosen as it includes the fracture properties of the specimens, however
the values are at the higher end of those reported in the literature. Koyanagi et al. report values of 200-
250 GPa for SiC/SiC composites [36]; Deck reports values of 278 GPa for cladding with an inner
monolith and 288GPa for an outer monolith; Katoh et al. [4] report values of 200-280 GPa across a
number of different loading orientations. Based upon the data provided by Katoh, Singh et al. [11] used
anisotropic values of 204 GPa in the axial and hoop directions and 280 GPa in the radial direction. In
addition, there is evidence that Young’s modulus decreases by around 20% during the expected lifetime
of SiC/SiC LWR fuel [37]. For simplicity and following the lead of Avincola et al.[33], the elastic
modulus of the monolith was set to twice that of the composite i.e. 564 GPa; the sensitivity to this
assumption is discussed in Section 3.5, as well as the sensitivity study in Section 3.8.3.
Bond-based peridynamics has an intrinsic fixed Poisson’s ratio of 0.25 for plane stress and 0.33 for
plane strain. The plane strain value was used in all simulations. Typical Poisson’s ratios reported in the
literature are 0.21 for monolithic material [38] and 0.13-0.25 for composite material [4]. Clearly
modelling a material using a Poisson’s ratio greater than that of the experimental value will have some
impact upon the stress state predicted. Given that the largest stresses in nuclear fuel cladding are in the
hoop direction [39], using an overly large Poisson’s ratio would result in the incorrect prediction of
stresses in the radial direction. However, given that the inner and outer surfaces are effectively free
surfaces and pellet-clad contact is not being considered, the impact of this is likely to be minor.
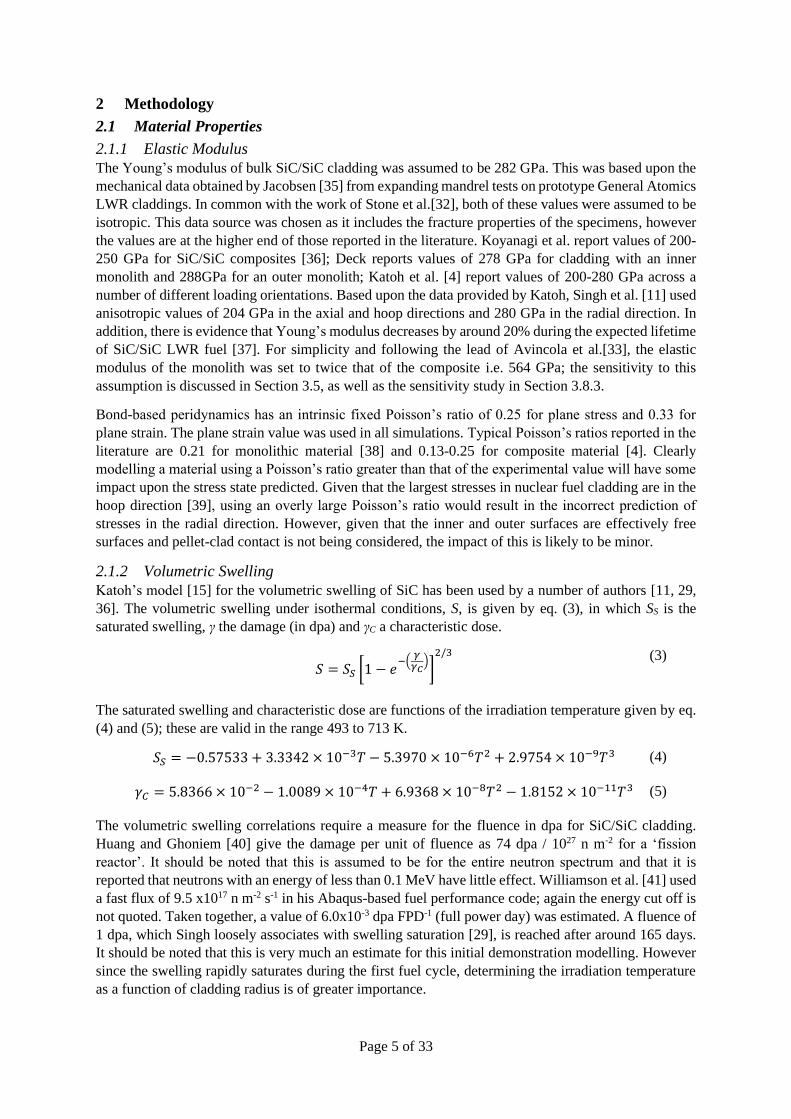
2.1.2 Volumetric Swelling
Katoh’s model [15] for the volumetric swelling of SiC has been used by a number of authors [11, 29,
36]. The volumetric swelling under isothermal conditions, S, is given by eq. (3), in which SS is the
saturated swelling, γ the damage (in dpa) and γC a characteristic dose.
𝑆 = 𝑆𝑆 [1 − 𝑒
−(𝛾𝛾𝐶
)]2/3
(3)
The saturated swelling and characteristic dose are functions of the irradiation temperature given by eq.
(4) and (5); these are valid in the range 493 to 713 K.
𝑆𝑆 = −0.57533 + 3.3342 × 10⁻³𝑇 − 5.3970 × 10⁻⁶𝑇2 + 2.9754 × 10⁻⁹𝑇3
(4)
𝛾𝐶 = 5.8366 × 10⁻² − 1.0089 × 10⁻⁴𝑇 + 6.9368 × 10⁻⁸𝑇2 − 1.8152 × 10⁻¹¹𝑇3
(5)
The volumetric swelling correlations require a measure for the fluence in dpa for SiC/SiC cladding.
Huang and Ghoniem [40] give the damage per unit of fluence as 74 dpa / 1027 n m-2 for a ‘fission
reactor’. It should be noted that this is assumed to be for the entire neutron spectrum and that it is
reported that neutrons with an energy of less than 0.1 MeV have little effect. Williamson et al. [41] used
a fast flux of 9.5 x10¹⁷ n m-2 s-1 in his Abaqus-based fuel performance code; again the energy cut off is
not quoted. Taken together, a value of 6.0x10⁻³ dpa FPD-1 (full power day) was estimated. A fluence of
1 dpa, which Singh loosely associates with swelling saturation [29], is reached after around 165 days.
It should be noted that this is very much an estimate for this initial demonstration modelling. However
since the swelling rapidly saturates during the first fuel cycle, determining the irradiation temperature
as a function of cladding radius is of greater importance.
Page 6 of 33
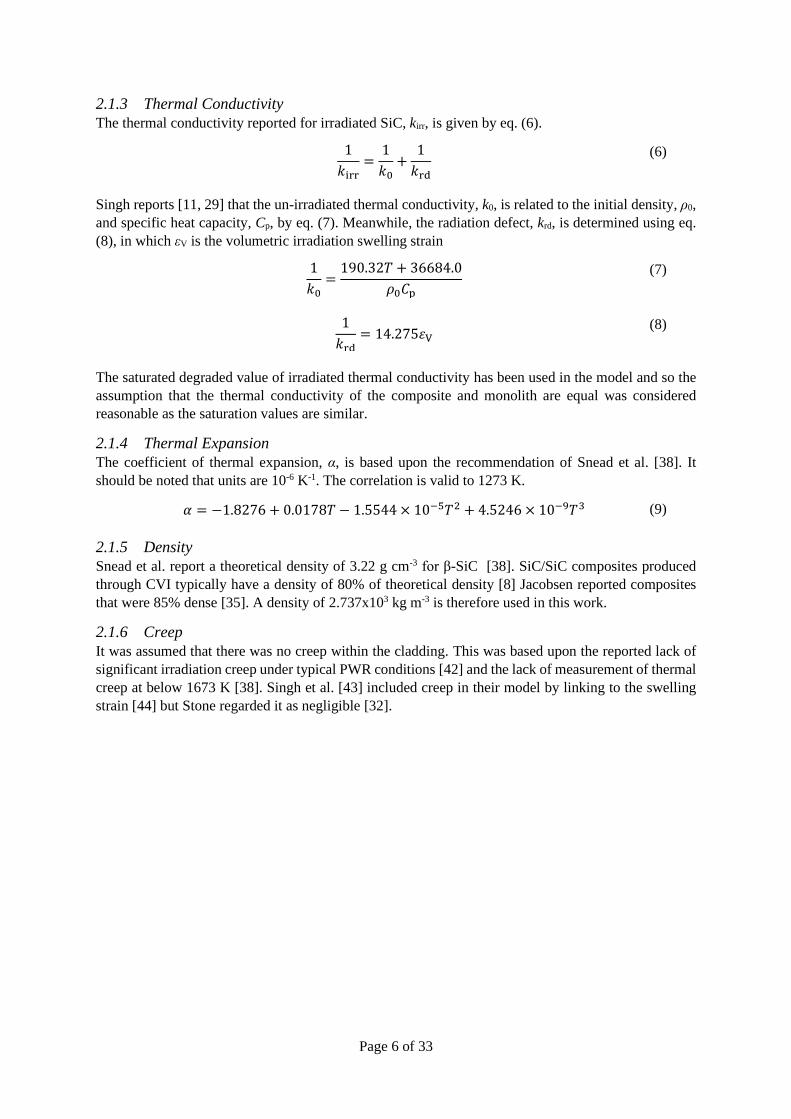
2.1.3 Thermal Conductivity
The thermal conductivity reported for irradiated SiC, kirr, is given by eq. (6).
1
𝑘irr=
1
𝑘0+
1
𝑘rd
(6)
Singh reports [11, 29] that the un-irradiated thermal conductivity, k0, is related to the initial density, ρ0,
and specific heat capacity, Cp, by eq. (7). Meanwhile, the radiation defect, krd, is determined using eq.
(8), in which εV is the volumetric irradiation swelling strain
1
𝑘0=190.32𝑇 + 36684.0
𝜌0𝐶p
(7)
1
𝑘rd= 14.275휀V
(8)
The saturated degraded value of irradiated thermal conductivity has been used in the model and so the
assumption that the thermal conductivity of the composite and monolith are equal was considered
reasonable as the saturation values are similar.
2.1.4 Thermal Expansion
The coefficient of thermal expansion, α, is based upon the recommendation of Snead et al. [38]. It
should be noted that units are 10-6 K-1. The correlation is valid to 1273 K.
𝛼 = −1.8276 + 0.0178𝑇 − 1.5544 × 10⁻⁵𝑇2 + 4.5246 × 10⁻⁹𝑇3
(9)
2.1.5 Density
Snead et al. report a theoretical density of 3.22 g cm-3 for β-SiC [38]. SiC/SiC composites produced
through CVI typically have a density of 80% of theoretical density [8] Jacobsen reported composites
that were 85% dense [35]. A density of 2.737x10³ kg m-3 is therefore used in this work.
2.1.6 Creep
It was assumed that there was no creep within the cladding. This was based upon the reported lack of
significant irradiation creep under typical PWR conditions [42] and the lack of measurement of thermal
creep at below 1673 K [38]. Singh et al. [43] included creep in their model by linking to the swelling
strain [44] but Stone regarded it as negligible [32].

Page 7 of 33
2.2 Peridynamics in a Finite Element Code
In this Abaqus-based implementation of peridynamics, each ‘material point’ is represented by nodes
and ‘truss elements’ represent bonds connecting the material points. Mass is associated with each
material point using the ‘*mass’ keyword to obtain the correct inertial response. The approach is shown
in Figure 1, which compares the Abaqus and peridynamics terminology.
Figure 1 – The construction of a bond-based peridynamics model in Abaqus. Peridynamic terms are shown in blue and finite
element terms in red.
The construction of the network of nodes and trusses is achieved using a mesh generation pre-processor
written in Fortran. The nodes, trusses, sets of nodes and their connectivity are written as separate input
files. Other files consist of an Abaqus input file that includes the input files produced by the mesh
generation program, a material properties file and a number of user-defined subroutines used by
Abaqus. It should be noted that the peridynamics implementation described here relies upon a regular
mesh – either hexagonal or rectangular.
2.3 Bond / Truss Properties
2.3.1 Elastic Modulus Truss Correction Factor
It is clear that the macroscopic elastic modulus of bulk material is not the same as that used for
individual trusses / bonds in a finite element code. The following theoretical basis of the correction
factor follows the work of Le and Bobaru [45], Macek and Silling [26], and Eringen et al. [46], as
discussed by Beckmann et al. [27].

Page 8 of 33
In Abaqus-based peridynamics, the bonds are represented by trusses; these have a cross-sectional area,
A. If the force on one end of the truss is F, the stress at the end of the truss, σ, is given by eq. (10).
𝜎 =
𝐹
𝐴
(10)
The truss elastic modulus, ET, may be determined from this stress and the strain, ε, using eq. (11). Note
that the truss elastic modulus is not the same as the bulk elastic modulus.
σ = 𝐸T휀
(11)
Substituting (10) into (11) and re-arranging yields (12).
𝐹 = 𝐸T𝐴휀
(12)
At this juncture, it should be noted that different authors allocate different areas to the trusses. In this
work, the area of a truss is set to the nodal spacing, n, multiplied by the sample thickness, τ. This gives
(13)
𝐹 = 𝐸T𝑛𝜏휀
(13)
In two dimensional peridynamics, the micro-modulus is given by eq. (14) [taken from [27]], in which
δ is the horizon radius and E is the elastic modulus of bulk material. In a 2D bond-based peridynamics
model, Poisson’s ratio is restricted to 1/3 in plane stress and in plane strain to 1/4.
𝑐2D =
12𝐸
π𝛿3𝜏(1 + 𝜐)
(14)
Using (2), in the elastic case, the force function, f, can be defined using (15)
𝑓 = 𝑐2D
|𝜼|
|𝝃|
(15)
Examining (1), it can be seen that the force function in 2D has units of force per unit volume squared,
where the volume is that of a material point. The force on a node is therefore given by (16).
𝐹 = 𝑓𝑉2 = 𝑐2D
|𝜼|
|𝝃|𝑉2
(16)
The volume of a material point, V, is given by (17).
𝑉 = 𝑛2𝜏
(17)
Substituting (17) into (16) gives (18).
𝐹 = 𝑐2D
|𝜼|
|𝝃|𝑛4𝜏2
(18)
The ratio of the relative displacement of the nodes to their initial separation is equivalent to the
engineering strain. (18) therefore becomes (19).
𝐹 = 𝑐2D휀𝑛4𝜏2
(19)
Equating (13) and (19) gives (20).
Page 9 of 33
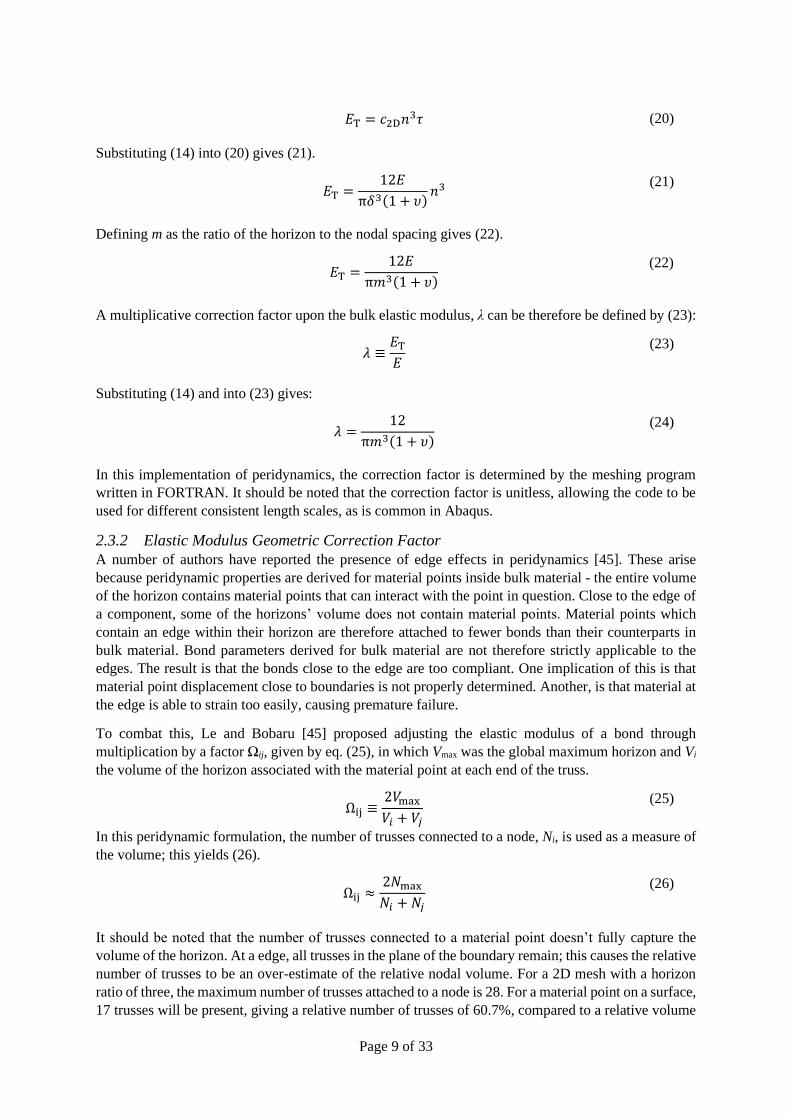
Substituting (14) into (20) gives (21).
𝐸T =
12𝐸
π𝛿3(1 + 𝜐)𝑛3
(21)
Defining m as the ratio of the horizon to the nodal spacing gives (22).
𝐸T =
12𝐸
π𝑚3(1 + 𝜐)
(22)
A multiplicative correction factor upon the bulk elastic modulus, λ can be therefore be defined by (23):
𝜆 ≡
𝐸T𝐸
(23)
Substituting (14) and into (23) gives:
𝜆 =
12
π𝑚3(1 + 𝜐)
(24)
In this implementation of peridynamics, the correction factor is determined by the meshing program
written in FORTRAN. It should be noted that the correction factor is unitless, allowing the code to be
used for different consistent length scales, as is common in Abaqus.
2.3.2 Elastic Modulus Geometric Correction Factor
A number of authors have reported the presence of edge effects in peridynamics [45]. These arise
because peridynamic properties are derived for material points inside bulk material - the entire volume
of the horizon contains material points that can interact with the point in question. Close to the edge of
a component, some of the horizons’ volume does not contain material points. Material points which
contain an edge within their horizon are therefore attached to fewer bonds than their counterparts in
bulk material. Bond parameters derived for bulk material are not therefore strictly applicable to the
edges. The result is that the bonds close to the edge are too compliant. One implication of this is that
material point displacement close to boundaries is not properly determined. Another, is that material at
the edge is able to strain too easily, causing premature failure.
To combat this, Le and Bobaru [45] proposed adjusting the elastic modulus of a bond through
multiplication by a factor Ωij, given by eq. (25), in which Vmax was the global maximum horizon and Vi
the volume of the horizon associated with the material point at each end of the truss.
Ωij ≡
2𝑉max
𝑉𝑖 + 𝑉𝑗
(25)
In this peridynamic formulation, the number of trusses connected to a node, Ni, is used as a measure of
the volume; this yields (26).
Ωij ≈
2𝑁max
𝑁𝑖 +𝑁𝑗
(26)
It should be noted that the number of trusses connected to a material point doesn’t fully capture the
volume of the horizon. At a edge, all trusses in the plane of the boundary remain; this causes the relative
number of trusses to be an over-estimate of the relative nodal volume. For a 2D mesh with a horizon
ratio of three, the maximum number of trusses attached to a node is 28. For a material point on a surface,
17 trusses will be present, giving a relative number of trusses of 60.7%, compared to a relative volume
𝐸T = 𝑐2D𝑛3𝜏
(20)
Page 10 of 33
of 50%. At a corner, 10 trusses will be present, giving a relative number of trusses of 35.7%, compared
to a relative volume of 25%. The material point volume is therefore over-estimated by around 11%.
Increasing the horizon ratio to four reduces the over-estimate to around 8% but at the expense of
significant additional computational cost.
2.4 Material Point / Node Properties
In peridynamics, mass is normally associated with material points, represented by nodes in the Abaqus
implementation. Correctly assigning the mass to material points is important so that their displacement
and the resulting crack pattern is correct.
Abaqus does however require some mass to be allocated to the trusses, despite the bonds being massless
in peridynamics. In our model, 99% of the mass of the component is allocated to the nodes and 1% to
the trusses. The nodal mass (in tonne for Abaqus’s mm unit scale) is determined by the meshing pre-
processor using the material density, nodal spacing, cross sectional area and thickness.
The density of the trusses, ρtruss, is set by the meshing pre-processor by applying eq. (27), in which Li is
the length of each truss in the model, A the cross-sectional area of the component and ρ0, the bulk
density.
𝜌truss = 0.01𝜌0
𝐴
𝑛∑ 𝐿𝑖𝑖
(27)
The temperature of each node was set by the simple application of the diffusion equation, assuming that
the component was in thermal equilibrium. The thermal conductivity of the cladding was taken to be
the average of the thermal conductivity of each node connected to it, the latter is dependent upon both
the temperature and irradiation swelling.
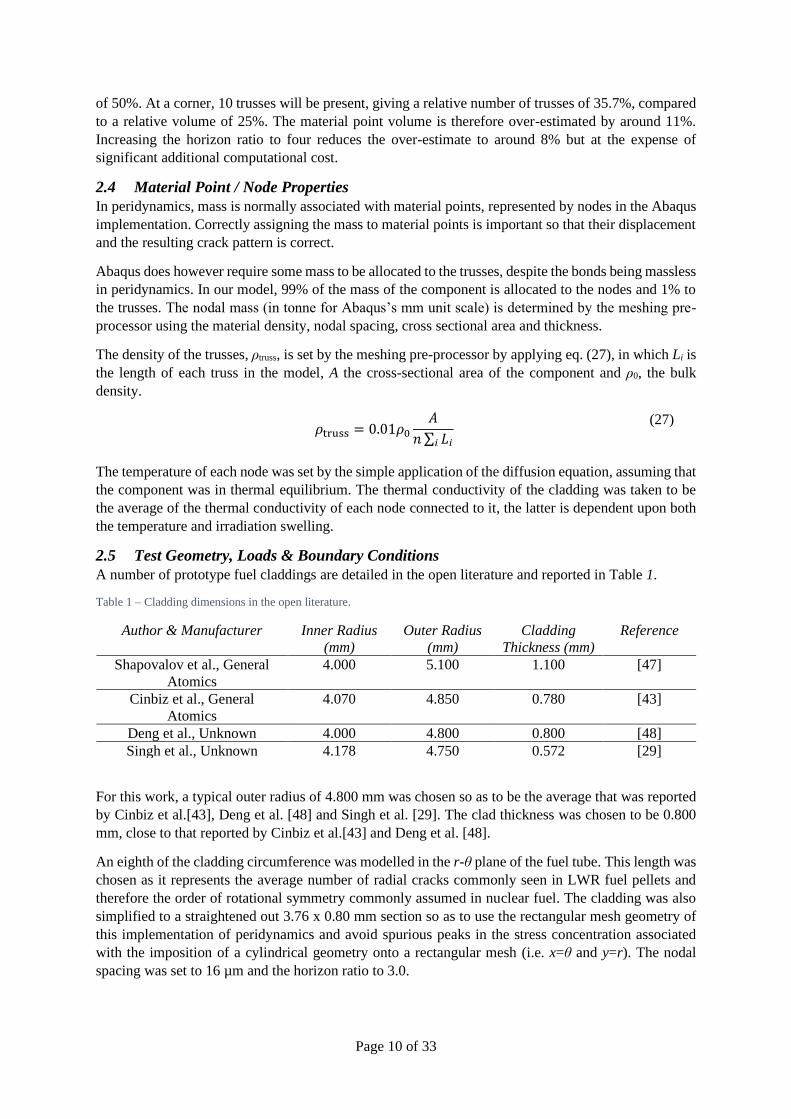
2.5 Test Geometry, Loads & Boundary Conditions
A number of prototype fuel claddings are detailed in the open literature and reported in Table 1.
Table 1 – Cladding dimensions in the open literature.
Author & Manufacturer Inner Radius
(mm)
Outer Radius
(mm)
Cladding
Thickness (mm)
Reference
Shapovalov et al., General
Atomics
4.000 5.100 1.100 [47]
Cinbiz et al., General
Atomics
4.070 4.850 0.780 [43]
Deng et al., Unknown 4.000 4.800 0.800 [48]
Singh et al., Unknown 4.178 4.750 0.572 [29]
For this work, a typical outer radius of 4.800 mm was chosen so as to be the average that was reported
by Cinbiz et al.[43], Deng et al. [48] and Singh et al. [29]. The clad thickness was chosen to be 0.800
mm, close to that reported by Cinbiz et al.[43] and Deng et al. [48].
An eighth of the cladding circumference was modelled in the r-θ plane of the fuel tube. This length was
chosen as it represents the average number of radial cracks commonly seen in LWR fuel pellets and
therefore the order of rotational symmetry commonly assumed in nuclear fuel. The cladding was also
simplified to a straightened out 3.76 x 0.80 mm section so as to use the rectangular mesh geometry of
this implementation of peridynamics and avoid spurious peaks in the stress concentration associated
with the imposition of a cylindrical geometry onto a rectangular mesh (i.e. x=θ and y=r). The nodal
spacing was set to 16 µm and the horizon ratio to 3.0.

Page 11 of 33
Figure 2 shows the loads and boundary conditions applied to the model. Nodes on the left hand edge
were constrained to have zero displacement in the x direction; nodes on the bottom edge were
constrained to have zero displacement in the y direction; and, all nodes on the right hand edge were
constrained to have the same displacement in the x direction, representing the constraint imposed by
cladding continuity.
A force of 68.2 N was applied evenly between the right-hand nodes to represent the mean hoop stress
due to a coolant pressure of 15.5 MPa whilst the reactor was pressurised. Pin internal pressurisation
was neglected as this was considered a secondary effect. This was because fission gas release was
assumed to be low during early fuel cycles not exposed to accident conditions; Bratton et al. have shown
that the rod internal pressure reaches no more than 6-7 MPa by end of life [49].
Figure 2 - The loads and boundary conditions applied to the model. It should be noted that the mesh is shown as ten times as
coarse as that employed.
Given that the mechanical response is of concern here, a simple linear temperature profile was applied
as a boundary condition to the nodes. This was based upon the surface heat flux on the inner surface
derived from the linear rating; the cladding surface temperature; and, the thermal conductivity averaged
across the model.
The rectangular mesh used in this model and the assumption of plane strain represents a significant
approximation to the multiaxial stress likely to be present in the cladding. Both of these can be explained
with reference to Figure 15 in Singh et al. [11]. This showed that:
• The hoop and axial stresses varied considerably across the radial thickness of the cladding. At
the end of life, the hoop stress is around 75 MPa on the inner surface and -50 MPa on the
outside.
• The magnitude of the radial stress showed little variation with either radius or time, staying
below 5 MPa.
• The hoop stress bounded that of the axial stress and its magnitude was typically 50% bigger.
For these reasons, modelling focused upon capturing the impact of the varying hoop stress with cladding
radius. The relatively small radial stress can be argued to support the assumptions of both plane strain
and modelling a cylindrical body as a rectangular piece of material.
2.6 Composite Fracture Model
The following data was obtained by Jacobsen et al. [35] from tests on prototype General Atomics
composites and used as the basis for the fracture response:
• An elastic modulus, E, of 282 GPa for composites.
• A proportional limit stress, σPLS, of 182 MPa. This implies a proportional limit strain, εPLS, of
6.5x10⁻⁴ for composite regions.
Page 12 of 33
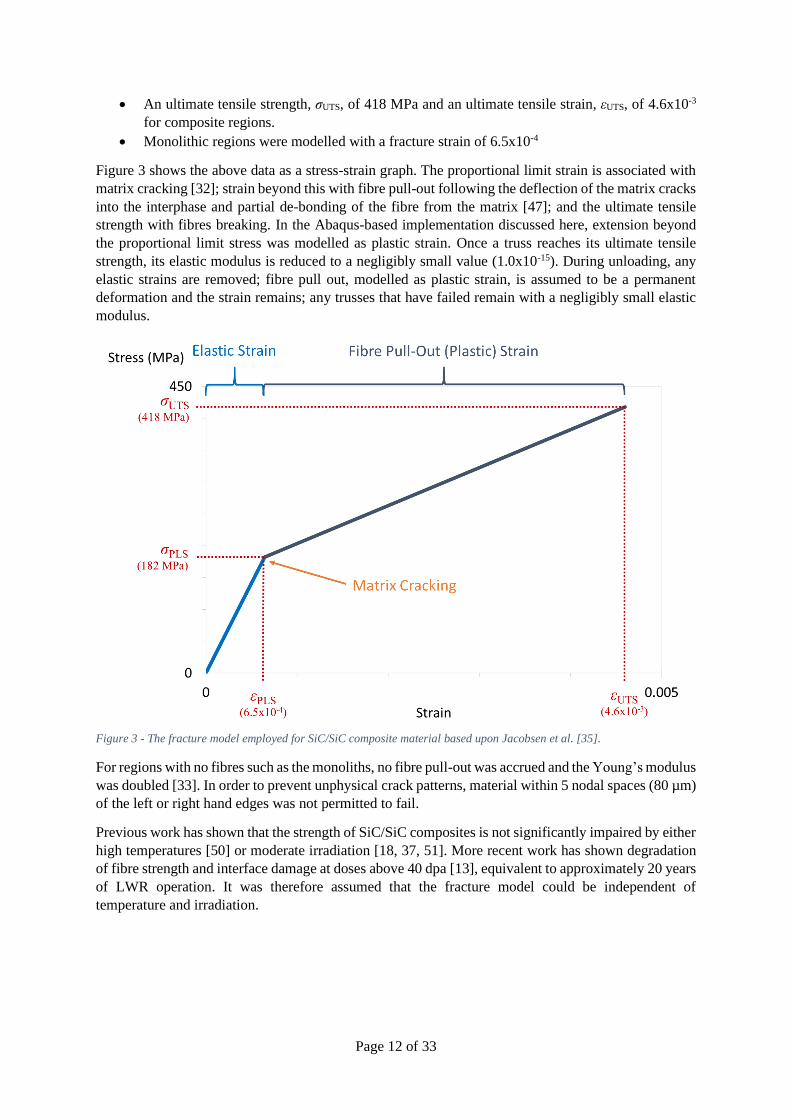
• An ultimate tensile strength, σUTS, of 418 MPa and an ultimate tensile strain, εUTS, of 4.6x10⁻³
for composite regions.
• Monolithic regions were modelled with a fracture strain of 6.5x10⁻⁴
Figure 3 shows the above data as a stress-strain graph. The proportional limit strain is associated with
matrix cracking [32]; strain beyond this with fibre pull-out following the deflection of the matrix cracks
into the interphase and partial de-bonding of the fibre from the matrix [47]; and the ultimate tensile
strength with fibres breaking. In the Abaqus-based implementation discussed here, extension beyond
the proportional limit stress was modelled as plastic strain. Once a truss reaches its ultimate tensile
strength, its elastic modulus is reduced to a negligibly small value (1.0x10⁻¹⁵). During unloading, any
elastic strains are removed; fibre pull out, modelled as plastic strain, is assumed to be a permanent
deformation and the strain remains; any trusses that have failed remain with a negligibly small elastic
modulus.
Figure 3 - The fracture model employed for SiC/SiC composite material based upon Jacobsen et al. [35].
For regions with no fibres such as the monoliths, no fibre pull-out was accrued and the Young’s modulus
was doubled [33]. In order to prevent unphysical crack patterns, material within 5 nodal spaces (80 µm)
of the left or right hand edges was not permitted to fail.
Previous work has shown that the strength of SiC/SiC composites is not significantly impaired by either
high temperatures [50] or moderate irradiation [18, 37, 51]. More recent work has shown degradation
of fibre strength and interface damage at doses above 40 dpa [13], equivalent to approximately 20 years
of LWR operation. It was therefore assumed that the fracture model could be independent of
temperature and irradiation.

Page 13 of 33
2.7 Operating Conditions
A set of operating conditions was chosen to reflect operation in a typical PWR. The steps applied to the
model are shown in Figure 4 and compose of the following; all changes were applied linearly over the
timestep:
1. A warm up in the fuel ponds from 293.15 K [room temperature] to 323.15 K [50 ºC] over
3600 s [1 hour]; this reflects the elevated temperature of the fuelling ponds.
2. A rise in the cladding surface temperature to 566.15 K [293 ºC] over 1.728x10⁵ s [2 days] to
represent frictional heating due to the flow of coolant. The total force due to the hoop stress
caused by the coolant pressure was increased to 68.2 N [appropriate to a coolant pressure of
15.5 MPa] over the same period. During this period, the force due to reactor pressurisation was
linearly increased.
3. A rise in the cladding surface temperature to 596.65 K [323.5 ºC] and the surface heat flux to
6.51x10⁵ W m-2 [corresponding to a linear heat rate of 18.0 kW m-1] over 8.64x10⁴ s [1 day].
4. A hold for 4.5x10⁷ s, representing a 18 month fuel cycle.
5. A decrease in the cladding surface temperature to 566.15 K [293 ºC] over 7200 s [2 hours] and
removal of the surface heat flux. This represents a reactor shut-down.
6. A decrease in the cladding surface temperature to 323.15 K [50 ºC] over 1.728x10⁵ s [2 days].
This represents cooling of the reactor-core. During this period, the force due to reactor
pressurisation was linearly decreased to zero.
7. A hold for 6.0 x10⁶ s [10 weeks]. This represents a typical PWR refuelling outage.
Steps 2-4 are then repeated to model a second fuel cycle.
Figure 4 – A schematic of the temperature imposed on the cladding outer surface and the linear power rating.
2.8 Architectures Modelled
In addition to plane strain and plane stress finite element models used for benchmarking, four
peridynamics models were run, representing different scenarios and architectures:
1. A model with no bond failure; the cladding took the properties of the composite. This was used
for benchmarking against the finite element models for purely elastic, thermal and swelling
responses. For these tests, the Young’s modulus was simply that of the composite.
2. A model with no fibre pull-out. The cladding took the properties of the composite until matrix
cracking occurred and the bonds broke.
3. A model with fibre pull-out; once matrix cracking occurred, the bonds deformed further to
model fibre pull-out. This was used to assess the importance of fibre pull-out in the structural
integrity of the cladding.

Page 14 of 33
4. A model representing cladding with an inner monolith, in which fibre pull-out was allowed in
the outer 2/3 of cladding. The Young’s modulus of the monolith was twice that of the
composite.
5. A model representing cladding with an outer monolith, in which fibre pull-out was allowed in
the inner 2/3 of cladding. The Young’s modulus of the monolith was twice that of the
composite.
The choice of monolith thickness reflects the values reported by Deck et al. [8].
2.9 Step Type & Incrementation
One of the advantages of Abaqus-based peridynamics is that implicit integration can be used for periods
when material properties and loads are evolving slowly and the time step reduces automatically during
fracture [27]. In this work, a dynamic implicit step was used with non-linear geometry. During full
power operation, the maximum increment length was a day. During the down-rate, the minimum
increment reached was 600 ps.

Page 15 of 33
3 Results & Discussion
3.1 Comparison of Finite Element and Peridynamic Models
The purpose of this sub-section is to demonstrate that the thermal and mechanical models in
peridynamics produces results comparable with a finite element model. Figure 5 shows the temperature
on the inside and outside of the cladding throughout the simulation predicted for both the finite element
and peridynamic models. Upon the initial rise to power, the temperature drop across the cladding was
similar for the finite element and peridynamic models at 31 and 40 K respectively. Over the next
approximately 100 days, the temperature on the inner surface increases due to decreasing thermal
conductivity with volumetric swelling. Just prior to the outage, the temperature drop across the cladding
was 145 K for the finite element model and 151 K for the peridynamic model. The difference between
the values predicted by finite element and peridynamics models is likely due to the averaging of the
thermal conductivity across the cladding for the peridynamic model. Singh et al. reported [11] that the
temperature on the inner surface increased over a period of ‘around four months’ and that the steady
state temperature drop across the cladding was just under 200 K. It should be noted however that Singh
et al. used a linear power of 35 kW m-1, rather than the 18 kW m-1 considered here. It can therefore be
argued that the thermal behaviour predicted by the peridynamic model is broadly similar to both the
equivalent finite element model and those reported in the literature.
Figure 5 - The temperature imposed on the cladding outer surface and predicted on the inner surface using the finite element
and peridynamic models.

Page 16 of 33
Figure 6 shows the displacement in each direction for the peridynamic model with no fracture, plane
stress finite element model and plane strain finite element model. In the x (hoop) direction, the
displacement of the peridynamic and plane strain models are within close agreement; at the end of the
hold at full power the displacements are 32.0 and 32.5 µm respectively, a difference of 1.5%. In the y
(radial) direction, the difference is similar at 0.4 µm or 5.5 %. This is reassuring since we are attempting
to model the cladding using peridynamics under conditions approximating to plane strain. The
displacement in the plane stress finite element model is somewhat lower due to the ability for swelling
and thermal expansion to occur out of plane (in the z or vertical direction).
Figure 6 - The maximum displacement in (a), the hoop [x] direction and (b), the radial [y] direction for the peridynamic model
with no fracture, plane stress finite element model and plane strain finite element model.
Whilst the peridynamic model gives good agreement with a plane strain finite element model, it should
be remembered that plane strain does not necessarily reflect the stress state inside nuclear fuel cladding.
Prior to contact between the cladding and fuel pellets, it could be argued that the cladding will be in a
state closer to that of generalised plane strain. Following contact, which is likely to be later in fuel life
for SiC/SiC cladding than traditional zirconium-based alloys due to a lower creep rate and greater
swelling, the stress state in the cladding is likely to become tri-axial and concentrated to regions ahead
of pellet cracks [39].

Page 17 of 33
3.2 Cladding Stress State through Irradiation
Figure 7 shows components of the total, thermal and swelling strain in the x (hoop) direction, together
with the stress component on the inner and outer surface of the plane strain finite element model. Firstly,
it should be noted that the total strain on the inner and outer surface is constrained to be equal due to
material continuity and the boundary conditions applied to the model. The swelling is greater on the
outer surface than the inner surface due to the lower irradiation temperature. The thermal strain is greater
on the inner than outer surface and increases due to the degradation of thermal conductivity with
swelling. Since the difference between the swelling strains on the two surfaces becomes greater than
between the thermal strains on the two surfaces, a tensile hoop stress is generated on the inner surface
and compressive stress on the outer surface.
During the reduction in power prior to the refuelling outage, the thermal strain is reduced and the tensile
and compressive stresses upon the inner and outer surfaces increase in magnitude. The peak hoop stress
is therefore reached on the inner surface during the decrease in power. This analysis of the stress state
in the cladding agrees well with that reported by other authors [11, 32].
Figure 7 – The (a), components of the total, thermal and swelling strain in, the hoop (x) direction, together with (b), the stress
component on the inner and outer surface from the plane strain finite element model.
As an aside, the hoop stresses of hundreds of MPa shown in Figure 7(b) show that the relative impact
of neglecting the pin internal pressure, of no more than 6-7 MPa, is likely to be minimal.

Page 18 of 33
3.3 Cracking with No Fibre Pull-Out
Figure 8 shows the development of cracking in the peridynamic simulation with no fibre pull-out. This
is a slightly hypothetical model in which the material takes composite properties, but cracks propagate
once the proportional limit stress is reached and the matrix cracks. As mentioned previously, the model
was built primarily for benchmarking against the finite element model. Cracks form close to the start
of the decrease in power at the start of the outage. The cracks initiate on the inner surface and quickly
grow, i.e. within a fraction of a second, through to the outer surface. The benefit of using peridynamics
to model fracture is clear – crack branching and the lack of retardation during the initial wave of
cracking compared to slow cracking with no branching would be hard to predict with alternative
methods. Of interest, the model predicts around four cracks along the segment of cladding and so
estimates that 32 cracks would be predicted in a section of cladding.
Figure 8 – Crack development during the decrease in power at the start of the outage for the peridynamic model with no fibre
pull-out. Red regions indicate cracking and the temperatures shown are the outer surface temperaure.
Page 19 of 33
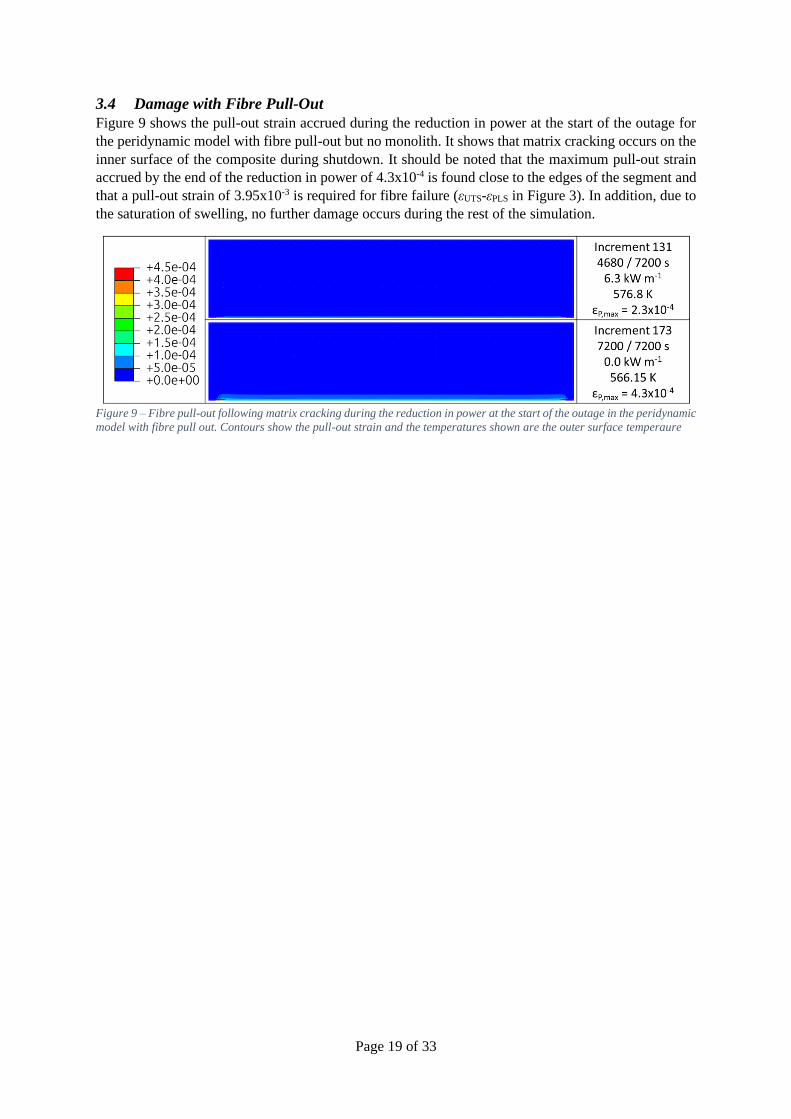
3.4 Damage with Fibre Pull-Out
Figure 9 shows the pull-out strain accrued during the reduction in power at the start of the outage for
the peridynamic model with fibre pull-out but no monolith. It shows that matrix cracking occurs on the
inner surface of the composite during shutdown. It should be noted that the maximum pull-out strain
accrued by the end of the reduction in power of 4.3x10⁻⁴ is found close to the edges of the segment and
that a pull-out strain of 3.95x10⁻³ is required for fibre failure (εUTS-εPLS in Figure 3). In addition, due to
the saturation of swelling, no further damage occurs during the rest of the simulation.
Figure 9 – Fibre pull-out following matrix cracking during the reduction in power at the start of the outage in the peridynamic
model with fibre pull out. Contours show the pull-out strain and the temperatures shown are the outer surface temperaure

Page 20 of 33
3.5 The Impact of an Inner Monolith
Figure 10 shows the development of cracking in the peridynamic model with an inner monolith of
material during the decrease in power. Cracks initiate on the inner surface of the cladding at 20.6 s and
propagate towards the outer surface at 50.0s. When they reach the region containing fibres, the cracks
stop propagating radially and are deflected 90º along the monolith-composite boundary in both
directions. In this simulation, the cracks did not coalesce and the monolith did not detach. However,
this indicates with an inner monolith only, gas will potentially be able to percolate through the macro-
cracks in the monolith, and subsequently the more porous and potentially micro-cracked composite. At
the monolith-composite interface, a crack propagating from the inner surface will approach a region in
which greater strains can be accrued and the Young’s modulus is much lower. This will cause greater
strain in the composite region than the monolith region and the stretching bonds not parallel or
perpendicular to the interface. The result is perhaps a local shear stress causing crack deflection. A
number of authors have used a lower elastic modulus for the monolith than the value of 564 GPa used
in this work. Using an elastic modulus of 460 GPa, as per Stone et al. [32], gives initial cracking of the
monolith a little earlier, at 41.3 s. Cracking early in the down-rate might be surprising; Section 3.7
investigates the sensitivity of crack initiation to reactor operating power.
Figure 10 – Crack development during the decrease in power at the start of the outage for the peridynamic model with an
inner monolith. Red regions indicate cracking and the temperatures shown are the outer surface temperaure.
Figure 11 shows the fibre pull-out strain in the fibres above the monolith. Fibre pull-out strains are
concentrated in regions just ahead of cracks in the inner monolith. Matrix cracking extends into the
composite region above these cracks; the fibre pull-out strains however remain around a third of that
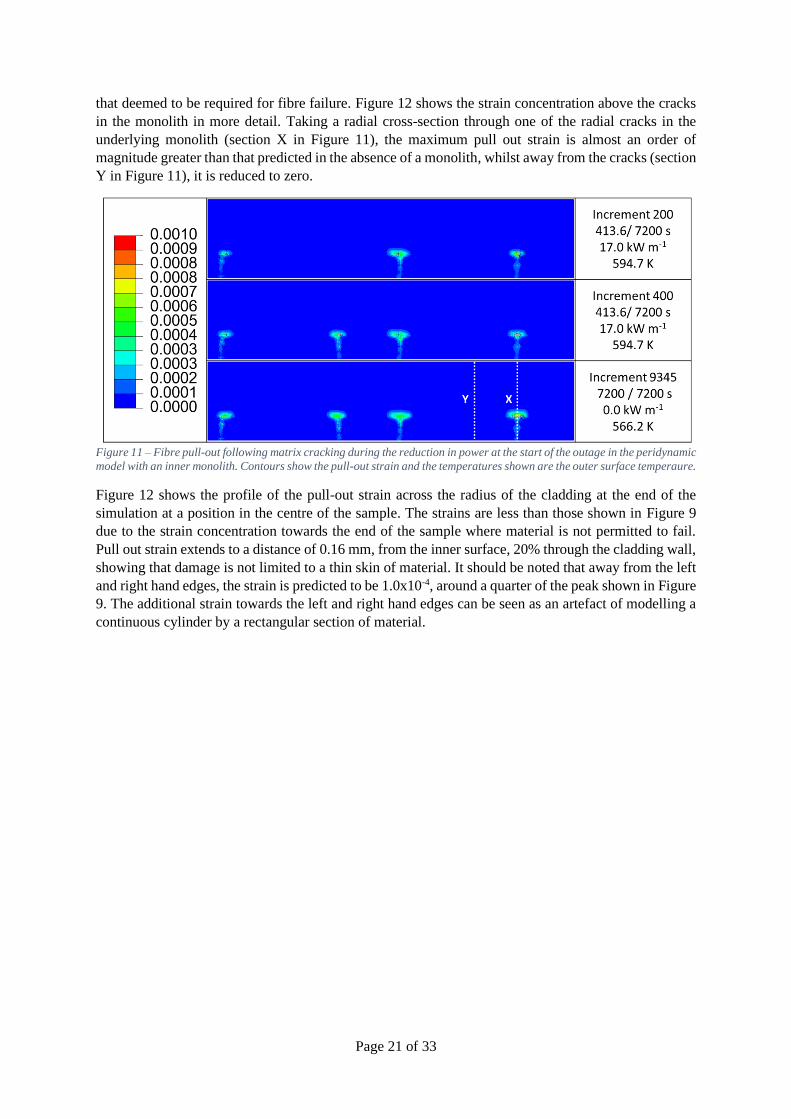
Page 21 of 33
that deemed to be required for fibre failure. Figure 12 shows the strain concentration above the cracks
in the monolith in more detail. Taking a radial cross-section through one of the radial cracks in the
underlying monolith (section X in Figure 11), the maximum pull out strain is almost an order of
magnitude greater than that predicted in the absence of a monolith, whilst away from the cracks (section
Y in Figure 11), it is reduced to zero.
Figure 11 – Fibre pull-out following matrix cracking during the reduction in power at the start of the outage in the peridynamic
model with an inner monolith. Contours show the pull-out strain and the temperatures shown are the outer surface temperaure.
Figure 12 shows the profile of the pull-out strain across the radius of the cladding at the end of the
simulation at a position in the centre of the sample. The strains are less than those shown in Figure 9
due to the strain concentration towards the end of the sample where material is not permitted to fail.
Pull out strain extends to a distance of 0.16 mm, from the inner surface, 20% through the cladding wall,
showing that damage is not limited to a thin skin of material. It should be noted that away from the left
and right hand edges, the strain is predicted to be 1.0x10⁻⁴, around a quarter of the peak shown in Figure
9. The additional strain towards the left and right hand edges can be seen as an artefact of modelling a
continuous cylinder by a rectangular section of material.

Page 22 of 33
Figure 12 – Fibre pull-out strain across the radius of the cladding at the end of the simulation at a position in the centre of
the sample with no inner monolith, ahead of a radial crack in the monolith (section X in Figure 11) and away from a radial
crack in the monolith (section Y in Figure 11).
3.6 The Impact of an Outer Monolith
Simulations carried out using an outer monolith did not reveal any cracking in the monolith. The fibre
pull-out strains on the inner surface were however just under 70% higher than those observed in the
absence of a monolith (1.7310x10⁻⁴ compared to 1.03x10⁻⁴). This is due to the increased elastic modulus
and therefore constraint of the outer monolith. It can therefore be argued that based upon the operating
conditions modelled here, the outer monolith will remain intact and presumably gas tight during
operation but give rise to greater strains on the inner surface of the cladding.
3.7 Sensitivity to Operating Conditions
To determine the sensitivity of the model to the assumed operating conditions, three power levels (9,
27 and 36 kW m-1) were chosen in addition to the default steady state power level of 18 kW m-1. The
values of 50% and 150% of the default power represent low and high power positions in the core. The
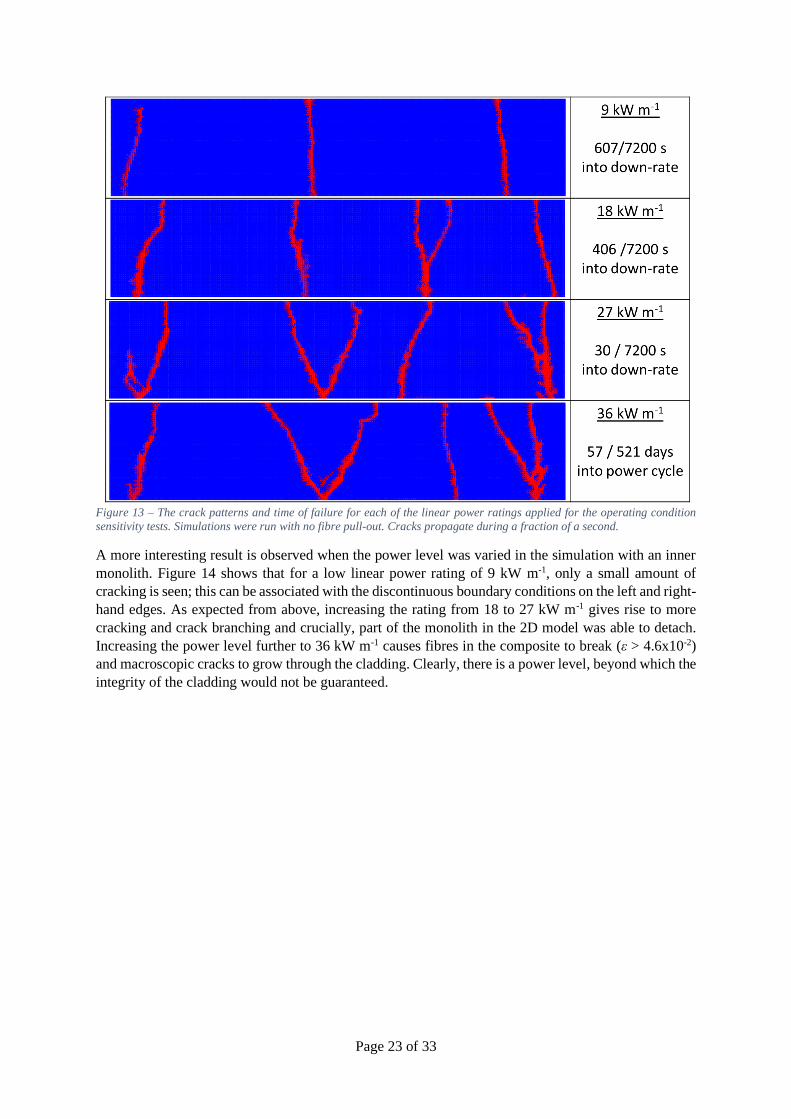
value of 36 kW m-1 reflects that employed by Singh et al. [11]. Figure 13 shows the crack patterns and
time of failure for each of the linear power ratings applied for simulations with no fibre pull-out. As the
linear power rating increases, cracking occurs progressively earlier and for the simulation at
36 kW m-1, it occurs 57 days into the first power cycle. This is due to the greater temperature on the
cladding inner surface and therefore lower swelling and greater hoop stress at this point. Of interest, the
simulations that show failure during the decrease in power seem to suggest increased branching with
Although not shown here for brevity, models with fibre pull-out modelled showed greater pull-out
strains, deeper into the cladding with greater linear ratings. At a linear power rating of 36 kW m-1, the
maximum pull-out strain was 1.2x10⁻³ with strain to a depth of 0.29 mm into the 0.8 mm cladding,
compared to the maximum pull-out strain of 1.0x10⁻⁴ with strain to a depth of 0.16 mm at a rating of
18 kW m-1. Both of these values should be compared to a failure strain of 4.6x10⁻².
Page 23 of 33
Figure 13 – The crack patterns and time of failure for each of the linear power ratings applied for the operating condition
sensitivity tests. Simulations were run with no fibre pull-out. Cracks propagate during a fraction of a second.
A more interesting result is observed when the power level was varied in the simulation with an inner
monolith. Figure 14 shows that for a low linear power rating of 9 kW m-1, only a small amount of
cracking is seen; this can be associated with the discontinuous boundary conditions on the left and right-
hand edges. As expected from above, increasing the rating from 18 to 27 kW m-1 gives rise to more
cracking and crack branching and crucially, part of the monolith in the 2D model was able to detach.
Increasing the power level further to 36 kW m-1 causes fibres in the composite to break (ε > 4.6x10⁻²)
and macroscopic cracks to grow through the cladding. Clearly, there is a power level, beyond which the
integrity of the cladding would not be guaranteed.

Page 24 of 33
Figure 14 – The crack patterns for each of the linear ratings applied for the operating condition sensitivity for simulations
with an inner monolith. No cracks initiated at a power level of 9 kW m-1, whilst cracks propagated into the composite from
the monolith at 36 kW m-1.
Page 25 of 33
3.8 Sensitivity to Input Parameters
3.8.1 Nodal Spacing
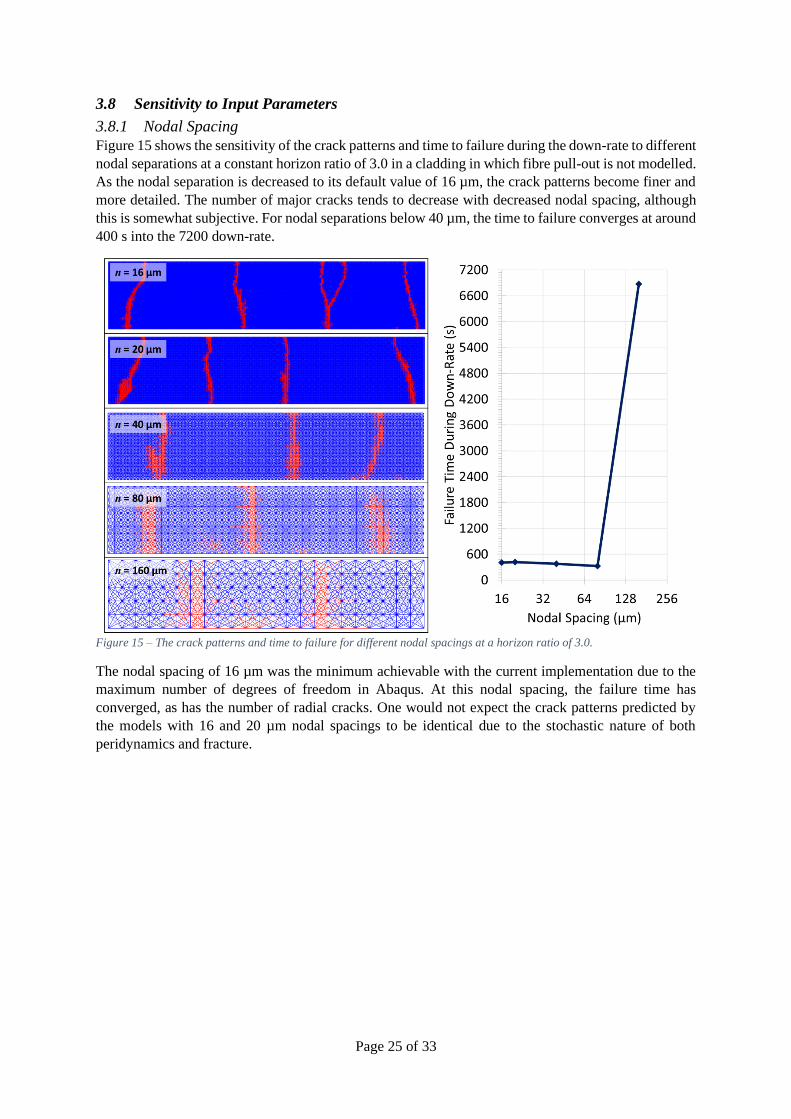
Figure 15 shows the sensitivity of the crack patterns and time to failure during the down-rate to different
nodal separations at a constant horizon ratio of 3.0 in a cladding in which fibre pull-out is not modelled.
As the nodal separation is decreased to its default value of 16 µm, the crack patterns become finer and
more detailed. The number of major cracks tends to decrease with decreased nodal spacing, although
this is somewhat subjective. For nodal separations below 40 µm, the time to failure converges at around
400 s into the 7200 down-rate.
Figure 15 – The crack patterns and time to failure for different nodal spacings at a horizon ratio of 3.0.
The nodal spacing of 16 µm was the minimum achievable with the current implementation due to the
maximum number of degrees of freedom in Abaqus. At this nodal spacing, the failure time has
converged, as has the number of radial cracks. One would not expect the crack patterns predicted by
the models with 16 and 20 µm nodal spacings to be identical due to the stochastic nature of both
peridynamics and fracture.

Page 26 of 33
3.8.2 Horizon Ratio
Figure 16 shows the sensitivity of the crack patterns and time to failure during the down-rate to different
horizon ratios at a nodal spacing of 16 µm. As the horizon ratio is increased, the crack patterns become
less detailed due to there being fewer horizons in the material. Apart from a horizon ratio of 2.0, the
number of major cracks remains constant at three. The time to failure does not follow a clear trend, but
seems to be lowest at the horizon ratios of 3.0 and 4.0, which are most commonly used by the
community.
Figure 16 – The crack patterns and time to failure for different horizon ratios at a constant nodal spacing of 40 µm.
Page 27 of 33
3.8.3 Monolith Elastic Modulus
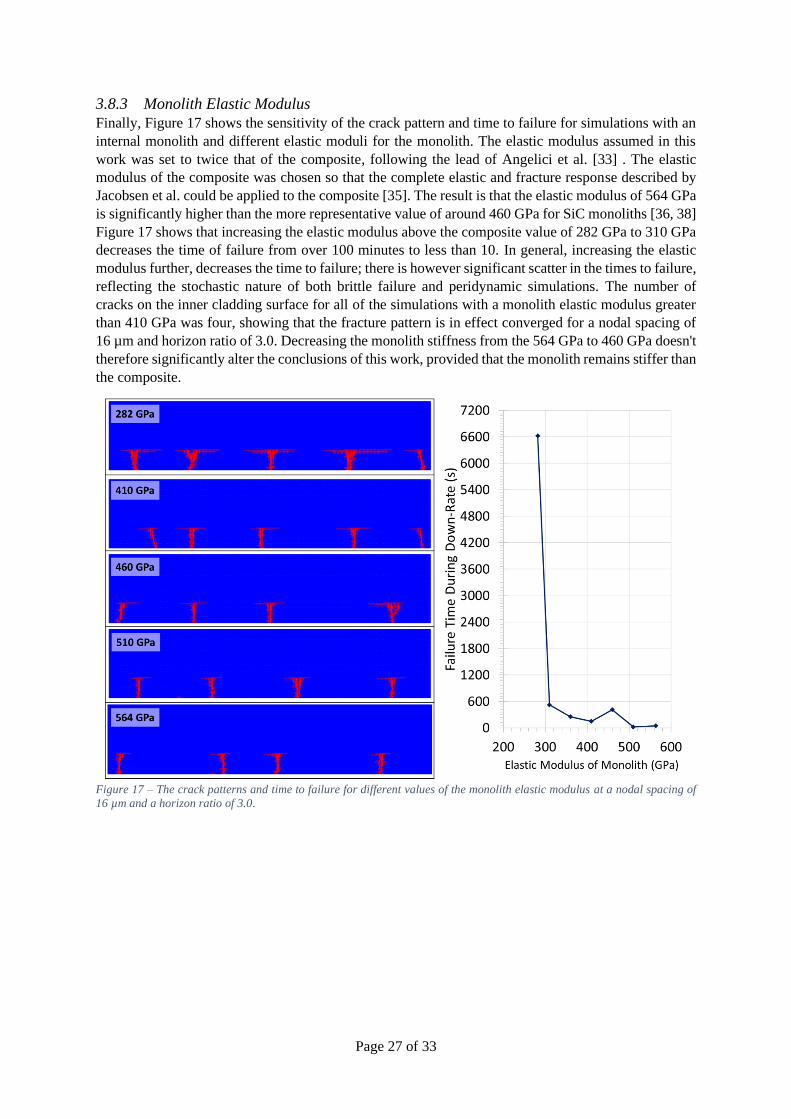
Finally, Figure 17 shows the sensitivity of the crack pattern and time to failure for simulations with an
internal monolith and different elastic moduli for the monolith. The elastic modulus assumed in this
work was set to twice that of the composite, following the lead of Angelici et al. [33] . The elastic
modulus of the composite was chosen so that the complete elastic and fracture response described by
Jacobsen et al. could be applied to the composite [35]. The result is that the elastic modulus of 564 GPa
is significantly higher than the more representative value of around 460 GPa for SiC monoliths [36, 38]
Figure 17 shows that increasing the elastic modulus above the composite value of 282 GPa to 310 GPa
decreases the time of failure from over 100 minutes to less than 10. In general, increasing the elastic
modulus further, decreases the time to failure; there is however significant scatter in the times to failure,
reflecting the stochastic nature of both brittle failure and peridynamic simulations. The number of
cracks on the inner cladding surface for all of the simulations with a monolith elastic modulus greater
than 410 GPa was four, showing that the fracture pattern is in effect converged for a nodal spacing of
16 µm and horizon ratio of 3.0. Decreasing the monolith stiffness from the 564 GPa to 460 GPa doesn't
therefore significantly alter the conclusions of this work, provided that the monolith remains stiffer than
the composite.
Figure 17 – The crack patterns and time to failure for different values of the monolith elastic modulus at a nodal spacing of
16 µm and a horizon ratio of 3.0.
Page 28 of 33
4 Future Work
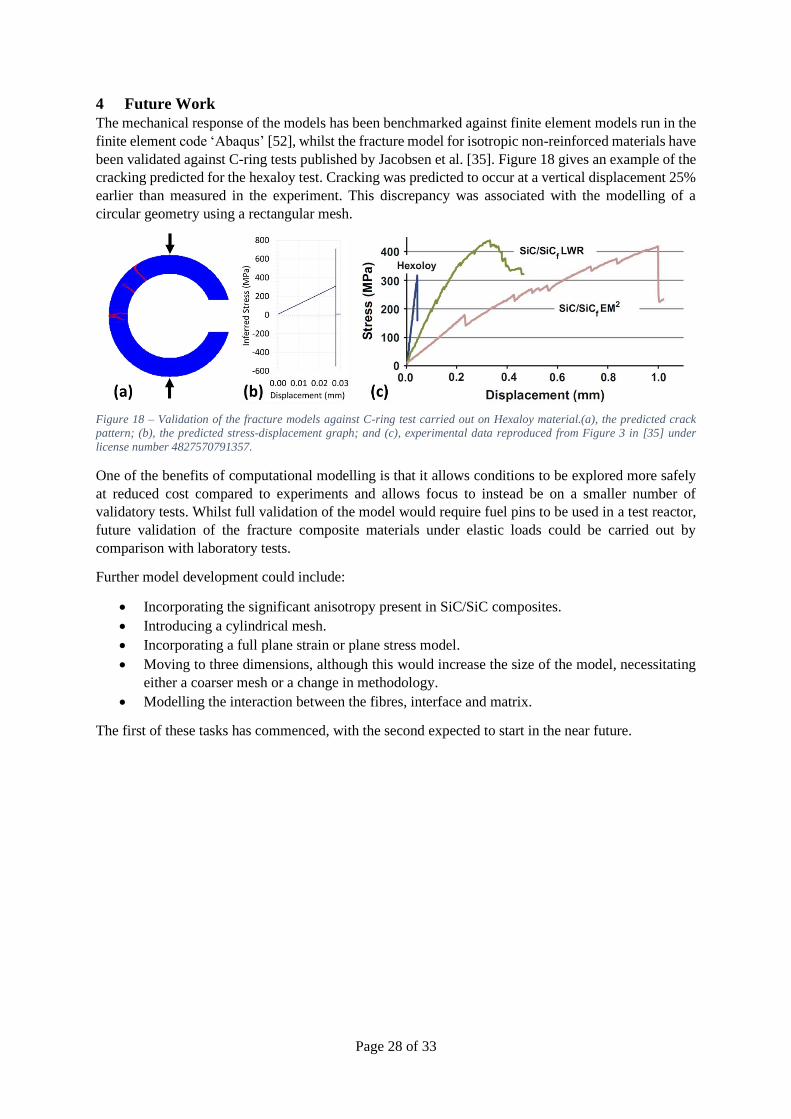
The mechanical response of the models has been benchmarked against finite element models run in the
finite element code ‘Abaqus’ [52], whilst the fracture model for isotropic non-reinforced materials have
been validated against C-ring tests published by Jacobsen et al. [35]. Figure 18 gives an example of the
cracking predicted for the hexaloy test. Cracking was predicted to occur at a vertical displacement 25%
earlier than measured in the experiment. This discrepancy was associated with the modelling of a
circular geometry using a rectangular mesh.
Figure 18 – Validation of the fracture models against C-ring test carried out on Hexaloy material.(a), the predicted crack
pattern; (b), the predicted stress-displacement graph; and (c), experimental data reproduced from Figure 3 in [35] under
license number 4827570791357.
One of the benefits of computational modelling is that it allows conditions to be explored more safely
at reduced cost compared to experiments and allows focus to instead be on a smaller number of
validatory tests. Whilst full validation of the model would require fuel pins to be used in a test reactor,
future validation of the fracture composite materials under elastic loads could be carried out by
comparison with laboratory tests.
Further model development could include:
• Incorporating the significant anisotropy present in SiC/SiC composites.
• Introducing a cylindrical mesh.
• Incorporating a full plane strain or plane stress model.
• Moving to three dimensions, although this would increase the size of the model, necessitating
either a coarser mesh or a change in methodology.
• Modelling the interaction between the fibres, interface and matrix.
The first of these tasks has commenced, with the second expected to start in the near future.

Page 29 of 33
5 Conclusions
• When fibres were modelled, matrix cracking is predicted to occur to a depth of around 20% of
the clad thickness from the inner surface at a standard linear power rating of 18 kW m-1. The
fibres were not predicted to break.
• With irradiation, the swelling strain in the cladding is predicted to be 4-7 times greater than
thermal expansion. Greater irradiation swelling on the outside than the inside of the cladding
gives rise to a tensile stress of 230 MPa on the inner surface of the cladding. This increases as
the thermal strain reduces during the down-rate at the start of the refuelling outage to a
maximum of 350 MPa.
• When fibres were not modelled, cracks were predicted to initiate on the inner surface and
propagate through the cladding in a fraction of a second.
• Addition of an inner monolith at a standard linear power rating of 18 kW m-1 results in radial
cracks in the monolith, which then deflect and bifurcate circumferentially at the monolith-
composite boundary and terminate before coalescence.
• At high power levels of 27-36 kW m-1, sections of the inner monolith were predicted to detach.
At extreme power levels of 36 kW m-1, fibres are predicted to break causing macroscopic crack
growth through the composite clad thickness. In this situation, it is anticipated that hermeticity
will lost.
• Around twice the fibre pull-out strain is observed ahead of cracks in the monolith due to
opening of the crack in the monolith underneath the composite.
• No cracks are predicted in an outer monolith and it might therefore be assumed that the
monolith remains gas-tight and thus is a more suitable design than an inner monolith.
• An outer monolith increases the pull-out strain predicted on the inner surface of the cladding
by just under 70%.

Page 30 of 33
6 Acknowledgements
The authors would like to acknowledge funding from the Department for Business, Energy and
Industrial Strategy (BEIS) under the UK Nuclear Innovation Programme (NIP). Also acknowledged is
input from Glyn Rossiter and Dave Goddard at NNL, and for useful discussion at the Advanced
Accident and Radiation Tolerant Materials conference in Cambridge March 2019, where this work was
presented, Lance Snead (Stony Brook University) and Dong Liu (University of Bristol).
Figure 18(c) is reprinted from Journal of Nuclear Materials, 452, G.M. Jacobsen, J.D. Stone, H.E.
Khalifa, C.P. Deck, and C.A. Back, Investigation of the C-ring test for measuring hoop tensile strength
of nuclear grade ceramic composites, pp. 125-132, Copyright 2014, with permission from Elsevier
under license number 4827570791357.
7 Data Availability
The raw/processed data required to reproduce these findings cannot be shared at this time due to legal
or ethical reasons.

Page 31 of 33
References
1. Zinkle, S.J., et al., Accident tolerant fuels for LWRs : A perspective. Journal of Nuclear
Materials, 2014. 448(1-3): p. 374-379.
2. Terrani, K.A., Accident tolerant fuel cladding development: Promise, status, and challenges.
Journal of Nuclear Materials, 2018. 501: p. 13-30.
3. Kim, H.-G., et al., High temperature steam-oxidation behavior of arc ion plated Cr coatings
for accident tolerant fuel claddings. Surface and Coatings Technology, 2015. 280: p. 256-
259.
4. Katoh, Y., et al., Continuous SiC fiber, CVI SiC matrix composites for nuclear applications:
Properties and irradiation effects. Journal of Nuclear Materials, 2014. 448: p. 448-476.
5. Rohmer, E., E. Martin, and C. Lorrette, Mechanical properties of SiC / SiC braided tubes for
fuel cladding. Journal of Nuclear Materials, 2014. 453(1-3): p. 16-21.
6. de Faria, R.B., et al., Sensitivity analysis of a PWR fuel element using zircaloy and silicon
carbide claddings. Nuclear Engineering & Design, 2017. 320: p. 103-111.
7. Kim, D., et al., Fabrication and measurement of hoop strength of SiC triplex tube for nuclear
fuel cladding applications. Journal of Nuclear Materials, 2015. 458: p. 29-36.
8. Deck, C.P., et al., Characterization of SiCeSiC composites for accident tolerant fuel cladding.
Journal of Nuclear Materials, 2015. 466: p. 667-681.
9. Naslain, R., Design, preparation and properties of non-oxide CMCs for application in
engines and nuclear reactors : an overview. Composites Science and Technology, 2004.
64(March 2003): p. 155-170.
10. Katoh, Y., S.M. Dong, and A. Kohyama, Thermo-mechanical properties and microstructure
of silicon carbide composites fabricated by nano-infiltrated transient eutectoid process.
Fusion Engineering and Design, 2002. 61-62: p. 723-731.
11. Singh, G., K.A. Terrani, and Y. Katoh, Thermo-mechanical assessment of full SiC/SiC
composite cladding for LWR applications with sensitivity analysis. Journal of Nuclear
Materials, 2018. 499: p. 126-143.
12. Snead, L.L., S.J. Zinkle, and D.P. White, Thermal conductivity degradation of ceramic
materials due to low temperature , low dose neutron irradiation. 2005. 340: p. 187-202.
13. Katoh, Y., et al., High-dose neutron irradiation of Hi-Nicalon Type S silicon carbide
composites . Part 2 : Mechanical and physical properties. Journal of Nuclear Materials, 2015.
462: p. 450-457.
14. Lee, Y. and M.S. Kazimi, A structural model for multi-layered ceramic cylinders and its
application to silicon carbide cladding of light water reactor fuel. Journal of Nuclear
Materials, 2015. 458: p. 87-105.
15. Katoh, Y., et al., Dimensional stability and anisotropy of SiC and SiC-based composites in
transition swelling regime *. Journal of Nuclear Materials, 2018. 499: p. 471-479.
16. Kim, W.J., D. Kim, and J.Y. Park, Fabrication and material issues for the application of SiC
composites to LWR fuel cladding. Nuclear Engineering and Technology, 2013. 45(4): p. 565-
572.
17. Koyanagi, T., et al., Hydrothermal corrosion of silicon carbide joints without radiation.
Journal of Nuclear Materials, 2016. 481: p. 226-233.
18. Koyanagi, T., et al., Effects of neutron irradiation on mechanical properties of silicon carbide
composites fabricated by nano-infiltration and transient eutectic-phase process. Journal of
Nuclear Materials, 2014. 448(1-3): p. 478-486.
19. Hirayama, H., et al., Corrosion Behavior of Silicon Carbide in 290°C Water. Journal of the
American Ceramic Society, 1989. 72(11): p. 2049-2053.
20. Henager, C.H., et al., Pitting corrosion in CVD SiC at 300 °C in deoxygenated high-purity
water. Journal of Nuclear Materials, 2008. 378(1): p. 9-16.
21. Kim, W.J., et al., Corrosion behaviors of sintered and chemically vapor deposited silicon
carbide ceramics in water at 360 °C. Journal of Materials Science Letters, 2003. 22(8): p.
581-584.
22. Kilic, B. and E. Madenci, Peridynamic theory for thermomechanical analysis. IEEE
transactions on advanced packaging 2010, 2010. 33(1): p. 97-105.

Page 32 of 33
23. Gu, X.B. and Q.H. Wu, The Application of Nonordinary, State-Based Peridynamic Theory on
the Damage Process of the Rock-Like Materials. Mathematical Problems in Engineering,
2016.
24. Zhao, J., H. Tang, and S. Xue, Peridynamics versus XFEM: a comparative study for
quasistatic crack problems. Frontiers of Structural and Civil Engineering, 2018. 12(4): p.
548–557.
25. Hu, W., Y.D. Ha, and F. Bobaru, Peridynamic model for dynamic fracture in unidirectional
fiber-reinforced composites. Computer Methods in Applied Mechanics and Engineering,
2012. 217-220: p. 247-261.
26. Macek, R.W. and S.A. Silling, Peridynamics via finite element analysis. Finite Elements in
Analysis and Design, 2007. 43(15): p. 1169-1178.
27. Beckmann, R., R. Mella, and M.R. Wenman, Mesh and timestep sensitivity of fracture from
thermal strains using peridynamics implemented in Abaqus. Computer Methods in Applied
Mechanics and Engineering, 2013. 263: p. 71-80.
28. Kilic, B. and E. Madenci, Coupling of peridynamic theory and the finite element method.
Journal of Mechanics of Materials and Structures, 2012. 5(5): p. 707-733.
29. Singh, G., et al., Parametric Evaluation of SiC/SiC Composite Cladding with UO2 Fuel for
LWR Applications: Fuel Rod Interactions and Impact of Nonuniform Power Profile in Fuel
Rod. Journal of Nuclear Materials, 2018. 499: p. 155-167.
30. Li, W. and K. Shirvan, ABAQUS analysis of the SiC cladding fuel rod behavior under PWR
normal operation conditions. Journal of Nuclear Materials, 2019. 515: p. 14-27.
31. Ben-Belgacem, M., et al., Thermo-mechanical analysis of LWR SiC/SiC composite cladding.
Journal of Nuclear Materials, 2014. 447: p. 125-142.
32. Stone, J.G., et al., Stress analysis and probabilistic assessment of multi-layer SiC-based
accident tolerant nuclear fuel cladding. Journal of Nuclear Materials, 2015. 466: p. 682-697.
33. Angelici Avincola, V., P. Guenoun, and K. Shirvan, Mechanical performance of SiC three-
layer cladding in PWRs. Nuclear Engineering and Design, 2016. 310: p. 280-294.
34. Alabdullah, M. and N.M. Ghoniem, Damage mechanics modeling of the non-linear behavior
of SiC/SiC ceramic matrix composite fuel cladding. Journal of Nuclear Materials, 2019. 524:
p. 296-311.
35. Jacobsen, G.M., et al., Investigation of the C-ring test for measuring hoop tensile strength of
nuclear grade ceramic composites. Journal of Nuclear Materials, 2014. 452: p. 125-132.
36. Koyanagi, T., et al., SiC/SiC Cladding Materials Properties Handbook. U.S. Department of
Energy - Nuclear Technology Research and Development Advanced Fuels Campaign, 2017.
ORNL/TM-20.
37. Koyanagi, T. and Y. Katoh, Mechanical properties of SiC composites neutron irradiated
under light water reactor relevant temperature and dose conditions. Journal of Nuclear
Materials, 2017. 494: p. 46-54.
38. Snead, L.L., et al., Handbook of SiC properties for fuel performance modeling. Journal of
Nuclear Materials, 2007. 371: p. 329-377.
39. Haynes, T.A., J.A. Ball, and M.R. Wenman, Modelling the Role of Pellet Relocation in the (r-
θ) Plane Upon Pellet-Clad Interaction in Advanced Gas Reactor Fuel. Nuclear Engineering
& Design, 2017. 314: p. 271-284.
40. Huang, H. and N. Ghoniem, Neutron displacement damage cross sections for SiC. 1993. 199:
p. 221-230.
41. Williamson, R.L., et al., Multidimensional multiphysics simulation of nuclear fuel behavior.
Journal of Nuclear Materials, 2012. 423(1-3): p. 149-163.
42. Katoh, Y., 2019 CARAT Meeting, Cambridge (UK), 27-28th March 2017. 2019.
43. Cinbiz, M.N., et al., Failure behavior of SiC/SiC composite tubes under strain rates similar to
the pellet-cladding mechanical interaction phase of reactivity-initiated accidents. Journal of
Nuclear Materials, 2019. 514: p. 66-73.
44. Katoh, Y., et al., Observation and possible mechanism of irradiation induced creep in
ceramics. Journal of Nuclear Materials, 2013. 434(1-3): p. 141-151.
45. Le, Q.V. and F. Bobaru, Surface corrections for peridynamic models in elasticity and
fracture. Computational Mechanics, 2018. 61(4): p. 499-518.

Page 33 of 33
46. Eringen, A.C. and D.G.B. Edelen, On nonlocal elasticity. International Journal of Engineering
Science, 1972. 10(3): p. 233-248.
47. Shapovalov, K., et al., Strength of SiCf-SiCm composite tube under uniaxial and multiaxial
loading. Journal of Nuclear Materials, 2018. 500: p. 280-294.
48. Deng, Y., et al., Probabilistic view of SiC/SiC composite cladding failure based on full core
thermo-mechanical response. Journal of Nuclear Materials, 2018. 507: p. 24-37.
49. Bratton, R.N., M.A. Jessee, and W.A. Wieselquist, Rod Internal Pressure Quantification and
Distribution Analysis Using FRAPCON. U.S. Department of Energy Used Fuel Disposition
Campaign, 2015. FCRD-UFD-2015-000636.
50. Hironaka, K., L.L. Snead, and A. Kohyama, High-temperature tensile strength of near-
stoichiometric SiC / SiC composites. Journal of Nuclear Materials, 2008. 307-311(2002): p.
1093-1097.
51. Katoh, Y., et al., Thermophysical and mechanical properties of near-stoichiometric fiber CVI
SiC / SiC composites after neutron irradiation at elevated temperatures. Journal of Nuclear
Materials, 2010. 403(1-3): p. 48-61.
52. Haynes, T.A. and M.R. Wenman, Development of a Peridynamic Material Model for
Accident-Tolerant Silicon Carbide – Silicon Carbide Pressurised Water Reactor Cladding
Report for the National Nuclear Laboratory, Version 4, June 2019, 2019.