Preliminary Feasibility Analysis of High Fructose...
38
Agricultural Economics Report No. 229 Preliminary Economic Feasibility Analysis of High Fructose Corn Syrup Processing in the United States with Emphasis on North Dakota by Scott M. Wulff and Delmer L. Helgeson sB Department of Agricultural Economics 20 5 North Dakota State University .7 Fargo, North Dakota N64 no| 229 II September 1987
Transcript of Preliminary Feasibility Analysis of High Fructose...

Agricultural Economics Report No. 229
Preliminary EconomicFeasibility Analysis of
High Fructose CornSyrup Processing in the
United States withEmphasis onNorth Dakota
byScott M. Wulff
andDelmer L. Helgeson
sB Department of Agricultural Economics2 0 5 North Dakota State University.7 Fargo, North DakotaN64no|229
II
September 1987

Preface
This prefeasibility analysis directed at the HFCS industry was carried outunder a short-term turnaround basis with the intent of accomplishing twoobjectives. First, provide a current economic overview of the United StatesHFCS industry; secondly, to develop some major HFCS processing plant operatingbenchmarks in an effort to provide a timely informational base for stateeconomic development interests.
The authors are indebted to numerous private businesses and agribusinessassociations who provided information and data for this study. Appreciation isgiven to the Corn Refiners Association, Inc., Washington, D.C., who providedboth background information and current statistics on the HFCS industry.
The authors wish to express their appreciation to Dr. Gordon Erlandson,Professor Timothy A. Petry, and Dr. Lawrence Mack for their timely manuscriptreviews and helpful comments. Special thanks are extended to Ms. DarlaChristensen and Ms. Shelly Swandal for their secreterial expertise. Any errorsor omissions are the sole responsibility of the authors.

Table of Contents
List of Tables . . . . . . . . . .. . . . . . . .List of Figures . . . . . . . . . . . . . . . . . . . .Highlights . . . . . . . . . . . . . . . . . . . . . . . .
Technological Background .. ....... . . . . . . .Wet Corn Milling Process ... . . . . . . . . .Syrup Conversion Process . . . . . . . . . .HFCS Conversion Process . . . . . . . . . .
United States Per Capita Consumption of Caloric Sweeteners ...
Artificial Sweeteners . . . . . . . ..............Total United States Consumption of Caloric Sweeteners . .
HFCS Growth PotentialSoft Drink Industry ..
Trends in ConsumptionOther Concerns . . .
HFCS Pricing .. . . . ... . . . . .
HFCS Industry Capacity . . . . . . .
Product Distribution . . .. . . . . . . . . . . . . .
HFCS Processing Costs . . . .Net Corn Costs ...Fixed and Variable ProcessingHistorical Profitability . .
Costs. . .
Locational Considerations . . . . . . .Transportation Costs . . . . . . . .Raw Product, Labor, and Utility Costs . .By-Product Market . . . . . . . . .
Summary and Conclusions . . . . . . . .
Appendix . . . . . . . . . . . .
References
15
15151616
17202021
. . . . . . . . . . . . 22
.. .. . . . . 25
Page
iiiv
vii
1113
5
67
7101012
12
13
a a a a a a a a a a a a a a a . a a a a a a a a a a
*
*.m
.
*
*
*
r
a
r
.
m
*
**
*
*
*
iiiill· · aill
a ii ii ·i a
*
*
.*
*
*
*
.*
*
.*
*
*
*
*
*
*
*
.*
*
*
.*
*
.*
*
*
.*
*
*
.*
.*
*
*
*
*
*
.*
*
*
.*
*
*
*
*
*
*
*
.*
*
*
a a v a a a 8 a a a a
i ·i i
i
i a
.*
*
*
*
.*
*
.*
O
*
*
*
*
a*
**
*
**
*
*
a
*
*
.*
*
*
*
.*
*
.*
*
*
. . . 27


List of Tables
Table Page
1 UNITED STATES PER CAPITA CONSUMPTION OF NONCALORIC,LOW-CALORIC, AND CALORIC SWEETENERS, 1975-1986 . ........ . 8
2 TOTAL UNITED STATES CONSUMPTION OF CALORIC SWEETENERS,1975, 1980-1987 . . . . . . . . . . .. . .. . . . . . . . .. 9
3 ESTIMATED INDUSTRIAL SUGAR AND HFCS DELIVERIES BY MARKETCATEGORY, HFCS MARKET SHARES, AND THEORETICAL LEVEL OF HFCSPENETRATION, UNITED STATES, 1984-1985 . . . . . . . . . . . . 9
4 THE METHOD BY WHICH REGULAR SOFT DRINKS ARE SWEETENED . .... 10
5 MONTHLY SOFT DRINK DELIVERIES AS PERCENT OF ANNUAL AVERAGE,UNITED STATES, 1985 .. . . . . . . . . . . . . . . . . . 12
6 HFCS FIRMS, PLANT LOCATIONS, AND PLANT CAPACITIES, BY HFCSCONCENTRATION, UNITED STATES, 1983-1985 . ............ 14
7 SALABLE PRODUCT YIELDS FROM A BUSHEL OF CORN (56 LBS.) ... . . 15
8 CORN PRICES, BY-PRODUCT VALUES, AND NET CORN COSTS, ILLINOISLOCATIONS, 1982-1986 .. . .. . . . . . . . . . . . ....... 16
9 TOTAL INDUSTRY SHIPMENTS AND EXPORTS OF CORN GLUTEN FEED ANDMEAL, 1984-1986 . . ..... . . . . . . .. . . ...... . 17
10 EEC MARKET SHARE OF UNITED STATES EXPORTS OF CORN GLUTENMEAL, GLUTEN FEED, AND OTHER CORN BY-PRODUCTS, 1981-1986 ..... 17
11 HFCS PROCESSING COSTS, UNITED STATES, 1987 . . . . . .... . 18
12 ESTIMATED RETURN ON INVESTMENT FOR HFCS PLANTS, MIDWEST,UNITED STATES, 1981-1986 ......... .. ......... 19
13 FIVE YEAR CORN AND ENERGY PRICES FOR IOWA AND NORTH DAKOTA,1980-1985 .. ............. . ...... .. . . 21
iii


List of Figures
Fi gure
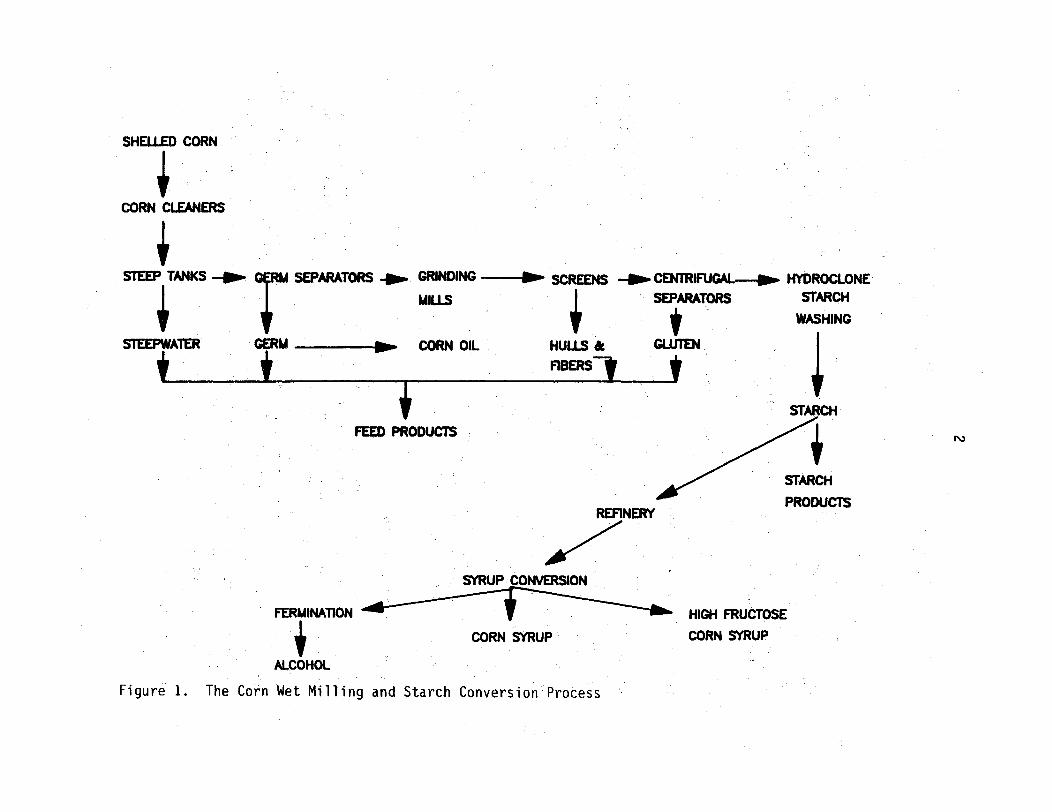
1 The Corn Wet Milling and Starch Converstion Process . *
2 Stereochemical Configuration of Dextrose and Fructose . . .
3 Per Capita Consumption of Caloric Sweeteners, United States,1975 Through 1986 and Forecast for 1987 . . .. . . . . .
4 Per Capita Caloric Sweetener Usage by Type, United States,1975 Through 1986 and Forecast for 1987 . .. .. .
5 Per Capita Sweetener Usage, Including Artificial Sweeteners
6 Per Capita Consumption of Soft Drinks, United States,1975 Through 1985 . . . . . . . . . . . .. . .
7 Market Shares of Soft Drinks by Type, Diet versus Regular,1975 Through 1985 .. . . . . . . . . . ..........
8 Prices, Refined Sugar, HFCS-55, and HFCS-42, 1978 Through 19
9 Plant Locations of United States HFCS Processing Plants, 198
0 Rate Advantages and Disadvantages, $/cst. of HFCS, for aNorth Dakota HFCS Processing Plant Relative to an IowaBased Processing Plant ... . . . . . .. . .
V
86
5 ..
1
Page
. . . 2
. . . 4
5
6
7
. . . 11
11
13
19
20
· · ·
· · ·
· · ·
a . .


Highlights
A pre-feasibility analysis of high fructose corn syrup (HFCS) processing wascarried out. Specific areas covered were consumption trends for noncaloric andcaloric sweeteners, markets for HFCS and by-products, product pricing, existingprocessors and their capacities, estimated processing costs and returns,potential for industry growth, and locational advantages-disadvantages for aNorth Dakota-based HFCS processing plant.
Second generation HFCS products are now commonplace in the industry HFCSconcentrations above 42 percent have -been made possible by the development ofthe fractionation process which allows for HFCS products of 55 and 90 percentconcentrationsI. FICS-42 is used pri farily t the baking, cereal, dairy, andprocessed foodo idustries HFCS-55 is used primarily i soft drinks, icecream, and frozon desserts whie HFCS-0 is used in watural and "light" foodswhere less sweteew r cntributes to lower caloric ratings.
Since 1976, the consumption of caoric s weeteners has remained relativelystable, while ee source has changed dramatically. Refined sugar has beenconsistently displaced by HFCS. e fined sugar peaked at 94 pounds on a percapita basis in 1977, faling to 64 pounds in 1986, a 35 percent decrease. Percapita consumption of HFCS, dry basis, increased from 5 pounds in 1975 to over45 pounds in 1986, an increase of 800 percent.
HFCS is at or near existing product markt potential. Additionalopportunities for sucrose (sugar) displacement is limited. The HFCS industryaccounts for over 96 percent of the combined HCS and sucrose consumption inthe beverage industry. Soe potential exists for increased use of HFCS-42 inthe processed food industry with very limited displacement potential of sucrosein the confectionery market. By-products, basically corn gluten feed and mealare very dependent on the feed protein markets. Historically, 70 to 75 percentof the domestic IFCS meal by-products have been exported. The EuropeanEconomic Commuity (EEC) accounts for 95 percent of the HFCS meal exports.
HFCS product prices are very dependent upon sucrose market prices and haveconsistently been discounted from the price of sucrose. While this discounthas narrowed, sucrose will remain as a ceiling price for HFCS as long assucrose remains sbstitutable in the HFCS market. Some potential still existsfor FFCS prices to move independently (while remaining discounted to sugar) asthe industry reaches maturity and firms begin to compete witeheach other.
Six firms control the HFCS processing coming from 18 United States plants.This is a capital intensive industry with major capital investments occurringduring two time periods. Heavy investment came in the mid 1970s with theintroduction of HFCS-42 plants followed in the early 1980s with expansion ofHFCS-55 capacity. Expansion of HFCS-55 was due to both construction of newplant capacity and the updating of existing HFCS-42 facilities.
Economy of operation is definitely related to plant size and operatingplants close to their designed capacity levels. Estimated historical returnson average plant investment (1981-1986) has been very competitive with otheralternative investment opportunities, ranging from 16 to 45 percent.
vii

Potential market for a HFCS plant in North Dakota would primarily be limitedto the Pacific Northwest, the northern tier of midwest states, and Minnesota.When compared to an Iowa based operation, a North Dakota HFCS plant would havea slight price advantage for the base raw material (corn) and labor and adisadvantage in terms of energy costs from coal, natural gas, and electricpower. A localized market for meal by-products would also be important inevaluating the competitive stance of a North Dakota based plant.
viii

Preliminary Economic Feasibility Analysis of High Fructose Corn SyrupProcessing in the United States with Emphasis on North Dakota
Scott M. Wulff and Delmer L. Helgeson l
The following report is a preliminary study on the feasibility of highfructose corn syrup (HFCS) production with emphasis on the merit of a NorthDakota based plant. Background information is provided on the technologicalaspects of HFCS processing; HFCS market size, growth and pricing; by-products;existing processors and capacities; processing costs; and locationalconsiderations of a North Dakota based plant.
Technological Background
Wet Corn Milling Process
The raw material for all corn-derived sweeteners is the starch portionof the corn endosperm. The starch portion of the corn endosperm is separatedfrom other fractions in the corn wet milling process. The corn wet millingprocess is presented in Figure T. Cleaned shelled corn is soaked and steepedin a series of tanks (steep) in warm water containing sulphur dioxide. Thesteeping process swells and softens the grain which facilitates the separationof the seed. The steeped corn is then degerminated in a water slurry by ashearing mill which releases the germ. A continuous liquid cyclone thenseparates the germ, which then becomes ready for oil extraction. The remainingendosperm and hull, after additional fine grinding, are screened, removing thehull and fibers. The remaining slurry is then centrifuged for separation ofstarch and gluten. The separated starch fraction is then filtered and washedto reduce solubles. The starch, in a water suspension, is now ready for dryingto produce dry starches or for conversion into syrups.
Syrup Conversion Process
In the conversion process, the suspended starch is liquified in thepresence of acid and/or enzymes which convert the starch to a low-dextrosesolution. Treatment with another enzyme continues the conversion process.Refiners can halt acid or enzyme action at key points to produce differingconcentrations of sugars, such as dextrose and maltose, to produce syrups withdifferent characteristics for different needs. In production of low-to-mediumsweetness syrups, the conversion of starch to sugars is halted at an earlystage. In others, the conversion is continued until the syrup is nearly alldextrose. The syrup is refined in filters, centrifuges and ion-exchangecolumns, and excess water is evaporated. Syrups are then sold directly,crystallized into pure dextrose, processed further to create high fructose cornsyrups, or used as a feedstock in the production of alcohol (Corn RefinersAssociation, Inc. 1986).
IWulff is Research Assistant and Helgeson is Professor, Department ofAgricultural Economics, North Dakota State University.
SHELLED CORN
CORN CLEANERS
STEEP TANKS - -
STEEPWATER GERM
* *
SEPARATORS - GRINDING -- SCREENS - CENTRIFUGAL-- HYDROCLONE
MILLS SEPARATORS STARCH
WASHING
SCORN OIL HULLS & GLUTEN
F1ERS t
FEED PRODUCTS
*STARCH
STARCH
PRODUCTSREFINERY
SYRUP CONVERSION
FERMINATION HIGH FRUCTOSE
CORN SYRUP CORN SYRUP
ALCOHOL
Figure 1. The Corn Wet Milling and Starch Conversion Process
r3
I 1 - · .

3
HFCS Conversion Process
Dextrose solutions or high dextrose equivalent (D.E.) substrates arerefined by carbon and ion-exchange systems and further treated enzymaticallywith a purified isomerase. Isomerization is generally carried to a point wherethe substrate contains 42 percent fructose. This product is refined againthrough carbon and ion-exchange systems and is evaporated to a dry substancelevel of 71 percent. The product is consequently named HFCS-42.
Isomerization is the transformation of one chemical into anotherchemical compound in which both compounds have the same empirical formula. Inthe production of high fructose corn syrup, HFCS, dextrose is isomerized intofructose. Both sugars have the same formula (C6H1206) but differentconfigurations (Figure 2).
Dextrose, a D-glucose, and fructose, a D-fructose, are members of thehexose2 series. All sugars in the hexose series have the formula C6 H1206,therefore all members of the group are isomers of one another. The maindifference between hexose isomers and isomers of other groups is in the natureof the reducing group (whether aldose or ketose) and in the spatial arrangement(stereo-chemical configuration) of the atoms (Figure 2).
Sweetness is directly related to the structural differences amonghexoses. D-fructose, a ketohexose, has a relative sweetness in the range of120 to 160 as compared to 100 for sucrose (table sugar). Dextrose, D-glucose,an aldohexose, has a relative sweetness of 70 to 80. The increased sweetnessof fructose created the interest in an isomerization process where D-glucosecan be converted to D-fructose. HFCS-42 is about as sweet as sucrose and ispopular in canned fruits, condiments, and other processed foods which need mildsweeteners that will not mask natural flavors.
Second generation high fructose corn syrups, those with fructoseconcentrations above 42 percent, have been made possible by the development ofa fractio-ation process which allows separation of fructose from dextrose. A42 percent fructose feedstock is passed through separation columns whichretains fructose. The fructose fraction is recovered at an 80-90 percentconcentration. This product is blended with 42 percent fructose to produce asyrup with a fructose content of 55 percent. The syrup is refined again withboth carbon and ion-exchange systems and evaporated to a dry substance level of77 percent. This syrup, HFCS-55, is used primarily in soft-drinks, ice cream,and frozen desserts. The high fructose fraction, 90 percent fructose, may alsobe refined and evaporated to produce HFCS-90 for users who desire a sweeterproduct. HFCS-90 is one and one half times as sweet as sugar and is used innatural and "light" foods because less sweetener, and thus fewer calories, areneeded to,provide the sweetness level (Corn Refiners Association 1986).
The yield of HFCS-42 and HFCS-55 is 47 and 45 pounds per bushel,respectively. HFCS-42 has a dry solid content of 71 percent yielding 33.37Ibs. dry solids per bushel of corn. HFCS-55 has a higher dry solids content of
2 "ose" is the suffix which identifies a sugar.
__

4
(oidoewaseKEt~df
CHI loH
C00 (carbon 2)n-C - (carbon i)
CHO
Ni C - OHMO- -M
M-C-OH
CH~ ON
0-glucose
sr~mE~aemscmL COPIGURATMO
CHIOM
0-0-glucopyranose
0-glucose
3-0-tvuctopyvanros
ISOMIrIZATlON
O-Iructosecatalyst4 -III
Figure 2. Stereochemical Configuration of Dextrose and Fructose
SOURCE: Corn Refiners Association, 1986
CH1OHCO
MO-C-M
H - -OM
n -C -On
CN:OH
0-fructose
H

5
77 percent thus yielding 34.65 Tbs. dry solids per bushel of corn (Vuilleumier1985).
United States Per Capita Consumption of Caloric Sweeteners
Per capita consumption of caloric sweeteners has increased from 118.1pounds per capita in 1975 to 129.7 in 1986. Consumption was stable from 1976to 1983 before increasing in 1985 to 131.2 pounds. Consumption is expected todecrease to 128.9 pounds in 1987 (Figure 3).
The source of caloric sweeteners has changed drastically. Refined sugarhas been consistently displaced by the use of high fructose corn syrup.Refined sugar consumption decreased from a peak of 94 pounds per capita in 1977to 61 pounds in 1986, a 35 percent reduction. HFCS per capita consumption, drybasis, increased from 5 pounds in 1975 to over 45 pounds in 1986. Dextrose andglucose consumption have remained relatively stable (Figure 4).
04 I ... .. -
140.
135'
130'
S125'
a 120.
81150
1105
105'
10II((
1975 1976 1977 1978 1979 1980 1981 1982 1983 1984
Figure 3. Per Capita Consumption of1975 Through 1986 and Forecast for
Caloric Sweeteners,1987
1985 1986 1987
United States,
SOURCE: Sugar and Sweetener Situation and Outlook Report, March, 1987.
IIIIIIIII111p

6
I U
80
160
40
20
01975 1976 1977 1978 1979 1980 1981 1982 1983 1984 1985 1986 1987
Figure 4. Per Capita Caloric Sweetener Usage by Type, United States, 1975Through 1986, and Forecast for 1987
SOURCE: Sugar and Sweetener Situation and Outlook Report, March, 1987.
Artificial Sweeteners
Artificial sweeteners have been responsible for over one-half of thegrowth in the sweetener industry since 1975. Total per capita sweetener usage(including noncaloric and low calorie sweeteners on a sugar sweetnessequivalent basis) increased by 24 pounds, 124.2 to 148.2, from 1975 to 1986.Artificial sweeteners accounted for 12.4 pounds of the increase (sugarequivalent basis) (Figure 5). Growth, measured both in annual percentage andabsolute consumption, has been greater for artificial sweeteners than caloricsweeteners. Much of the increased growth (Table 1) has come from increased useof aspartame.
Aspartame's recent growth has come partially at the expense of saccharinas manufacturers switched from a mixture of aspartame and saccharin toexclusively aspartame. Aspartame and saccharin now account for over 12 percentof the sweetener market.
1Al

7
1975 1976 1977 1978 1979 1980 1981
SARL•ICLAL
. CALORIC
1982 1983 198 1 985 1986
Figure 5. Per Capita Sweetener Usage, Including Artificial Sweetenersl
1Sugar equivalent basis, assumes saccharin is 300 times as sweet as sugar,and aspartane 200 times as sweet as sugar.
SOURCE: Sugar and Sweetener Situation and Outlook Report, March, 1987.
Total United States Consumption of Caloric Sweeteners
Total United States consumption of caloric sweeteners has increased from12.75 million short tons in 1975 to 15.66 in 1986 (Table 2). Glucoseconsumption has increased slightly from 1.89 million short tons in 1975 to 2.17in 1986. Dextrose has decreased from .54 million short tons to .42 since 1975.HFCS consumption has grown tremendously, from .54 million short tons in 1975 to5.5 in 1986. Refined sugar has decreased from 9.6 million short tons in 1975to 7.37 in 1986. This decrease is primarily due to the increased use of HFCSin the beverage industry and, to a lesser extent, the canning, baking, andcereal industries.
HFCS Growth Potential
Growth potential for HFCS through additional displacement of sucrose(sugar) is limited. Actual usage of HFCS in the market is at or near thetheoretical or expected technical level of penetration (Table 3). HFCS hasnearly displaced the entire usage of sugar in the beverage industry. Prior to
150 -
S100
S50
0
rr_ aso I #1
Lwý-^ LiLiOWNLibi\hL. !h-h L.B^ -^ C441hL.ChrlbL. imN L. 04Af L. m&GbA. q Low .i .• •. 5

8
TABLE 1. UNITED STATES PER CAPITA CONSUMPTION OF NONCALORIC,LOW-CALORIC, AND CALORIC SWEETENERS, 1975-1986
Artificial SweetenersaYear Saccharin Aspartame Subtotal Caloricb Total
------------------ ------ pounds---------------------
1975 6.1 6.1 118.1 124.21976 6.1 6.1 124.4 130.51977 6.6 6.6 126.8 133.41978 7.1 7.1 126.6 133.71979 7.4 .0 7.4 127.1 134.51980 7.7 .07 7.7 125.0 .132.71981 8.0 .2 8.2 125.1 133.31982 8.4 1.0 9. 4 123.2 132.61983 9.5 3.5 13.0 124.6 137.61984 10.0 5.8 15.8 126.8 142.61985 6.0 12.0 18.0 131.2 149.21986 5.5 13.0 18.5 129.7 148.2
aData is on a sugar equivalent basis, and assumes saccharin(noncaloric) is 300 times as sweet as sugar and aspartame (lowcaloric) is 200 times as sweet as sugar.
blncludes sugar, all corn sweeteners, honey, and edible syrups.
SOURCE: Sugar and Sweetener Situation and Outlook Report, March,1987.
November 1984, major soft drink bottlers limited the use of HFCS to a 50percent replacement level. In November 1984 the bottlers approved a 100percent replacement level of sucrose by HFCS in cola drinks. Due to the lowercosts of HFCS relative to sucrose, HFCS accounts for over 96 percent of thecombined HFCS and sugar consumption in the beverage industry.
The use of HFCS in the baking, cereal, and dairy industries is also nearor at its potential technical penetration levels. Some potential increases inthe use of HFCS-42 exists in the processed food industry as some manufacturershave not approved its use. Displacement of sugar in the confectionery marketis expected to be low since the use of a hygroscopic product is incompatible inmany confectionery uses (Vuilleumier 1985).
The rapid market growth of HFCS due to sucrose displacement is rapidlyslowing, however there is some limited growth potential in the processed foodsectorr. Further market growth will be dependent on population growth andchanges in consumption by consumers.

9
TABLE 2. TOTAL UNITED STATES CONSUMPTION OF CALORIC SWEETENERS, 1975,1980-1987
Refined Corn Sweetenersa __
Year Sugar HFCS Glucose Dextrose Subtotal Totalb
------------ ------- million tons -----------------
1975 9.63 .54 1.89 .54 2.97 12.751980 9.52 2.18 2.00 .40 4.58 14.241981 9.13 2.67 2.05 .40 5.12 14.391982 8.56 3.10 2.09 .41 5.60 14.311983 8.33 3.60 2.11 .41 6.12 14.611984 8.01 4.30 2.13 .41 6.84 15.011985 7.58 5.39 2.16 .42 7.96 15.701986 7.37 5.53 2.17 .43 8.12 15.661987c 7.27 5.65 2.19 .43 8.29 15.72
aDry basis.blncludes honey andcForecast.
edible syrups.
SOURCE: Sugar and Sweetener Situation and Outlook Report, March, 1986.
TABLE 3. ESTIMATED INDUSTRIAL SUGAR AND HFCS DELIVERIES BY MARKET CATEGORY, HFCSMARKET SHARES, AND THEORETICAL LEVEL OF HFCS PENETRATION,1984-1985.
UNITED STATES,
Deliveries HFCS Estimated Long-TermaSugar HFCS Market Shares Penetration Levels
Item 1984 1985 1984 1985 1984 1985 Vuilleumier Carmen
-- million pounds ---- ----------- percent ----------
Beverage 1550 250 5400 6730 77.7 96.4 100 100Baking, cereal 2829 2885 970 1010 25.5 25.9 25 25Canned and
processed foods 925 945 1350 1400 59.3 59.7 60-75 75Dairy products 784 800 420 430 34.9 35.0 35 30Confections 2217 2260 40 50 1.8 2.2 5 10Other food and
nonfood uses 1145 1170 320 330 21.8 22.0 25
Total 9450 8310 8500 9950 47.4 54.5
Is of HFCS in the
SOURCE: Vuilleumier, 1985. and Carmen, 1983.
aThese percentages represent the estimated penetration leverespective sucrose markets based on current technology.

10
Soft Drink Industry
The soft drink industry is the primary consumer of HFCS. The beverageindustry accounts for over two-thirds of all HFCS sales and for over 95 percentof all HFCS-55 consumption (Vuilleumier 1985). HFCS, as previously stated,currently accounts for over 96 percent of the combined sucrose and HFCSsweetener usage in the soft drink industry.
The conversion to HFCS from sugar is documented in Table 4. Data arefrom a survey completed by the National Soft Drink Association (NSDA) ofbottlers during 1985. This conversion was significantly related to theapproval of 100 percent usage of HFCS by major soft drink companies in November1984. Excluding noncaloric sweeteners, HFCS was used exclusively in 95 percentof soft drinks in 1985 compared to 55 percent in 1984. The use of a HFCS/sugarcombination decreased from 42 percent in 1984 to less than 3 percent in 1985.
Trends in Consumption. Per capita consumption of soft drinks hasincreased from 289 twelve-ounce cans in 1975 to 486 cans in 1985 (Figure 6).This represents an annual growth rate of 5.3 percent. Total United Statesconsumption has increased from 2.6 million cases (24 twelve-ounce cans) in 1975to 4.8 million cases in 1985, an annual growth rate of 6 percent. Total growthis greater than per capita growth due to an annual population growth of 1percent during the period. The market share of diet soft drinks has beenincreasing over time from 10 percent in 1975 to over 21 percent in 1985 (Figure7). The annual shift in market share from regular to diet soft drinks isincreasing. From 1975 to 1980 the average annual shift was 3.8 percentcompared to 7.3 during 1980-1985.
In spite of the shift in market share from regular to diet soft drinks,total United States and per capita consumption of regularly sweetened softdrinks is increasing. This is possible because the annual growth in beverageconsumption exceeds the shift from regular to diet soda. However, if thepresent trend continues, a decrease in per capita consumption of regular softdrinks may result.
TABLE 4. THE METHOD BY WHICH REGULAR SOFT DRINKS ARE SWEETENED
1984 1985
------- percent-----
Beet/cane sugar 3.8 1.8HFCS 54.6 95.5Sugar and HFCS 41.5 2.7
SOURCE: Adapted from National Soft Drink Association, 1986.

11500' -
400
300
j 200
C4:
100
0(1975 1976 1977 1978 1979 1980 1981 1982 1983 1984 1985
Figure 6. Per Capita Consumption of Soft Drinks, United States, 1975Through 1985
SOURCE: Adapted from National Soft Drink Association, 1986.
100.0
82.5
.75.0-S Regular
62.5-
50.0
Dieti25.0
0 - ---r --i---i---i--- --------1-- -- '---12.5
1975 1976 1977 1978 1979 1980 1981 1982 1983 1984 1985
Figure 7. Market Shares of Soft Drinks by Type, Diet Versus Regular,1975 Through 1985
SOURCE: Personal communications, National Soft Drink Association, 1987.
Total
Di et
. F I U I I I I

12
Other Concerns. There is industry concern regarding the future usage ofaspartame as the patent for aspartame expires in 1992. There is somespeculation that generic aspartame may become price competitive with HFCS.
The consumption of soft drinks is very seasonal. Monthly deliveries ofsoft drinks as a percentage of the 1985 annual average are presented .inTable 5. Monthly deliveries ranged from a low of 72 percent in January to 134percent in July and August. This seasonality increases the production costs ofHFCS as the plants cannot be operated at full capacity throughout the year.
TABLE 5. MONTHLY SOFTAS PERCENT OF ANNUALSTATES, 1985
DRINK DELIVERIESAVERAGE, UNITED
Month Percent
January 72February 80March 95April 109May 108June 108July 123August 123September 115October 105November 86December 77
SOURCE: Adapted from National SoftDrink Association, 1986.
HFCS Pricing
HFCS prices are very dependent upon sugar prices. Both HFCS-42 andHFCS-55 are discounted to the price of sugar (Figure 8). However, thisdiscount has decreased and stabilized over time. HFCS-42 was initiallydiscounted to sugar prices to gain market entry. The discount has narrowed forthe period from 1984 to 1986. The discount for HFCS-42 has been between 22 and23 percent (Figure 8). HFCS-55 is discounted 12 to 15 percent less than theprice of sugar. As the industry matures, plant capacity will equal or exceedmarket demand. The potential for HFCS prices to move independently (as long asHFCS remains discounted to sugar) exists as HFCS manufacturers begin to competewith each other and with the sugar market. The price of sugar would still bethe ceiling price for HFCS as long as sugar remains substitutable in the HFCSmarket.

13
40'
a 30.
.0
10-
01978 1979 1980 1981 1982 1983 1984 1985 1986
Figure 8. Prices, Refined Sugar, HFCS-55, and HFCS-42 1978 Through 1986
SOURCE: Sugar and Sweetener Situation and Outlook Report, March, 1987.
MFCS Industry Capacity
Capital investment in HFCS facilities came during two periods, themid-1970s with the introduction of HFCS-42 and the early 1980s with the use ofHFCS-55 in the beverage industry. Expansion in the 1980s of HFCS-55 capacitywas due to both construction of new facilities and the updating of existingHFCS-42 facilities.
Six firms, American Maize-Products Co.; ADM/Corn Sweeteners; CPCInternational, Inc.; Cargill, Inc.; Hubinger; and A.E. Staley Manufacturing Co.produce HFCS. Plant locations and capacities are presented in Table 6. TotalUnited States plant capacity in 1985 is estimated at 3,877 million pounds drybasis of HFCS-42 and 7,033 million pounds dry basis of HFCS-55, for a totalcombined capacity of 10,901 million pounds. Plant capacity in 1985 exceeded1985 usage by 10 percent. HFCS plants are generally new or recently updated.The majority of plants are located in the Corn Belt, with a limited number nearpopulation centers.
:Ref i~ned Sugar
:H FCS- :5-5~-HFCS-42-81

14
TABLE 6. HFCS FIRMS, PLANT LOCATIONS, AND PLANT CAPACITIES, BY HFCSCONCENTRATION, UNITED STATES (42 AND 55 PERCENT), 1983-1985
1983 1984 1985Company/Location 42 55 42 55 42 55
------- million pounds, dry basis --------
American Maize-ProductsDecatur, AlabamaDimmit, Texas
ADM/Corn SweetenersCedar Rapids, IowaDecatur, IllinoisClinton, IowaMontezuma, New York
CPC InternationalArgo, IllinoisStockton, CaliforniaWinston, North Carolina
Canadian OperationsPort Colborne, OntarioLondon, OntarioCardinal, Ontario
Cargill, Inc.Dayton, OhioMemphis, TennesseeEddyville, Iowa
Hubinger, Division of H.J. HeinzKeokuk, IowaJohnstown, Coloradoa
A.E. Staley Manufacturing Co.Decatur, I.11inoisLafayette, IndianaLouden, TennesseeMorrisville, Pennsylvania
Total - Excluding Canada
Total - Including Canada
142180
700300370150
450215
95
80115105
200200
32030
420
,200275
4247
4547
269120
400850300150
100
115160
310310
17070.
1000200275
142180
269120
700 450250 1300250 400
350
450215120
80115105
200200
20030
150200
115160
310310
300120
460140 1000220 330
460
.192180
700250250
200215155
80115105
200200170
20030
423120
4501300
400350
250230270
115160
310310310
300120
but the pro-
SOURCE: Vuilleumier, personal communication, 1987.
460140 1000335 430
460
4524 3757 6069 3877 7033
4799 4057 6344 4177 7308
aThe Johnstown, Colorado, facility is owned by Coors Brewing Co.duction is marketed by Hubinger.

15
Product Distribution
HFCS moves either by rail or truck. In general, for shipping distancesgreater than 300 miles HFCS is shipped by rail, and for distances less than 300miles HFCS is moved by truck. Truck transportation has an advantage over railduring cold weather if HFCS can be delivered before the syrup cools. Thismeans unloading can be accomplished without incurring warming costs. Trucktransport of HFCS is generally more expensive than other commodities because abackhaul is not available.
Sanitation of the shipping vessel is critical as contamination of thevessel can lead to off-quality product and subsequent rejection. The productmust then be sold at a discount.
HFCS Processing Costs
There are two major cost components in producing HFCS. They are the rawmaterial cost for corn and the fixed and variable processing costs.
Net Corn Costs
Net corn cost is dependent on the value of by-products: corn glutenfeed, corn gluten meal, corn germ meal, and corn oil. The by-products aresometimes called co-products because of their significant value. By-productscan reduce corn cost by 40 to 60 percent. Yields are presented in Table 7.
TABLE 7. SALABLE PRODUCT YIELDS FROM A BUSHEL OF CORN (56 LBS.)a
Product Quantity
(Ibs.)
Corn germ meal 2.24Corn oil 1.58Corn gluten feed 10.81Corn gluten meal 2.80Corn starch (dry basis) 30.60
aNumber 2 yellow dent corn is the raw product and it containsapproximately three to five percent broken corn and foreignmatter (BCFM). This is screened out before the corn isprocessed.
SOURCE: Cubenas, et al., Purdue University, 1979.

16
Net corn costs for an Illinois based HFCS plant(s) are presented inTable 8. In 1986 and 1987 co-products reduced net corn costs by up to 70percent. This is a result of low corn prices and a relatively strong marketfor corn gluten feed and meal. The values of corn gluten feed and meal arevery dependent on the protein market, primarily soybean meal, as they are bothconsidered protein feeds. The corn gluten feed and meal market is also verydependent on the export market to the European Economic Community (EEC).Traditionally 70 to 75 percent of domestic production is exported, with the EECaccounting for 95 percent of the volume (Tables 9 and 10). The strength of themarket is dependent on the EEC tariff structure.
TABLE 8. CORN PRICES, BY-PRODUCT VALUES, AND NET CORN COSTS, ILLINOISLOCATIONS, 1982-1986
By-product Percent Cost Net Corn
Year Corna Value Reduction Cost
($/bu) ($/bu) (percent) ($/lb.)
1982 2.98 1.57 53 .0471983 3.46 1.63 47 .0611984 2.79 1.32 47 .0491985 2.35 1.36 58 .0331986 1.75 1.23 70 .017
aCorn, No. 2 Yellow, Chicago.bAdapted from Table 7, yields and prices in Appendix Table 11,
SOURCE: Feed Situation and Outlook Yearbook, November, 1986.
Fixed and Variable Processing Costs
HFCS processing is capital intensive. A plant processing 70,000 bushelsper day and producing a product mix of 70 percent HFCS-55 and 30 percent HFCS-42 requires an investment of $210 million. This investment and other relatedfixed costs result in a total fixed cost of $6.96 per cwt. of HFCS dry solids(Table 11). Major processing costs include energy, labor, enzymes, chemicals,interest on working capital, and repairs and maintenance. These costs aredelineated in Table 11. Total variable costs are estimated at $5.86 per cwt.of dry solids.
Historical Profitability
Historical corn prices, by-product values, and HFCS prices (see AppendixTable 1 for price series) were incorporated with estimated processing costs toestimate profitability of HFCS processing over the previous five years.Estimated return on average plant investment has been very attractive, ranging

17
TABLE 9. TOTAL INDUSTRY SHIPMENTS AND EXPORTS OF CORN GLUTEN FEED AND MEAL,1984-1986
Year Total Shipments Exports Export Market Share
------- million pounds ------- --- percent -----
1984 10395 7996 76.9
1985 10439 7634 73.2
1986 10328 8924 86.4
SOURCE: Corn Refiners Association, 1986.
from 16 to 45 percent (Table 12). Caution is advised because plant utilizationwas estimated at 292 days per year. This level of utilization may beconsidered full utilization when considering the seasonality of HFCS-55 sales.Due to high fixed costs, a less than full plant utilization level will havesubstantial effects on rate of return on investment.
Locational Considerations
The potential market area for a North Dakota based HFCS plant wouldprimarily be the Pacific Northwest, the northern tier of midwest states, andMinnesota. HFCS would not likely move east of the Mississippi River because ofthe facilities located in the Corn Belt. Locations of present HFCS plants arepresented in Figure 9. The primary competition for a North Dakota based
TABLE 10. EEC MARKET SHARE OF UNITED STATES EXPORTS OF CORN GLUTEN MEAL,GLUTEN FEED, AND OTHER CORN BY-PRODUCTS, 1981-1986
Year Total Exports EEC Exports Market Share
------ 1000 metric tons ------- - percent -
1981 3202 3078 961982 3155 3084 981983 4177 4120 981984 4197 4038 961985 3902 3715 951986 5204 4999 96
SOURCE: Foreign Agricultural Trade of the United States, 1982-1986.

18
TABLE 11. HFCS PROCESSING COSTS, UNITED STATES, 1987
Item Annual Cost
Fixed Costs
Total plant investmenta(Capital recovery factor, 15 yr life and 12 percentinterest)
Annualized capital charge
Plant insurance $10/$1000 plant investment
Real estate taxes, 1.755 percent of plant investment
Premise-t tiability insurance, $.29/$100 payroll
General & administrative overhead and selling exp.b
S Total Fixed Costs
SVariable Costs
Labor and fringe benefits, 215 plant employees
Power and utilities
Steam, 180,000#/ir. at $.035/1000#Electricity, 13,000kw./hr., $.0359/kw.Fuel, 100 million BTU/hr., natural gas,
S$.39827/CCEnzymes, chemicals, and supplies, $1.50 per cwt.
of HECS dry solids
Repairs and maintenance, 4% of plant investmentc
Interest on working capitald
Total Variable Costs
TOTAL ESTIMATED FIXED AND VARIABLE COSTSe
$210,000,000
- 0..1468
30,832,477
2,100,000
3,685,500
19,821
12,000,256
48,640,367
S6,835, 136
4,415,0403,271,545
2,791,076
10,504,116
8,400,000
4,801,027
41,017,941
$ 89,658,308
aDesigned plant capacity is 70,000 bushels per day yielding a productmix of 70 percent HFCS-55 and 30 percent HFCS-42. -Dailyproduction is 23,982 cwt. of HFCS, dry solids basis. A total of 292annual operating days.
bSeven and one-half percent of annual sales.cIncludes repair and maintenance labor.dWorking capital requirement is.25 percent of annual sales, annualinterest rate of 12 percent is assumed.
eExcludes. the cost of corn,.
SOURCE: Various HFCS industry sources, 1987.

19
TABLE 12. ESTIMATED RETURN ON INVESTMENTFOR HFCS PLANTS, MIDWEST, UNITED STATES,1981-1986
Year Percent
1982 161983 241984 411985 351986 45
facility would be plants located in Iowa.California, and Johnstown, Colorado, wouldpopulated Southwest region.
Plants locatedmost likely be
in Stockton,serving the more
Figure 9. Locations of United States HFCS Processing Plants, 1985

20
Transportation Costs
North Dakota has a $.60/cwt. transportation cost advantage over Iowa inserving the Pacific Northwest; however, North Dakota is at a slightdisadvantage in shipping to the Southwest. An Iowa facility would have a$.19/cwt. advantage in shipping to San Francisco and Los Angeles, California.Rate advantages and disadvantages relative to Iowa are presented in Figure 10.North Dakota would compete on an equal transportation cost basis to theMinneapolis and St. Paul markets.
Figure 10. Rate Advantages and (Disadvantages), $/cwt. of HFCS, for aNorth Dakota HFCS Processing Plant Relative to an Iowa-Based ProcessingPlant

21
Raw Product, Labor, and Utility Costs
North Dakota has a slight corn cost advantage over Iowa, $.04 per bushel(1981-1985 average), and a significant labor cost advantage of 24 percent(Table 13). Iowa, however, has the benefit of lower energy prices. NorthDakota's electric power, natural gas, and coal costs are 7.5, 11.3, and 37.8percent higher than Iowa's.
TABLE 13. FIVE-YEAR CORN AND ENERGY PRICES FOR IOWA1980-1985
AND NORTH DAKOTA,
North Dakota'sPercent
AdvantageItem Iowa North Dakota (Disadvantage)
Corn $/bu. $2.66 $2.62 1.5%
Labor, manufacturing $/hr. $10.05 $7.67 23,7%
Steam coal, industrialsector $/million BTU $1.72 $2.76 (37.8%)
Natural gas $/million BTU $3.46 $3.90 (11.3%)
Electric power $/million BTU $12.58 $13.60 ( 7.5%)
SOURCE: Agricultural Statistics, USDA, 1984-1986; State Energy Price andExpenditure Report, 1984; and United States Statistical Abstract, 1987.
By-Product Market
The local markets for by-products are also important. A sufficientlysized local livestock and poultry industry is required to support prices forby-products, primarily corn gluten feed and meal. To remain competitive aNorth Dakota plant must be able to realize the same by-product prices as othermidwestern plants. This is crucial as by-products have historically reducedcorn cost by between 47 and 70 percent (Table 8). If local demand for corngluten feed and meal exceeds the plant's production, a North Dakota plant willmost likely be able to maintain the same prices as plants located elsewhere.However, if quantity supplied exceeds quantity demanded then a portion of theby-products must be sold in a more distant market, such as Minneapolis, thePacific Northwest, or an export market. As a result net plant prices will bedecreased by the cost of transportation. A corn syrup plant in Marshall,Minnesota, has been successful in merchandising corn gluten feed and meal inits local market to both livestock and poultry enterprises.

22
Summary and Conclusions
The HFCS industry has progressed to a point where it must now beregarded as an industry nearing maturity with limited future growthexpectations. Several major developments within the sucrose (sugar) and HFCSindustry leads to this conclusion. First, HFCS has replaced over 96 percent ofall sucrose in the soft drink industry, leaving little or no growth potentialfor increased demand within that industry. Second, the HFCS products havecurrently reached the long-run technical level of penetration in the baking,cereal, and dairy product industries. Third, there is evidence to suggest thatHFCS is nearing the long-term technical penetration levels in the canning,processed food, and confectionery industries.
The primary market for HFCS-55 is the soft drink industry, whichaccounts for 95 percent of all HFCS-55 sales in the United States. Demand forHFCS-55 may level off or decline in the future. Currently, the diet soft drinkmarket share is increasing and growing at an increasing annual rate.Consumption of "regular" soft drinks [soft drinks sweetened either by sugar(sucrose) or corn sweeteners] continues to increase, but at a decreasing rate.There is also industry concern that generic aspartame may be pricedcompetitively with HFCS-55 when the patent for aspartame (the major artificialsweetener) expires in 1992.
HFCS production in the United States is controlled by six firms.Location of these firms is primarily in the Corn Belt with a limited amount ofplant capacity located near population centers. Existing plant capacity isestimated to exceed demand by 10 percent. Recent industry expansion has beenfor new HFCS-55 processing capacity and for updating existing HFCS-42 plants.HFCS plant capacity is in excellent shape with most of the plant capacitywithin the industry new or updated with essentially no obsolete plant capacity.
HFCS products were initially priced at a discount to sucrose. RecentlyHFCS-55 was priced 12 to 15 percent below sucrose and HFCS-42 was priced at 22to 24 percent below sucrose prices. This pricing strategy enabled the HFCSindustry to penetrate the sucrose market. HFCS margins have, since 1980, beenrelatively stable, following the market stability experienced by the sucroseindustry. Marketing margins in the future can be expected to decrease somewhatdue to increased competition resulting from an industry that is near maturitywith some excess capacity.
The HFCS industry is very capital intensive making entry into theindustry a limited and selective process. Estimated rates of return for HFCSprocessing has ranged between 16 to 44 percent during the 1980s.
North Dakota has a transportation advantage in distributing HFCS to thePacific Northwest and the northern tier of midwest states. North Dakota wouldcompete with Iowa for the Minnesota markets on an equal transportation costbasis. Population in these markets would not be of sufficient size unless ahigh level of penetration was achieved. To have a sufficient market area aNorth Dakota plant must be willing and able to penetrate the Southwest marketswhere it has a slight, $.19/cwt., transportation rate disadvantage compared toan Iowa-based plant.

APPENDIX


25
APPENDIX TABLE 1. UNITED STATES PRICES, 1982-1986
Corn Corn Corn OilYear Corna Gluten Feedb Gluten Mealb Crudec HFCS-42 HFCS-55
$/bu ---------- $/ton-------- -$/cwt.- $/cwt. dry basisd
1982 2.63 116.15 241.90 23.80 14.30 18.811983 2.98 114.57 269.15 24.70 18.64 21.061984 3.46 72.08 203.11 29.80 19.94 22.691985 2.35 89.48 209.38 25.58 17.75 20.031986 1.75 89.00 210.00 18.50 18.07 19.96
aNo. 2 Yellow Chicago.bIllinois Points.CTank cars, f.o.b. Decatur.dTank cars, delivered prices to Chicago-West. Note, a discount of $1/cwt. wasapplied to price series when estimating historical profitability to reflectf.o.b. plant prices net of discounts and other delivery costs (variousindustry sources).
SOURCES: Feed Situation and Outlook Yearbook, November, 1986. AgriculturalStatistics, USDA. Sugar and Sweetener Situation and Outlook Report.


27
References
Carman, Hoy F. November 1982. "A Trend Projection of High Fructose Corn SyrupSubstitution for Sugar." American Journal of Agricultural Economics.Volume 64, Number 4. Ames, IA: American Agricultural EconomicsAssociation.
Cubenas, G. J.; Schrader, L. F.; and Ford, J. R. D. September 1979. Cost ofProducing High-Fructose Corn Syrup: An Economic Engineering Analysis.Station Bulletin, Dept. of Agricultural Economics, AgriculturalExperiment Station, Purdue University, West Lafayette, Indiana.
Corn Refiners Association, Inc. 1987. Personal communications.
. 1986. Corn Refining. Washington, D.C.
S1986. Industry Statistics.
SNutritive Sweeteners from Corn.
National Soft Drink Association. 1985. NSDA: Sales Survey of the Soft DrinkIndustry, 1985. Washington, D.C.
. 1987. Personal communications, Washington, D.C.
United States Bureau of the Census. 1987. Statistical Abstract of the UnitedStates: 1987. 107th Edition. Washington, D.C.
USDA Statistical Reporting Service. 1983-1986. Agricultural Statistics.Washington, D.C.
. November 1986. Feed Situation and Outlook Yearbook.Washington, D.C.
. March 1987. Sugar and Sweetener Situation and Outlook Report.Washington, D.C.
United States Department of Energy, Energy Information Administration. 1986.State Energy Price and Expenditure Report, 1984. DOE/EIA - 0376(84),Washington, D.C.
Vuilleumier, Stephen. 1987. McKeany-Flavell Company, Oakland, CA. PersonalCommunication.