Preliminary evaluation of final cut lakes. - isws.illinois.edu · ISWS/CIR-130/78 Circular 130...
89
ISWS/CIR-130/78 Circular 130 STATB OF ILLINOIS DEPARTMENT OF REGISTRATION AND BDUCATION Preliminary Evaluation of Final Cut Lakes by JAMES P. GIBB and RALPH L. EVANS ILLINOIS STATE WATER SURVEY URBANA 1978
Transcript of Preliminary evaluation of final cut lakes. - isws.illinois.edu · ISWS/CIR-130/78 Circular 130...
ISWS/CIR-130/78
Circular 130 STATB OF ILLINOIS
DEPARTMENT OF REGISTRATION AND BDUCATION
Preliminary Evaluation of Final Cut Lakes
by JAMES P. GIBB and RALPH L. EVANS
ILLINOIS STATE WATER SURVEY URBANA
1978
CONTENTS
Abstract 1 Introduction 1
Acknowledgments 4 Physical features of the lakes 4
Lake selection 4 Volume and area determinations 5 Yield determinations 6
Groundwater yields 6 Surface yields 7
Summary of lake physical features 9 Regional water needs and resources 10 Water quality 12
Methods and materials 12 Dissolved oxygen, temperature, and pH 13 Total dissolved solids, hardness, sulfate, alkalinity 14 Sodium and potassium 17 Iron and manganese 17 Heavy metals 19 Sediments 19 Summary 20
Chemical s u i t a b i l i t y 21 Publ ic water supply 21 I r r i g a t i o n 22 Livestock water ing 23 Summary 24
Recommendations 24 Potential use recommendations 24 Recommendations for further study 25
Appendix. Lake summaries 27 1 -- Middle Grove lake 27 2 -- Sunspot West lake 35 3 -- Sunspot East lake 39 4 -- Pinckneyville No. 2 lake 43 5 -- Old DuQuoin pit 48 6 -- "East C" Streamline mine 52 7 -- Red Ray lake 60 8 -- Seminole lake 64 9 -- River King No. 6 lake 68 10 -- Coal City Area No. 1 lake 73 11 -- Clear lake 78 12 -- Northern Pit No. 14 82
References 87
PRELIMINARY EVALUATION OF FINAL CUT LAKES
by James P. Gibb and Ralph L. Evans
ABSTRACT
Twelve representative final cut impoundments were selected and studied to determine their volumes and estimated yield potentials. The volumes range from 97 to 3488 acre-feet and average 812 acre-feet. Estimated yield potentials at a 2-year recurrence interval range from 0.15 to 3.98 million gallons per day and average 0.86 million gallons per day. Projections of these estimates to lakes inventoried through June 30, 1971, were made and presented as county totals. The potential water supply from final cut impoundments for the 40 sur-face mining counties in Illinois range from 0 to 75.66 mgd. For 10 counties the estimated yield potential from final cut impoundments exceeds the estimated 2020 water demands.
Based on published water quality requirements and data collected during this study, only 2 of the 12 lakes studied have water quality suitable as a source for public water supply. Three are suitable for irrigation and all 12 are suitable for livestock watering. However, the quality of water from these impoundments is treatable and often comparable to the quality of alternative water sources. Each lake should be evaluated more closely in terms of yield, quality, and the economics of development as compared with other available water resources.
INTRODUCTION
The first commercial surface coal mine in the United States was opened near Danville, Illinois, in 1866. Horsedrawn scrapers were used to remove shallow overburden materials and the underlying coal (1). The development of a large steam-powered stripping shovel in 1911, followed by continued development of larger and more efficient equipment, has greatly expanded the surface mining industry (2). Surface mining now is a major method used in producing the nation's coal needs. In 1977, coal production in Illinois totaled approximately 53.9 million tons, of which about 45 percent C24.3 million tons) was from surface mining (preliminary figures from the Illinois Department of Mines and Minerals).
1
Surface mining for coal in Illinois occurs in 40 counties (see figure 1). Strippable bituminous coal reserves (coal seams at least 18 inches thick and less than 150 feet below land surface) are the largest in the United States (3). Excluding two areas not yet mapped, Simon and Smith (3) reported an estimated 19 billion tons underlying 2.3 million acres of Illinois land.
As of June 30, 1971, a total of 163,643 acres (only 7 percent of the potential strippable area) of Illinois land had been surface mined for coal. Twelve counties contained 90 percent of the mined acreage: Fulton 40,524; Perry 20,317; Knox 17,350; Williamson 12,701; St. Clair 12,482; Saline 9504; Grundy 7134; Peoria 6187; Will 6067; Randolph 5425; Vermilion 5297; and Jack-son 4899 acres (4).
Water on surface-mined lands totaled 14,243 acres of which 12,149 acres are lakes developed in abandoned pits resulting from the final cut and the haulage roads(4).
There is extensive literature concerning strip mining of coal in Illinois. Most reports discuss the coal reserves suitable for surface mining, the reclamation of land after mining, and acid drainage problems resulting from mine activities. Recreational use of strip-mined lands and their waters also has received considerable attention. However, very little work has been done to better understand the hydrology of strip-mined lands or to evaluate the potential resource of the water bodies contained in strip-mined areas.
Federal legislation in the Coal Surface Mine Regulation Act now requires that strip mine impoundments or water bodies be filled. This action alerted officials in the state of Illinois to the fact that the potential resources offered by these lakes may be destroyed. Personnel of the Department of Mines and Minerals particularly were concerned and supportive of a study of these potential resources. Because so little is known of the character of final cut impoundments this reconnaissance-type investigation was undertaken with the support of the Illinois Institute for Environmental Quality, Project No. 80.096. The purpose of the study was to evaluate the usefulness of final cut impoundments for public water supply, irrigation, and other consumptive uses. These data have also been reported in "Reconnaissance Study of Final Cut Impoundments" published by the Institute for Environmental Quality (IEQ Document No. 78-25).
Four general study areas, Grundy, St. Clair, Fulton, and Perry Counties were selected. In each study area, 3 lakes of representative size and geo-logic-hydrologic setting were chosen for detailed study. Each lake was surveyed to determine its area and capacity. An estimate of the sustained yield of each lake also was made. Water samples for chemical analysis were collected from each lake at three time intervals to determine the chemical, physical, and biological quality of the water as it relates to the proposed uses.
On the basis of results of the sample lake studies and available maps of all lakes in the 40 counties where surface mining exists, estimates of the water resource from final cut impoundments were made. A general inventory of other water resources and projected needs for these counties also is presented. The potential uses of final cut lakes are discussed from the basis of water quality, quantity available, and the estimated needs of the area.
2
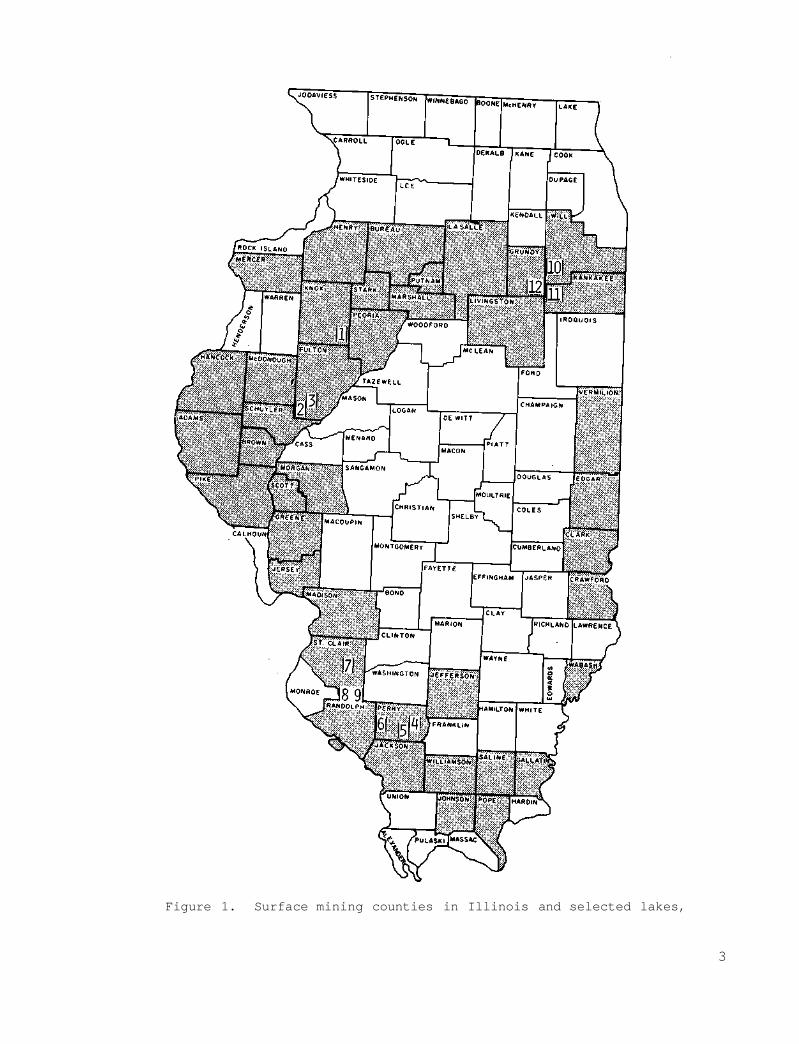
Figure 1. Surface mining counties in Illinois and selected lakes,
3
Recommendations concerning further study of final cut impoundments also are made.
Acknowledgments
The authors wish to thank the private clubs and coal companies that per-mitted studies to be conducted on lakes on their property. The cooperation of Coal City Area No. 1 Club, South Wilmington Sportsman Club, Amax Coal Company, Consolidated Coal Company, Peabody Coal Company, and Southwestern Coal Company is greatly appreciated. Special thanks go to Al Grandt and Jack Lowery of Peabody Coal Company for their assistance in arranging the pump test on the Middle Grove impoundment. Mr. Gene Filer, Department of Mines and Minerals, arranged for the flight over the strip mine areas and provided support of the project from its beginning.
Field measurements and calculations of lake volumes and yields were made by William C. Bogner, Assistant Hydrologist, with the assistance of Steve Wirth and Ken Smith, Hydrology Assistants. Water Quality measurements and samples were collected by Donald Roseboom and Tom Hill, Assistant Biologists, and Jack Williams, Technical Assistant. Analyses of water samples were conducted at the Peoria and Urbana laboratories of the Illinois State Water Survey.
The project was conducted under the general supervision of John B. Stall, Engineer Emeritus and former Head of Hydrology, and Richard J. Schicht, Head of Hydrology, Illinois State Water Survey. Schicht also reviewed the final manuscript. The art work was prepared by June Blake and William Motherway, Jr. The draft and final manuscripts were typed by Diane Stelter and Janny Travers. J. Loreena Ivens and Patricia A. Motherway edited the final report, and Diane Stelter prepared the camera copy.
PHYSICAL FEATURES OF THE LAKES
Lake Selection
During September 1977, well over 100 strip mine lakes were observed from the air and approximately 60 were visited for closer examination. Lakes of representative sizes and shapes initially were selected from the air. During field examinations, final selections were made on the basis of access to the lakes, proximity to other water bodies or courses into which water could be pumped, and the cooperativeness of the property owners on which the lakes are located. Twelve lakes finally were chosen at locations indicated on figure 1 and table 1.
Two of the selected lakes, Pinckneyville No. 2 (lake 4) and "East C" Streamline (lake 6), were still in the process of filling after the conclusion of mining. It was hoped that data collected on these lakes would prove useful in determining the yield capabilities of these lakes.
4
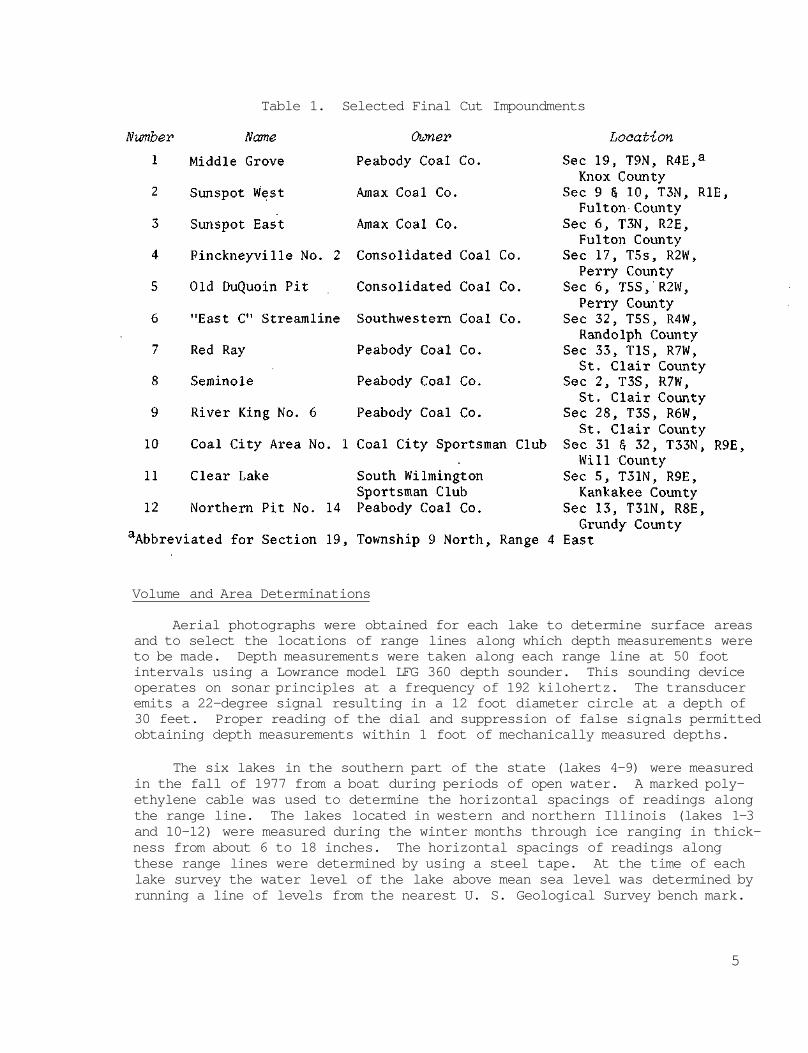
Table 1. Selected Final Cut Impoundments
Volume and Area Determinations
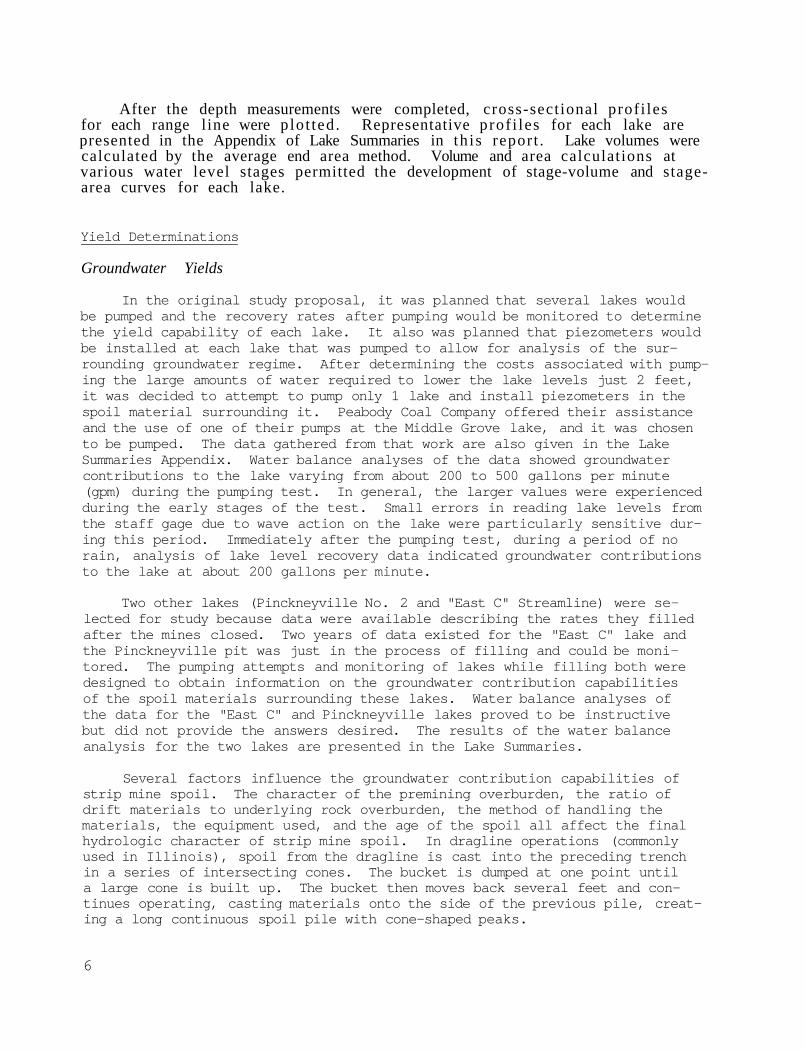
Aerial photographs were obtained for each lake to determine surface areas and to select the locations of range lines along which depth measurements were to be made. Depth measurements were taken along each range line at 50 foot intervals using a Lowrance model LFG 360 depth sounder. This sounding device operates on sonar principles at a frequency of 192 kilohertz. The transducer emits a 22-degree signal resulting in a 12 foot diameter circle at a depth of 30 feet. Proper reading of the dial and suppression of false signals permitted obtaining depth measurements within 1 foot of mechanically measured depths.
The six lakes in the southern part of the state (lakes 4-9) were measured in the fall of 1977 from a boat during periods of open water. A marked polyethylene cable was used to determine the horizontal spacings of readings along the range line. The lakes located in western and northern Illinois (lakes 1-3 and 10-12) were measured during the winter months through ice ranging in thickness from about 6 to 18 inches. The horizontal spacings of readings along these range lines were determined by using a steel tape. At the time of each lake survey the water level of the lake above mean sea level was determined by running a line of levels from the nearest U. S. Geological Survey bench mark.
5
After the depth measurements were completed, cross-sectional profi les for each range line were plot ted. Representative prof i les for each lake are presented in the Appendix of Lake Summaries in th is report . Lake volumes were calculated by the average end area method. Volume and area calculations at various water level stages permitted the development of stage-volume and stage-area curves for each lake.
Yield Determinations
Groundwater Yields
In the original study proposal, it was planned that several lakes would be pumped and the recovery rates after pumping would be monitored to determine the yield capability of each lake. It also was planned that piezometers would be installed at each lake that was pumped to allow for analysis of the surrounding groundwater regime. After determining the costs associated with pump-ing the large amounts of water required to lower the lake levels just 2 feet, it was decided to attempt to pump only 1 lake and install piezometers in the spoil material surrounding it. Peabody Coal Company offered their assistance and the use of one of their pumps at the Middle Grove lake, and it was chosen to be pumped. The data gathered from that work are also given in the Lake Summaries Appendix. Water balance analyses of the data showed groundwater contributions to the lake varying from about 200 to 500 gallons per minute (gpm) during the pumping test. In general, the larger values were experienced during the early stages of the test. Small errors in reading lake levels from the staff gage due to wave action on the lake were particularly sensitive during this period. Immediately after the pumping test, during a period of no rain, analysis of lake level recovery data indicated groundwater contributions to the lake at about 200 gallons per minute.
Two other lakes (Pinckneyville No. 2 and "East C" Streamline) were selected for study because data were available describing the rates they filled after the mines closed. Two years of data existed for the "East C" lake and the Pinckneyville pit was just in the process of filling and could be monitored. The pumping attempts and monitoring of lakes while filling both were designed to obtain information on the groundwater contribution capabilities of the spoil materials surrounding these lakes. Water balance analyses of the data for the "East C" and Pinckneyville lakes proved to be instructive but did not provide the answers desired. The results of the water balance analysis for the two lakes are presented in the Lake Summaries.
Several factors influence the groundwater contribution capabilities of strip mine spoil. The character of the premining overburden, the ratio of drift materials to underlying rock overburden, the method of handling the materials, the equipment used, and the age of the spoil all affect the final hydrologic character of strip mine spoil. In dragline operations (commonly used in Illinois), spoil from the dragline is cast into the preceding trench in a series of intersecting cones. The bucket is dumped at one point until a large cone is built up. The bucket then moves back several feet and continues operating, casting materials onto the side of the previous pile, creating a long continuous spoil pile with cone-shaped peaks.
6
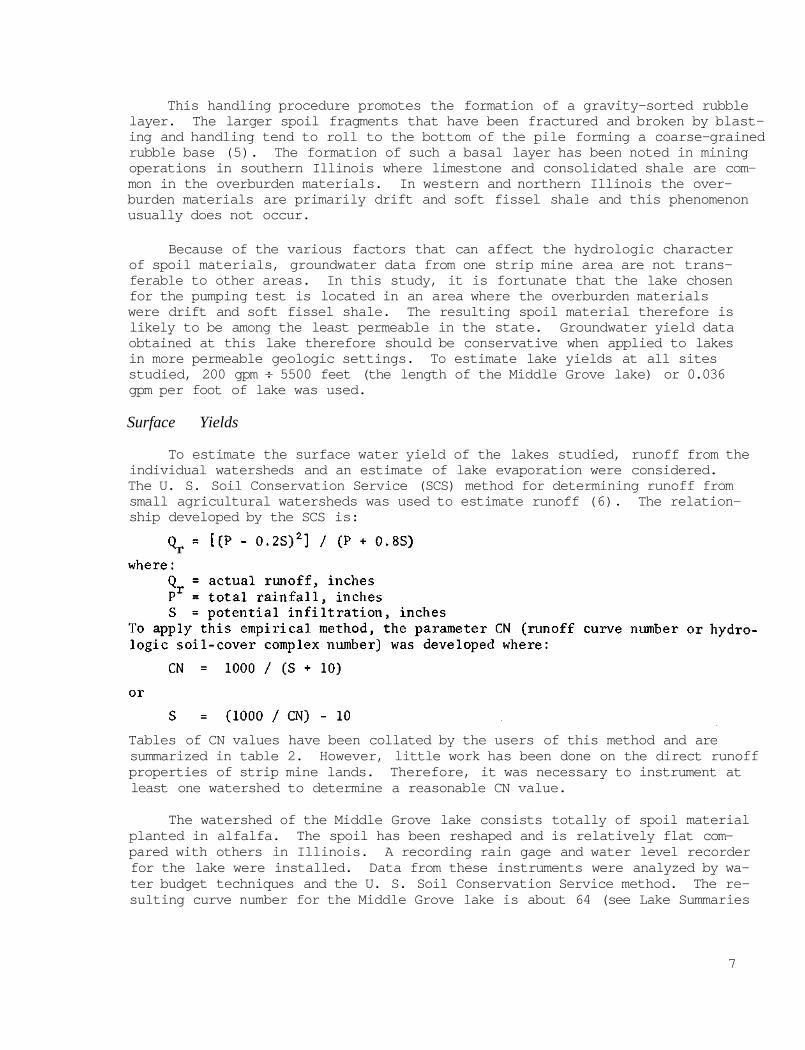
This handling procedure promotes the formation of a gravity-sorted rubble layer. The larger spoil fragments that have been fractured and broken by blasting and handling tend to roll to the bottom of the pile forming a coarse-grained rubble base (5). The formation of such a basal layer has been noted in mining operations in southern Illinois where limestone and consolidated shale are common in the overburden materials. In western and northern Illinois the overburden materials are primarily drift and soft fissel shale and this phenomenon usually does not occur.
Because of the various factors that can affect the hydrologic character of spoil materials, groundwater data from one strip mine area are not transferable to other areas. In this study, it is fortunate that the lake chosen for the pumping test is located in an area where the overburden materials were drift and soft fissel shale. The resulting spoil material therefore is likely to be among the least permeable in the state. Groundwater yield data obtained at this lake therefore should be conservative when applied to lakes in more permeable geologic settings. To estimate lake yields at all sites studied, 200 gpm ÷ 5500 feet (the length of the Middle Grove lake) or 0.036 gpm per foot of lake was used.
Surface Yields
To estimate the surface water yield of the lakes studied, runoff from the individual watersheds and an estimate of lake evaporation were considered. The U. S. Soil Conservation Service (SCS) method for determining runoff from small agricultural watersheds was used to estimate runoff (6). The relationship developed by the SCS is:
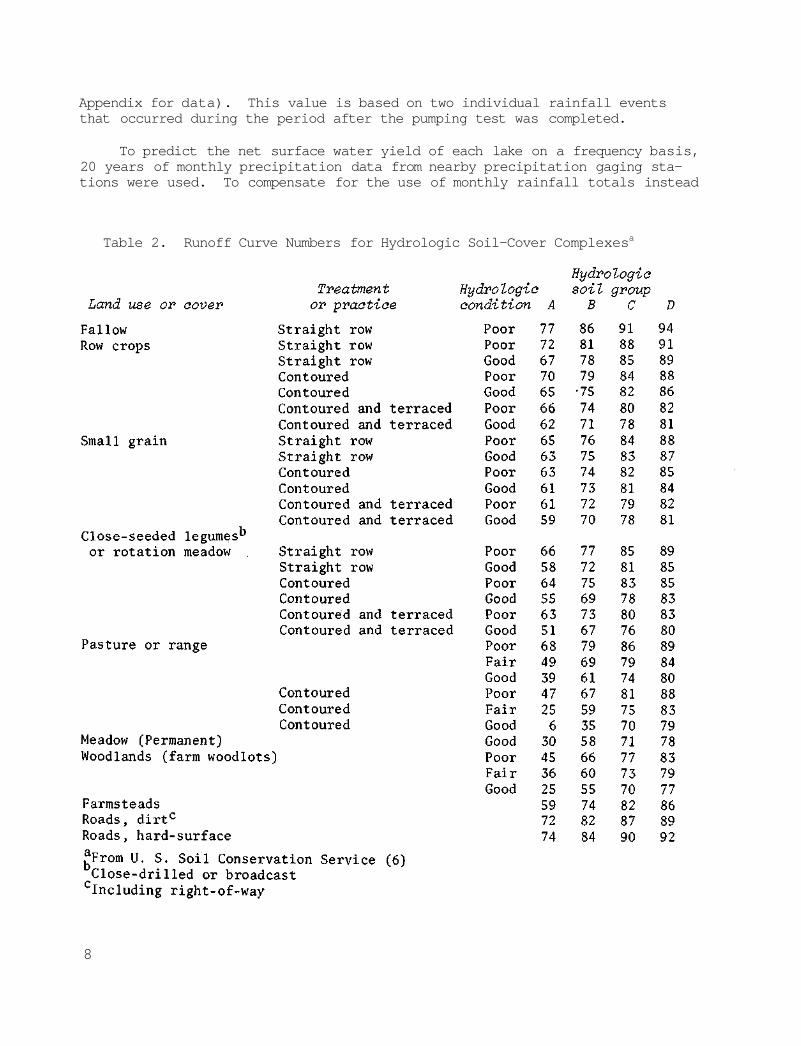
Tables of CN values have been collated by the users of this method and are summarized in table 2. However, little work has been done on the direct runoff properties of strip mine lands. Therefore, it was necessary to instrument at least one watershed to determine a reasonable CN value.
The watershed of the Middle Grove lake consists totally of spoil material planted in alfalfa. The spoil has been reshaped and is relatively flat com-pared with others in Illinois. A recording rain gage and water level recorder for the lake were installed. Data from these instruments were analyzed by wa-ter budget techniques and the U. S. Soil Conservation Service method. The resulting curve number for the Middle Grove lake is about 64 (see Lake Summaries
7
Appendix for data). This value is based on two individual rainfall events that occurred during the period after the pumping test was completed.
To predict the net surface water yield of each lake on a frequency basis, 20 years of monthly precipitation data from nearby precipitation gaging stations were used. To compensate for the use of monthly rainfall totals instead
Table 2. Runoff Curve Numbers for Hydrologic Soil-Cover Complexesa
8
of individual events, the curve number for the Middle Grove lake was adjusted downward to 60. Curve numbers for the other lakes were chosen on the basis of the relative condition of each watershed as compared with that at Middle Grove. The percentages of farm land and spoil and the condition of the spoil were considered in selecting the final curve numbers.
Net surface water yields for each lake were calculated for the years 1958 through 1977 by applying the average monthly lake evaporation to each month's calculated runoff. Monthly evaporation rates for each lake were taken directly from state maps presented by Roberts and Stall (7). Net annual runoff totals were ranked and the values exceeded 90, 50, 20, and 10 percent of the time are presented for each lake. These values correspond to recurrence intervals of 1.1, 2, 5, and 10 years, respectively.
Summary of Lake Physical Features
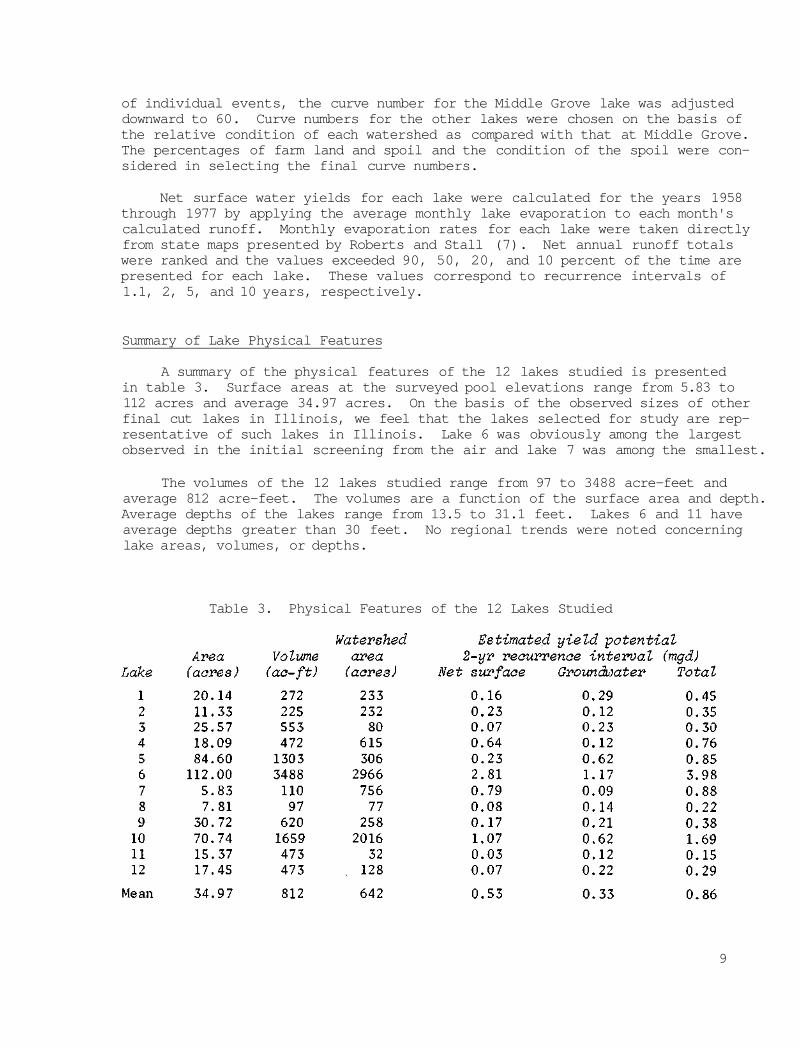
A summary of the physical features of the 12 lakes studied is presented in table 3. Surface areas at the surveyed pool elevations range from 5.83 to 112 acres and average 34.97 acres. On the basis of the observed sizes of other final cut lakes in Illinois, we feel that the lakes selected for study are representative of such lakes in Illinois. Lake 6 was obviously among the largest observed in the initial screening from the air and lake 7 was among the smallest.
The volumes of the 12 lakes studied range from 97 to 3488 acre-feet and average 812 acre-feet. The volumes are a function of the surface area and depth. Average depths of the lakes range from 13.5 to 31.1 feet. Lakes 6 and 11 have average depths greater than 30 feet. No regional trends were noted concerning lake areas, volumes, or depths.
Table 3. Physical Features of the 12 Lakes Studied
9
The watersheds of the 12 lakes studied are extremely variable in size and character. They range in size from 32 to 2966 acres and average 642 acres. A general description of each watershed is presented in the appendix.
The estimated yield potentials for recurrence intervals of 1.1, 2, 5, and 10 years are presented for each lake in the Lake Summaries. Two-year recurrence interval yields (or the yield that can be expected to occur once in two years) are presented in table 3. Net surface yields in million gallons per day (mgd) range from 0.03 to 2.81 and average 0.53. These estimates include runoff from the watershed minus lake evaporation. The net surface yield primarily is a function of watershed size and runoff characteristics or curve number.
The estimated groundwater yield potentials for the 12 lakes studied range from 0.09 to 1.17 million gallons per day and average 0.33 million gallons per day. These estimates are based solely on the data collected at the Middle Grove lake site. However, as stated earlier, these estimates probably are conservative. It is very likely that lakes 4, 5, 6, 8, and 9 would be capable of yielding larger quantities of groundwater than estimated. The overburden materials for these lakes all contained significant quantities of limestone and consolidated shales that could result in a more permeable spoil and perhaps a very permeable rubble base.
The total estimated yield potential of the 12 lakes for a recurrence interval of 2 years ranges from 0.15 to 3.98 million gallons per day and averages 0.86 million gallons per day. These values are conservative estimates and are functions of the individual characteristics of each lake. These estimates also do not allow for any drawdown in lake levels (the lakes would theoretically al-ways be full). Direct application of these values to other lakes is not recom-mended, and if a lake is to be used for a consumptive use, a more detailed yield analysis should be undertaken. No regional trends were noted in the yield estimates completed for the 12 lakes studied.
REGIONAL WATER NEEDS AND RESOURCES
One of the stated purposes of this project was to estimate the total potential water resource offered by final cut impoundments in Illinois. Because of the extreme variability of estimated individual lake yields and of chemical quality, to be discussed later, only very general regional estimates were made. Data assembled by Csallany and others (8) include estimates of potential water resources from groundwater, streamflow, existing man-made reservoirs, and potential reservoirs. Table 4 presents those data for the 40 counties in Illinois where surface mining of coal exists. For comparison, an estimate was made of water available from all final cut impoundments inventoried by Haynes and Klimstra (4). It should be noted that their inventory included lakes in existence through June 30, 1971.
The estimated 2000 and 2020 average water demands for each county were made by the formula developed by Roberts and others (9) and population pro-
10
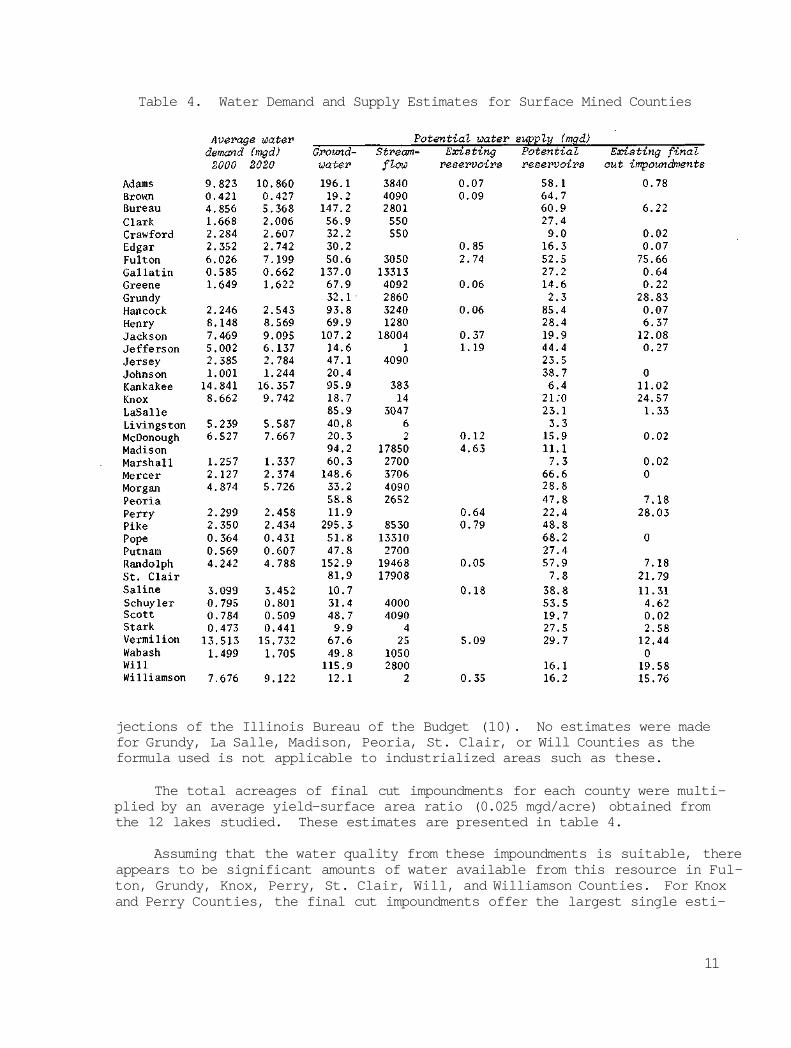
Table 4. Water Demand and Supply Estimates for Surface Mined Counties
jections of the Illinois Bureau of the Budget (10). No estimates were made for Grundy, La Salle, Madison, Peoria, St. Clair, or Will Counties as the formula used is not applicable to industrialized areas such as these.
The total acreages of final cut impoundments for each county were multiplied by an average yield-surface area ratio (0.025 mgd/acre) obtained from the 12 lakes studied. These estimates are presented in table 4.
Assuming that the water quality from these impoundments is suitable, there appears to be significant amounts of water available from this resource in Fulton, Grundy, Knox, Perry, St. Clair, Will, and Williamson Counties. For Knox and Perry Counties, the final cut impoundments offer the largest single esti-
11
mated resource. For 10 counties (Bureau, Fulton, Jackson, Knox, Perry, Randolph, Saline, Schuyler, Stark, and Williamson) the estimated yield potential from final cut impoundments exceeds the estimated 2020 water demands.
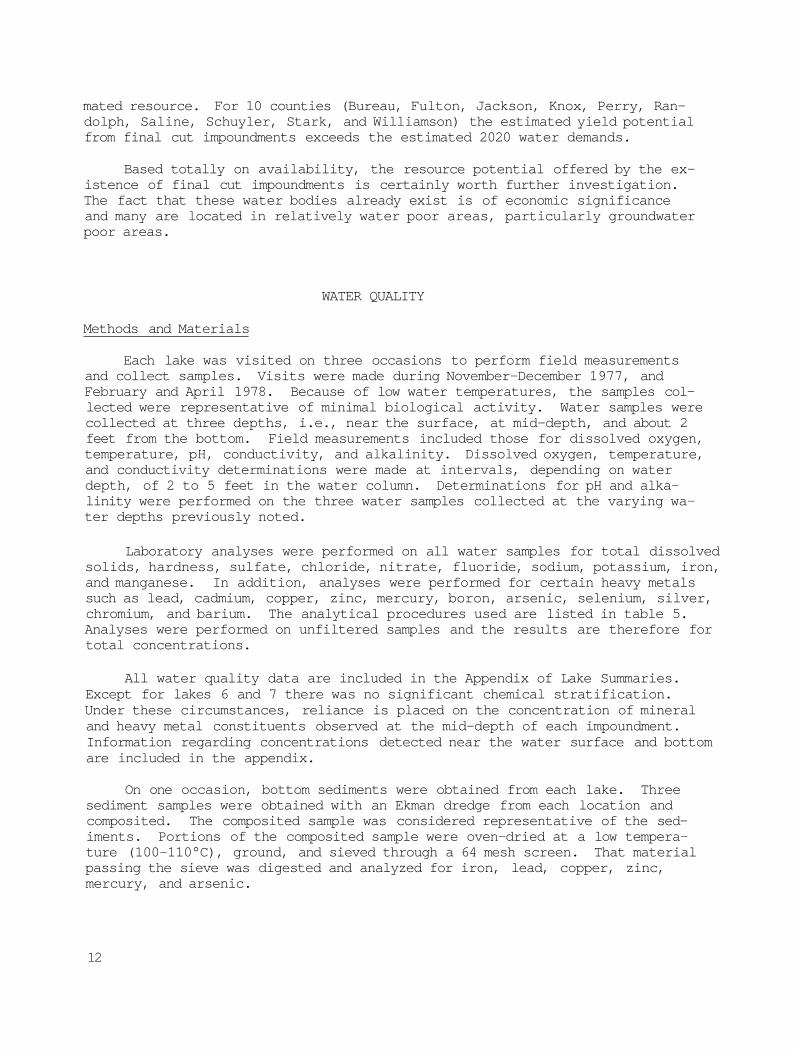
Based totally on availability, the resource potential offered by the existence of final cut impoundments is certainly worth further investigation. The fact that these water bodies already exist is of economic significance and many are located in relatively water poor areas, particularly groundwater poor areas.
WATER QUALITY
Methods and Materials
Each lake was visited on three occasions to perform field measurements and collect samples. Visits were made during November-December 1977, and February and April 1978. Because of low water temperatures, the samples col-lected were representative of minimal biological activity. Water samples were collected at three depths, i.e., near the surface, at mid-depth, and about 2 feet from the bottom. Field measurements included those for dissolved oxygen, temperature, pH, conductivity, and alkalinity. Dissolved oxygen, temperature, and conductivity determinations were made at intervals, depending on water depth, of 2 to 5 feet in the water column. Determinations for pH and alka-linity were performed on the three water samples collected at the varying water depths previously noted.
Laboratory analyses were performed on all water samples for total dissolved solids, hardness, sulfate, chloride, nitrate, fluoride, sodium, potassium, iron, and manganese. In addition, analyses were performed for certain heavy metals such as lead, cadmium, copper, zinc, mercury, boron, arsenic, selenium, silver, chromium, and barium. The analytical procedures used are listed in table 5. Analyses were performed on unfiltered samples and the results are therefore for total concentrations.
All water quality data are included in the Appendix of Lake Summaries. Except for lakes 6 and 7 there was no significant chemical stratification. Under these circumstances, reliance is placed on the concentration of mineral and heavy metal constituents observed at the mid-depth of each impoundment. Information regarding concentrations detected near the water surface and bottom are included in the appendix.
On one occasion, bottom sediments were obtained from each lake. Three sediment samples were obtained with an Ekman dredge from each location and composited. The composited sample was considered representative of the sediments. Portions of the composited sample were oven-dried at a low temperature (100-110°C), ground, and sieved through a 64 mesh screen. That material passing the sieve was digested and analyzed for iron, lead, copper, zinc, mercury, and arsenic.
12
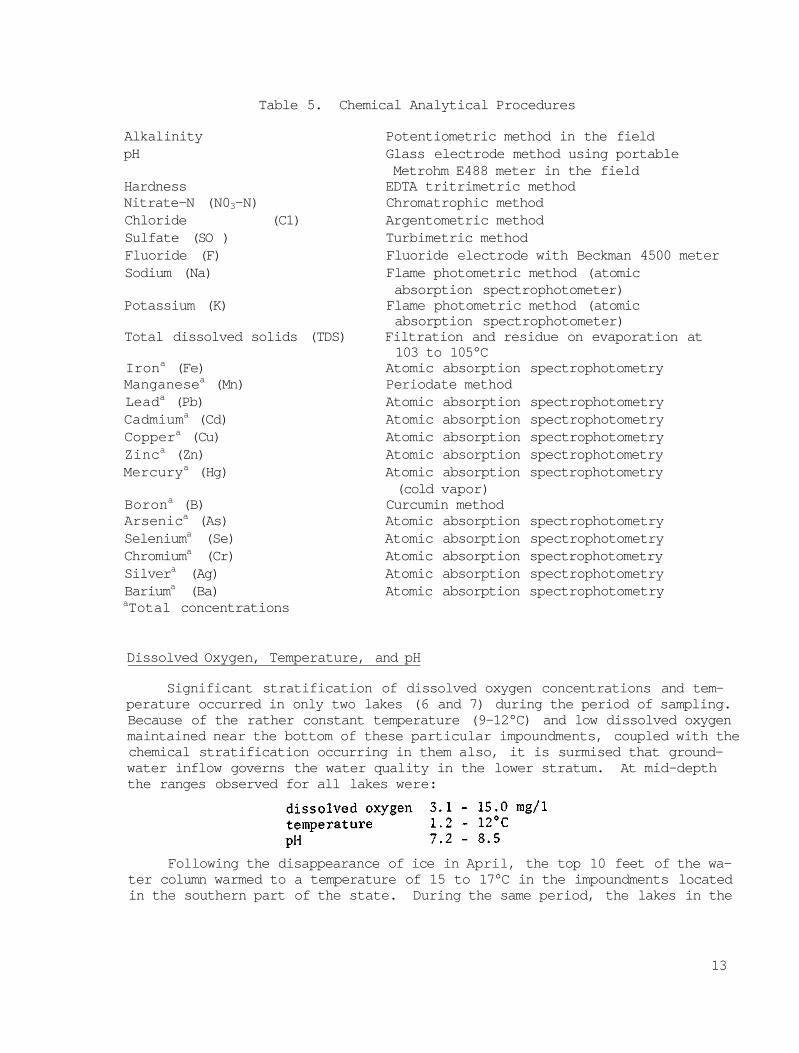
Table 5. Chemical Analytical Procedures
Alkalinity Potentiometric method in the field pH Glass electrode method using portable
Metrohm E488 meter in the field Hardness EDTA tritrimetric method Nitrate-N (N03-N) Chromatrophic method Chloride (C1) Argentometric method Sulfate (SO ) Turbimetric method Fluoride (F) Fluoride electrode with Beckman 4500 meter Sodium (Na) Flame photometric method (atomic
absorption spectrophotometer) Potassium (K) Flame photometric method (atomic
absorption spectrophotometer) Total dissolved solids (TDS) Filtration and residue on evaporation at
103 to 105°C Irona (Fe) Atomic absorption spectrophotometry Manganesea (Mn) Periodate method Leada (Pb) Atomic absorption spectrophotometry Cadmiuma (Cd) Atomic absorption spectrophotometry Coppera (Cu) Atomic absorption spectrophotometry Zinca (Zn) Atomic absorption spectrophotometry Mercurya (Hg) Atomic absorption spectrophotometry
(cold vapor) Borona (B) Curcumin method Arsenica (As) Atomic absorption spectrophotometry Seleniuma (Se) Atomic absorption spectrophotometry Chromiuma (Cr) Atomic absorption spectrophotometry Silvera (Ag) Atomic absorption spectrophotometry Bariuma (Ba) Atomic absorption spectrophotometry aTotal concentrations
Dissolved Oxygen, Temperature, and pH
Significant stratification of dissolved oxygen concentrations and tem-perature occurred in only two lakes (6 and 7) during the period of sampling. Because of the rather constant temperature (9-12°C) and low dissolved oxygen maintained near the bottom of these particular impoundments, coupled with the chemical stratification occurring in them also, it is surmised that ground-water inflow governs the water quality in the lower stratum. At mid-depth the ranges observed for all lakes were:
Following the disappearance of ice in April, the top 10 feet of the wa-ter column warmed to a temperature of 15 to 17°C in the impoundments located in the southern part of the state. During the same period, the lakes in the
13
northern part ranged from 10 to 12°C. With the exception of lakes 6 and 7 the dissolved oxygen concentrations generally exceed 6 milligrams per liter (mg/1) in the water column. The values for pH are not unlike those observed in many water impoundments in Illinois.
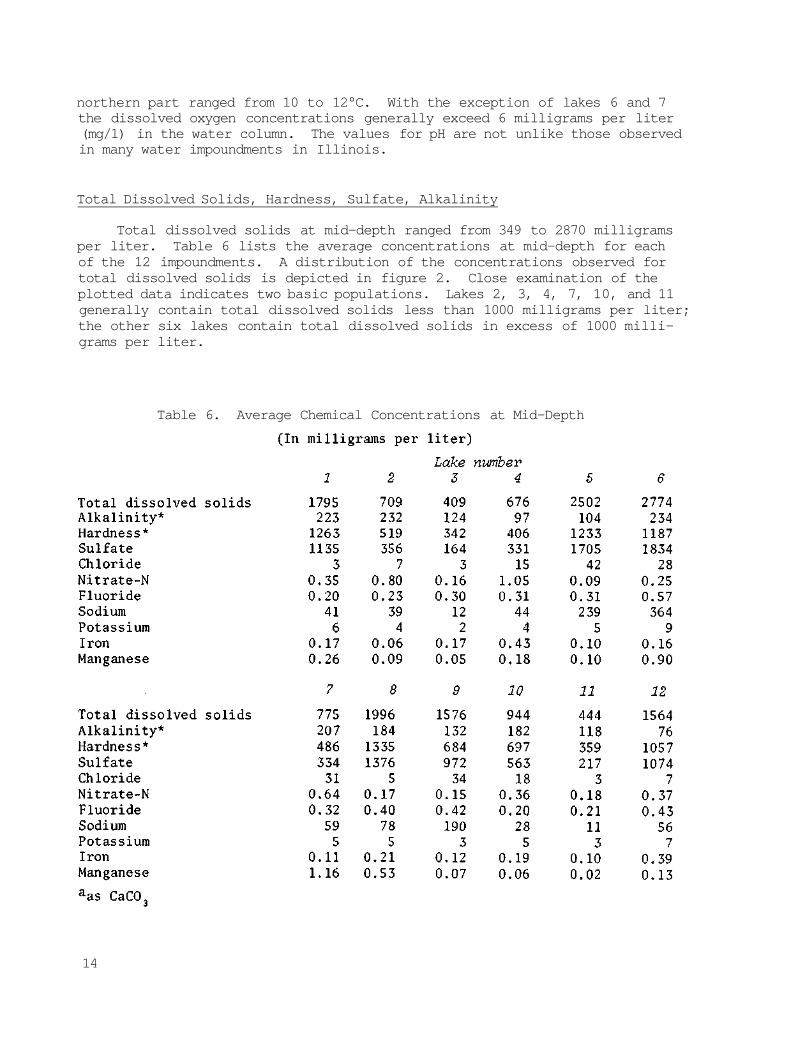
Total Dissolved Solids, Hardness, Sulfate, Alkalinity
Total dissolved solids at mid-depth ranged from 349 to 2870 milligrams per liter. Table 6 lists the average concentrations at mid-depth for each of the 12 impoundments. A distribution of the concentrations observed for total dissolved solids is depicted in figure 2. Close examination of the plotted data indicates two basic populations. Lakes 2, 3, 4, 7, 10, and 11 generally contain total dissolved solids less than 1000 milligrams per liter; the other six lakes contain total dissolved solids in excess of 1000 milligrams per liter.
Table 6. Average Chemical Concentrations at Mid-Depth
14
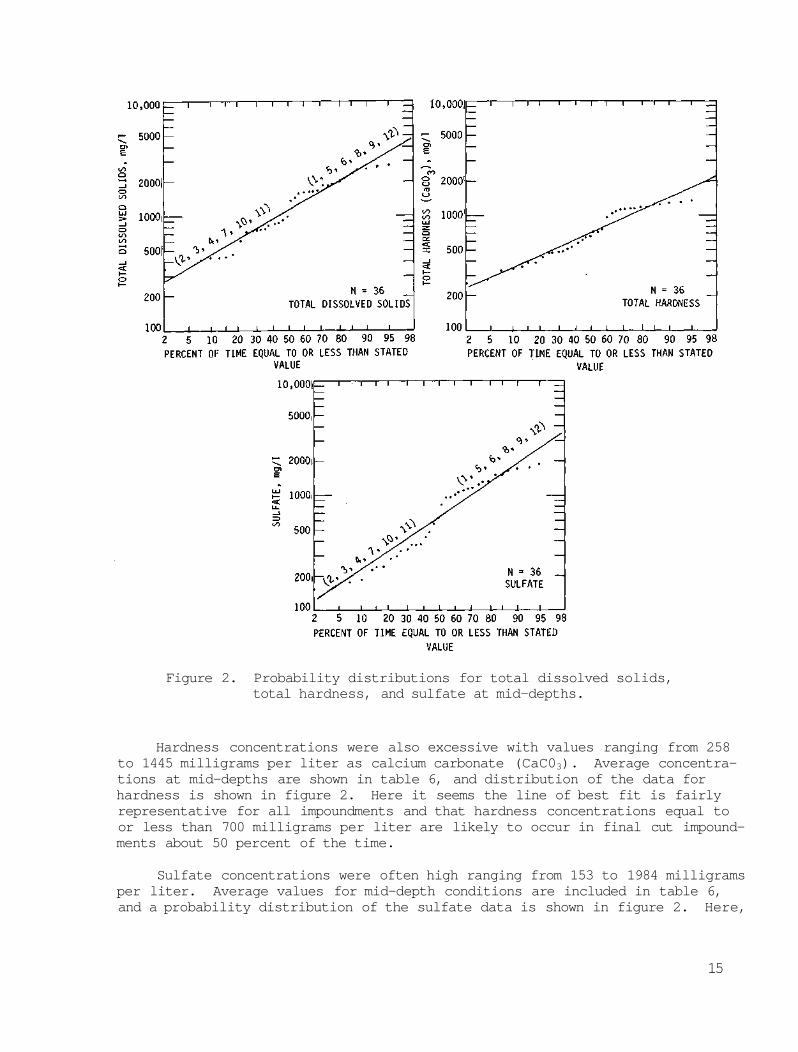
Figure 2. Probability distributions for total dissolved solids, total hardness, and sulfate at mid-depths.
Hardness concentrations were also excessive with values ranging from 258 to 1445 milligrams per liter as calcium carbonate (CaC03). Average concentrations at mid-depths are shown in table 6, and distribution of the data for hardness is shown in figure 2. Here it seems the line of best fit is fairly representative for all impoundments and that hardness concentrations equal to or less than 700 milligrams per liter are likely to occur in final cut impoundments about 50 percent of the time.
Sulfate concentrations were often high ranging from 153 to 1984 milligrams per liter. Average values for mid-depth conditions are included in table 6, and a probability distribution of the sulfate data is shown in figure 2. Here,
15
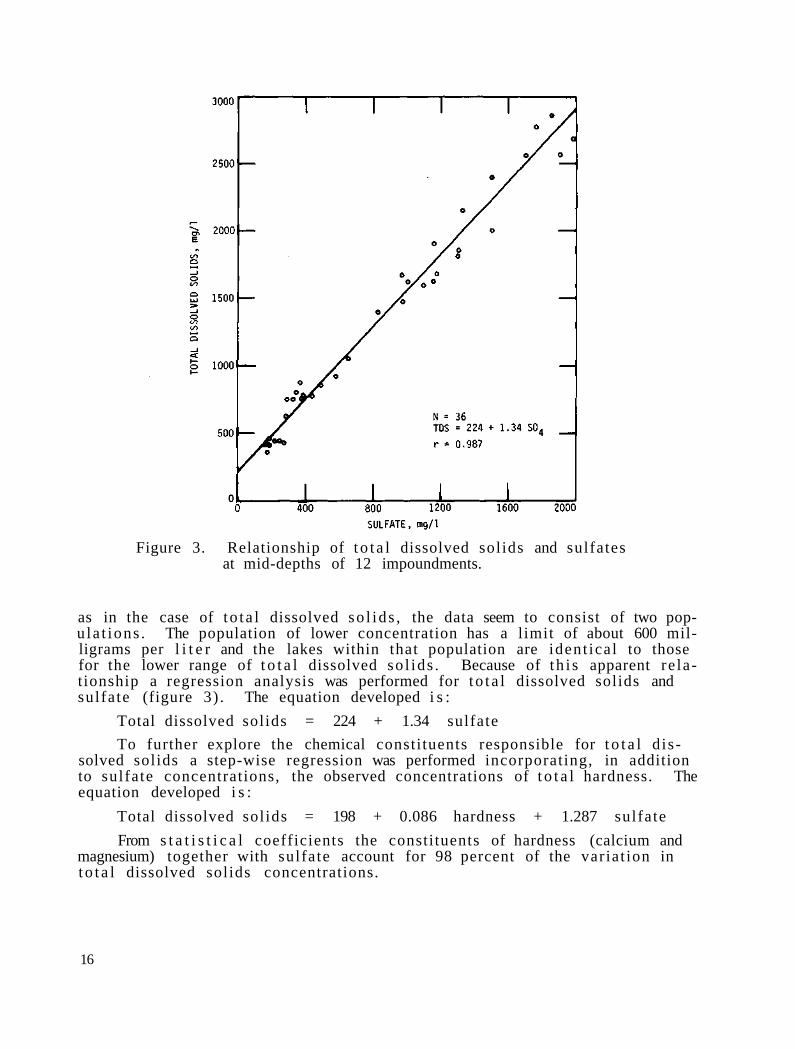
Figure 3. Relationship of t o t a l dissolved solids and sulfates at mid-depths of 12 impoundments.
as in the case of to ta l dissolved so l ids , the data seem to consist of two popu la t ions . The population of lower concentration has a limit of about 600 milligrams per l i t e r and the lakes within that population are ident ica l to those for the lower range of t o t a l dissolved so l ids . Because of th i s apparent re lationship a regression analysis was performed for t o t a l dissolved solids and sulfate (figure 3) . The equation developed i s :
Total dissolved solids = 224 + 1.34 sulfate
To further explore the chemical constituents responsible for t o t a l d issolved solids a step-wise regression was performed incorporating, in addition to sulfate concentrations, the observed concentrations of t o t a l hardness. The equation developed i s :
Total dissolved solids = 198 + 0.086 hardness + 1.287 sulfate
From s t a t i s t i c a l coefficients the constituents of hardness (calcium and magnesium) together with sulfate account for 98 percent of the variat ion in t o t a l dissolved solids concentrations.
16
The a lka l in i ty of the impoundment waters consists mainly of bicarbonates (HCO3). The concentrations range from 69 to 255 milligrams per l i t e r as CaCO . Average concentrations at mid-depth are included in table 6. As in the case of t o t a l dissolved so l ids , su l fa tes , and hardness, the impoundments cannot be c lass i f ied on a geographical basis for a lka l in i ty e i ther . However, they can be grouped according to concentration, as follows:
Alkalinity < 150 mg/1 - Lakes 2, 4, 5, 9, 11, 12 Alkalinity > 150 mg/1 - Lakes 1, 3, 6, 7, 8, 10
Hardness = 1 9 2 + 0 . 6 9 a lka l in i ty + 0.59 sulfate
S t a t i s t i c a l coefficients suggest that a lka l in i ty and sulfate account for 92 percent of the variat ion in hardness concentrations.
Chloride, N i t r a t e , and Fluoride
The variat ion in concentrations of chloride, n i t ra te-N, and fluoride in the 12 impoundments is not s igni f icant . The following ranges were observed:
Chloride 2 - 4 mg/1 Nitrate-N 0.02 - 1.2 mg/1 Fluoride 0.17 - 0.64 mg/1
Average concentrations at mid-depth are included in table 6.
Sodium and Potassium
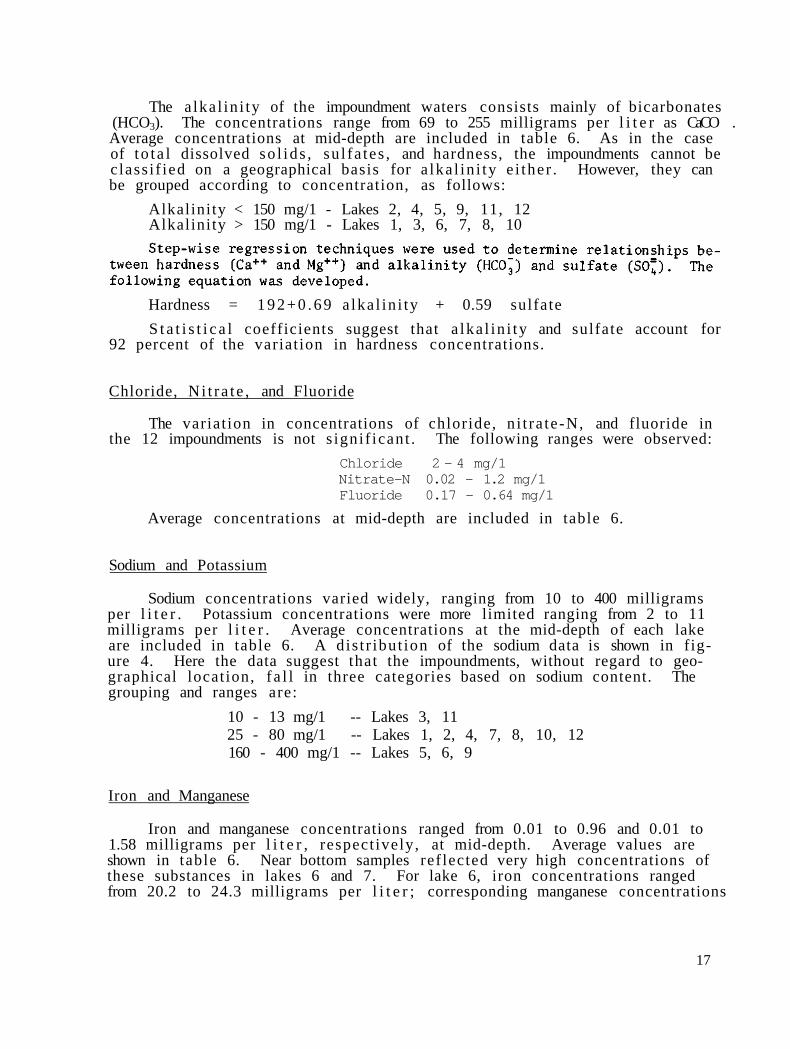
Sodium concentrations varied widely, ranging from 10 to 400 milligrams per l i t e r . Potassium concentrations were more limited ranging from 2 to 11 milligrams per l i t e r . Average concentrations at the mid-depth of each lake are included in table 6. A dis t r ibut ion of the sodium data is shown in figure 4. Here the data suggest that the impoundments, without regard to geographical location, f a l l in three categories based on sodium content. The grouping and ranges are:
10 - 13 mg/1 -- Lakes 3, 11 25 - 80 mg/1 -- Lakes 1, 2, 4, 7, 8, 10, 12 160 - 400 mg/1 -- Lakes 5, 6, 9
Iron and Manganese
Iron and manganese concentrations ranged from 0.01 to 0.96 and 0.01 to 1.58 milligrams per l i t e r , respect ively, at mid-depth. Average values are shown in table 6. Near bottom samples ref lected very high concentrations of these substances in lakes 6 and 7. For lake 6, iron concentrations ranged from 20.2 to 24.3 milligrams per l i t e r ; corresponding manganese concentrations
17
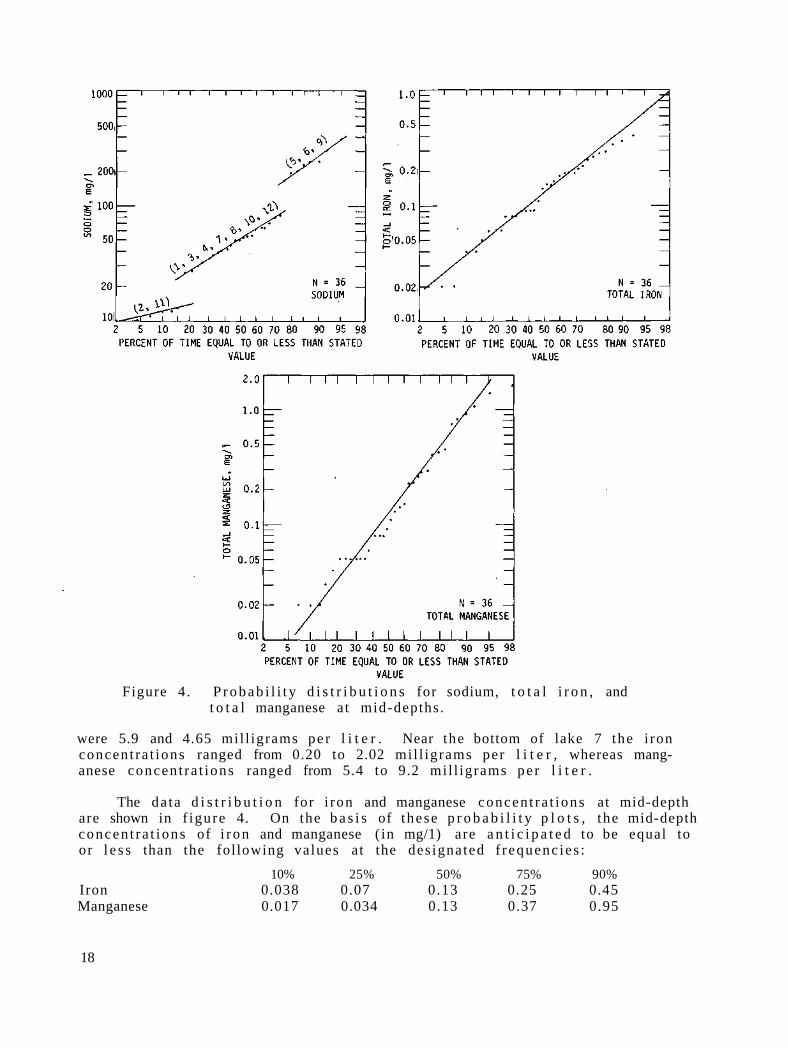
Figure 4 . P r o b a b i l i t y d i s t r i b u t i o n s for sodium, t o t a l i r o n , and t o t a l manganese at mid-depths.
were 5.9 and 4.65 mil l igrams pe r l i t e r . Near the bottom of lake 7 the i ron concent ra t ions ranged from 0.20 to 2.02 mil l igrams per l i t e r , whereas manganese concen t ra t ions ranged from 5.4 to 9.2 mi l l igrams pe r l i t e r .
The da ta d i s t r i b u t i o n for i ron and manganese concen t ra t ions at mid-depth are shown in f igure 4. On the b a s i s of these p r o b a b i l i t y p l o t s , the mid-depth concen t ra t ions of i r on and manganese ( in mg/1) are a n t i c i p a t e d to be equal to or l e s s than the following values at the des ignated f requenc ies :
10% 25% 50% 75% 90% Iron 0.038 0.07 0.13 0.25 0.45 Manganese 0.017 0.034 0.13 0.37 0.95
18
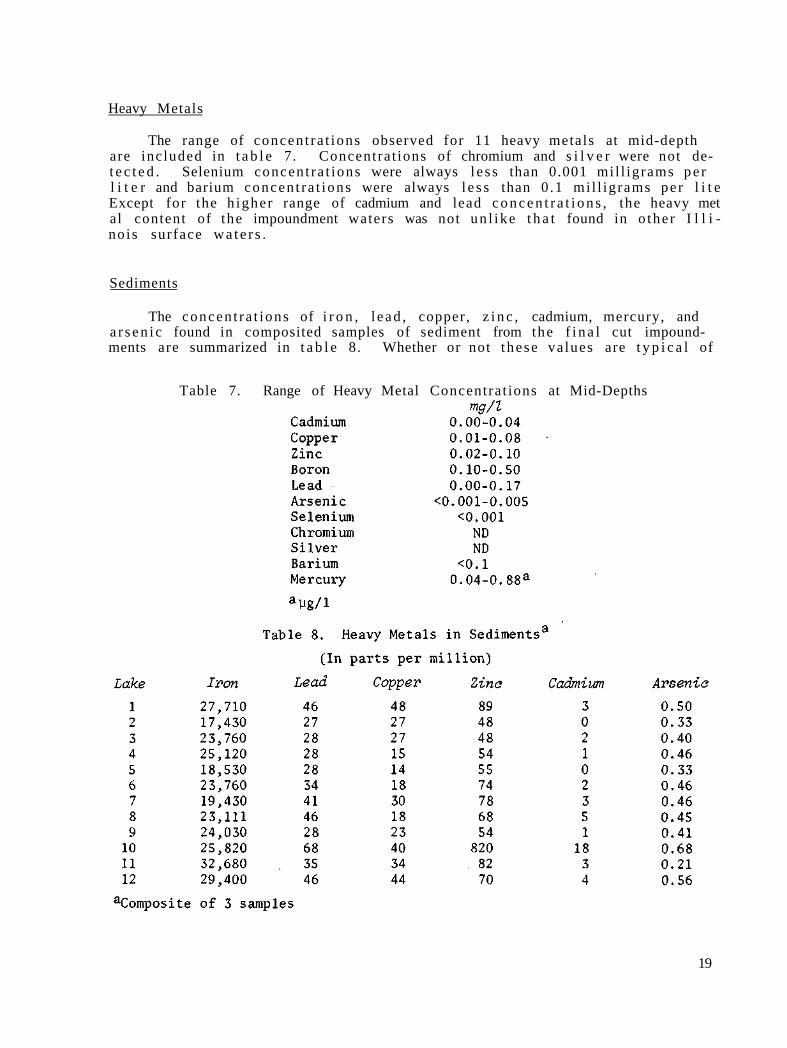
Heavy Metals
The range of concen t ra t ions observed for 11 heavy metals at mid-depth are included in t a b l e 7. Concentra t ions of chromium and s i l v e r were not det e c t e d . Selenium concen t ra t ions were always l e s s than 0.001 mi l l igrams p e r l i t e r and barium concen t ra t ions were always l e s s than 0 .1 mi l l igrams pe r l i t e Except for the h igher range of cadmium and lead c o n c e n t r a t i o n s , the heavy met al content of the impoundment waters was not un l ike t h a t found in o the r I l l i no is surface w a t e r s .
Sediments
The concen t ra t ions of i r o n , l e ad , copper, z i n c , cadmium, mercury, and a r s e n i c found in composited samples of sediment from the f i n a l cut impoundments are summarized in t a b l e 8. Whether or not these va lues are t y p i c a l of
Table 7. Range of Heavy Metal Concentrat ions at Mid-Depths
19
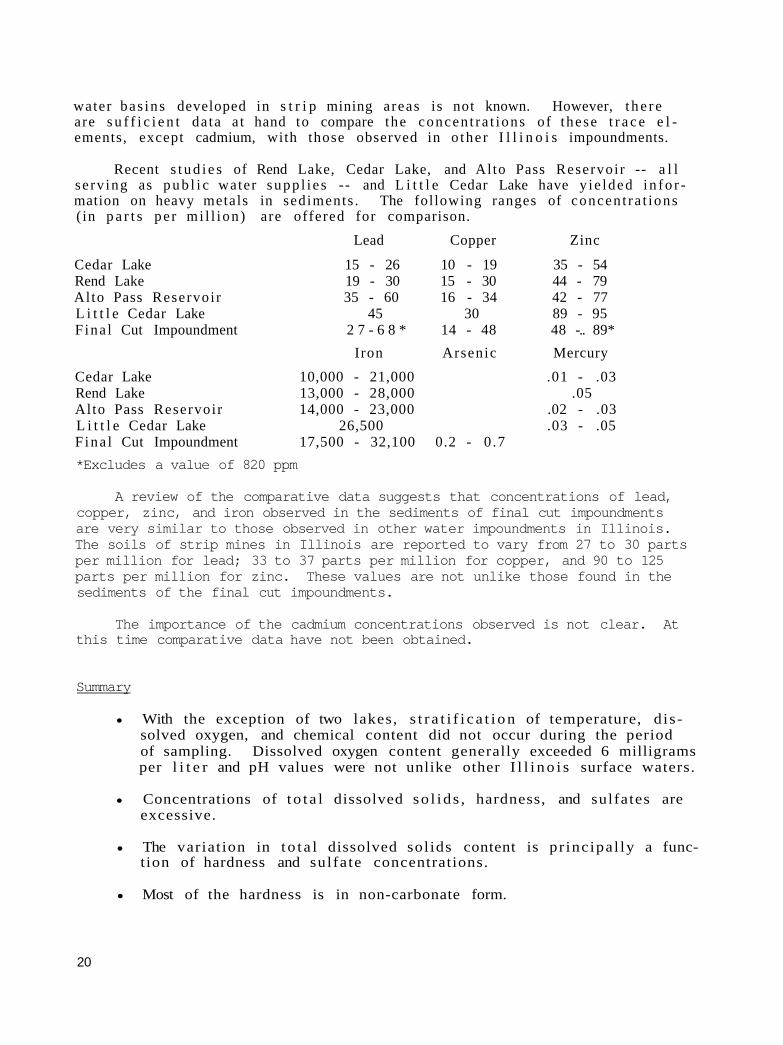
water bas ins developed in s t r i p mining areas is not known. However, t h e r e are s u f f i c i e n t da ta a t hand to compare the concen t ra t ions of these t r a c e e l ements, except cadmium, with those observed in o the r I l l i n o i s impoundments.
Recent s t u d i e s of Rend Lake, Cedar Lake, and Alto Pass Reservoir -- a l l se rv ing as p u b l i c water supp l i e s -- and L i t t l e Cedar Lake have y ie lded i n f o r mation on heavy metals in sediments . The following ranges of concen t ra t ions ( in p a r t s pe r mi l l ion ) are offered for comparison.
Lead Copper Zinc
Cedar Lake 15 - 26 10 - 19 35 - 54 Rend Lake 19 - 30 15 - 30 44 - 79 Alto Pass Reservoir 35 - 60 16 - 34 42 - 77 L i t t l e Cedar Lake 45 30 89 - 95 F ina l Cut Impoundment 2 7 - 6 8 * 14 - 48 48 -.. 89*
Iron Arsenic Mercury
Cedar Lake 10,000 - 21,000 .01 - .03 Rend Lake 13,000 - 28,000 .05 Alto Pass Reservoir 14,000 - 23,000 .02 - .03 L i t t l e Cedar Lake 26,500 .03 - .05 F ina l Cut Impoundment 17,500 - 32,100 0.2 - 0 .7
*Excludes a value of 820 ppm
A review of the comparative data suggests that concentrations of lead, copper, zinc, and iron observed in the sediments of final cut impoundments are very similar to those observed in other water impoundments in Illinois. The soils of strip mines in Illinois are reported to vary from 27 to 30 parts per million for lead; 33 to 37 parts per million for copper, and 90 to 125 parts per million for zinc. These values are not unlike those found in the sediments of the final cut impoundments.
The importance of the cadmium concentrations observed is not clear. At this time comparative data have not been obtained.
Summary
• With the exception of two lakes, s t r a t i f i c a t i on of temperature, d issolved oxygen, and chemical content did not occur during the period of sampling. Dissolved oxygen content generally exceeded 6 milligrams per l i t e r and pH values were not unlike other I l l i n o i s surface waters.
• Concentrations of t o t a l dissolved so l ids , hardness, and sulfates are excessive.
• The variat ion in to t a l dissolved solids content is pr incipal ly a function of hardness and sulfate concentrations.
• Most of the hardness is in non-carbonate form.
20
• Although the lakes can be grouped according to ranges of value for certain water quality characteristics such as total dissolved solids, sulfate, alkalinity, and sodium, they cannot be classified in terms of water quality on the basis of geographical location.
• Concentrations of chloride, nitrate, fluoride, sodium, and potassium were not found in excessive quantities.
• Manganese concentrations generally exceeded those found in the surface waters of Illinois.
• Iron content, except in the bottom water stratum, was not excessive.
• With the exception of lead and cadmium levels, the heavy metal content was not significantly different from other Illinois surface waters.
• If significant dissolved oxygen stratification occurs during the warm months, it is likely that anoxic conditions will be created in the lower water strata resulting in the production of hydrogen sulfide and the introduction of certain heavy metals into the water column.
CHEMICAL SUITABILITY
The water quality of the final cut impoundments has been evaluated to determine the suitability of each location as a source for potable water, irrigation, and livestock watering. Reliance has been placed on the regulations in Illinois for evaluating use of the waters as public water supplies (11). The recommendations developed by a committee of the National Academy of Sciences and the National Academy of Engineering (12) were used for assessing the fitness of the impounded waters for irrigation and livestock watering. The water quality requirements for each use, for those elements examined during the study, are included in the tables for each use. The average values derived at mid-depth for each impoundment are used to ascertain the suitability of their waters for the uses previously noted.
Public Water Supply
The water quality requirements in table 9 for a public water supply source are predicated on the assumption that the source of water being considered will be usable with no more than routine forms of water treatment, i.e., coagulation, sedimentation, sand filtration, and disinfection. The limitations established for each constituent are based on several considerations. These include adverse physiological effects on humans, taste preferences, aesthetic considerations, user preference, and toxicity to humans.
Where physiological and toxic effects on humans are the principal motives for establishing a limitation in concentration for a particular element, there is no latitude for ignoring the limitation. However, in cases where taste,
21
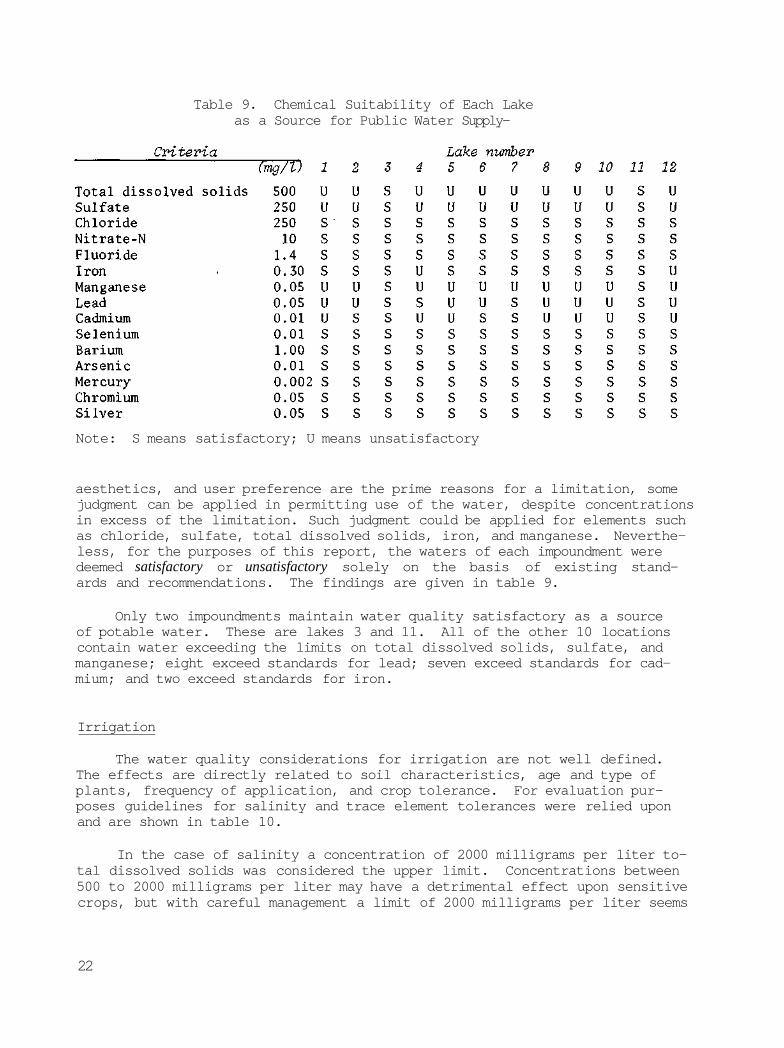
Table 9. Chemical Suitability of Each Lake as a Source for Public Water Supply-
Note: S means satisfactory; U means unsatisfactory
aesthetics, and user preference are the prime reasons for a limitation, some judgment can be applied in permitting use of the water, despite concentrations in excess of the limitation. Such judgment could be applied for elements such as chloride, sulfate, total dissolved solids, iron, and manganese. Nevertheless, for the purposes of this report, the waters of each impoundment were deemed satisfactory or unsatisfactory solely on the basis of existing standards and recommendations. The findings are given in table 9.
Only two impoundments maintain water quality satisfactory as a source of potable water. These are lakes 3 and 11. All of the other 10 locations contain water exceeding the limits on total dissolved solids, sulfate, and manganese; eight exceed standards for lead; seven exceed standards for cadmium; and two exceed standards for iron.
Irrigation
The water quality considerations for irrigation are not well defined. The effects are directly related to soil characteristics, age and type of plants, frequency of application, and crop tolerance. For evaluation purposes guidelines for salinity and trace element tolerances were relied upon and are shown in table 10.
In the case of salinity a concentration of 2000 milligrams per liter total dissolved solids was considered the upper limit. Concentrations between 500 to 2000 milligrams per liter may have a detrimental effect upon sensitive crops, but with careful management a limit of 2000 milligrams per liter seems
22
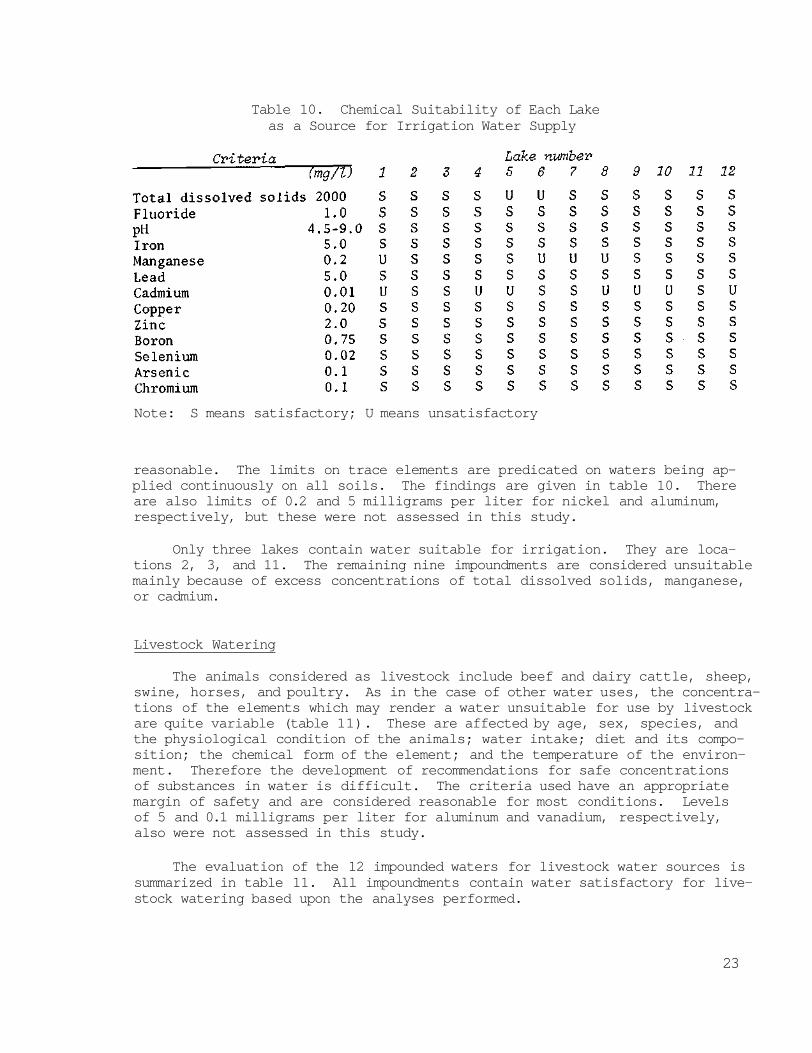
Table 10. Chemical Suitability of Each Lake as a Source for Irrigation Water Supply
Note: S means satisfactory; U means unsatisfactory
reasonable. The limits on trace elements are predicated on waters being applied continuously on all soils. The findings are given in table 10. There are also limits of 0.2 and 5 milligrams per liter for nickel and aluminum, respectively, but these were not assessed in this study.
Only three lakes contain water suitable for irrigation. They are locations 2, 3, and 11. The remaining nine impoundments are considered unsuitable mainly because of excess concentrations of total dissolved solids, manganese, or cadmium.
Livestock Watering
The animals considered as livestock include beef and dairy cattle, sheep, swine, horses, and poultry. As in the case of other water uses, the concentrations of the elements which may render a water unsuitable for use by livestock are quite variable (table 11). These are affected by age, sex, species, and the physiological condition of the animals; water intake; diet and its composition; the chemical form of the element; and the temperature of the environment. Therefore the development of recommendations for safe concentrations of substances in water is difficult. The criteria used have an appropriate margin of safety and are considered reasonable for most conditions. Levels of 5 and 0.1 milligrams per liter for aluminum and vanadium, respectively, also were not assessed in this study.
The evaluation of the 12 impounded waters for livestock water sources is summarized in table 11. All impoundments contain water satisfactory for livestock watering based upon the analyses performed.
23
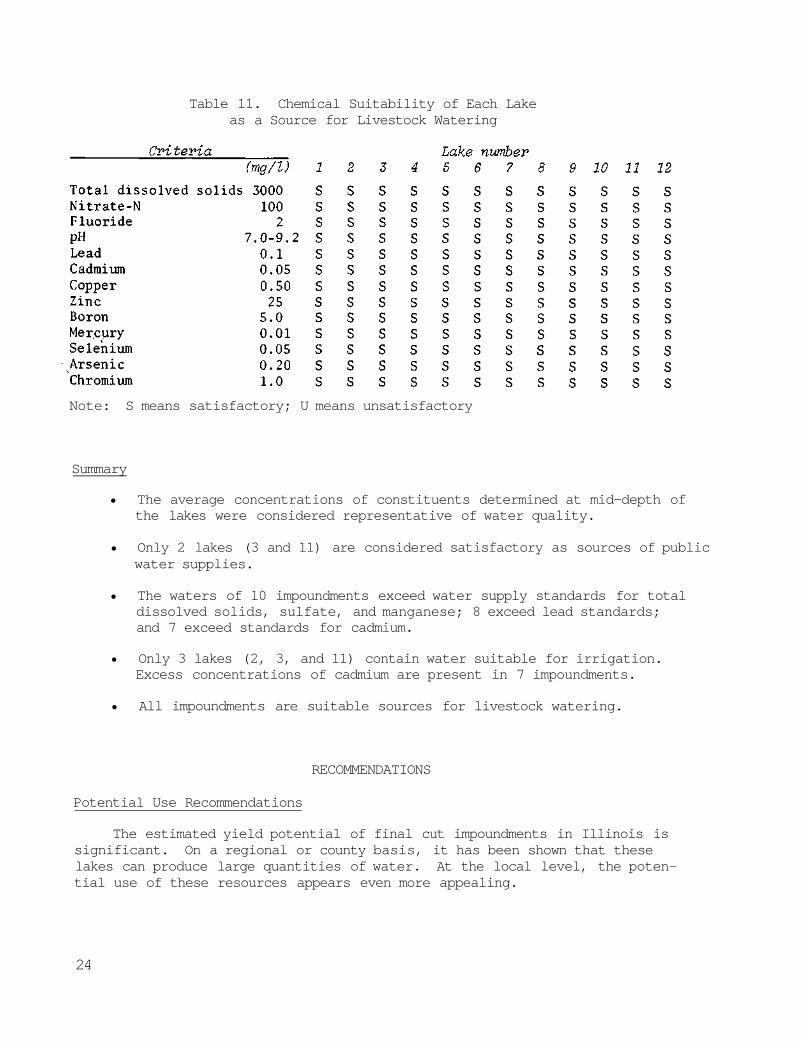
Table 11. Chemical Suitability of Each Lake as a Source for Livestock Watering
Note: S means satisfactory; U means unsatisfactory
Summary
• The average concentrations of constituents determined at mid-depth of the lakes were considered representative of water quality.
• Only 2 lakes (3 and 11) are considered satisfactory as sources of public water supplies.
• The waters of 10 impoundments exceed water supply standards for total dissolved solids, sulfate, and manganese; 8 exceed lead standards; and 7 exceed standards for cadmium.
• Only 3 lakes (2, 3, and 11) contain water suitable for irrigation. Excess concentrations of cadmium are present in 7 impoundments.
• All impoundments are suitable sources for livestock watering.
RECOMMENDATIONS
Potential Use Recommendations
The estimated yield potential of final cut impoundments in Illinois is significant. On a regional or county basis, it has been shown that these lakes can produce large quantities of water. At the local level, the potential use of these resources appears even more appealing.
24
On the basis of the chemical quality of the lakes studied and published water quality standards, the potential uses do not look as promising. Only 2 lakes are considered satisfactory for public water supply use, 3 for irrigation use, and all 12 are satisfactory for livestock watering. However, before dismissing the use of these lakes based solely on published water quality standards, the water quality of the impoundments should be compared with the water quality of alternative sources of water.
As an example, the village of Astoria in the southern tip of Fulton County began using a final cut impoundment as a source of public water supply in late 1976. This move was part of a continuing effort by the town to find a chemically acceptable and reliable water supply.
The first public water supply for Astoria was obtained from a 1660-foot deep well drilled in 1897. Use of this water was limited because of its poor quality.
In 1924 the well was abandoned and water was obtained from an earthen dam reservoir constructed northeast of the town. Water from the reservoir was of good quality (see table 12) but the capacity of the lake was insufficient. In the early 1950s a pipeline was constructed to carry water to the reservoir from a private lake south of town. This additional source of supply continued to be used mainly during the summer months until 1976. By 19 76, the pipeline from the private lake had badly deteriorated and the village negotiated a contract with Amax Coal Company to use a final cut impoundment first as a supplement to their lake supply and then as the sole source of water for the village.
Water quality data for the village deep well, reservoir, and final cut impoundment are given in table 12 along with data for a shallow well in the area. The quality of water from the final impoundment is comparable to that from the shallow well but more highly mineralized than water from the old reservoir. However, the 630-acre-foot volume of the final cut impoundment provides an adequate and more dependable supply than the 86-acre-foot (original capacity) reservoir.
Because of the relatively abundant groundwater resources in northeastern Illinois and the active development of final cut impoundments for private recreational uses in the region, we suggest that the recreational uses continue to have priority. In western and southern Illinois, the use of final cut impoundments for consumptive water uses should be investigated at the local level on an individual basis. Regional planning commissions, consulting engineers, and village officials should be made aware of the potential final cut impoundment resources in their areas and encouraged to investigate the economics and suitability of their use.
Recommendations for Further Study
On the basis of the results of this project and general knowledge of strip mine related problems, the following suggestions for further study are made:
25
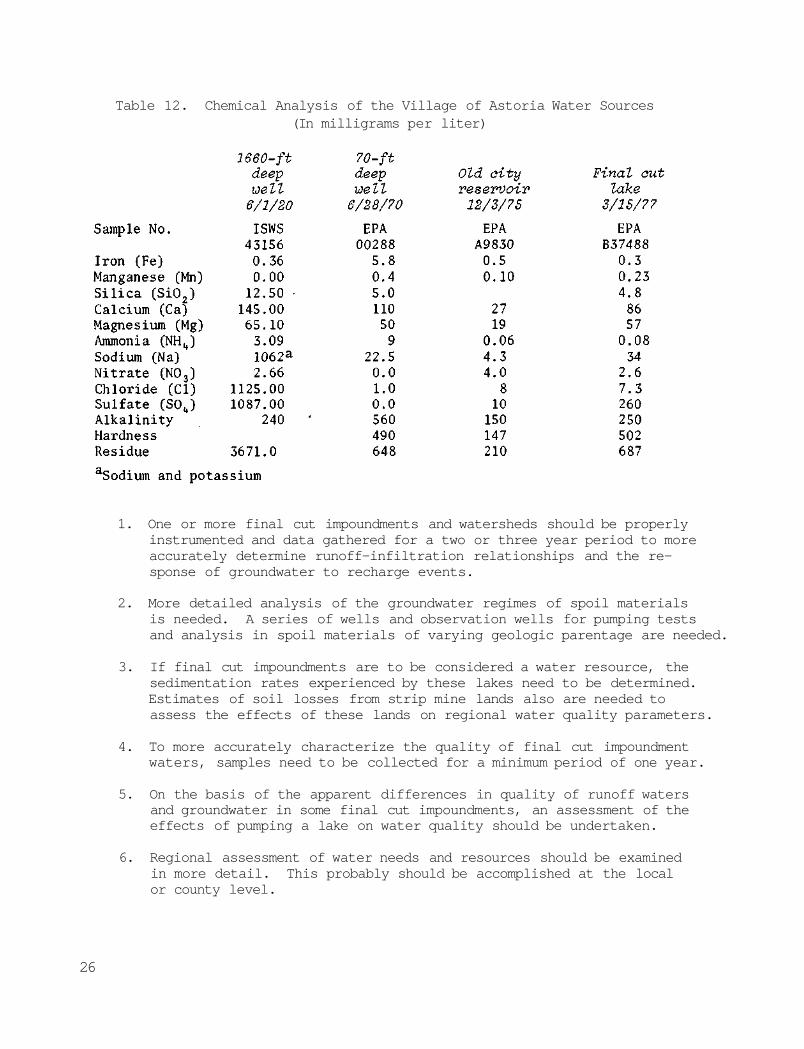
Table 12. Chemical Analysis of the Village of Astoria Water Sources (In milligrams per liter)
1. One or more final cut impoundments and watersheds should be properly instrumented and data gathered for a two or three year period to more accurately determine runoff-infiltration relationships and the response of groundwater to recharge events.
2. More detailed analysis of the groundwater regimes of spoil materials is needed. A series of wells and observation wells for pumping tests and analysis in spoil materials of varying geologic parentage are needed.
3. If final cut impoundments are to be considered a water resource, the sedimentation rates experienced by these lakes need to be determined. Estimates of soil losses from strip mine lands also are needed to assess the effects of these lands on regional water quality parameters.
4. To more accurately characterize the quality of final cut impoundment waters, samples need to be collected for a minimum period of one year.
5. On the basis of the apparent differences in quality of runoff waters and groundwater in some final cut impoundments, an assessment of the effects of pumping a lake on water quality should be undertaken.
6. Regional assessment of water needs and resources should be examined in more detail. This probably should be accomplished at the local or county level.
26
APPENDIX. LAKE SUMMARIES
1 -- Middle Grove Lake
Middle Grove lake is located in Section 19, T9N, R4E, Knox County.
The lake and surrounding property are owned by Peabody Coal Company who
opened the mine in 1950 and closed it in 1952. The Springfield (No. 5)
coal was mined with a 40 cubic yard Marion shovel. The coal was overlain
by 50 to 75 feet of overburden materials of which 20 to 30 feet was pre-
dominately clay. The rock overburden was a black shale with isolated
fossiliferous dark limestone concretions (13).
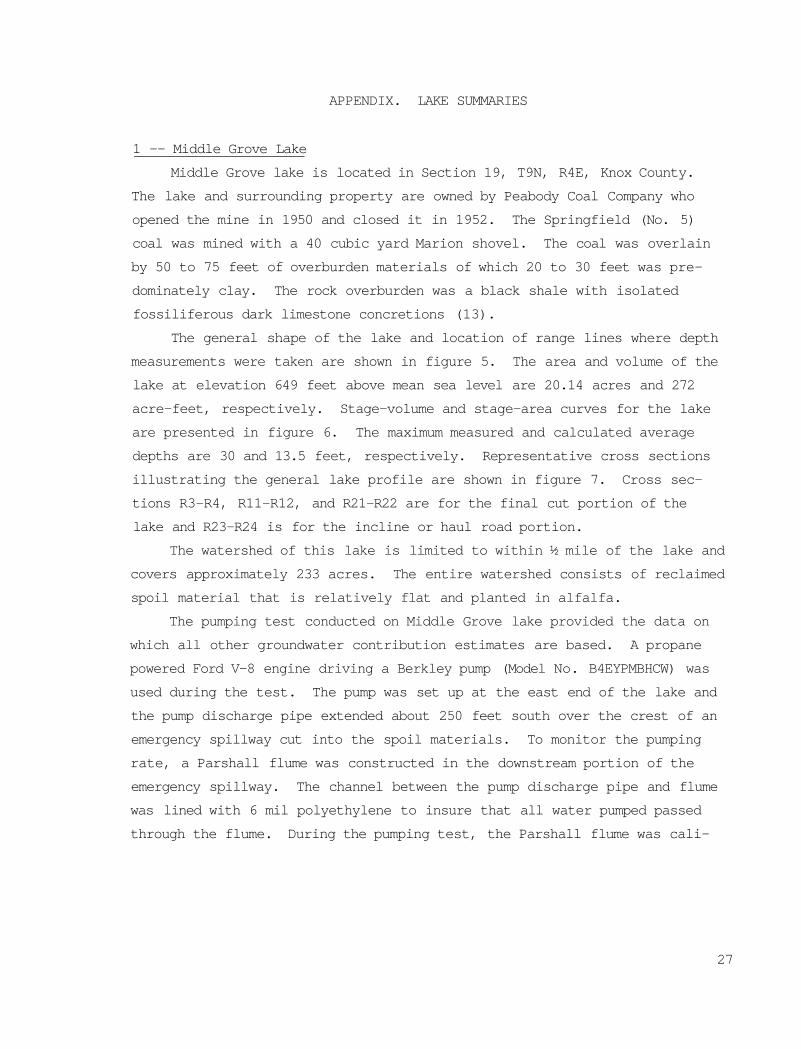
The general shape of the lake and location of range lines where depth
measurements were taken are shown in figure 5. The area and volume of the
lake at elevation 649 feet above mean sea level are 20.14 acres and 272
acre-feet, respectively. Stage-volume and stage-area curves for the lake
are presented in figure 6. The maximum measured and calculated average
depths are 30 and 13.5 feet, respectively. Representative cross sections
illustrating the general lake profile are shown in figure 7. Cross sec
tions R3-R4, R11-R12, and R21-R22 are for the final cut portion of the
lake and R23-R24 is for the incline or haul road portion.
The watershed of this lake is limited to within ½ mile of the lake and
covers approximately 233 acres. The entire watershed consists of reclaimed
spoil material that is relatively flat and planted in alfalfa.
The pumping test conducted on Middle Grove lake provided the data on
which all other groundwater contribution estimates are based. A propane
powered Ford V-8 engine driving a Berkley pump (Model No. B4EYPMBHCW) was
used during the test. The pump was set up at the east end of the lake and
the pump discharge pipe extended about 250 feet south over the crest of an
emergency spillway cut into the spoil materials. To monitor the pumping
rate, a Parshall flume was constructed in the downstream portion of the
emergency spillway. The channel between the pump discharge pipe and flume
was lined with 6 mil polyethylene to insure that all water pumped passed
through the flume. During the pumping test, the Parshall flume was cali-
27
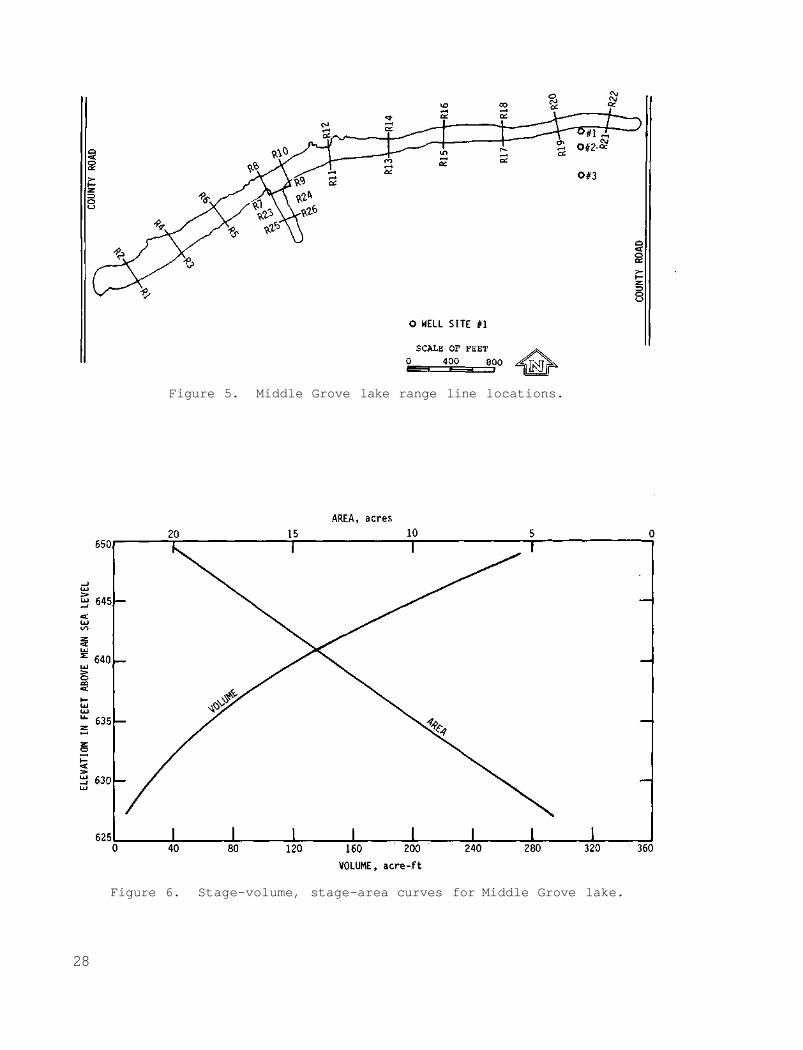
Figure 5. Middle Grove lake range line locations.
Figure 6. Stage-volume, stage-area curves for Middle Grove lake.
28
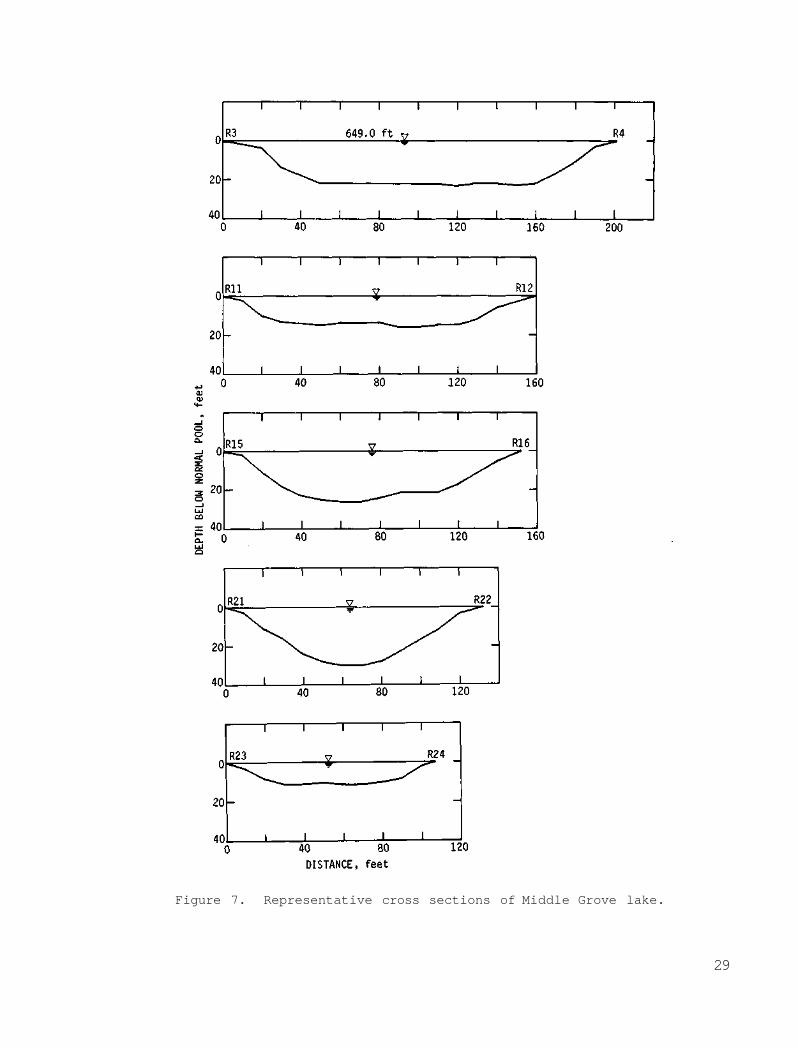
Figure 7. Representative cross sections of Middle Grove lake.
29
brated with a Pigmy velocity meter and found to be within 1 percent of the
design rated flow.
To monitor the change in lake levels, a staff gage was installed for
direct readings and a Stevens water level recorder was installed for con
tinuous recording.
Three piezometers or monitoring wells also were constructed in the
spoil materials on the south side of the lake. The locations of these
wells are shown on figure 5. The wells were constructed of 1½ inch diame
ter PVC pipe to depths of 47, 48, and 48 feet, respectively. The bottom 10
feet of each well casing was slotted with a hack saw and the anular spaces
between the slotted portions of the wells and the 7-inch diameter bore
holes were filled with pea gravel. The anular space above the gravel in
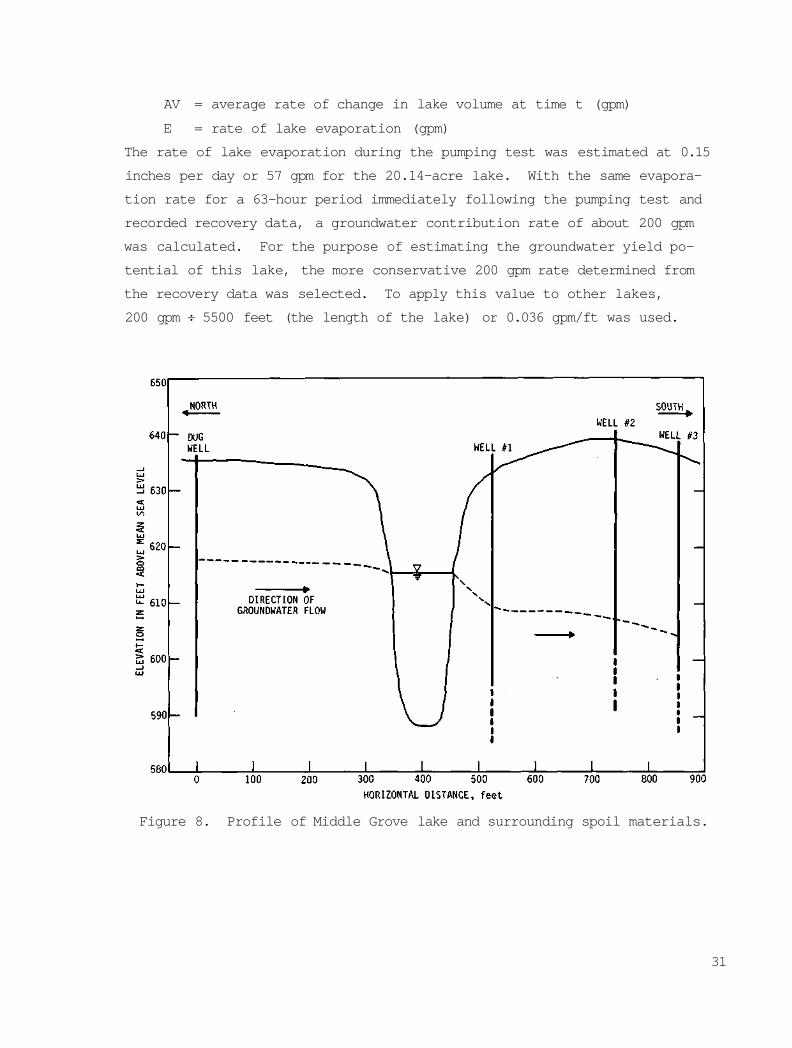
each well was filled with drill cuttings. Figure 8 illustrates the verti
cal and horizontal location of the wells relative to the lake profile.
Water levels in the lake and spoil materials prior to the pumping test also
are shown in figure 8. It should be noted that the lake is located in a
regional groundwater flow system with movement of groundwater toward the
south.
To provide precipitation data for water budget analysis and watershed
curve number determinations, a wedge type rain gage and a Belfort weighing
type recording rain gage were installed.
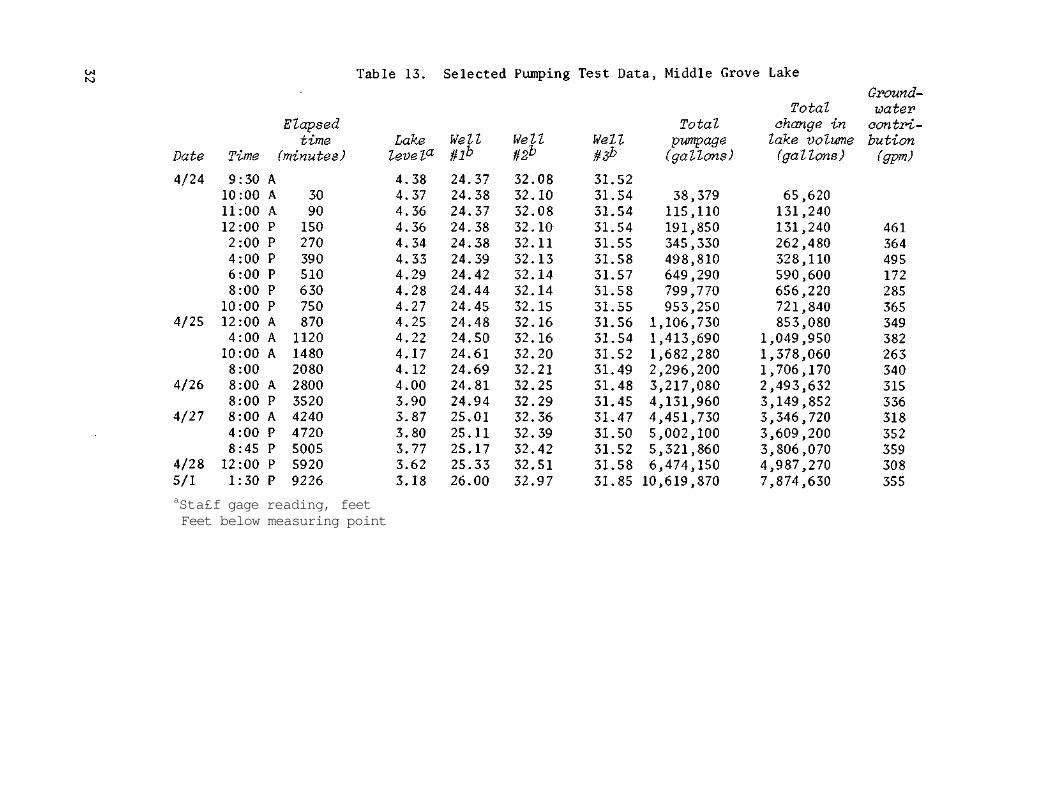
The pumping test started on April 24, 1978, at 9:30 a.m. and ended on
May 1, 1978, at 1:30 p.m. Pumping stopped 5 different times for repairs
and maintenance for a total down time of 810 minutes. The total amount of
water pumped was measured at 10,619,900 gallons over a total period of 9226
minutes [average pumping rate of about 1150 gallons per minute (gpm)].
Selected pumping test data are presented in table 13.
The groundwater contribution column of table 14 was calculated by the
simplified water budget equation
GW = Q - AV + E r r where:
GW = groundwater contribution (gpm)
Q = average pumping rate at time t (gpm)
30
AV = average rate of change in lake volume at time t (gpm)
E = rate of lake evaporation (gpm)
The rate of lake evaporation during the pumping test was estimated at 0.15
inches per day or 57 gpm for the 20.14-acre lake. With the same evapora
tion rate for a 63-hour period immediately following the pumping test and
recorded recovery data, a groundwater contribution rate of about 200 gpm
was calculated. For the purpose of estimating the groundwater yield po
tential of this lake, the more conservative 200 gpm rate determined from
the recovery data was selected. To apply this value to other lakes,
200 gpm ÷ 5500 feet (the length of the lake) or 0.036 gpm/ft was used.
Figure 8. Profile of Middle Grove lake and surrounding spoil materials.
31
aSta£f gage reading, feet Feet below measuring point
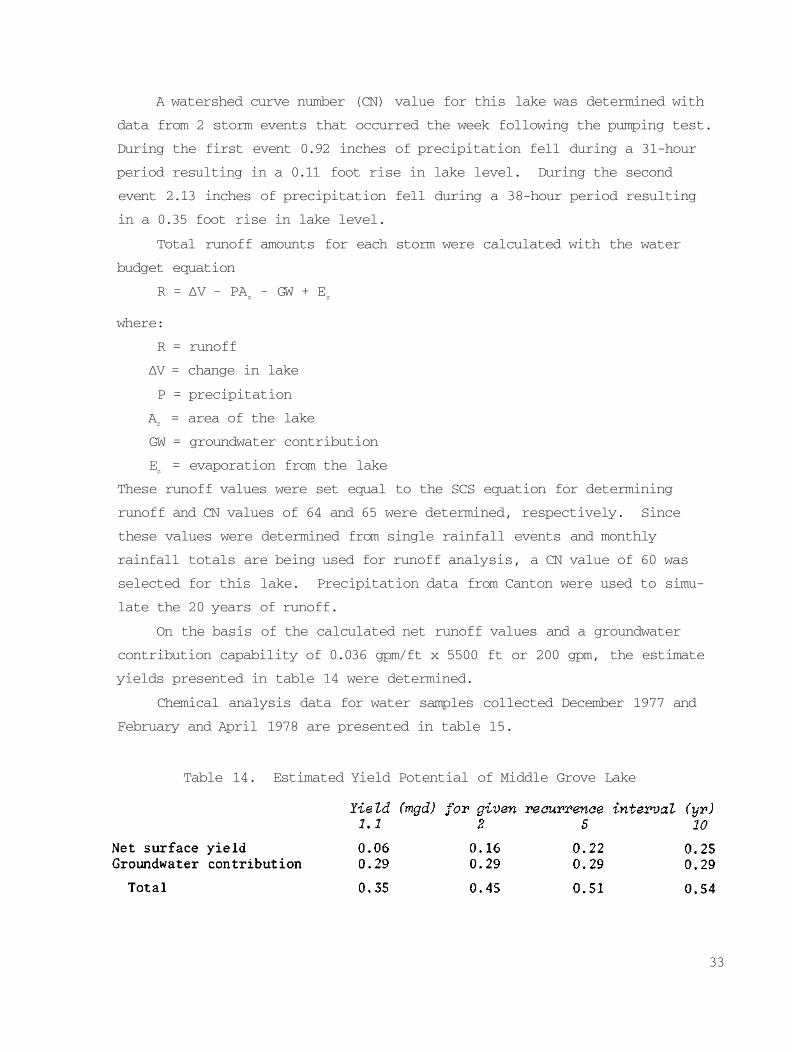
A watershed curve number (CN) value for this lake was determined with
data from 2 storm events that occurred the week following the pumping test.
During the first event 0.92 inches of precipitation fell during a 31-hour
period resulting in a 0.11 foot rise in lake level. During the second
event 2.13 inches of precipitation fell during a 38-hour period resulting
in a 0.35 foot rise in lake level.
Total runoff amounts for each storm were calculated with the water
budget equation
R = ΔV - PAz - GW + E
z
where:
R = runoff
ΔV = change in lake
P = precipitation
Az = area of the lake
GW = groundwater contribution
Ez = evaporation from the lake
These runoff values were set equal to the SCS equation for determining
runoff and CN values of 64 and 65 were determined, respectively. Since
these values were determined from single rainfall events and monthly
rainfall totals are being used for runoff analysis, a CN value of 60 was
selected for this lake. Precipitation data from Canton were used to simu
late the 20 years of runoff.
On the basis of the calculated net runoff values and a groundwater
contribution capability of 0.036 gpm/ft x 5500 ft or 200 gpm, the estimate
yields presented in table 14 were determined.
Chemical analysis data for water samples collected December 1977 and
February and April 1978 are presented in table 15.
Table 14. Estimated Yield Potential of Middle Grove Lake
33
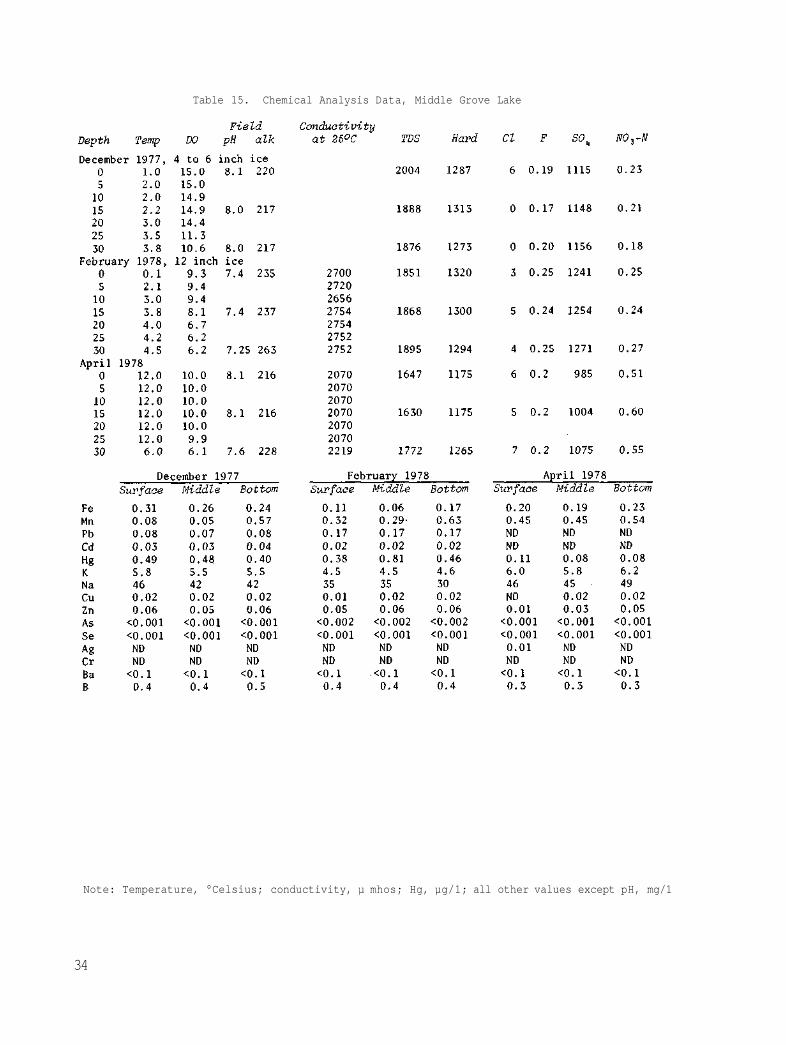
Table 15. Chemical Analysis Data, Middle Grove Lake
Note: Temperature, °Celsius; conductivity, µ mhos; Hg, µg/1; all other values except pH, mg/1
34
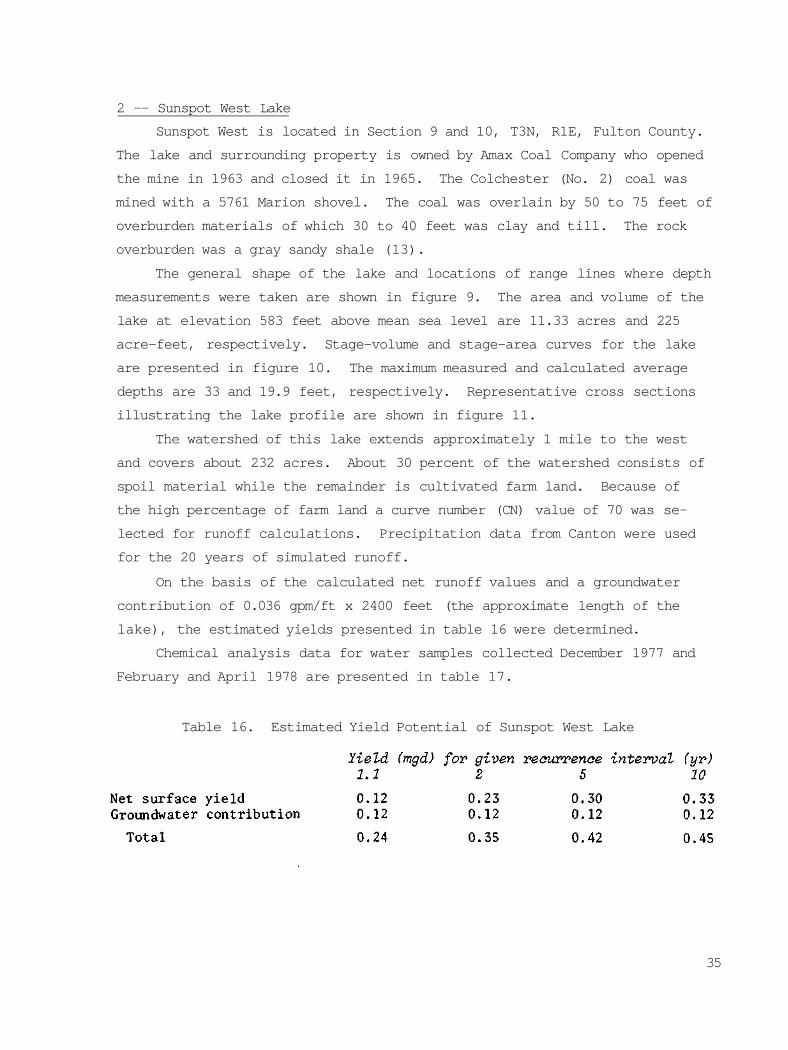
2 -- Sunspot West Lake
Sunspot West is located in Section 9 and 10, T3N, R1E, Fulton County.
The lake and surrounding property is owned by Amax Coal Company who opened
the mine in 1963 and closed it in 1965. The Colchester (No. 2) coal was
mined with a 5761 Marion shovel. The coal was overlain by 50 to 75 feet of
overburden materials of which 30 to 40 feet was clay and till. The rock
overburden was a gray sandy shale (13).
The general shape of the lake and locations of range lines where depth
measurements were taken are shown in figure 9. The area and volume of the
lake at elevation 583 feet above mean sea level are 11.33 acres and 225
acre-feet, respectively. Stage-volume and stage-area curves for the lake
are presented in figure 10. The maximum measured and calculated average
depths are 33 and 19.9 feet, respectively. Representative cross sections
illustrating the lake profile are shown in figure 11.
The watershed of this lake extends approximately 1 mile to the west
and covers about 232 acres. About 30 percent of the watershed consists of
spoil material while the remainder is cultivated farm land. Because of
the high percentage of farm land a curve number (CN) value of 70 was se
lected for runoff calculations. Precipitation data from Canton were used
for the 20 years of simulated runoff.
On the basis of the calculated net runoff values and a groundwater
contribution of 0.036 gpm/ft x 2400 feet (the approximate length of the
lake), the estimated yields presented in table 16 were determined.
Chemical analysis data for water samples collected December 1977 and
February and April 1978 are presented in table 17.
Table 16. Estimated Yield Potential of Sunspot West Lake
35
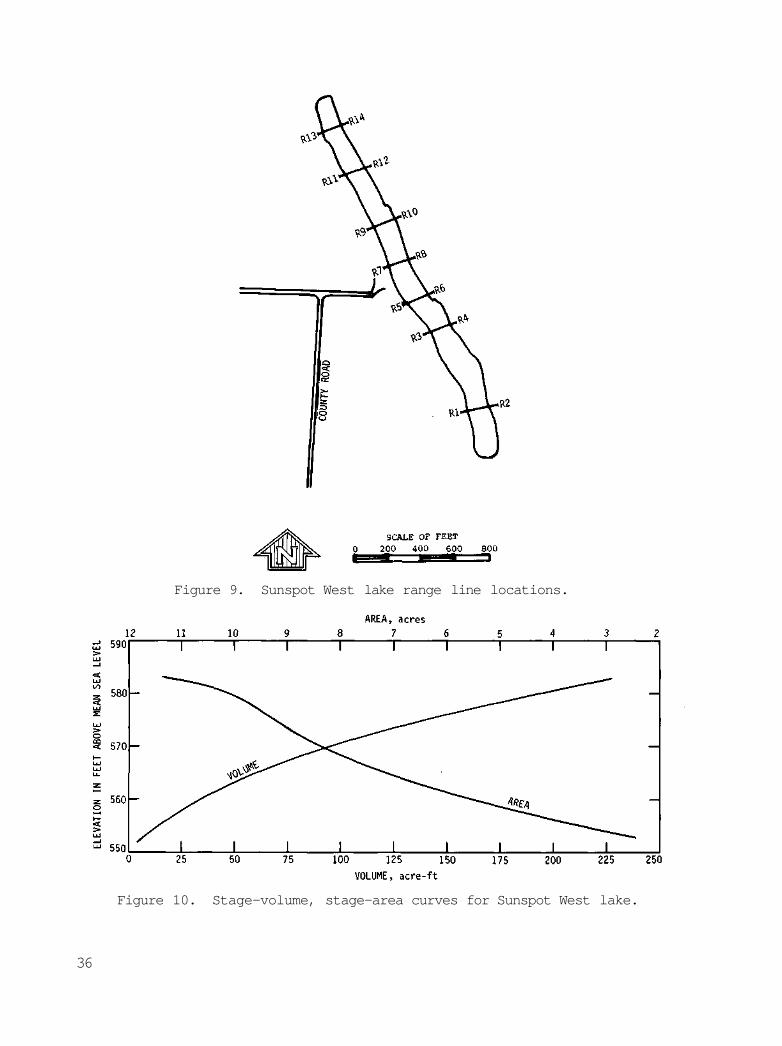
Figure 9. Sunspot West lake range line locations.
Figure 10. Stage-volume, stage-area curves for Sunspot West lake.
36
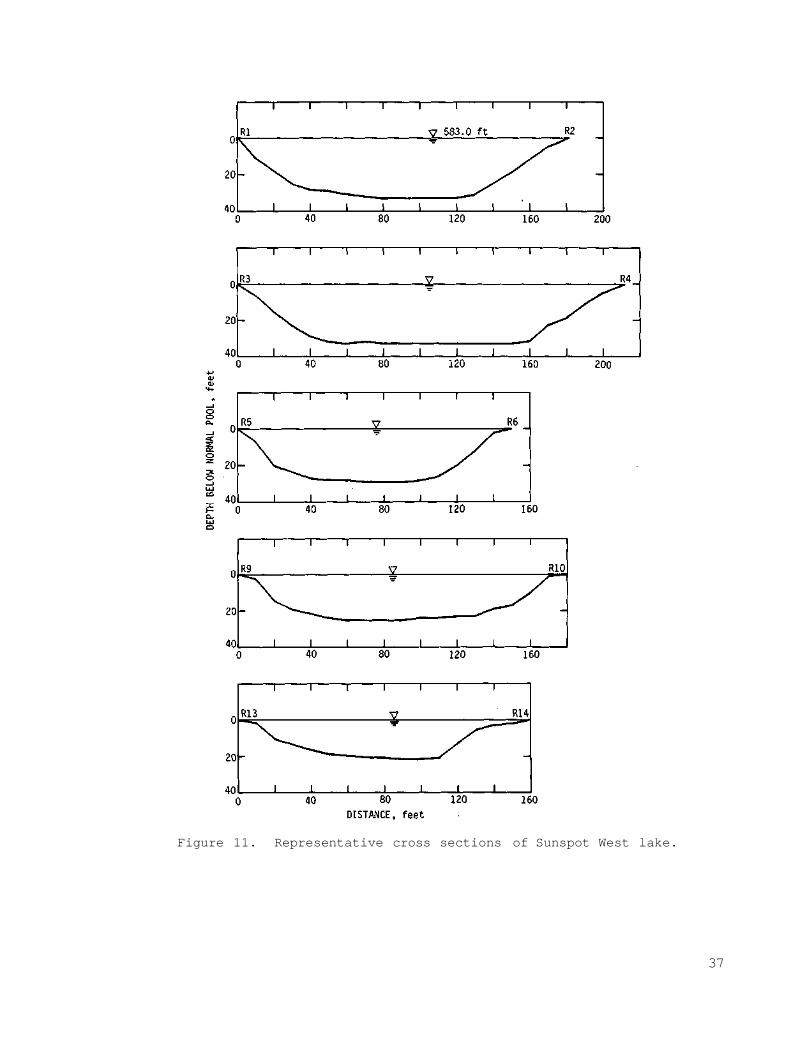
Figure 11. Representative cross sections of Sunspot West lake.
37
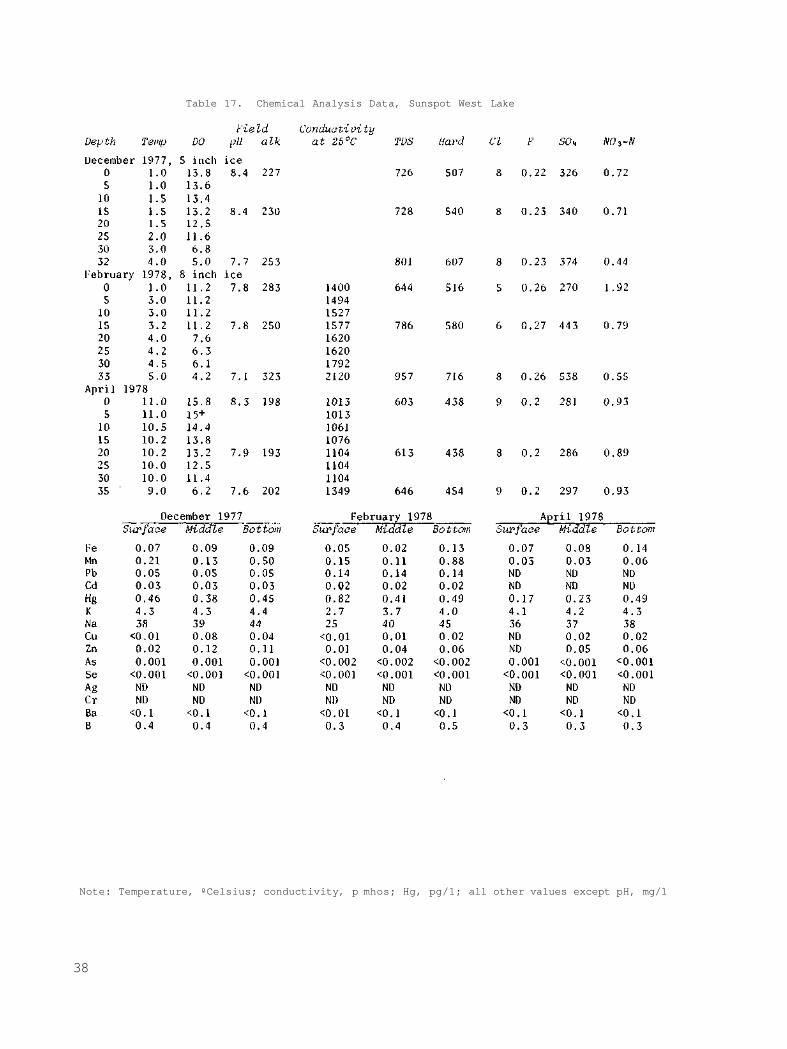
Table 17. Chemical Analysis Data, Sunspot West Lake
Note: Temperature, ºCelsius; conductivity, p mhos; Hg, pg/1; all other values except pH, mg/1
38
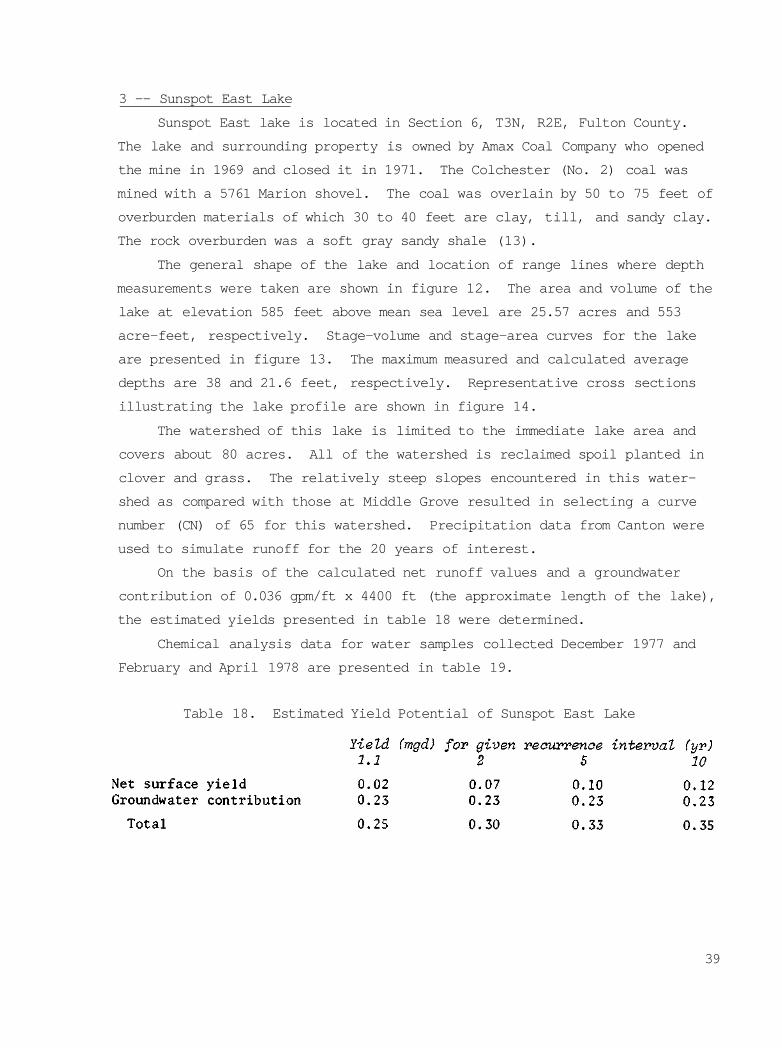
3 -- Sunspot East Lake
Sunspot East lake is located in Section 6, T3N, R2E, Fulton County.
The lake and surrounding property is owned by Amax Coal Company who opened
the mine in 1969 and closed it in 1971. The Colchester (No. 2) coal was
mined with a 5761 Marion shovel. The coal was overlain by 50 to 75 feet of
overburden materials of which 30 to 40 feet are clay, till, and sandy clay.
The rock overburden was a soft gray sandy shale (13).
The general shape of the lake and location of range lines where depth
measurements were taken are shown in figure 12. The area and volume of the
lake at elevation 585 feet above mean sea level are 25.57 acres and 553
acre-feet, respectively. Stage-volume and stage-area curves for the lake
are presented in figure 13. The maximum measured and calculated average
depths are 38 and 21.6 feet, respectively. Representative cross sections
illustrating the lake profile are shown in figure 14.
The watershed of this lake is limited to the immediate lake area and
covers about 80 acres. All of the watershed is reclaimed spoil planted in
clover and grass. The relatively steep slopes encountered in this water
shed as compared with those at Middle Grove resulted in selecting a curve
number (CN) of 65 for this watershed. Precipitation data from Canton were
used to simulate runoff for the 20 years of interest.
On the basis of the calculated net runoff values and a groundwater
contribution of 0.036 gpm/ft x 4400 ft (the approximate length of the lake),
the estimated yields presented in table 18 were determined.
Chemical analysis data for water samples collected December 1977 and
February and April 1978 are presented in table 19.
Table 18. Estimated Yield Potential of Sunspot East Lake
39
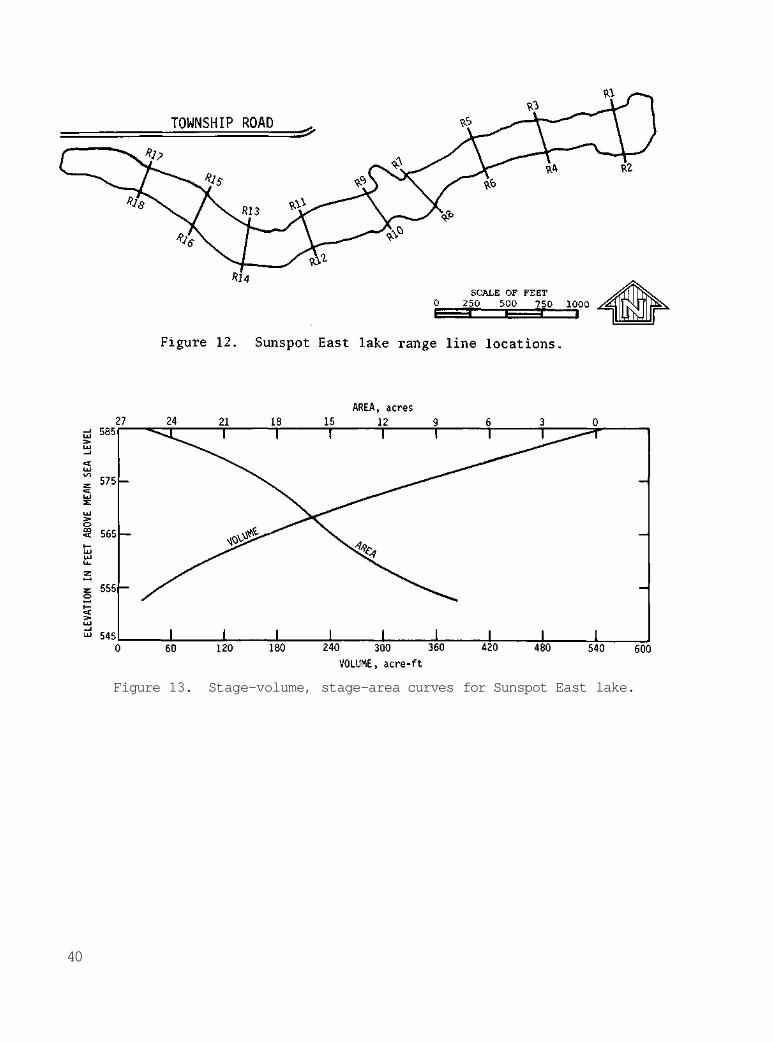
Figure 13. Stage-volume, stage-area curves for Sunspot East lake.
40
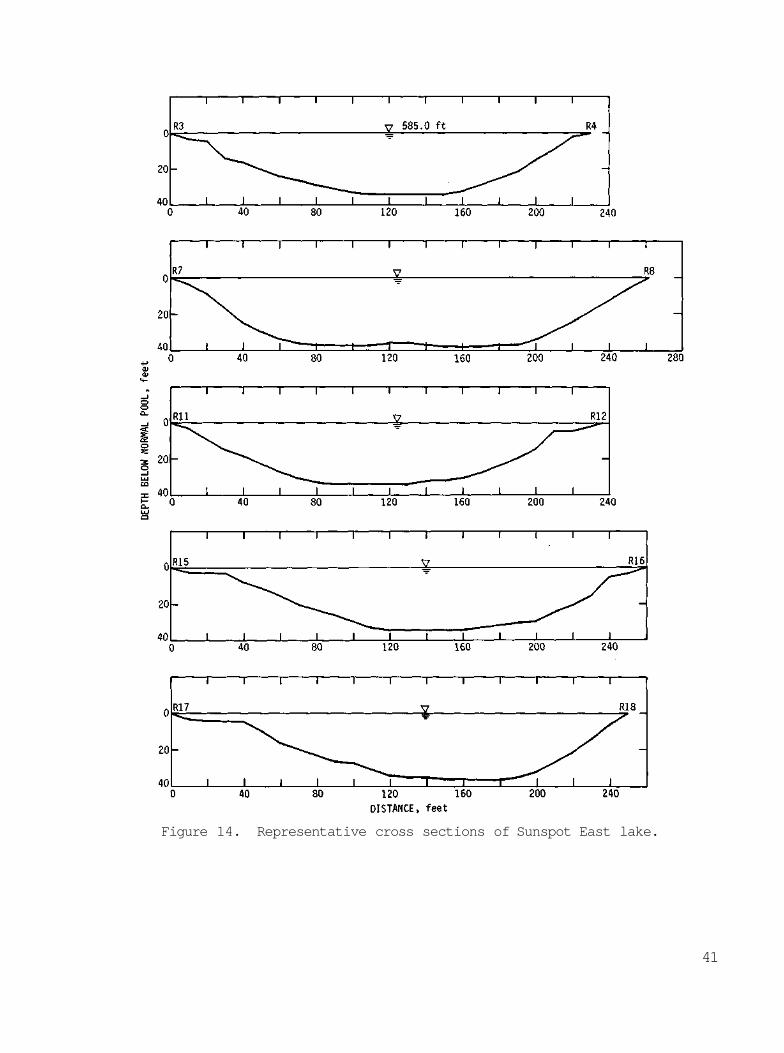
Figure 14. Representative cross sections of Sunspot East lake.
41
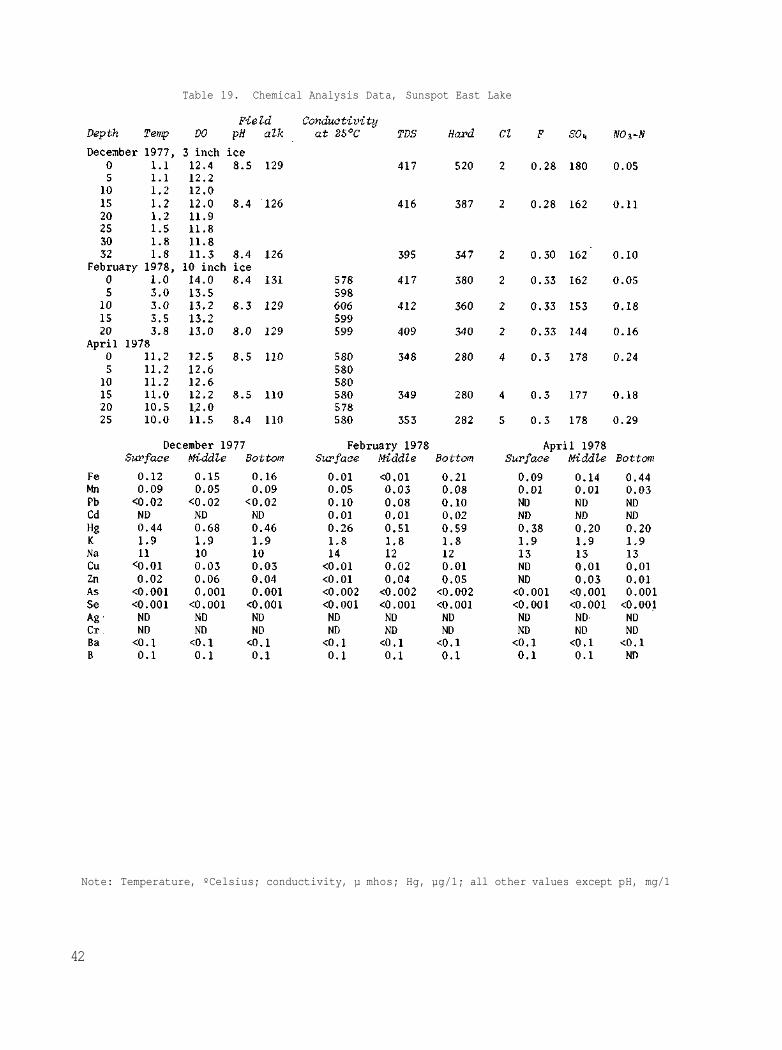
Table 19. Chemical Analysis Data, Sunspot East Lake
Note: Temperature, ºCelsius; conductivity, µ mhos; Hg, µg/1; all other values except pH, mg/1
42
4 -- Pinckneyville No. 2 Lake
Pinckneyville No. 2 is located in Section 17, T5S, R2W, Perry County.
The lake and surrounding property is owned by Consolidated Coal Company
who opened the mine in February 1976 and closed it in August 1977. The
Herrin (No. 6) coal was mined with a 1350 Ransome Rapier Dragline (33 cubic
yards). The spoil materials were placed in the same relative positions
vertically as before mining, that is, unconsolidated materials laying atop
the consolidated materials. The coal was overlain by 60 to 75 feet of
overburden of which about 20 feet was glacial materials. The rock over
burden consisted of black shaley slate overlain by gray limestone with
dark shaley streaks (14).
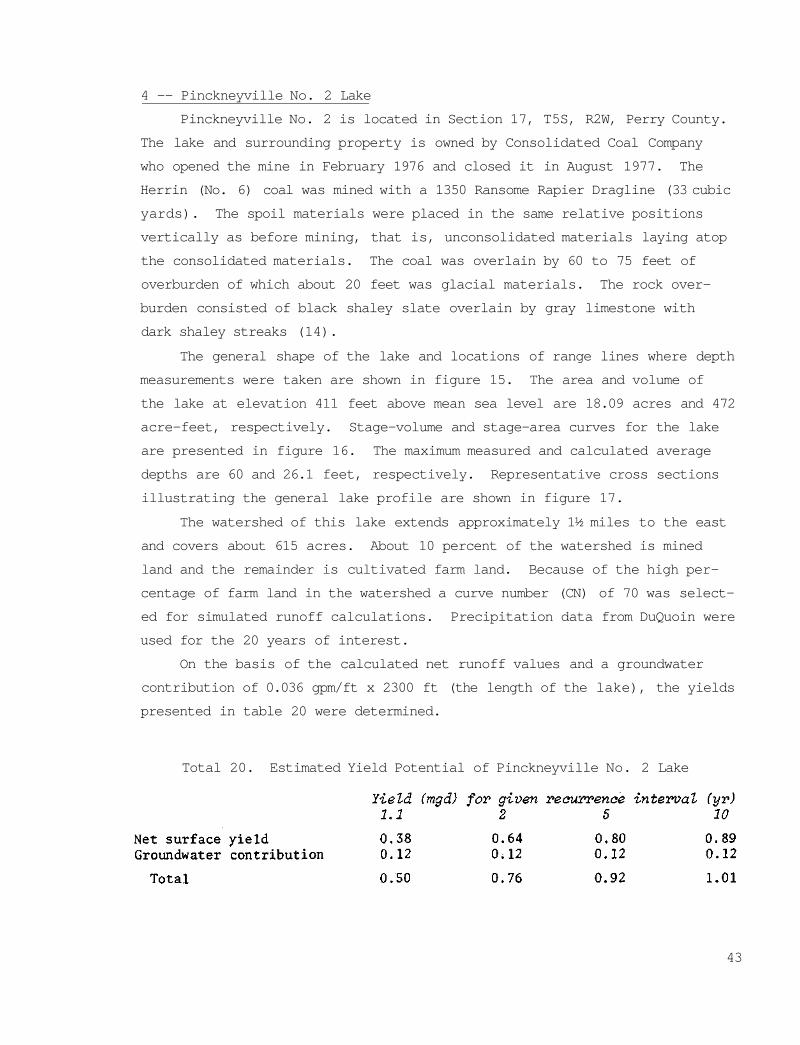
The general shape of the lake and locations of range lines where depth
measurements were taken are shown in figure 15. The area and volume of
the lake at elevation 411 feet above mean sea level are 18.09 acres and 472
acre-feet, respectively. Stage-volume and stage-area curves for the lake
are presented in figure 16. The maximum measured and calculated average
depths are 60 and 26.1 feet, respectively. Representative cross sections
illustrating the general lake profile are shown in figure 17.
The watershed of this lake extends approximately 1½ miles to the east
and covers about 615 acres. About 10 percent of the watershed is mined
land and the remainder is cultivated farm land. Because of the high per
centage of farm land in the watershed a curve number (CN) of 70 was select
ed for simulated runoff calculations. Precipitation data from DuQuoin were
used for the 20 years of interest.
On the basis of the calculated net runoff values and a groundwater
contribution of 0.036 gpm/ft x 2300 ft (the length of the lake), the yields
presented in table 20 were determined.
Total 20. Estimated Yield Potential of Pinckneyville No. 2 Lake
43
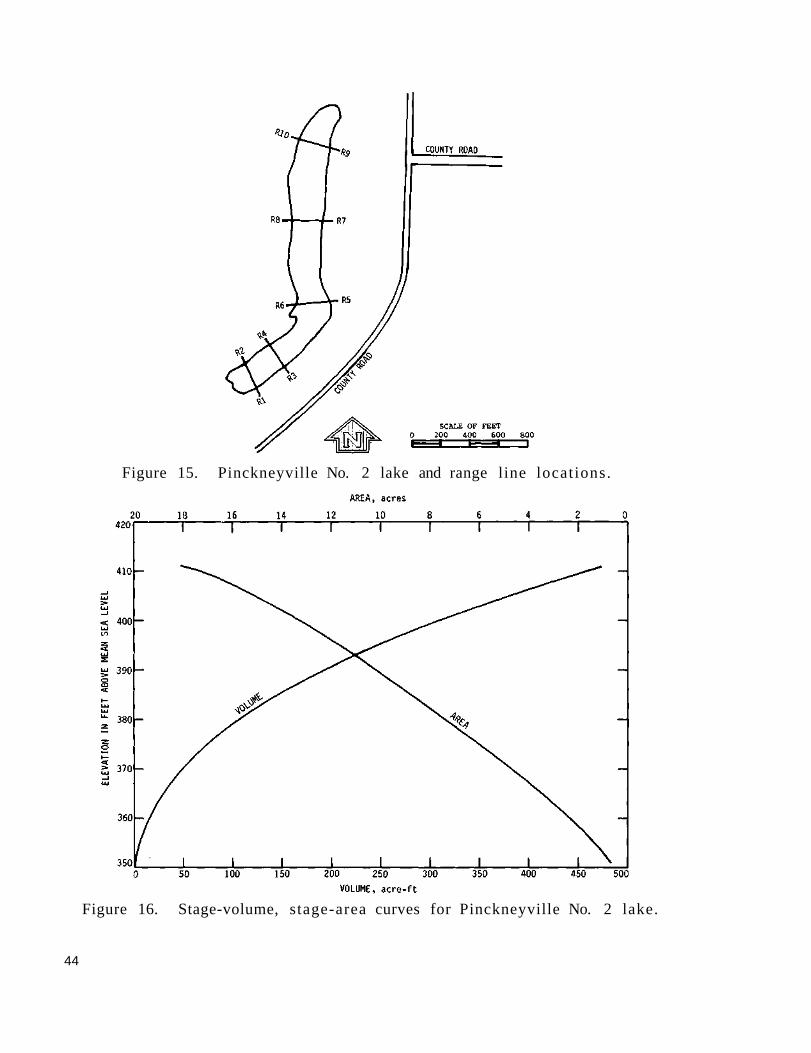
Figure 15. Pinckneyville No. 2 lake and range line locations.
Figure 16. Stage-volume, stage-area curves for Pinckneyville No. 2 lake.
44
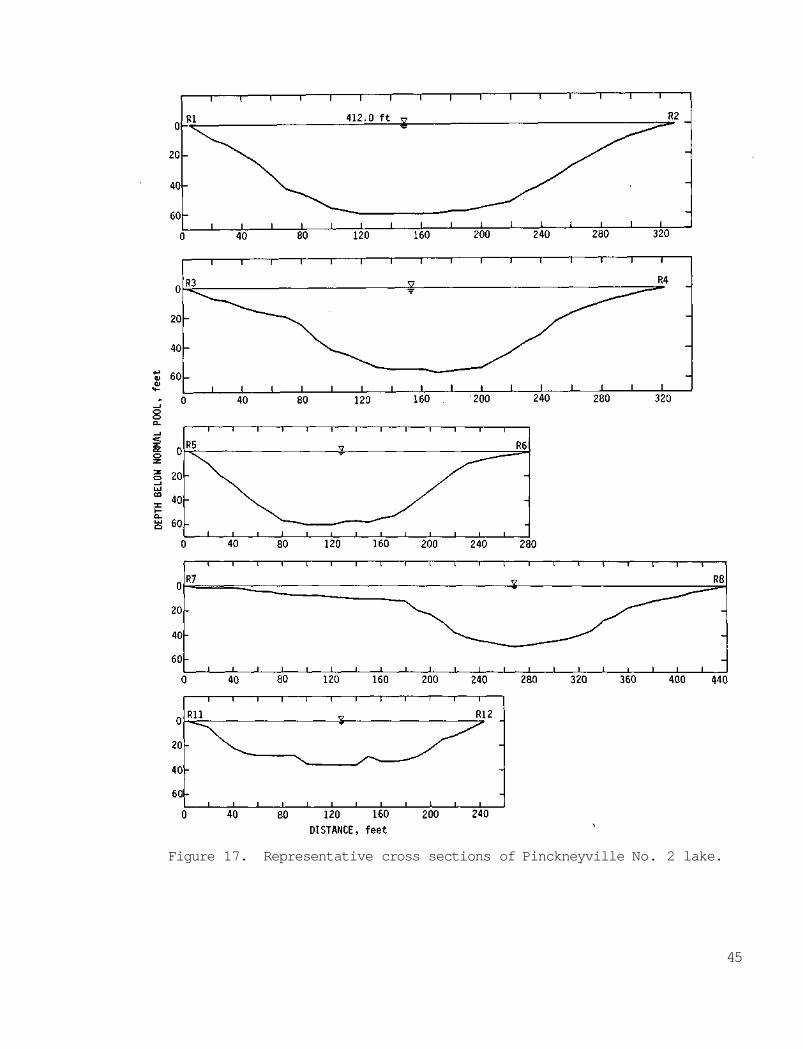
Figure 17. Representative cross sections of Pinckneyville No. 2 lake.
45
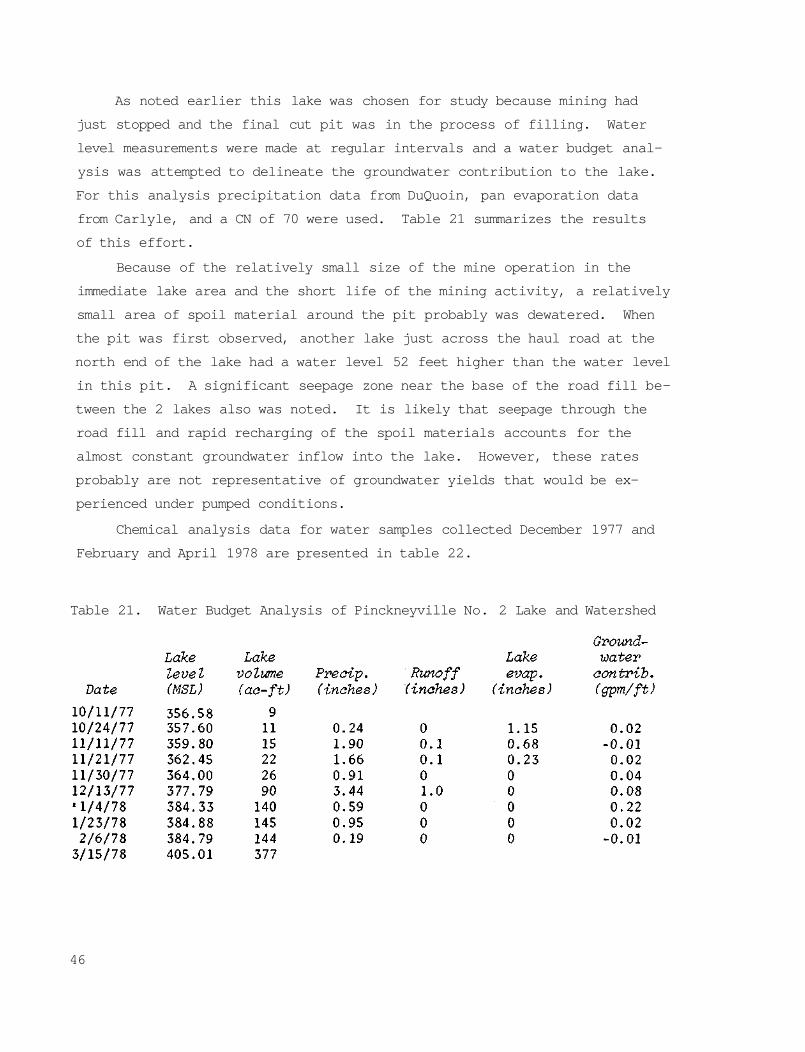
As noted earlier this lake was chosen for study because mining had
just stopped and the final cut pit was in the process of filling. Water
level measurements were made at regular intervals and a water budget anal
ysis was attempted to delineate the groundwater contribution to the lake.
For this analysis precipitation data from DuQuoin, pan evaporation data
from Carlyle, and a CN of 70 were used. Table 21 summarizes the results
of this effort.
Because of the relatively small size of the mine operation in the
immediate lake area and the short life of the mining activity, a relatively
small area of spoil material around the pit probably was dewatered. When
the pit was first observed, another lake just across the haul road at the
north end of the lake had a water level 52 feet higher than the water level
in this pit. A significant seepage zone near the base of the road fill be
tween the 2 lakes also was noted. It is likely that seepage through the
road fill and rapid recharging of the spoil materials accounts for the
almost constant groundwater inflow into the lake. However, these rates
probably are not representative of groundwater yields that would be ex
perienced under pumped conditions.
Chemical analysis data for water samples collected December 1977 and
February and April 1978 are presented in table 22.
Table 21. Water Budget Analysis of Pinckneyville No. 2 Lake and Watershed
46
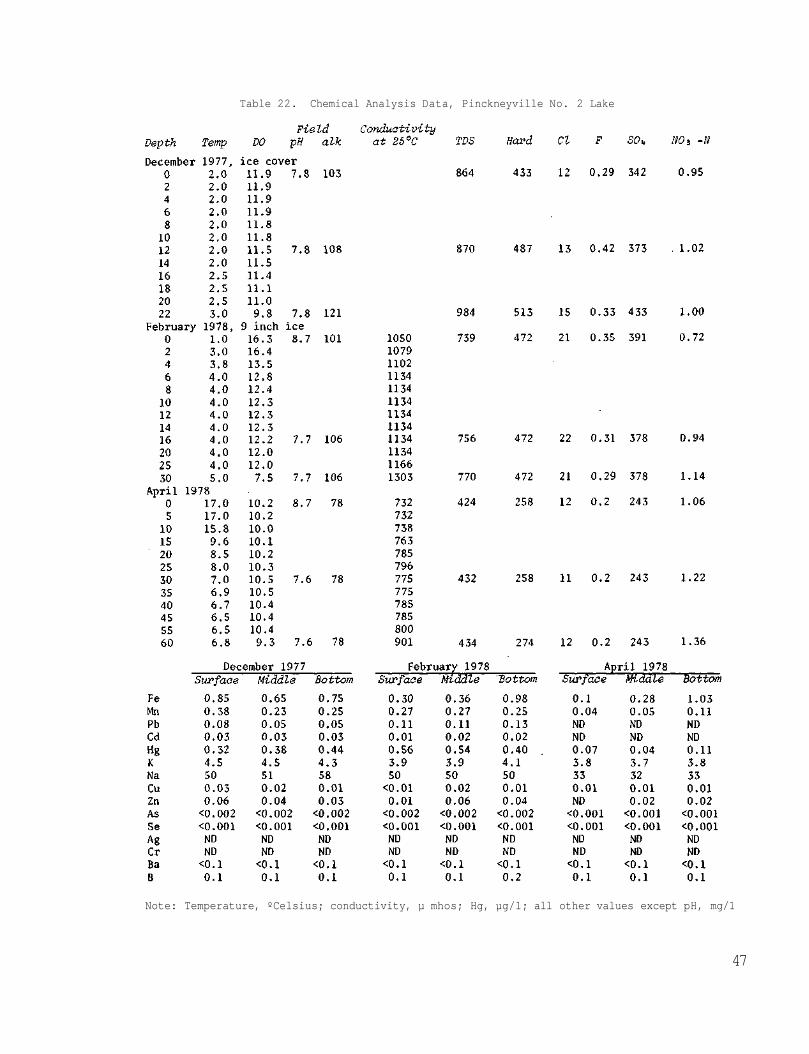
Table 22. Chemical Analysis Data, Pinckneyville No. 2 Lake
Note: Temperature, ºCelsius; conductivity, µ mhos; Hg, µg/1; all other values except pH, mg/1
47
5 -- Old DuQuoin Pit
Old DuQuoin Pit is located in Section 6, T5S, R2W, Perry County. It
is owned by Consolidated Coal Company who opened the mine in mid-1950 and
closed it in July 1974. The Herrin (No. 6) coal was mined with a 5761
Marion shovel (65 cubic yards) and a 1060 Bucyrus Erie bucket wheel exca
vator (9 buckets at 2.75 cubic yards each). The spoil materials were
placed in the same vertical positions as before mining, that is, unconsoli
dated materials on top of consolidated materials. The overburden materials
range in depth from 30 to 90 feet with 20 to 65 feet of unconsolidated
clays, tills, and sand. The rock overburden consisted of dark gray shale
and limestone layers (14).
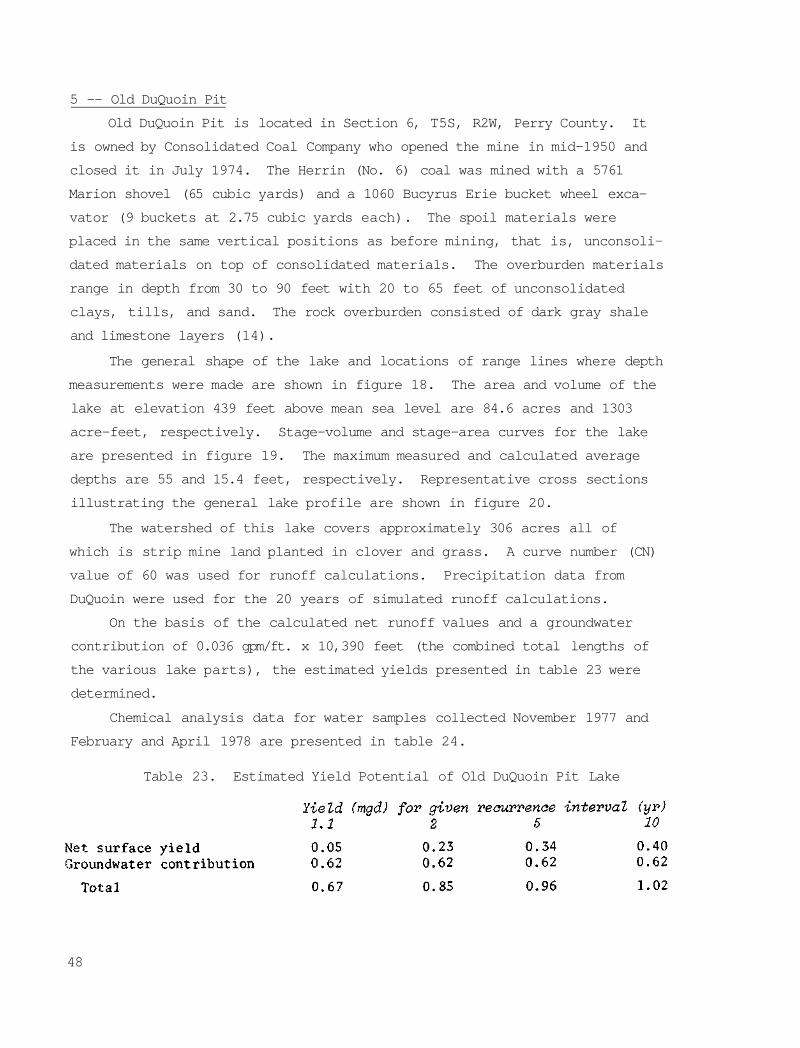
The general shape of the lake and locations of range lines where depth
measurements were made are shown in figure 18. The area and volume of the
lake at elevation 439 feet above mean sea level are 84.6 acres and 1303
acre-feet, respectively. Stage-volume and stage-area curves for the lake
are presented in figure 19. The maximum measured and calculated average
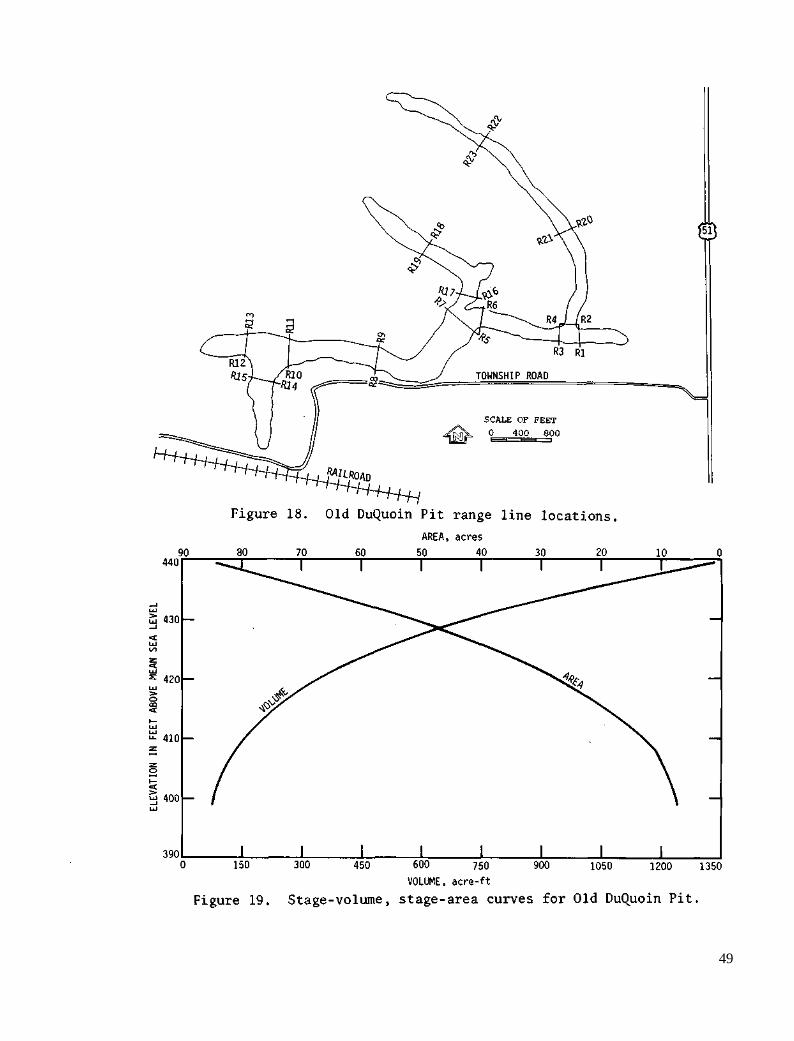
depths are 55 and 15.4 feet, respectively. Representative cross sections
illustrating the general lake profile are shown in figure 20.
The watershed of this lake covers approximately 306 acres all of
which is strip mine land planted in clover and grass. A curve number (CN)
value of 60 was used for runoff calculations. Precipitation data from
DuQuoin were used for the 20 years of simulated runoff calculations.
On the basis of the calculated net runoff values and a groundwater
contribution of 0.036 gpm/ft. x 10,390 feet (the combined total lengths of
the various lake parts), the estimated yields presented in table 23 were
determined.
Chemical analysis data for water samples collected November 1977 and
February and April 1978 are presented in table 24.
Table 23. Estimated Yield Potential of Old DuQuoin Pit Lake
48
49
Figure 20. Representative cross sections of Old DuQuoin Pit.
50
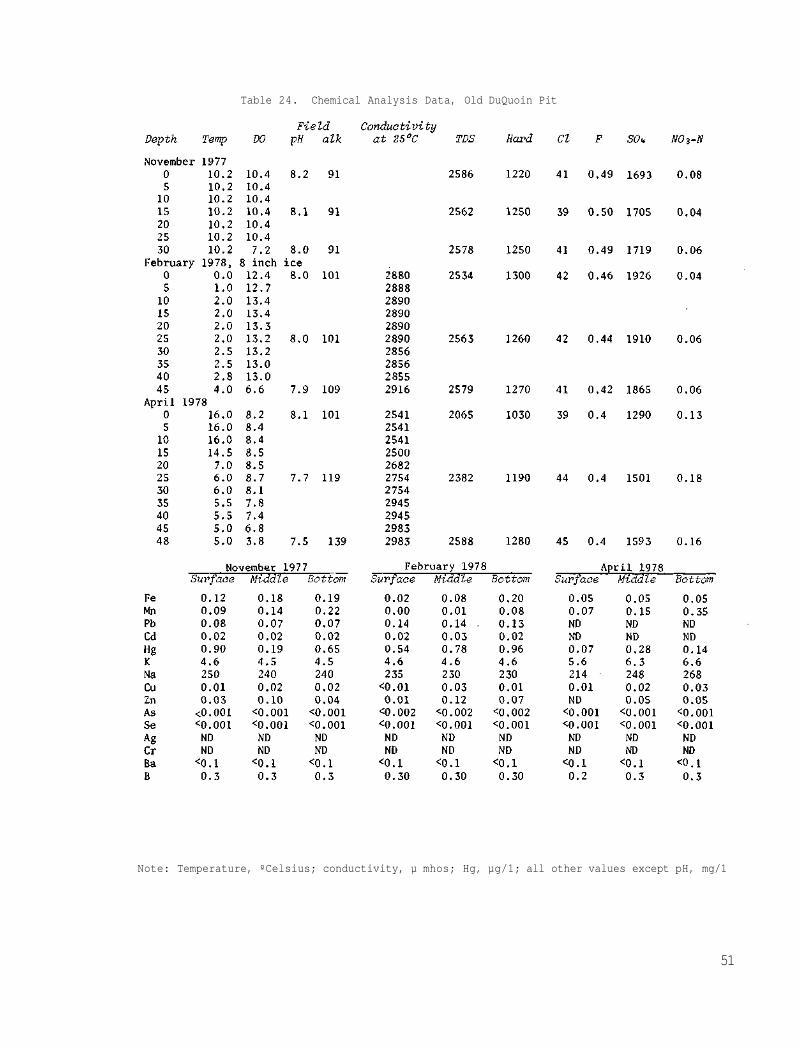
Table 24. Chemical Analysis Data, Old DuQuoin Pit
Note: Temperature, ºCelsius; conductivity, µ mhos; Hg, µg/1; all other values except pH, mg/1
51
6 -- "East C" Streamline Mine
"East C" Streamline Mine is located in Section 32, T5S, R4W, Randolph
County. The lake and surrounding property is owned by Southwestern Coal
Company who opened the mine in July 1966 and closed it May 1974. The Her-
rin (No. 6) coal was mined with 5761M and 5561M shovels until 1969 when the
5561M was replaced with a 5560 bucket wheel excavator. The coal was over-
lain by 75 to 100 feet of overburden materials of which 20 to 40 feet was
glacial clays and tills. The rock overburden consisted of interbedded
layers of dark gray shale, limestone, and slate (14).
The general shape of the lake and locations of range lines where depth
measurements were made are shown in figure 21. The area and volume of the
lake at elevation 440 feet above mean sea level are 112.0 acres and 3488
acre-feet, respectively. Stage-volume and stage-area curves for the lake
are presented in figure 22. The maximum measured and calculated average
depths are 82 and 31.1 feet, respectively. Representative cross sections
illustrating the lake profile are shown in figure 23.
The watershed of this lake extends to the west about 1 mile and to
the north 1 mile. It covers about 2966 acres of which about 60 percent is
strip mine land planted in grass and clover. The remainder is cultivated
farm land. Because of the significant amount of farm land, a curve number
(CN) value of 70 was used for simulated runoff calculations. Precipitation
data from DuQuoin were used for the 20 years of interest.
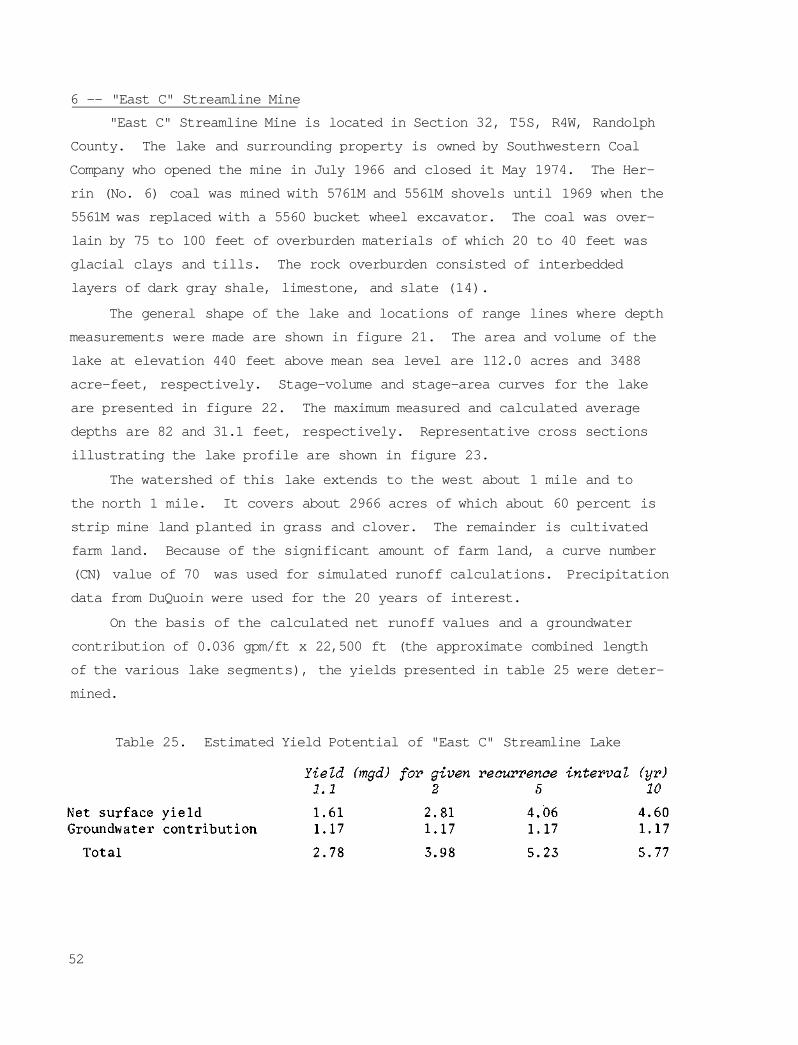
On the basis of the calculated net runoff values and a groundwater
contribution of 0.036 gpm/ft x 22,500 ft (the approximate combined length
of the various lake segments), the yields presented in table 25 were deter
mined.
Table 25. Estimated Yield Potential of "East C" Streamline Lake
52
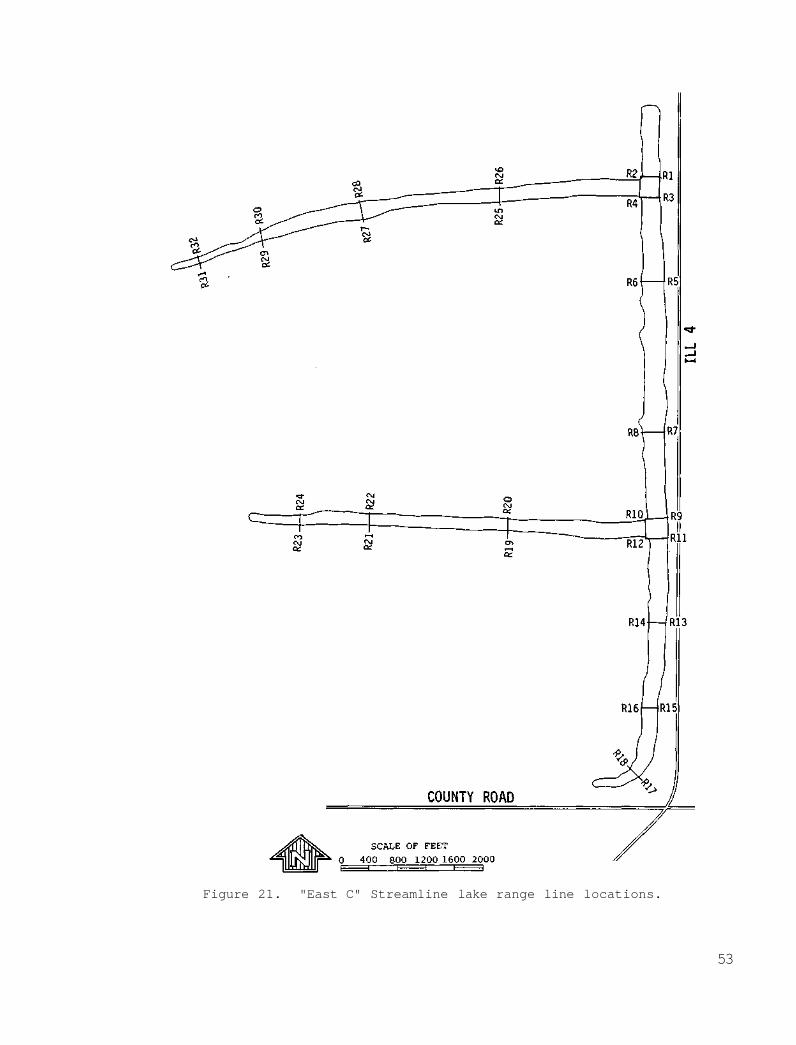
Figure 21. "East C" Streamline lake range line locations.
53
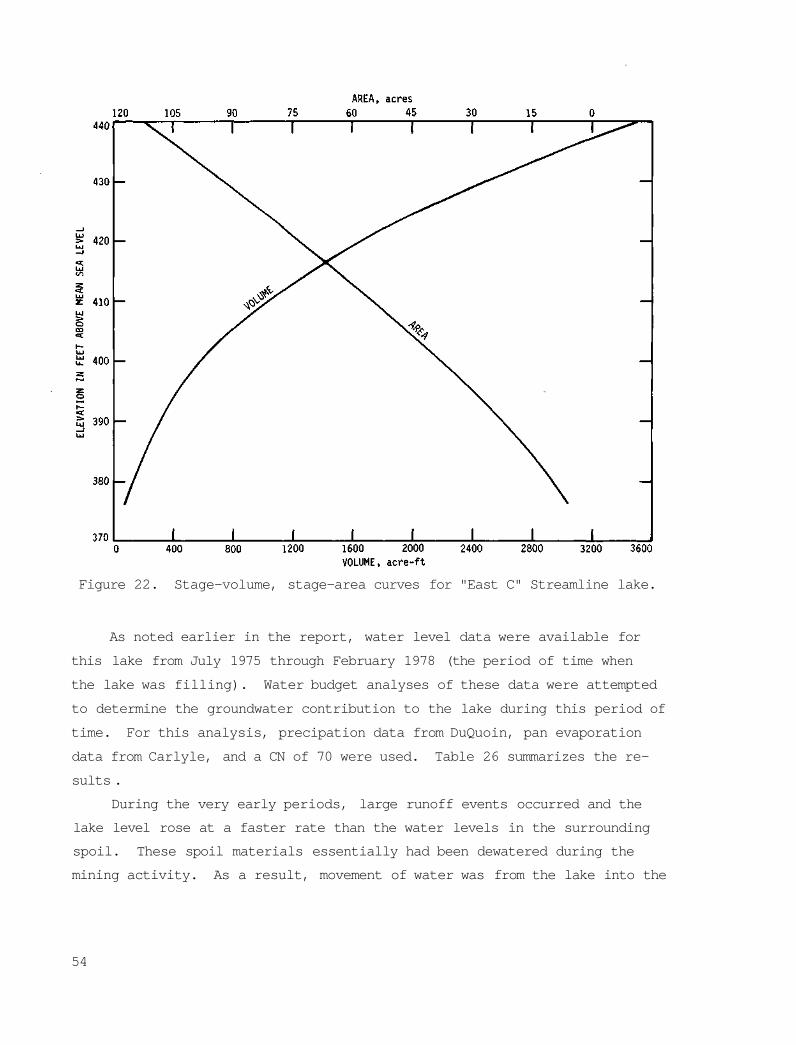
Figure 22. Stage-volume, stage-area curves for "East C" Streamline lake.
As noted earlier in the report, water level data were available for
this lake from July 1975 through February 1978 (the period of time when
the lake was filling). Water budget analyses of these data were attempted
to determine the groundwater contribution to the lake during this period of
time. For this analysis, precipation data from DuQuoin, pan evaporation
data from Carlyle, and a CN of 70 were used. Table 26 summarizes the re
sults .
During the very early periods, large runoff events occurred and the
lake level rose at a faster rate than the water levels in the surrounding
spoil. These spoil materials essentially had been dewatered during the
mining activity. As a result, movement of water was from the lake into the
54
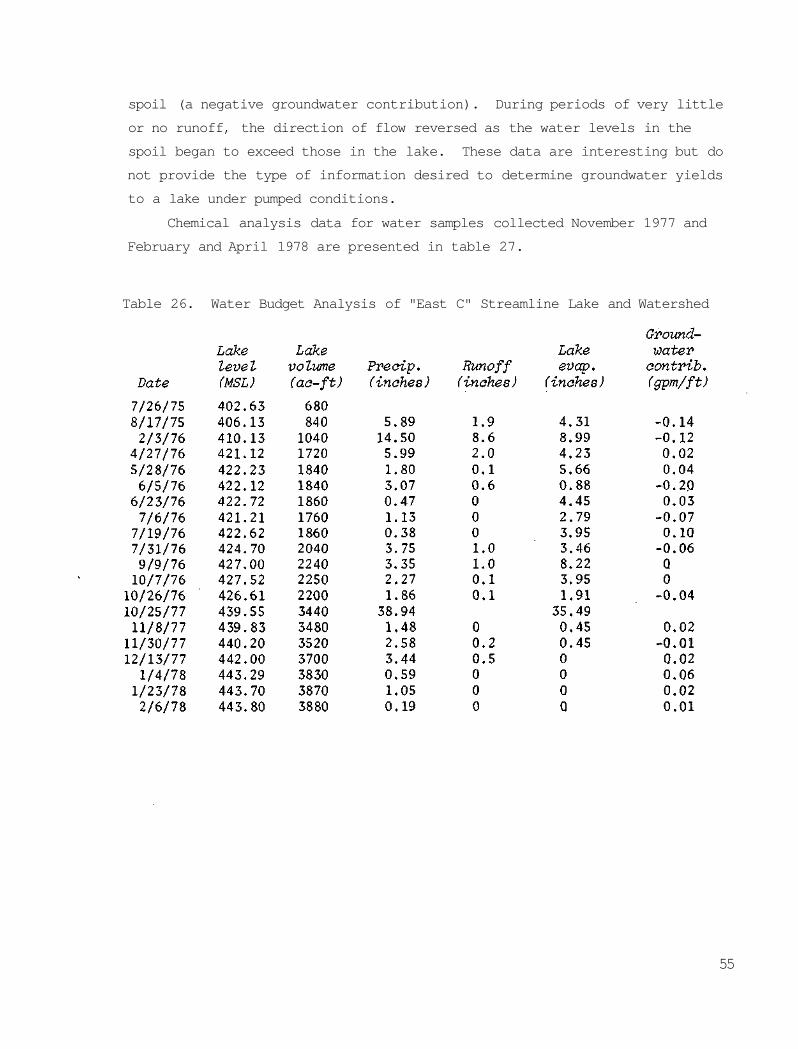
spoil (a negative groundwater contribution). During periods of very little
or no runoff, the direction of flow reversed as the water levels in the
spoil began to exceed those in the lake. These data are interesting but do
not provide the type of information desired to determine groundwater yields
to a lake under pumped conditions.
Chemical analysis data for water samples collected November 1977 and
February and April 1978 are presented in table 27.
Table 26. Water Budget Analysis of "East C" Streamline Lake and Watershed
55
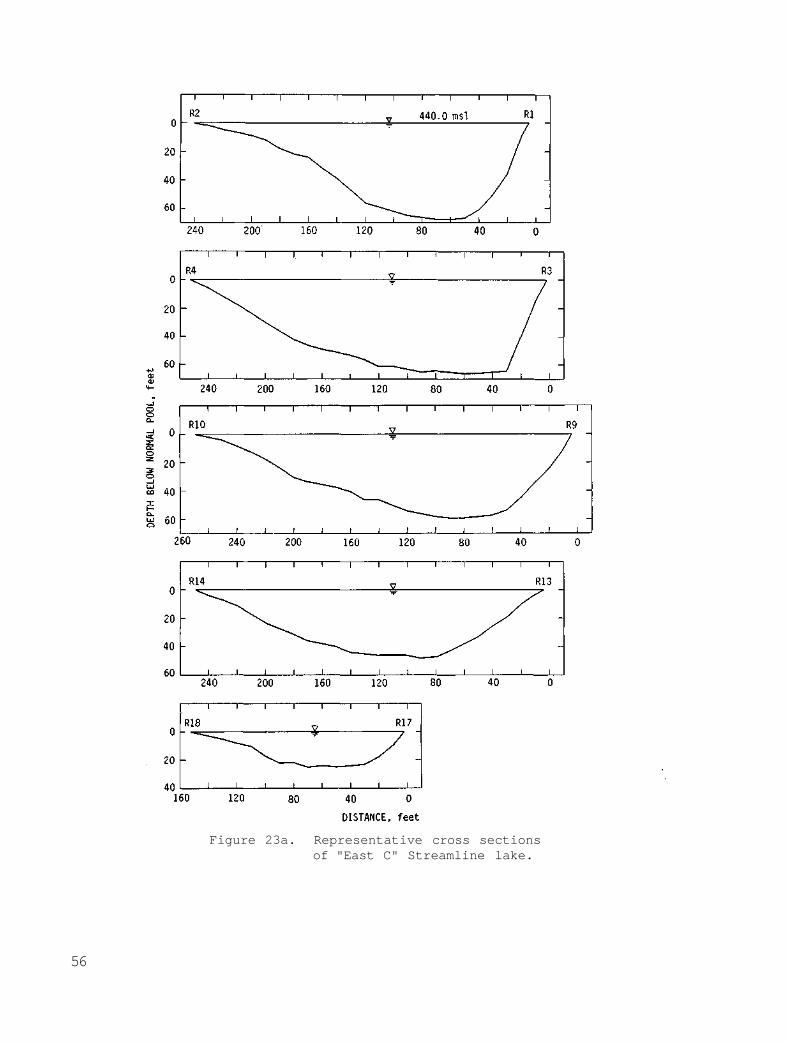
Figure 23a. Representative cross sections of "East C" Streamline lake.
56
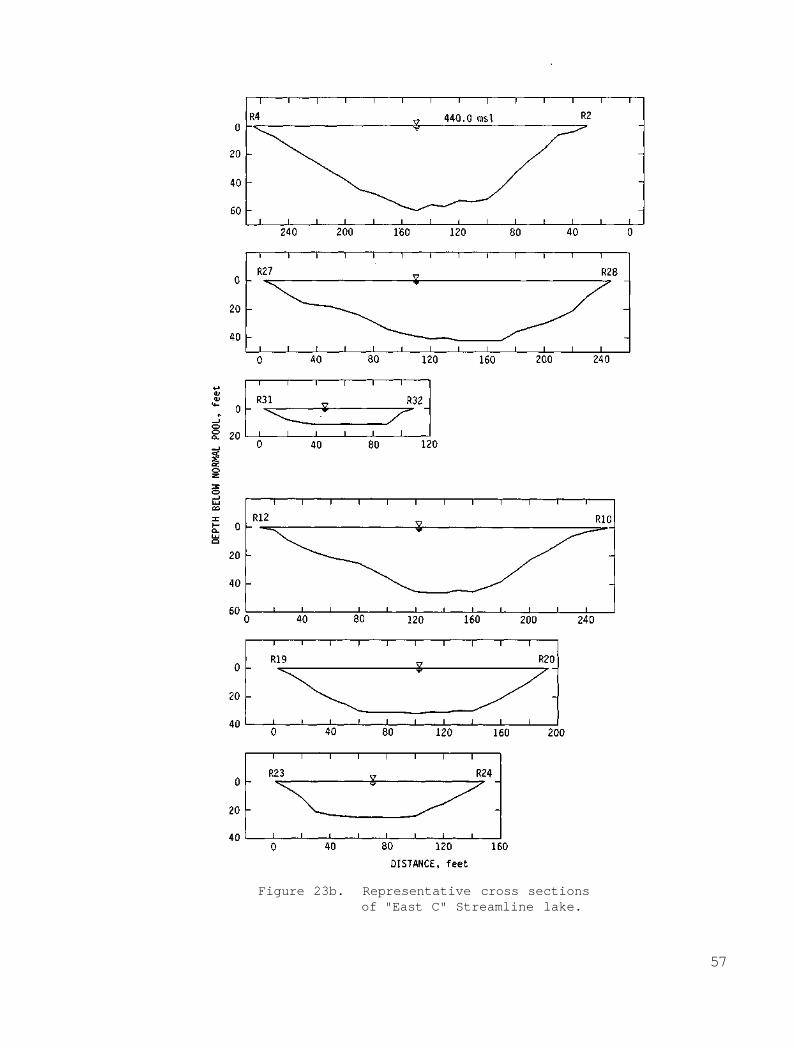
Figure 23b. Representative cross sections of "East C" Streamline lake.
57
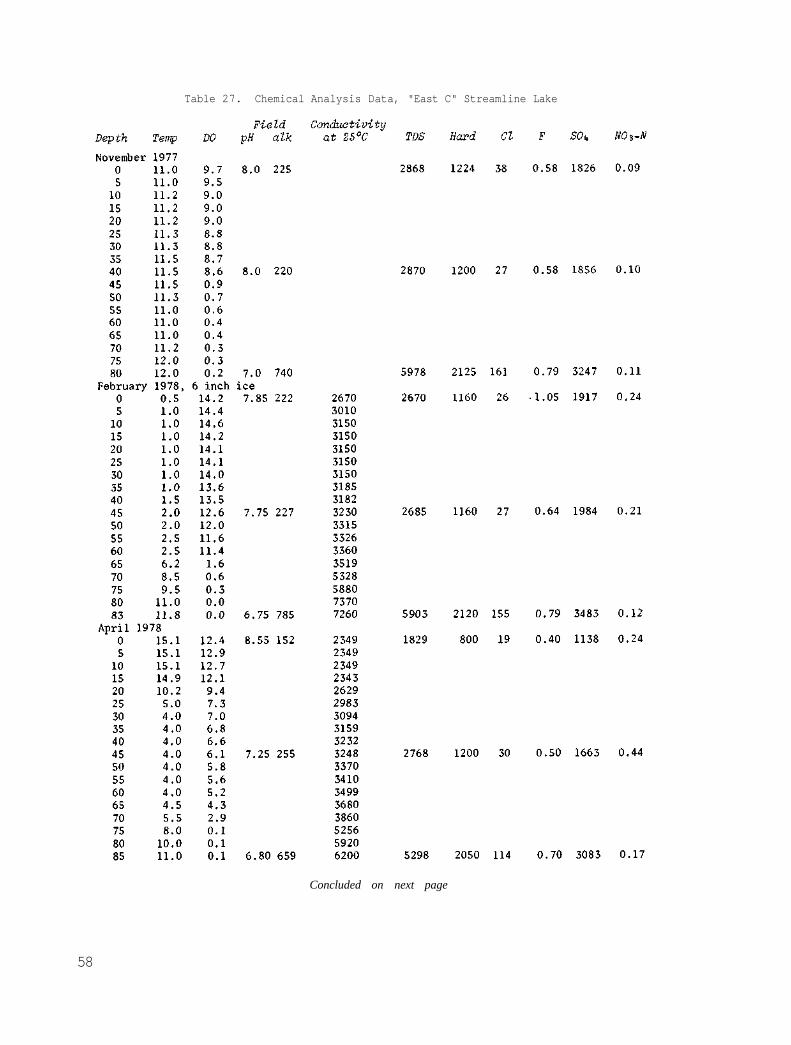
Table 27. Chemical Analysis Data, "East C" Streamline Lake
Concluded on next page
58
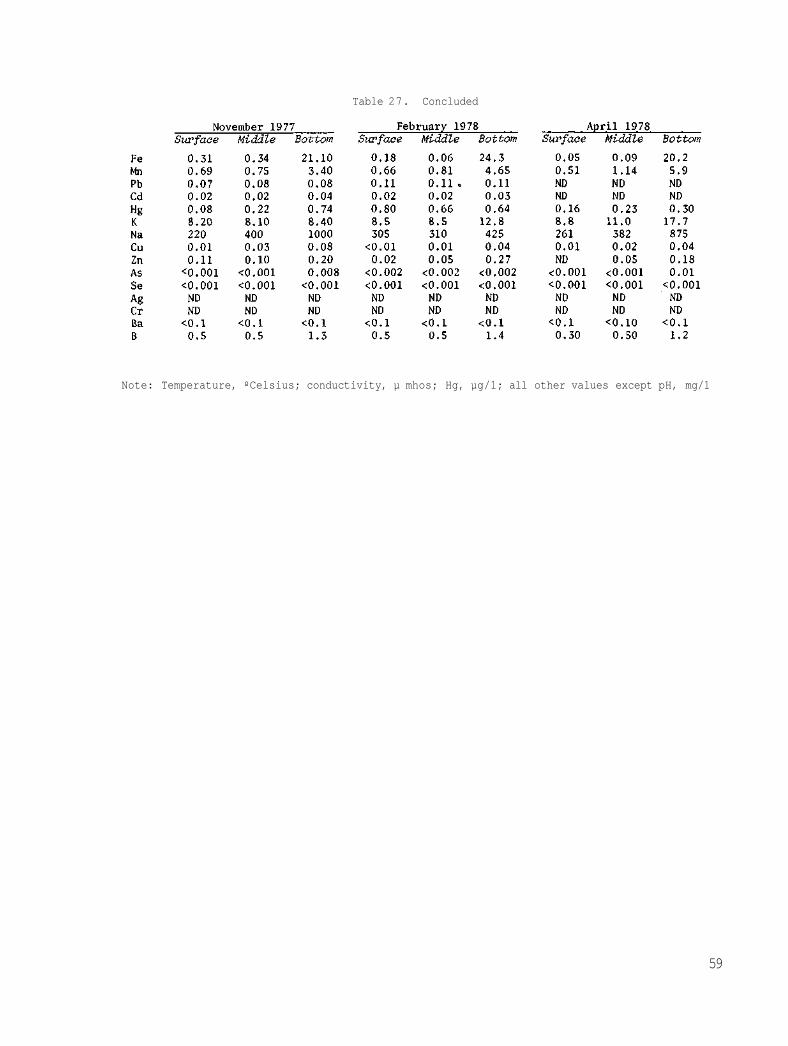
Table 27. Concluded
Note: Temperature, ºCelsius; conductivity, µ mhos; Hg, µg/1; all other values except pH, mg/1
59
7 -- Red Ray Lake
Red Ray lake is located in Section 33, T1S, R7W, St. Clair County.
The lake and surrounding property are owned by Peabody Coal Company who
opened the mine in September 1957 and closed it in January 1965. The Her-
rin (No. 6) coal was mined with a 5760 M 70 cubic yard shovel. The coal
was overlain by less than 50 feet of overburden materials, of which almost
all was glacial clay, till, and sand (14).
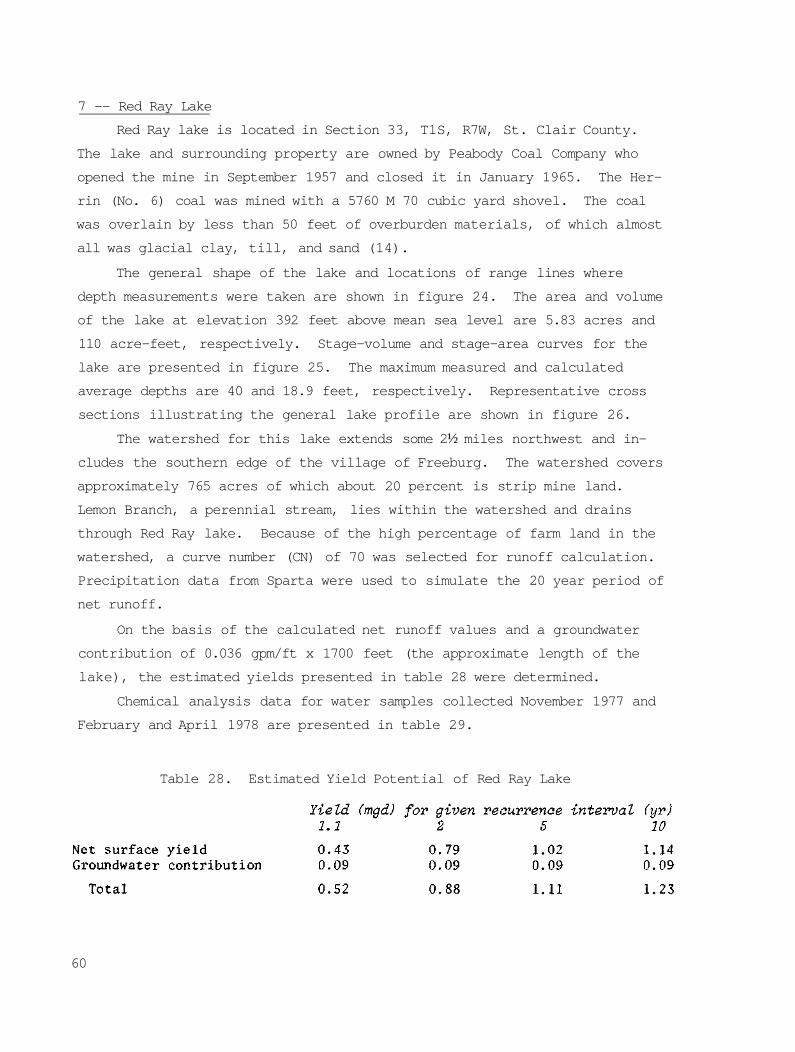
The general shape of the lake and locations of range lines where
depth measurements were taken are shown in figure 24. The area and volume
of the lake at elevation 392 feet above mean sea level are 5.83 acres and
110 acre-feet, respectively. Stage-volume and stage-area curves for the
lake are presented in figure 25. The maximum measured and calculated
average depths are 40 and 18.9 feet, respectively. Representative cross
sections illustrating the general lake profile are shown in figure 26.
The watershed for this lake extends some 2½ miles northwest and in
cludes the southern edge of the village of Freeburg. The watershed covers
approximately 765 acres of which about 20 percent is strip mine land.
Lemon Branch, a perennial stream, lies within the watershed and drains
through Red Ray lake. Because of the high percentage of farm land in the
watershed, a curve number (CN) of 70 was selected for runoff calculation.
Precipitation data from Sparta were used to simulate the 20 year period of
net runoff.
On the basis of the calculated net runoff values and a groundwater
contribution of 0.036 gpm/ft x 1700 feet (the approximate length of the
lake), the estimated yields presented in table 28 were determined.
Chemical analysis data for water samples collected November 1977 and
February and April 1978 are presented in table 29.
Table 28. Estimated Yield Potential of Red Ray Lake
60
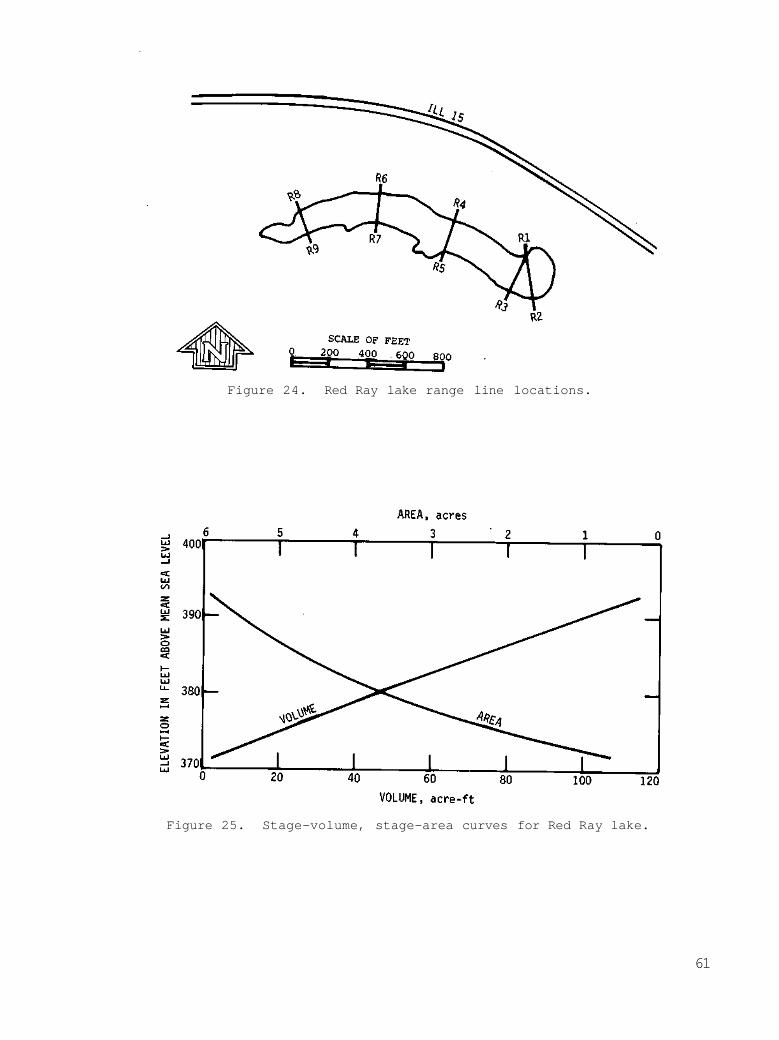
Figure 24. Red Ray lake range line locations.
Figure 25. Stage-volume, stage-area curves for Red Ray lake.
61
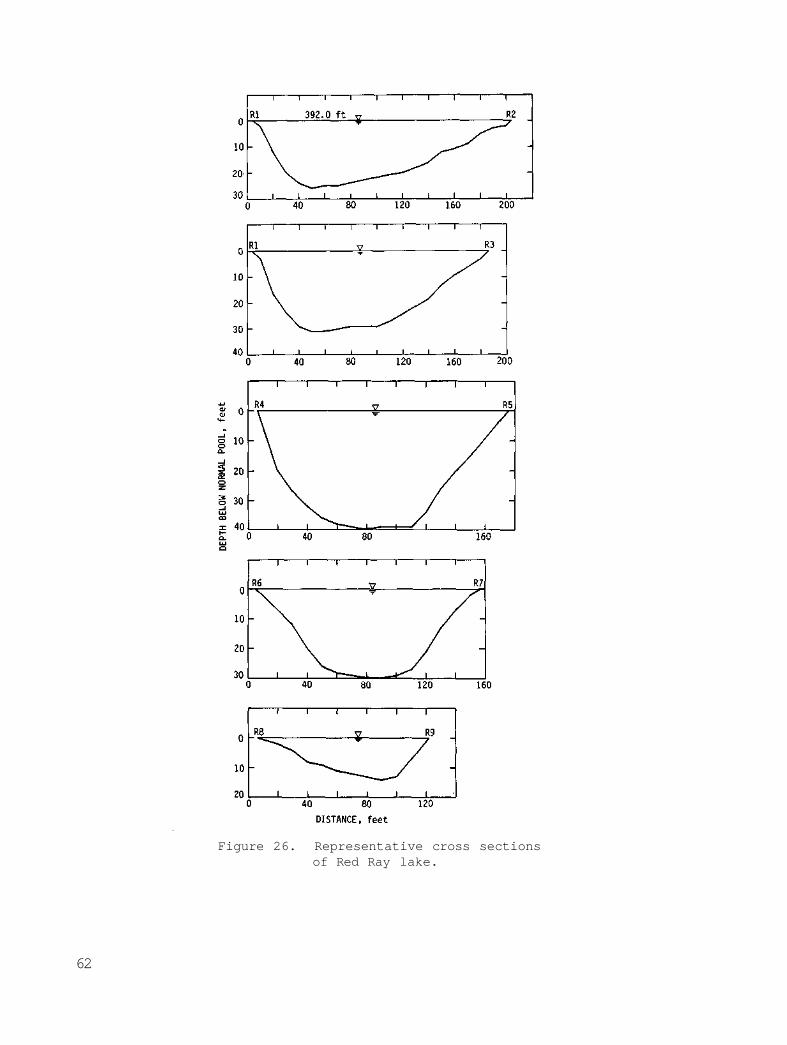
Figure 26. Representative cross sections of Red Ray lake.
62
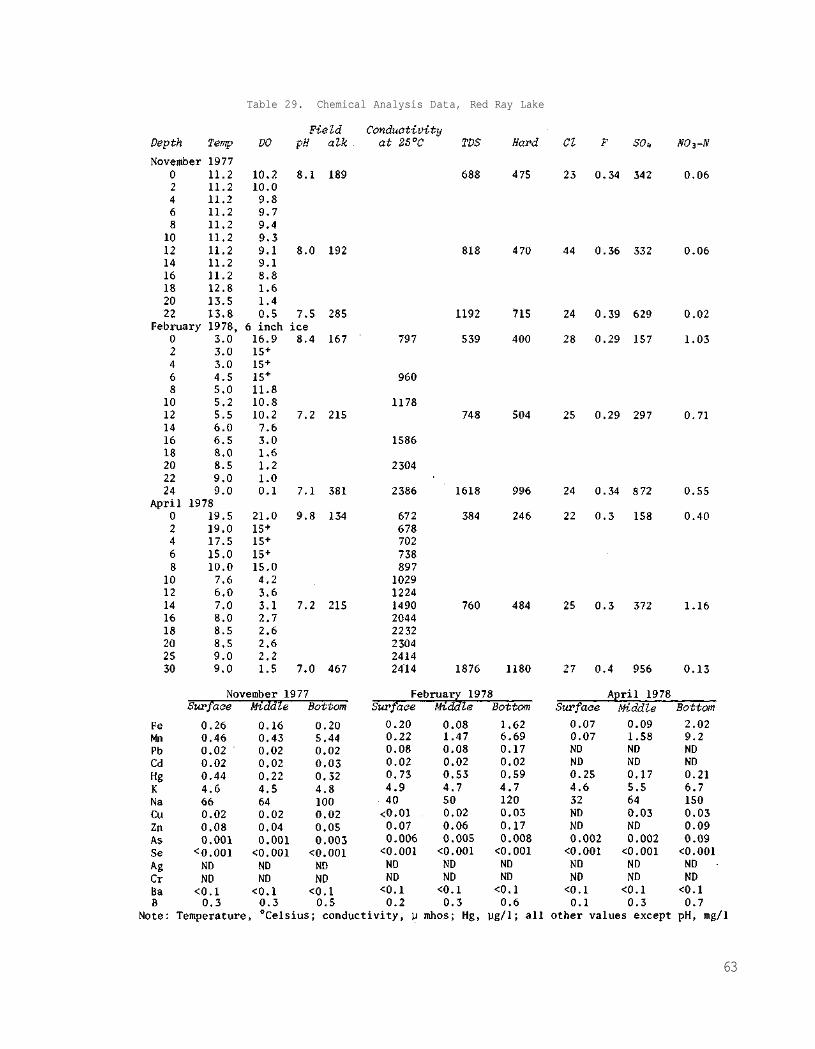
Table 29. Chemical Analysis Data, Red Ray Lake
63
8 -- Seminole Lake
Seminole lake is located in Section 2, T3S, R7W, St. Clair County.
The lake and surrounding property is owned by Peabody Coal Company who
opened the mine in October 1950 and closed it in March 1954. The Herrin
(No. 6) coal was mined with a 5480 Marion 20 cubic yard shovel and 7800
Marion 30 cubic yard dragline. The coal was overlain by 50 to 75 feet of
overburden of which only 20 to 30 feet was glacial materials. The rock
overburden consisted of black slaty shale overlain by interbedded gray
shale, clay, and limestone beds (14).
The general shape of the lake and locations of range lines where depth
measurements were taken are shown in figure 27. The area and volume of the
lake at elevation 416 feet above mean sea level are 7.81 acres and 97 acre-
feet, respectively. Stage-volume and stage-area curves for the lake are
presented in figure 28. The maximum measured and calculated average depths
are 23 and 12.4 feet, respectively. Representative cross sections illus
trating the general lake profile are shown in figure 29.
The watershed of this lake is contained within ½ mile of the lake and
covers about 77 acres. Approximately 50 percent is spoil material and is
grown up in shrubs and small trees. The remainder is cultivated farm land.
A curve number (CN) value of 70 was selected for simulated runoff calcula
tions. Precipitation data from Sparta were used for the 20 years simula
tion.
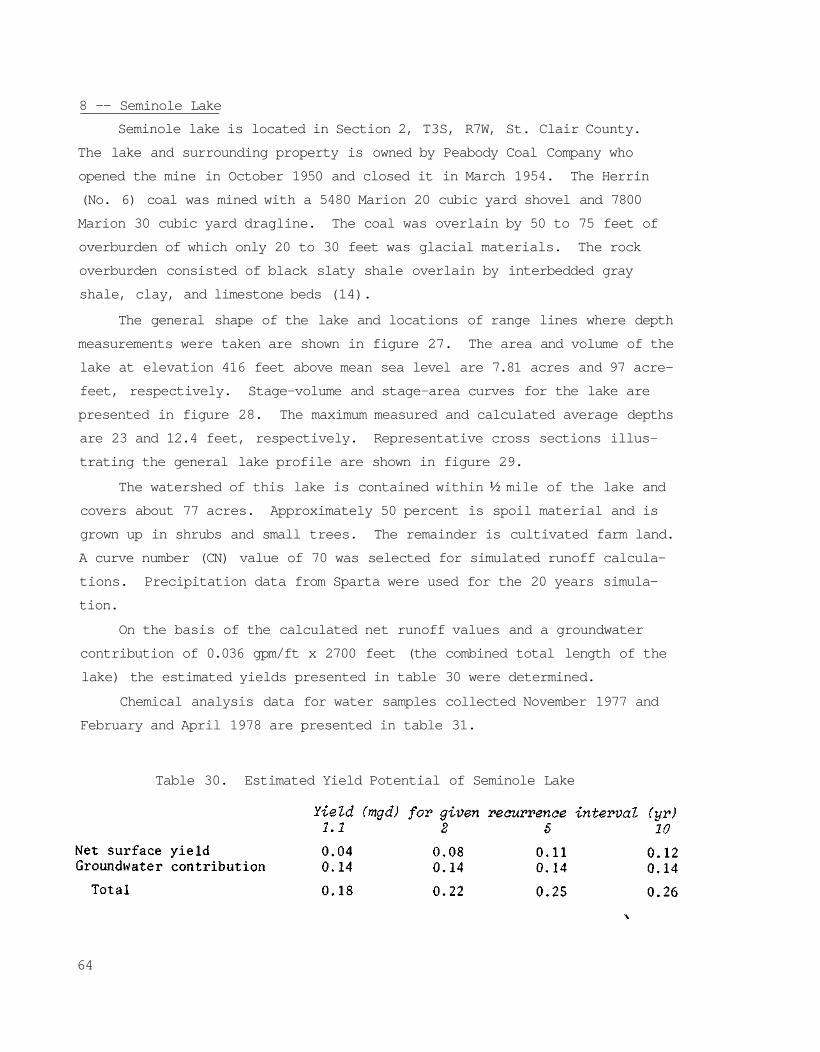
On the basis of the calculated net runoff values and a groundwater
contribution of 0.036 gpm/ft x 2700 feet (the combined total length of the
lake) the estimated yields presented in table 30 were determined.
Chemical analysis data for water samples collected November 1977 and
February and April 1978 are presented in table 31.
Table 30. Estimated Yield Potential of Seminole Lake
64
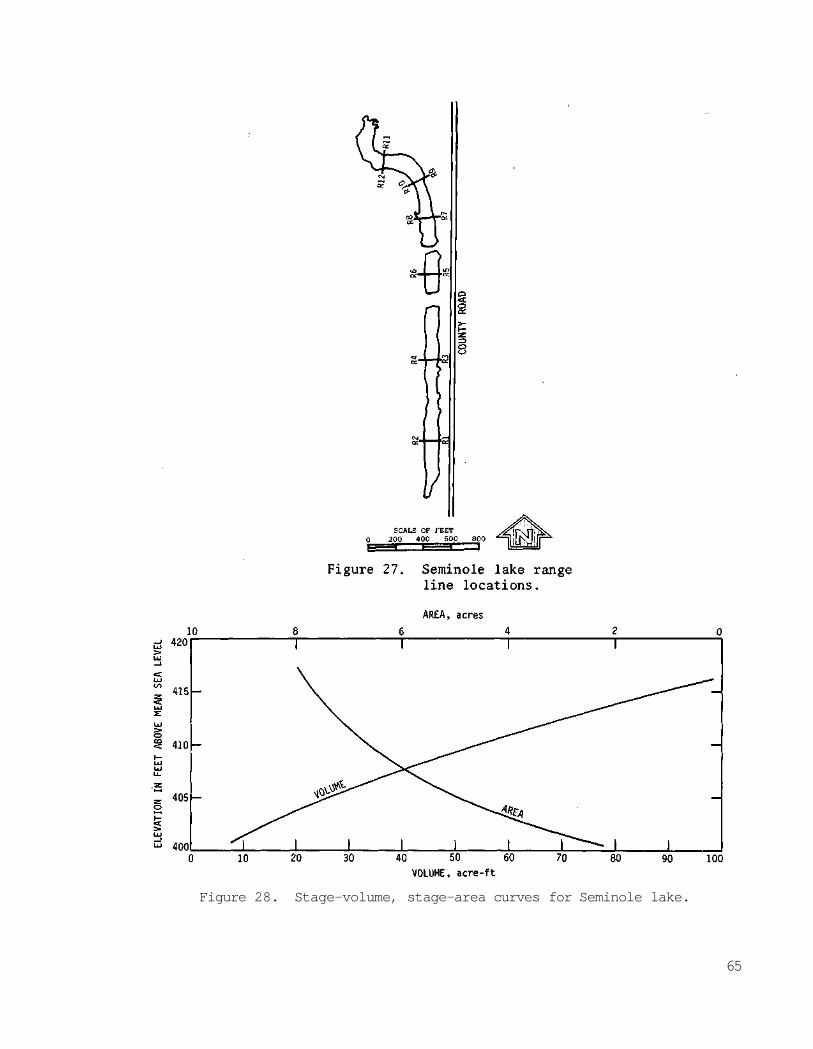
Figure 28. Stage-volume, stage-area curves for Seminole lake.
65
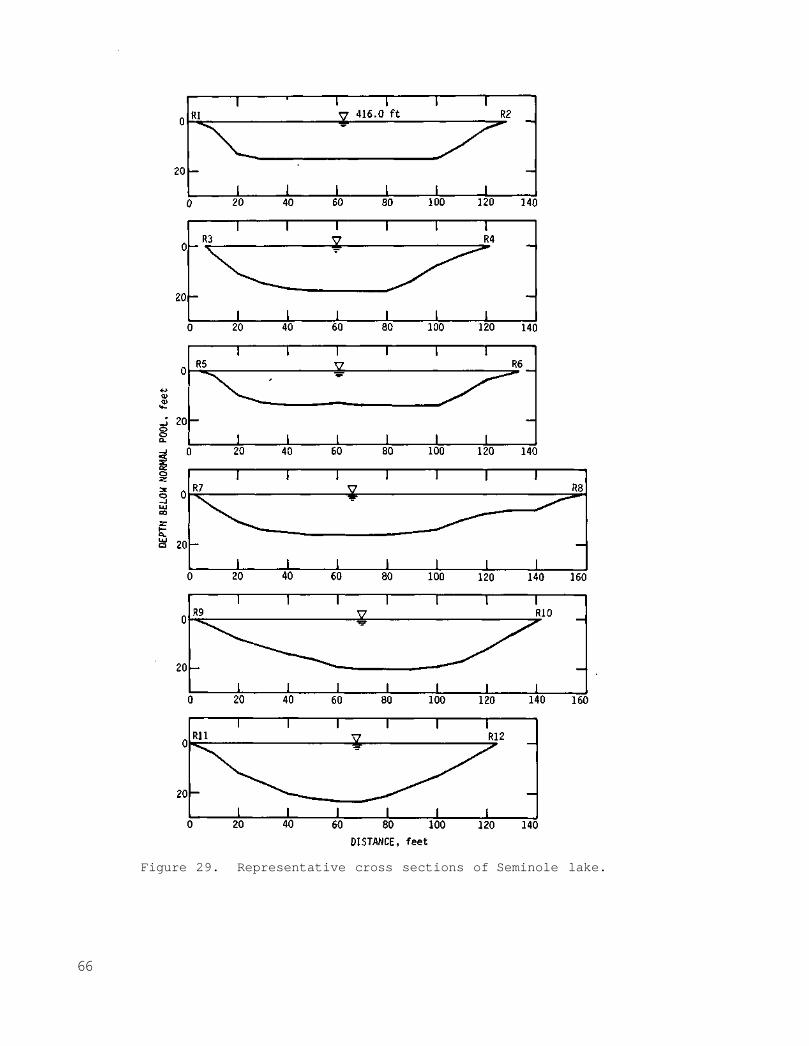
Figure 29. Representative cross sections of Seminole lake.
66
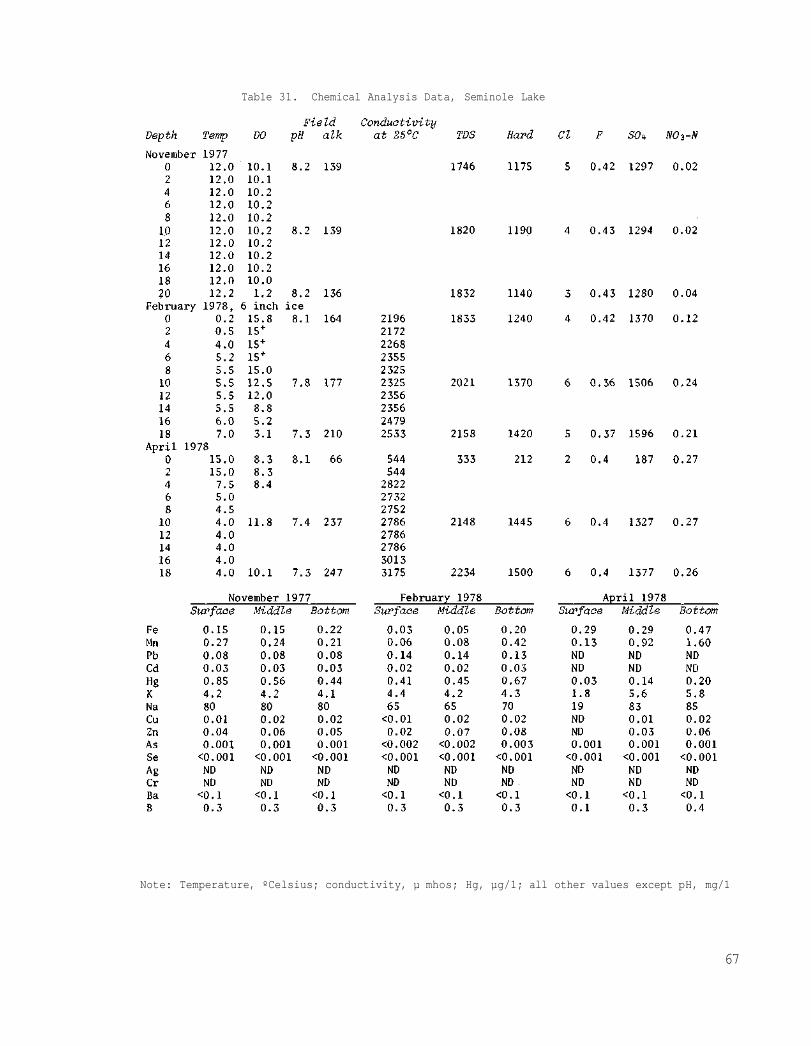
Table 31. Chemical Analysis Data, Seminole Lake
Note: Temperature, ºCelsius; conductivity, µ mhos; Hg, µg/1; all other values except pH, mg/1
67
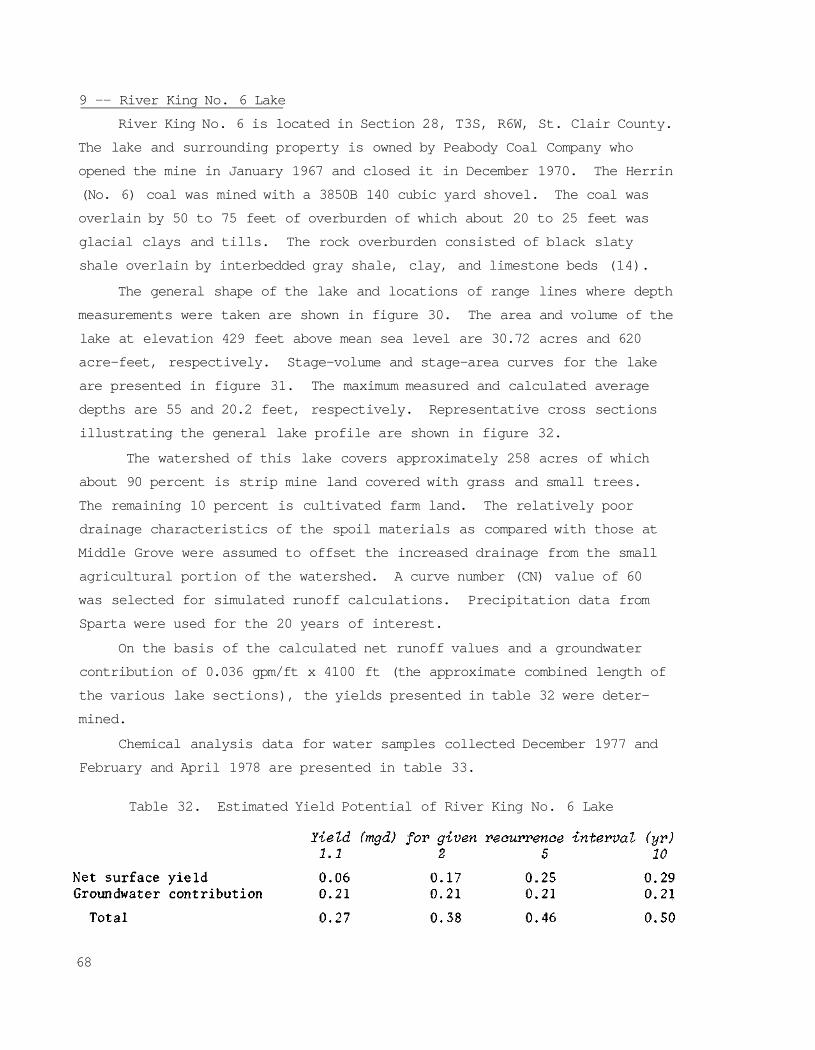
9 -- River King No. 6 Lake
River King No. 6 is located in Section 28, T3S, R6W, St. Clair County.
The lake and surrounding property is owned by Peabody Coal Company who
opened the mine in January 1967 and closed it in December 1970. The Herrin
(No. 6) coal was mined with a 3850B 140 cubic yard shovel. The coal was
overlain by 50 to 75 feet of overburden of which about 20 to 25 feet was
glacial clays and tills. The rock overburden consisted of black slaty
shale overlain by interbedded gray shale, clay, and limestone beds (14).
The general shape of the lake and locations of range lines where depth
measurements were taken are shown in figure 30. The area and volume of the
lake at elevation 429 feet above mean sea level are 30.72 acres and 620
acre-feet, respectively. Stage-volume and stage-area curves for the lake
are presented in figure 31. The maximum measured and calculated average
depths are 55 and 20.2 feet, respectively. Representative cross sections
illustrating the general lake profile are shown in figure 32.
The watershed of this lake covers approximately 258 acres of which
about 90 percent is strip mine land covered with grass and small trees.
The remaining 10 percent is cultivated farm land. The relatively poor
drainage characteristics of the spoil materials as compared with those at
Middle Grove were assumed to offset the increased drainage from the small
agricultural portion of the watershed. A curve number (CN) value of 60
was selected for simulated runoff calculations. Precipitation data from
Sparta were used for the 20 years of interest.
On the basis of the calculated net runoff values and a groundwater
contribution of 0.036 gpm/ft x 4100 ft (the approximate combined length of
the various lake sections), the yields presented in table 32 were deter
mined.
Chemical analysis data for water samples collected December 1977 and
February and April 1978 are presented in table 33.
Table 32. Estimated Yield Potential of River King No. 6 Lake
68
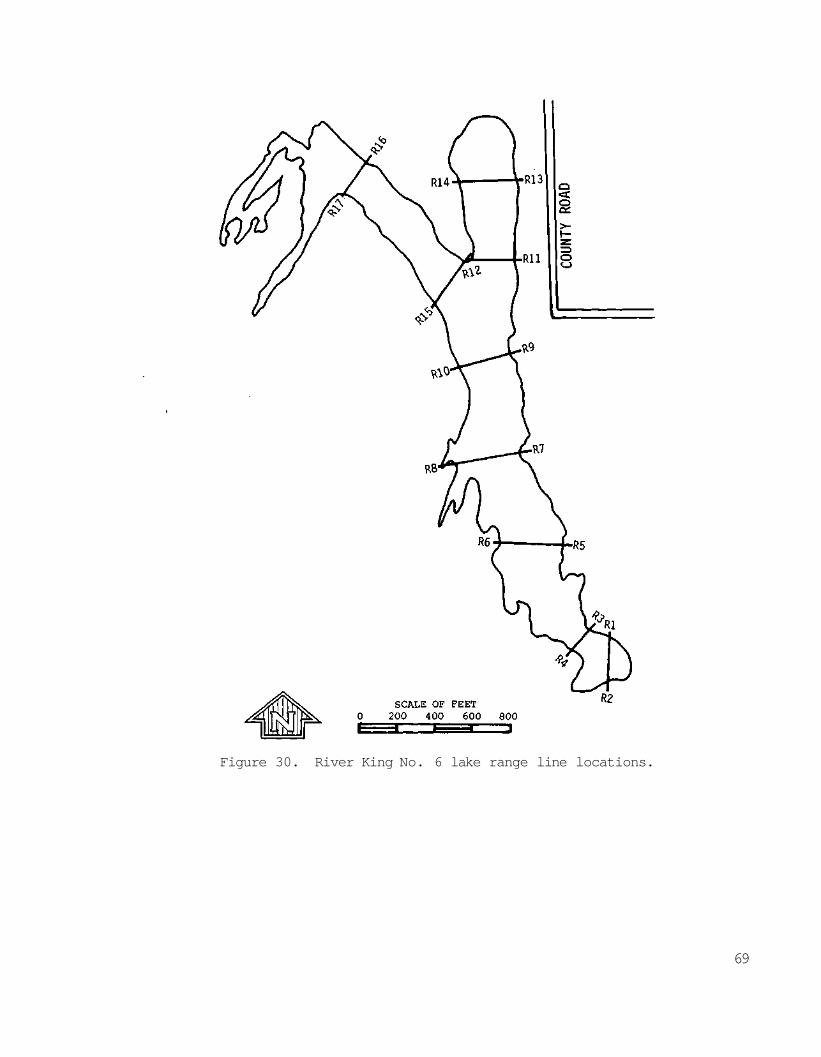
Figure 30. River King No. 6 lake range line locations.
69
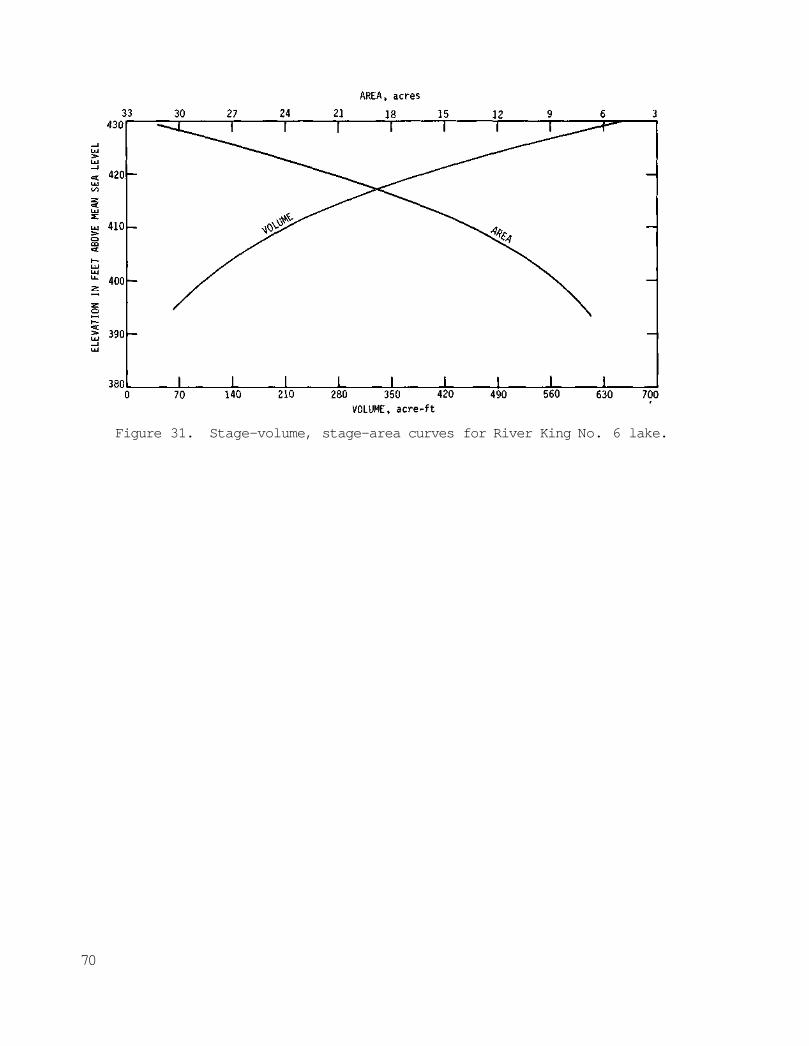
Figure 31. Stage-volume, stage-area curves for River King No. 6 lake.
70
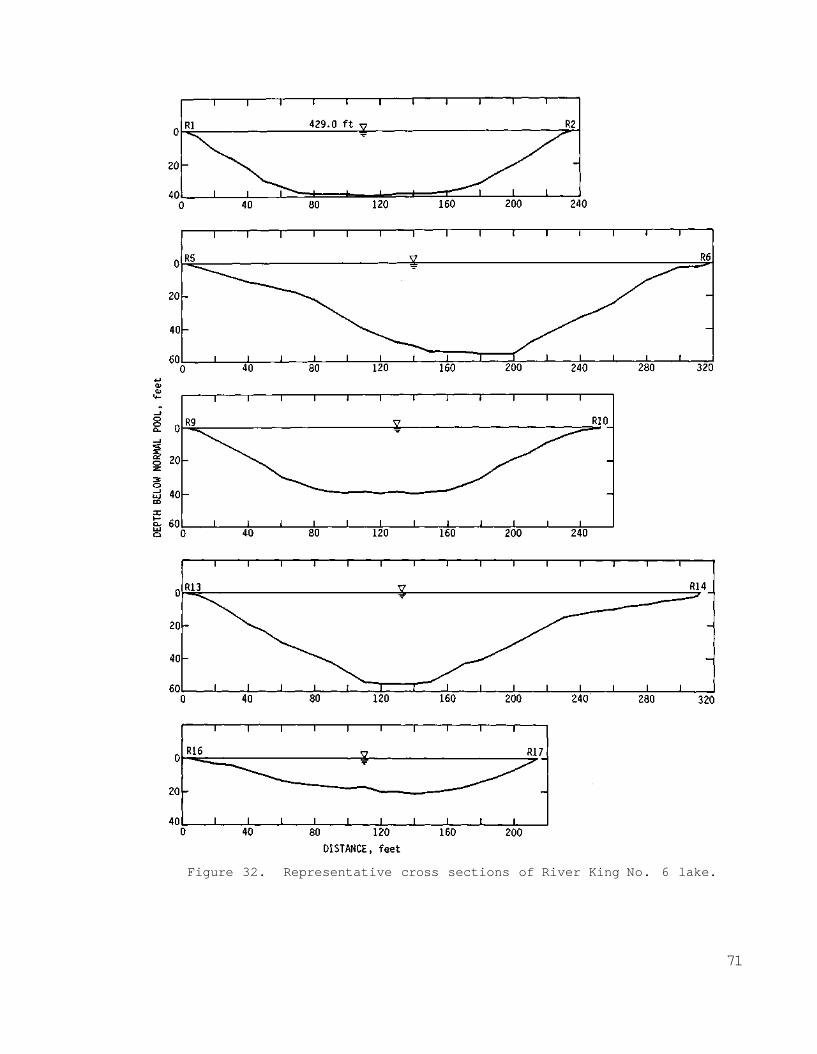
Figure 32. Representative cross sections of River King No. 6 lake.
71
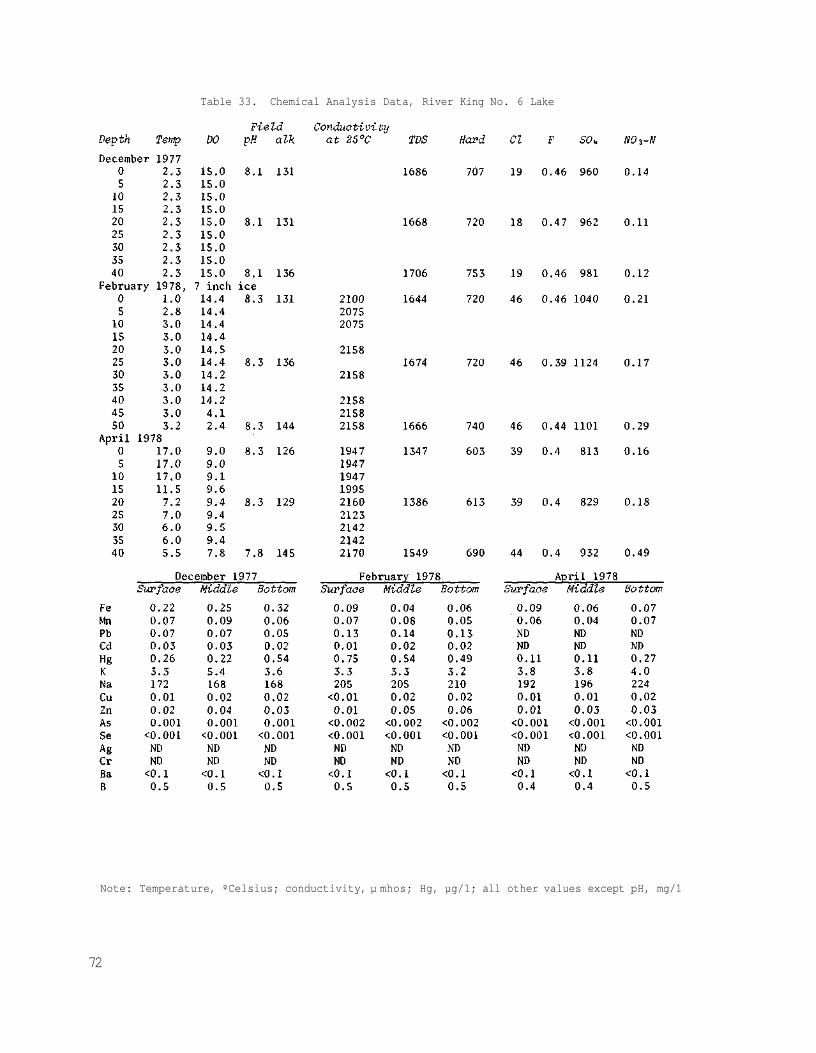
Table 33. Chemical Analysis Data, River King No. 6 Lake
Note: Temperature, ºCelsius; conductivity, µ mhos; Hg, µg/1; all other values except pH, mg/1
72
10 -- Coal City Area No. 1 Lake
Coal City Area No. 1 lake is located in Sections 31 and 32, T33N,
R9E, Will County. The lake and surrounding property now is owned by the
Coal City Sportsman Club. The mine was opened by Peabody Coal Company in
March 1928 and closed in late 1950. The Colchester (No. 2) coal was mined
with 5480M 6 cubic yard and 5480M 17 cubic yard draglines. The coal was
overlain by less than 50 feet of overburden of which about half was glacial
sands and clays. The rock overburden consisted of the Francis Creek shale
which was around 20 feet thick (15).
The general shape of the lake and locations of range lines where depth
measurements were taken are shown in figure 33. The area and volume of the
lake at elevation 543 feet above mean sea level are 70.74 acres and 1659
acre-feet, respectively. Stage-volume and stage-area curves for the lake
are presented in figure 34. The maximum measured and calculated average
depths are 54 and 23.4 feet, respectively. Representative cross sections
illustrating the general lake profile are shown in figure 35.
The watershed of this lake extends some 4 miles to the east and covers
approximately 2016 acres. About 70 percent of the watershed consists of
old strip mine lands and associated water bodies. The remaining 30 percent
is relatively flat farm land or low land marshy areas. A curve number (CN)
value of 60 was selected for runoff calculations as it was felt that the
relatively rugged terrain of the spoil would offset the anticipated in
creased runoff from the farm land portion of the watershed. Precipitation
data from Kankakee were used for the selected 20 years of simulated runoff.
On the basis of the calculated net runoff values and a groundwater
contribution of 0.036 gpm/ft x 12,000 ft (the approximate length of the
lake), the estimated yields presented in table 34 were determined.
Chemical analysis data for water samples collected November 1977 and
February and April 1978 are presented in table 35.
Table 34. Estimated Yield Potential of Coal City Area No. 1 Lake
73
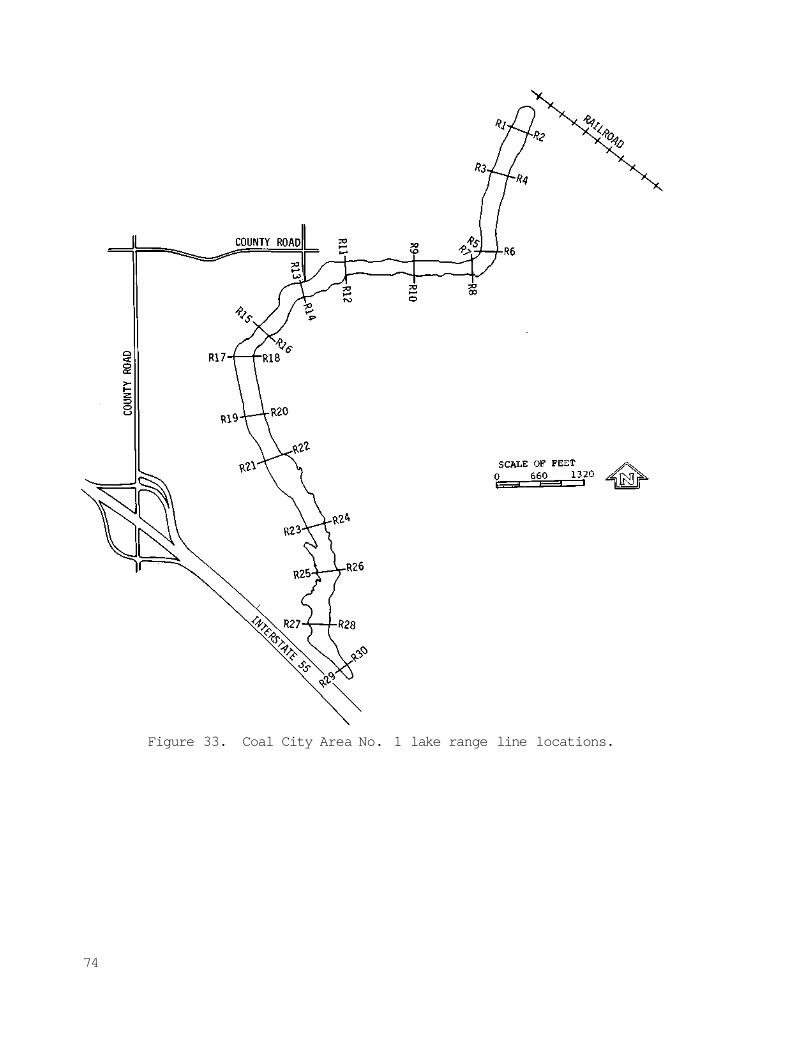
Figure 33. Coal City Area No. 1 lake range line locations.
74
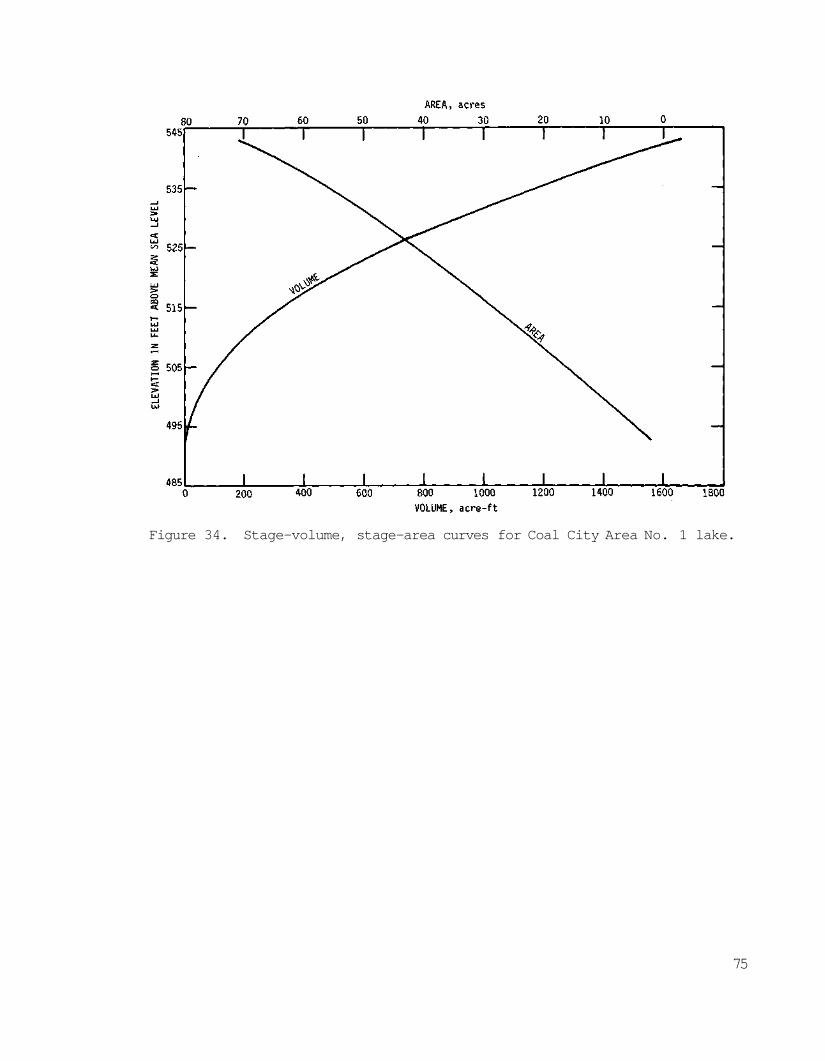
Figure 34. Stage-volume, stage-area curves for Coal City Area No. 1 lake.
75
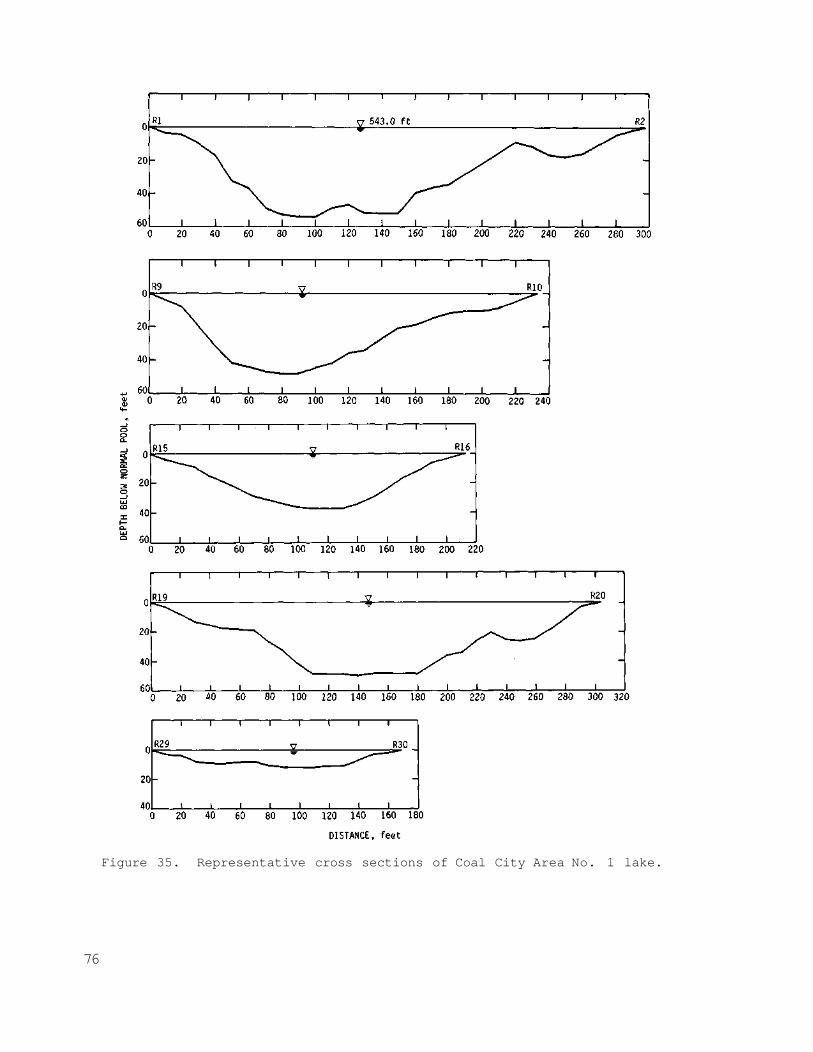
Figure 35. Representative cross sections of Coal City Area No. 1 lake.
76

Table 35. Chemical Analysis Data, Coal City Area No. 1 Lake
Note: Temperature, ºCelsius; conductivity, µ mhos; Hg, µg/1; all other values except pH, mg/1
77
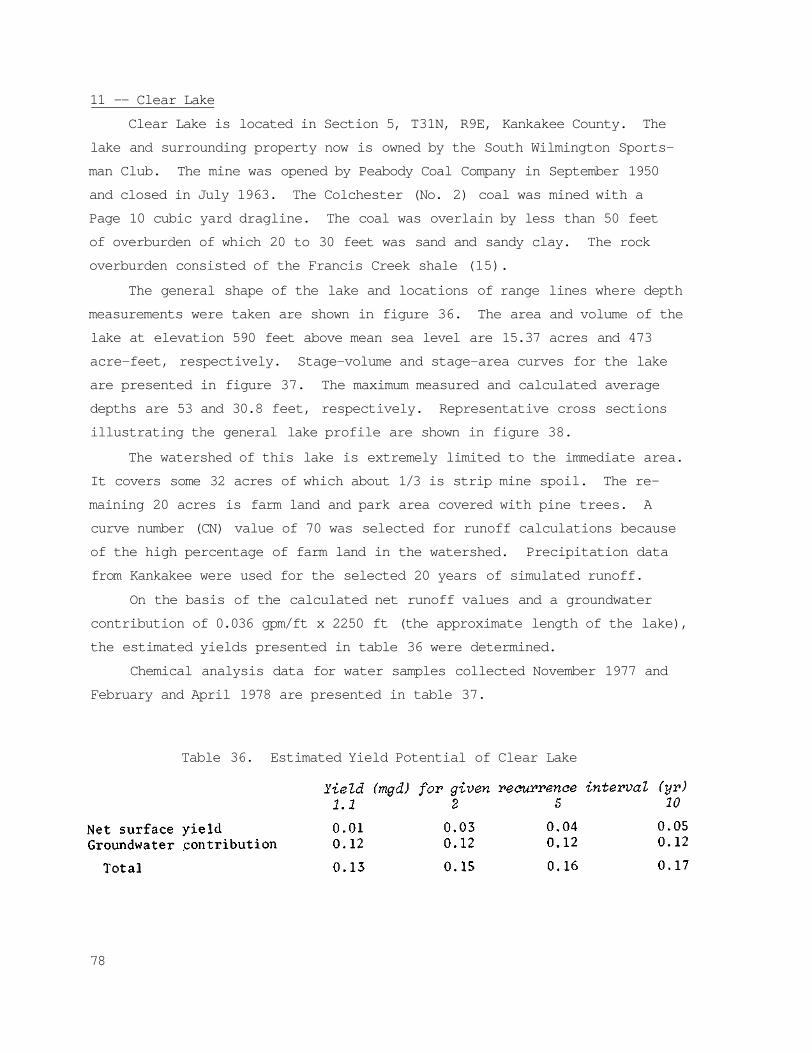
11 -- Clear Lake
Clear Lake is located in Section 5, T31N, R9E, Kankakee County. The
lake and surrounding property now is owned by the South Wilmington Sports
man Club. The mine was opened by Peabody Coal Company in September 1950
and closed in July 1963. The Colchester (No. 2) coal was mined with a
Page 10 cubic yard dragline. The coal was overlain by less than 50 feet
of overburden of which 20 to 30 feet was sand and sandy clay. The rock
overburden consisted of the Francis Creek shale (15).
The general shape of the lake and locations of range lines where depth
measurements were taken are shown in figure 36. The area and volume of the
lake at elevation 590 feet above mean sea level are 15.37 acres and 473
acre-feet, respectively. Stage-volume and stage-area curves for the lake
are presented in figure 37. The maximum measured and calculated average
depths are 53 and 30.8 feet, respectively. Representative cross sections
illustrating the general lake profile are shown in figure 38.
The watershed of this lake is extremely limited to the immediate area.
It covers some 32 acres of which about 1/3 is strip mine spoil. The re
maining 20 acres is farm land and park area covered with pine trees. A
curve number (CN) value of 70 was selected for runoff calculations because
of the high percentage of farm land in the watershed. Precipitation data
from Kankakee were used for the selected 20 years of simulated runoff.
On the basis of the calculated net runoff values and a groundwater
contribution of 0.036 gpm/ft x 2250 ft (the approximate length of the lake),
the estimated yields presented in table 36 were determined.
Chemical analysis data for water samples collected November 1977 and
February and April 1978 are presented in table 37.
Table 36. Estimated Yield Potential of Clear Lake
78
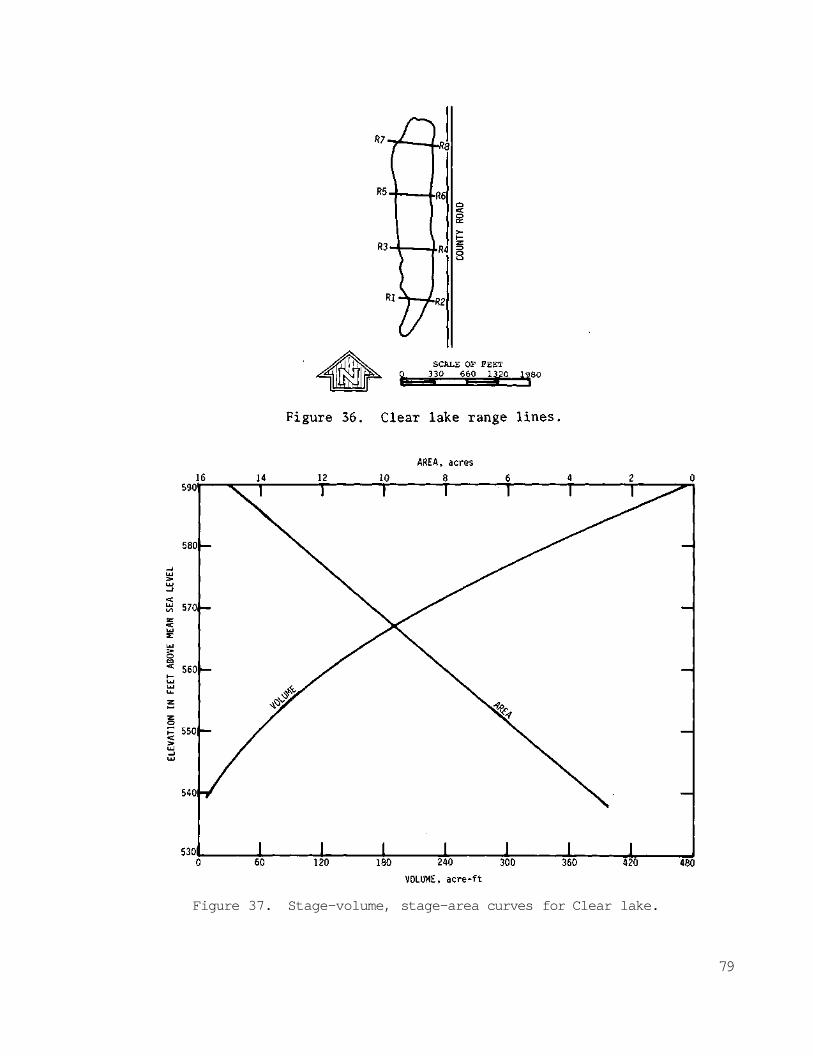
Figure 37. Stage-volume, stage-area curves for Clear lake.
79
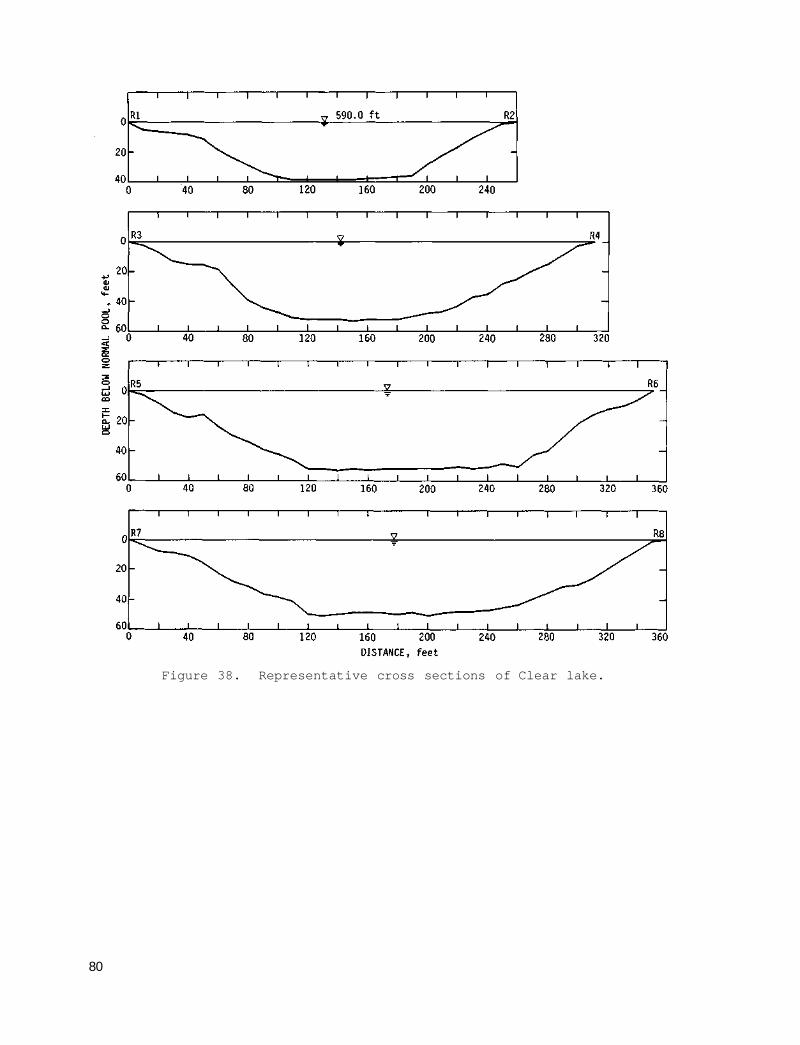
Figure 38. Representative cross sections of Clear lake.
80
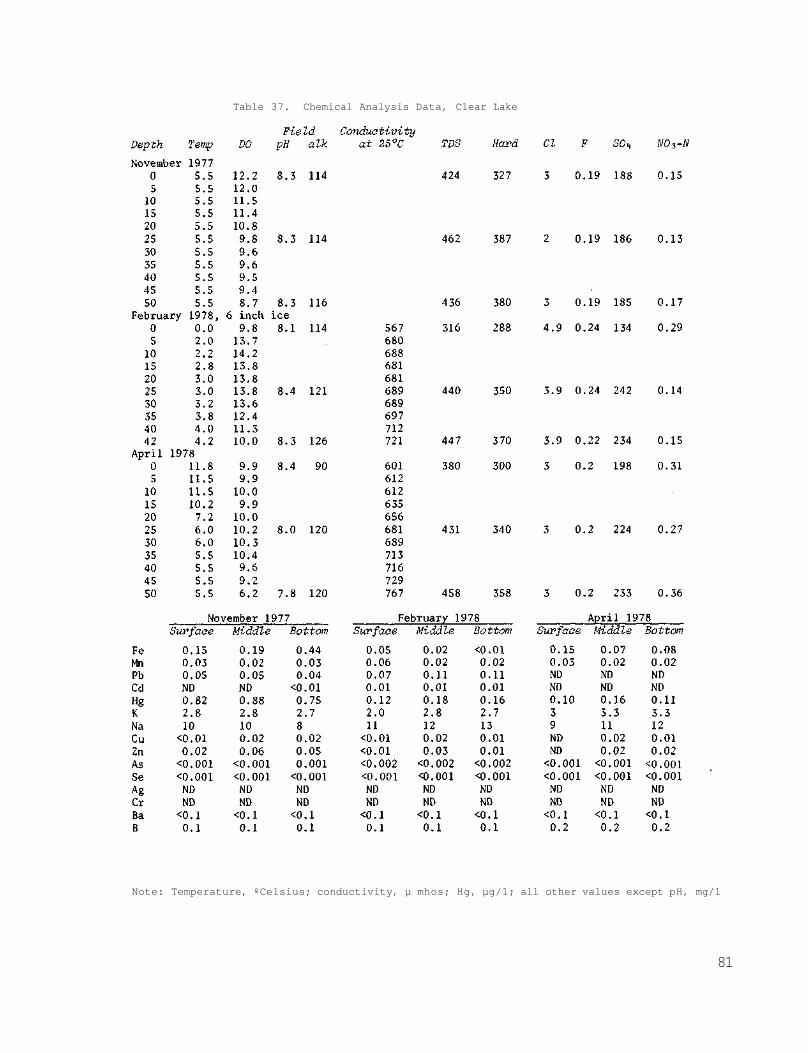
Table 37. Chemical Analysis Data, Clear Lake
Note: Temperature, ºCelsius; conductivity, µ mhos; Hg, µg/1; all other values except pH, mg/1
81
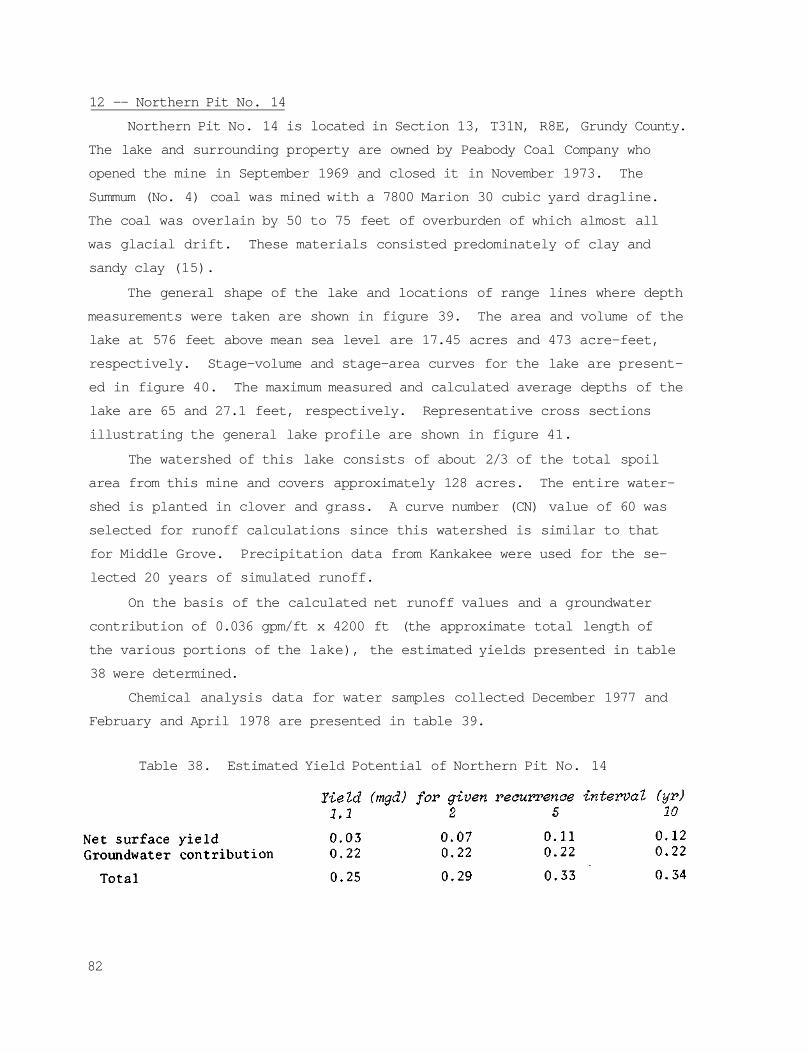
12 -- Northern Pit No. 14
Northern Pit No. 14 is located in Section 13, T31N, R8E, Grundy County.
The lake and surrounding property are owned by Peabody Coal Company who
opened the mine in September 1969 and closed it in November 1973. The
Summum (No. 4) coal was mined with a 7800 Marion 30 cubic yard dragline.
The coal was overlain by 50 to 75 feet of overburden of which almost all
was glacial drift. These materials consisted predominately of clay and
sandy clay (15).
The general shape of the lake and locations of range lines where depth
measurements were taken are shown in figure 39. The area and volume of the
lake at 576 feet above mean sea level are 17.45 acres and 473 acre-feet,
respectively. Stage-volume and stage-area curves for the lake are present
ed in figure 40. The maximum measured and calculated average depths of the
lake are 65 and 27.1 feet, respectively. Representative cross sections
illustrating the general lake profile are shown in figure 41.
The watershed of this lake consists of about 2/3 of the total spoil
area from this mine and covers approximately 128 acres. The entire water
shed is planted in clover and grass. A curve number (CN) value of 60 was
selected for runoff calculations since this watershed is similar to that
for Middle Grove. Precipitation data from Kankakee were used for the se
lected 20 years of simulated runoff.
On the basis of the calculated net runoff values and a groundwater
contribution of 0.036 gpm/ft x 4200 ft (the approximate total length of
the various portions of the lake), the estimated yields presented in table
38 were determined.
Chemical analysis data for water samples collected December 1977 and
February and April 1978 are presented in table 39.
Table 38. Estimated Yield Potential of Northern Pit No. 14
82
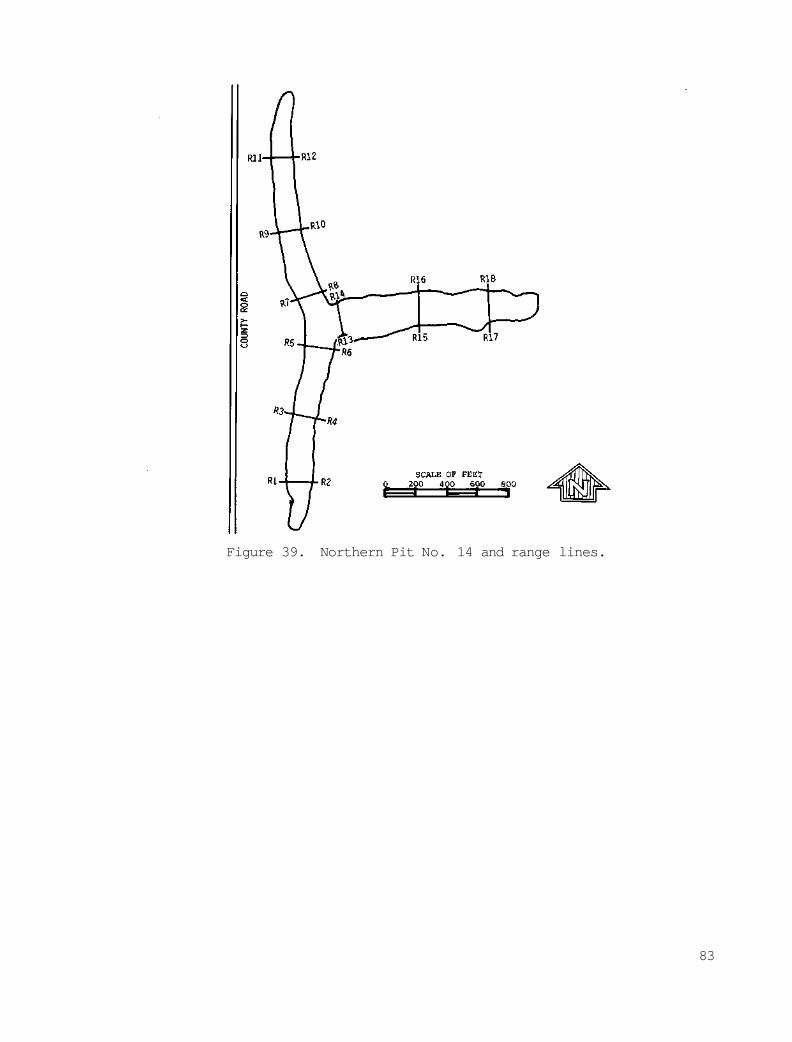
Figure 39. Northern Pit No. 14 and range lines.
83
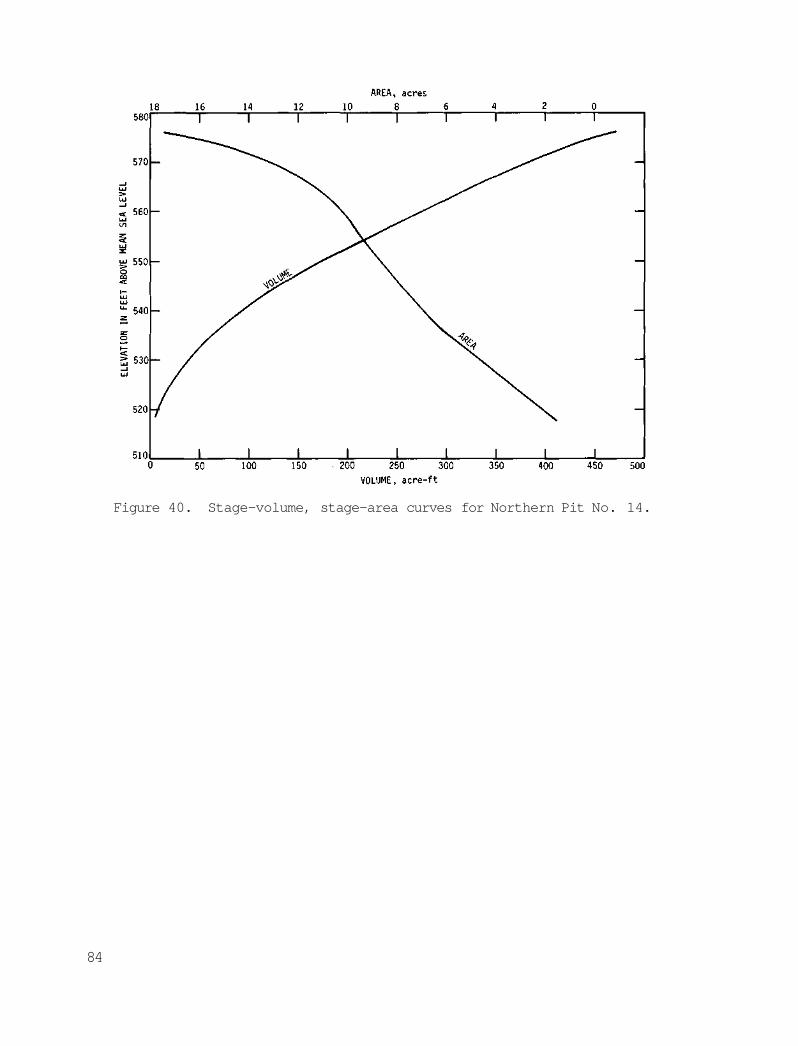
Figure 40. Stage-volume, stage-area curves for Northern Pit No. 14.
84
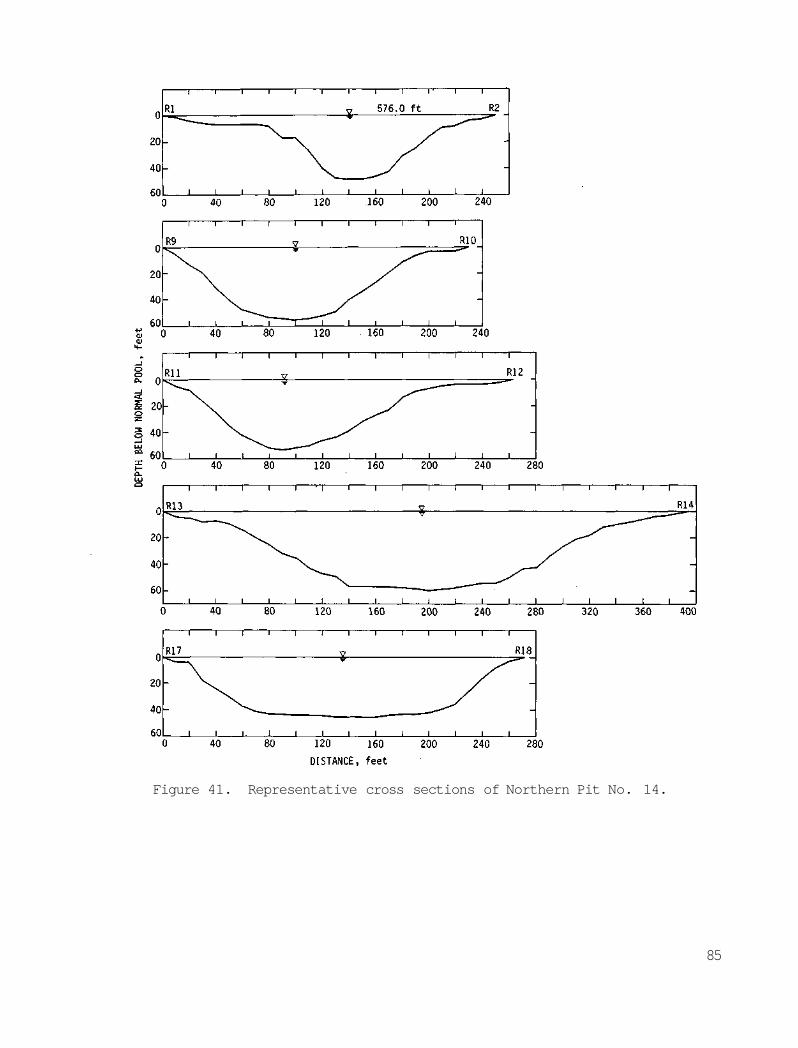
Figure 41. Representative cross sections of Northern Pit No. 14.
85
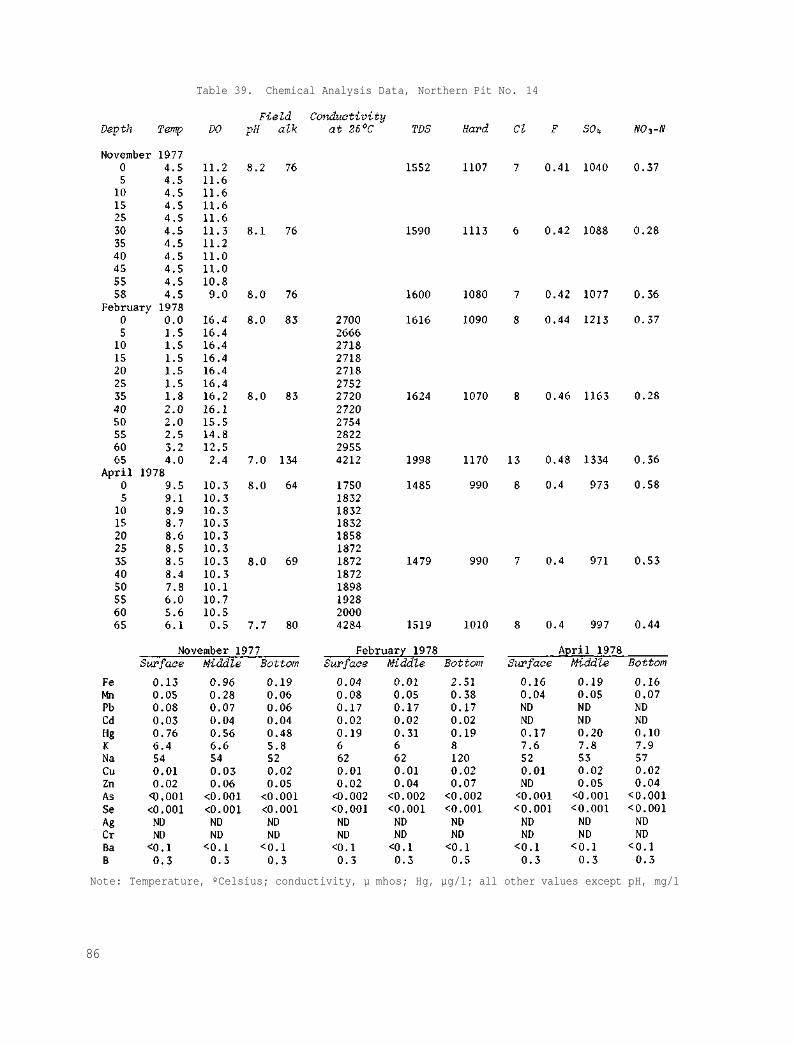
Table 39. Chemical Analysis Data, Northern Pit No. 14
Note: Temperature, ºCelsius; conductivity, µ mhos; Hg, µg/1; all other values except pH, mg/1
86
REFERENCES
1. Reclamation of strip mined land in Illinois. 1972. Pages 1-16 in Illinois Blue Book 1971-1972 (J. W. Lewis, ed.). State of Illinois. 856 pp.
2. Grandt, A. F., and A. L. Lang. 1958. Reclaiming Illinois strip coal land with legumes and grasses. University of Illinois Agricultural Experiment Station Bulletin 628. 64 pp.
3. Simon, J. A., and W. H. Smith. 1968. An evaluation of Illinois coal reserve estimates. Proceedings Illinois Mining Institute 76:57-68.
4. Haynes, R. J., and W. D. Klimstra. 1975. Illinois lands surface mined for coal. Cooperative Wildlife Research Laboratory, Southern Illinois University at Carbondale. 201 pp.
5. Hamilton, David A., and John L. Wilson. 1977. A generic study of strip mining impacts on groundwater resources. Ralph M. Parsons Laboratory for Water Resources and Hydrodynamics Report No. 229.
6. Soil Conservation Service. 1972. National Engineering Handbook, Section 4, Hydrology. U. S. Department of Agriculture, Washington, D. C.
7. Roberts, W. J., and John B. Stall. 1967. Lake evaporation in Illinois. Illinois State Water Survey Report of Investigation 57.
8. Csallany, S. C, W. J. Roberts, and N. G. Towery. April 1969. Illinois P-260 State Water Resources Planning Project Progress Report, Part 1, Appendix A. In Technical Appendix to the Report on Priority and Planning Elements for Developing Illinois Water Resources, Illinois Department of Business and Economic Development, Springfield.
9. Roberts, W. J., S. C. Csallany, and N. G. Towery. 1970. Forecasting water demands and system capabilities. Proceedings, ASCE, v. 96 (SA6): 1349-1360.
10. Bureau of the Budget. 1977. Illinois population projections 1970-2025. Springfield, Illinois.
11. Illinois Environmental Protection Agency. 1972. Water pollution regulations of Illinois. Springfield, Illinois, March 7.
12. National Academy of Sciences and National Academy of Engineering. 1972. Water quality criteria 1972. Report of the Committee on Water Quality Criteria. 594 pp.
13. Smith, W. H., and D. J. Berggren. 1963. Strippable coal reserves of Illinois, Part 5A. Illinois State Geological Survey Circular 348.
14. Smith, W. H. 1958. Strippable coal reserves of Illinois, Part 2. Illinois State Geological Survey Circular 260.
15. Smith, W. H. 1968. Strippable coal reserves of Illinois, Part 6. Illinois State Geological Survey Circular 419.
Printed by authority of the State of Illinois—Ch. 127, IRS, Par. 58 29 (9-78-1000)
87