Preliminary Evaluation – 9/27/2016
8
Preliminary Evaluation – 9/27/2016 1 Ozone National Ambient Air Quality Standard Health Exceedances on September 23, 2016 Exceedance Locations and Levels On Friday, September 23, 2016, there were six (6) exceedances in New Jersey of the new 8-hour average ozone NAAQS of 70 ppb that became effective in December 2015 (see Table 1): Table 1: Ozone NAAQS Exceedances in New Jersey on September 23, 2016 STATION Daily Maximum 8-Hr Average (ppb) Ancora State Hospital 76 Camden Spruce St 78 Clarksboro 77 Colliers Mills 78 Flemington 78 Washington Crossing* 75 * The Washington Crossing station is operated and maintained by EPA as part of the nationwide Clear Air Status and Trends Network (CASTNET). The highest 1-hour average ozone concentration recorded on September 23, 2016, in New Jersey was 93 ppb at Colliers Mills, which is below the 1-hour ozone NAAQS of 120 ppb. The number of days in 2016 on which exceedances of the new 8-hour ozone NAAQS of 70 ppb were recorded in New Jersey is twenty-five (25). By the 23nd of September in 2015, there were a total of twenty (20) days on which ozone exceedances were measured in New Jersey (based on the former 75 ppb NAAQS of 2008), and there were three (3) days by this same date in 2014. There is a group of monitoring stations in designated counties of five (5) states, New York, Connecticut, Pennsylvania, Delaware and Maryland, that are included in New Jersey’s ozone nonattainment areas. From this group of stations in the neighboring states, there were eleven (11) exceedances of the new 8- hour ozone NAAQS of 70 ppb recorded on Friday, September 23, 2016 (see Table 2):
Transcript of Preliminary Evaluation – 9/27/2016

Preliminary Evaluation – 9/27/2016
1
Ozone National Ambient Air Quality Standard Health Exceedances on September 23, 2016 Exceedance Locations and Levels On Friday, September 23, 2016, there were six (6) exceedances in New Jersey of the new 8-hour average ozone NAAQS of 70 ppb that became effective in December 2015 (see Table 1):
Table 1: Ozone NAAQS Exceedances in New Jersey on September 23, 2016
STATION Daily Maximum 8-Hr Average (ppb)
Ancora State Hospital 76 Camden Spruce St 78 Clarksboro 77 Colliers Mills 78 Flemington 78 Washington Crossing* 75
* The Washington Crossing station is operated and maintained by EPA as part of the nationwide Clear Air Status and Trends Network (CASTNET).
The highest 1-hour average ozone concentration recorded on September 23, 2016, in New Jersey was 93 ppb at Colliers Mills, which is below the 1-hour ozone NAAQS of 120 ppb. The number of days in 2016 on which exceedances of the new 8-hour ozone NAAQS of 70 ppb were recorded in New Jersey is twenty-five (25). By the 23nd of September in 2015, there were a total of twenty (20) days on which ozone exceedances were measured in New Jersey (based on the former 75 ppb NAAQS of 2008), and there were three (3) days by this same date in 2014. There is a group of monitoring stations in designated counties of five (5) states, New York, Connecticut, Pennsylvania, Delaware and Maryland, that are included in New Jersey’s ozone nonattainment areas. From this group of stations in the neighboring states, there were eleven (11) exceedances of the new 8-hour ozone NAAQS of 70 ppb recorded on Friday, September 23, 2016 (see Table 2):
Preliminary Evaluation – 9/27/2016
2
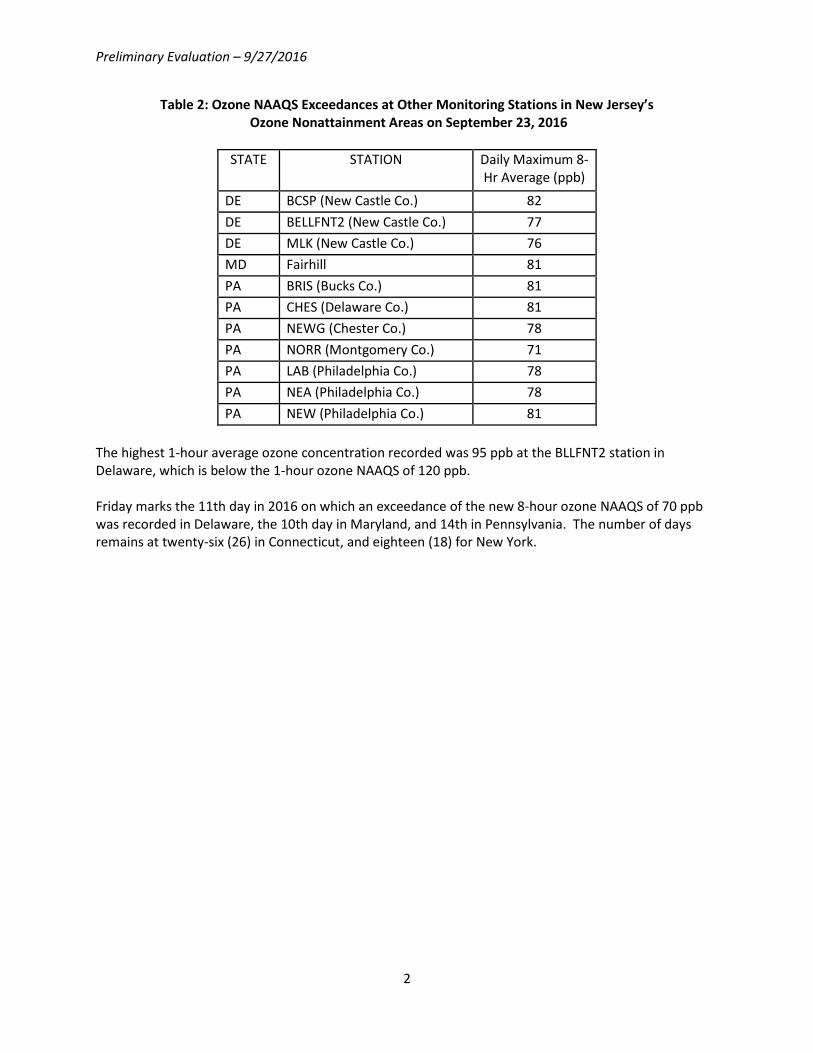
Table 2: Ozone NAAQS Exceedances at Other Monitoring Stations in New Jersey’s Ozone Nonattainment Areas on September 23, 2016
STATE STATION Daily Maximum 8-
Hr Average (ppb)
DE BCSP (New Castle Co.) 82 DE BELLFNT2 (New Castle Co.) 77 DE MLK (New Castle Co.) 76 MD Fairhill 81 PA BRIS (Bucks Co.) 81 PA CHES (Delaware Co.) 81 PA NEWG (Chester Co.) 78 PA NORR (Montgomery Co.) 71 PA LAB (Philadelphia Co.) 78 PA NEA (Philadelphia Co.) 78 PA NEW (Philadelphia Co.) 81
The highest 1-hour average ozone concentration recorded was 95 ppb at the BLLFNT2 station in Delaware, which is below the 1-hour ozone NAAQS of 120 ppb. Friday marks the 11th day in 2016 on which an exceedance of the new 8-hour ozone NAAQS of 70 ppb was recorded in Delaware, the 10th day in Maryland, and 14th in Pennsylvania. The number of days remains at twenty-six (26) in Connecticut, and eighteen (18) for New York.
Preliminary Evaluation – 9/27/2016
3
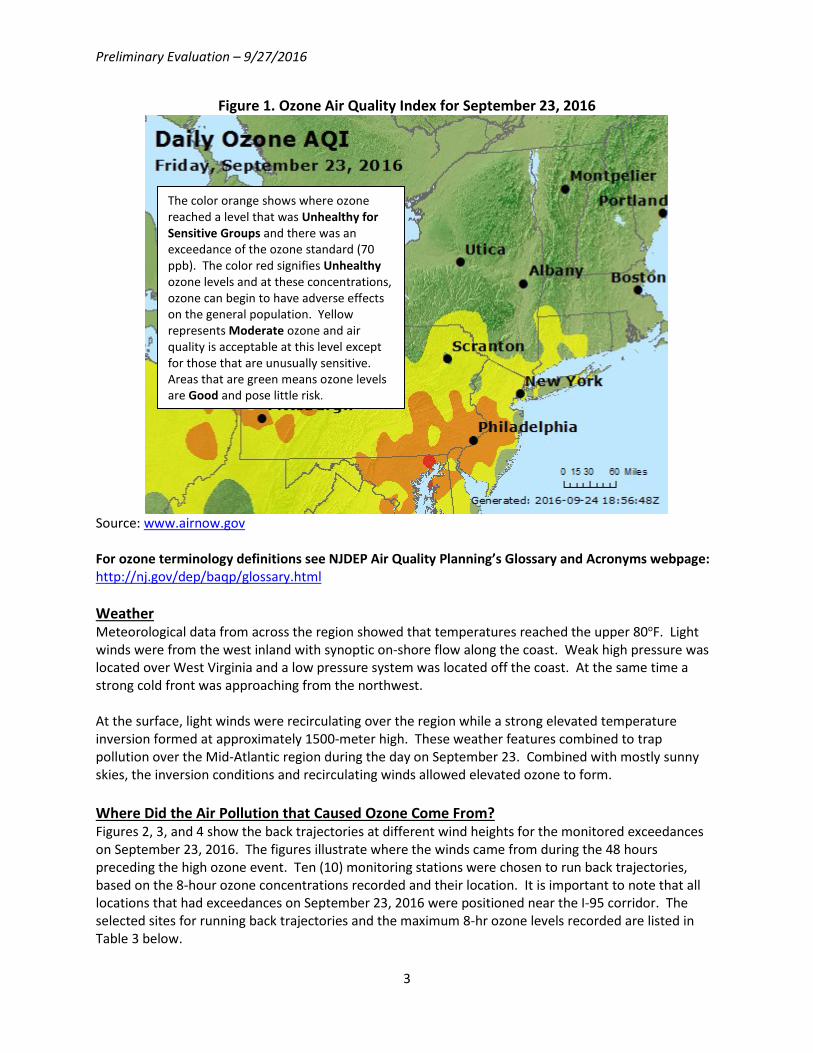
Figure 1. Ozone Air Quality Index for September 23, 2016
Source: www.airnow.gov For ozone terminology definitions see NJDEP Air Quality Planning’s Glossary and Acronyms webpage: http://nj.gov/dep/baqp/glossary.html
Weather Meteorological data from across the region showed that temperatures reached the upper 80oF. Light winds were from the west inland with synoptic on-shore flow along the coast. Weak high pressure was located over West Virginia and a low pressure system was located off the coast. At the same time a strong cold front was approaching from the northwest. At the surface, light winds were recirculating over the region while a strong elevated temperature inversion formed at approximately 1500-meter high. These weather features combined to trap pollution over the Mid-Atlantic region during the day on September 23. Combined with mostly sunny skies, the inversion conditions and recirculating winds allowed elevated ozone to form. Where Did the Air Pollution that Caused Ozone Come From? Figures 2, 3, and 4 show the back trajectories at different wind heights for the monitored exceedances on September 23, 2016. The figures illustrate where the winds came from during the 48 hours preceding the high ozone event. Ten (10) monitoring stations were chosen to run back trajectories, based on the 8-hour ozone concentrations recorded and their location. It is important to note that all locations that had exceedances on September 23, 2016 were positioned near the I-95 corridor. The selected sites for running back trajectories and the maximum 8-hr ozone levels recorded are listed in Table 3 below.
The color orange shows where ozone reached a level that was Unhealthy for Sensitive Groups and there was an exceedance of the ozone standard (70 ppb). The color red signifies Unhealthy ozone levels and at these concentrations, ozone can begin to have adverse effects on the general population. Yellow represents Moderate ozone and air quality is acceptable at this level except for those that are unusually sensitive. Areas that are green means ozone levels are Good and pose little risk.

Preliminary Evaluation – 9/27/2016
4
Table 3. Monitoring Stations with 8-hr Ozone Exceedances that
Were Selected to Run 48-hr Back Trajectories
Agency Site Name Maximum 8-hr Ozone Conc. (ppb)
DE BCSP 82 DE BELLFNT2 77 MD Fairhill 81 NJ Ancora State Hospital 76 NJ Camden Spruce Street 78 NJ Clarksboro 79 NJ Washington Crossing 75 NJ Flemington 78 PA CHES (Delaware Co.) 81 PA NEWG (Chester Co.) 81
The low level wind (Figure 2) originated to the northeast of New Jersey, traveled through the Garden State and recirculated over portions of New Jersey and Eastern Pennsylvania. These winds picked up air contaminant emissions generated by cars, trucks, and industry along the I-95 corridor from Washington DC up to the Philadelphia metropolitan area. The mid-level wind (Figure 3) originated over the Atlantic Ocean and recirculated over Maryland and Pennsylvania, before heading towards the exceedance monitors. Recirculating winds allowed polluted air to be picked up from the previous day to accumulate and then mix with local emissions from cars, trucks, and industry along the I-95 corridor and where the monitors are located. Higher level wind (Figure 4) traveled southeast across New Jersey and circulated over Pennsylvania. However, do to the presence of an elevated inversion between 1000 and 1500 m, it is unlikely that winds at the higher level would have contributed to the elevated ozone. Recirculating winds trapped below an elevated inversion allowed regional pollution to build up over a period of two days which resulted in the elevated ozone. Figure 5 illustrates the ozone exceedances recorded in the Mid-Atlantic region on September 22, 2016, the day before the high ozone event in our area.

Preliminary Evaluation – 9/27/2016
5
Figure 2. 48-hour Back Trajectories for September 23, 2016 at 10 meters
Wind trajectories look backwards 48 hours to show what direction the wind was blowing during that time frame. The low level wind (10 meter) traveled south and recirculated over eastern Pennsylvania and New Jersey, picking up air contaminant emissions from cars, trucks, and industry.

Preliminary Evaluation – 9/27/2016
6
Figure 3. 48-hour Back Trajectories for September 23, 2016 at 500 meters
Wind trajectories look backwards 48 hours to show what direction the wind was blowing during that time frame. The mid-level wind (500 meter), traveled west across New Jersey and recirculated over Maryland and Pennsylvania picking up air contaminant emissions from cars, trucks, and industry.

Preliminary Evaluation – 9/27/2016
7
Figure 4. 48-hour Back Trajectories for September 23, 2016 at 1500 meters
Wind trajectories look backwards 48 hours to show what direction the wind was blowing during that time frame. The higher level wind (1500 meter) traveled west across New Jersey and recirculated over Pennsylvania.

Preliminary Evaluation – 9/27/2016
8
Figure 5. Ozone Air Quality Index for September 22, 2016
Source: www.airnow.gov For ozone terminology definitions see NJDEP Air Quality Planning’s Glossary and Acronyms webpage: http://nj.gov/dep/baqp/glossary.html
How is Smog Created? Ground-level ozone, also known as smog, is an air pollutant known to cause a number of health effects and negatively impact air quality and the environment in the state of New Jersey. Smog is formed when oxides of nitrogen (NOx) and volatile organic compounds (VOCs) react in the presence of sunlight. Smog can irritate any set of lungs, but those with lung-related deficiencies should take extra precautions on bad ozone days. Find Out About Air Quality Every Day The “What's Your Air Quality Today?” page at http://www.nj.gov/dep/cleanairnj/ tells you how to sign up to receive notifications and find out when your local air has reached unhealthy ozone levels.
The color orange shows where ozone reached a level that was Unhealthy for Sensitive Groups and there was an exceedance of the ozone standard (70 ppb). The color red signifies Unhealthy ozone levels and at these concentrations, ozone can begin to have adverse effects on the general population. Yellow represents Moderate ozone and air quality is acceptable at this level except for those that are unusually sensitive. Areas that are green means ozone levels are Good and pose little risk.