
Preliminary Estimate of Effective Wayne A. Pettyjohn Andrew
35
.1 Preliminary Estimate of Effective Ground-Water Recharge Rates in Central Oklahoma by Wayne A. Pettyjohn and Andrew Miller Department of Geology Oklahoma State University Stillwater, OK 74078 Presented To The Oklahoma Water Resources Board Oklahoma City, OK -June 1982-
Transcript of Preliminary Estimate of Effective Wayne A. Pettyjohn Andrew
.1
Preliminary Estimate of EffectiveGround-Water Recharge Rates in Central
Oklahoma
by
Wayne A. Pettyjohn
andAndrew Miller
Department of GeologyOklahoma State University
Stillwater, OK 74078
Presented To The
Oklahoma Water Resources BoardOklahoma City, OK
-June 1982-

c
(
(
ABSTRACT
:Ground-water recharge rates for the unconfined part of the Garber
Wellington Aquifer in central Oklahoma were estimated for water years 1973,
1976, 1978, and 1979 by means of a computerized stream hydrograph separation
technique. Although many factors influence recharge rates, it would appear
that, on the average, about 100,000 gallons per day per square mile. or
about 2.11 inches, of water infiltrates the aquifer and then finds its way
to a nearby stream.
Preli1:J.inary Estinate of Effective Ground-Hater
Recharge Rates in Central Oklahoma
by
Wayne A. Pettyjohn
and
Andrew Hiller
Department of Geology
Oklahoma State University
Stilhlater. OK
Introduction
The Oklahoma Hater Resources Board is investigating the Garber-Uellington
aquifer system, uhich is the tlajor source of l1ater supply for nunicipalities
and industries in Central Oklahona. This report is a snall part of the
overall project and its purpose is to estinate the rate at which precipitation
infiltrates and reaches the water table (ground-water recharge rate) in the
unconfined part of the aquifer. The analysis ~s based on a conputer prograw
that separates strean flow into its two najor components-surface runoff and
ground-uater runoff.
General Features of the Area
The study area. which includes the outcropping rocks of the
Garber-Wellington aquifer. lies iiCentral Oklahoma between 96 0 and
longitude (plate 1). The region is characterized by a gently eastllard sloping
surface or rolling grass covered prairie and 1011 wooded hills. It includes
about 23.000 Square niles. although the drainage area is considerably larger.
Annual precipitation in Oklahona ranges fror.l I.lore than 56 inches in the
1
2
southeast to less than 14 ir~ches in the 1;lestern part or t:~e panhandle (fig
1). The average annual precipitation rate is about 32 inches. The greatest
@Dount of precipitation generally oCCurs in i~y while J~nuary is typically the
driest ::.onth.
Although Oklahona is subhumid, annual lake evaporation ranges fran about
46 inches in the northeast to more than S6 inches in the north~·,est (fig. 2).
Since evaporation exceeds precipitation throughout ~ost of the state. ouch of
the tine there is a soil-~oisture deficiency and ground-water recharge is not
great.
Average annual runoff in Oklahoma ranges fran less than 0.2 inches in the
panhandle to ::.ore than 20 inches in the extreme southeast (fig. 3). Runoff is
closely related to precipitation and evapotransipiration.
Geology of the Area
In Central Oklahoma bedrock dips 30 to 40 feet per nile westward toward
the Anadarl,o 3asin. Cropping out through much of this area (plate 1) is the
Garber-Uellington aquifer, which consists of about 900 feet of interbedded
sandstone, siltstone, and shale representing delta deposits. The
Garber-Uellington is Early Permian in age.
The sediments were deposited by westerly flowing streams, which had their
major axis at about the sane latitude as Oklahoma City. As a result, the
ratio of sandstone to shale reportedly decreases both north"ard and southward
froD this area. Furthermore, there i-s also a dO'l;mdip or 'ilcst'iJard decrease in
grain size fran predoninantly sandstone to predoQinantly shale.
The aquifer consists of channel sandstone deposits that are interfingered
~lith shale units. Due to the nature of the deposits, obrupt changes in
lithology are cowDon. The ~axiwu~ thickness of anyone sandstone unit ~s

?'---J44.--J-~---148
20
'- Figure 1. Average annual precipitation in Oklahoma, in inches for the period1931-1960 (Modified from Oklahoma Water Resources Atlas, 1976).
10 •'" t!!
••I 40 eoI , !
"IllS••o 100
I

56 60
. \
48
to 0 20 40 ao 10 100'..... I '" , •
MILES
Figure 2. Average annual lake evaporation, in inches for the period 1946-1955(Modified from Oklahoma Water Resources Atlas, 1976).

1f-----'
.. .,,, t!! ••o .. ..
! , !
MILU••o 100
o
Figure 3. Average annual runoff, in inches for the period 1931-1960 (Modified forOklahoma Water Resources Atlas, 1976).

6
about 40 feet, tut they generally r~n6e betueen 5 ~nd 10 feet. Shale layers,
"iltich avera~e a'j)out 5 feet in thickness, h2.ve a laaxi~um t"hicl~ness of about 50
feet. Sandstone nakes up about half of the aquifer. although this lithology
ranges froU! about 30 to 75 percent of the total unit. The r:la::iJ:',um m;;ount of
sandstone relative to shale is in the vicinity of Oklahoma City. The
sandstone is typically fine grained, croisbedded, and reddish brown (see
figures 4-17). Locally zones of ~uddy conglowerates and coarse-grnined sand
are present.
In the western part of the study area the Garber-Hellington is confined
and is covered by the Hennessey Group, which is also Early Permian in age. In
these areas rectarge Dust find its way through the shale, ni~rate do~vndip or
leak frow adjacent units •. The Hennessey Group consists largely of shale and
siltstone, with so~e thin layer of very fine-3rained sandstone. In sOwe ~rea5
both the Garber-1!ellington end I::ennessey Group are overlain by allL:viUIU end
terrace deposits. In general, streams fed by discharge fron the
Garber-Wellington are perennial, whereas streams draining the Hennessey Group
flow only during and a short while after precipitation.
The Garber Sandstone and Hellington FOIT:lation have si::rilar \vater-bearing
properties, are hydrologically interconnected, and are considered as'a single
aquifer. Hater-table conditions exist in oL:tcrop areas and reportedly in the
upper 200 feet of the aquifer. At depths greater then 200 feet and bene~th
the Hennessey Group, the aquifer is seui-confined or confined. Transuissivity
values obtained frou aquifer tests range from 3.000 to 7,000 gallons per day
per foot, while specific capacities average about 1.3 gallons per uinute per
foot of dra"do,m. Hell yields, "hich range fron 70 to 475 gallons per minute,
average 245.
The deeper parts of the Garber-Helliu::;ton aquifer contaia uater \lith a
7
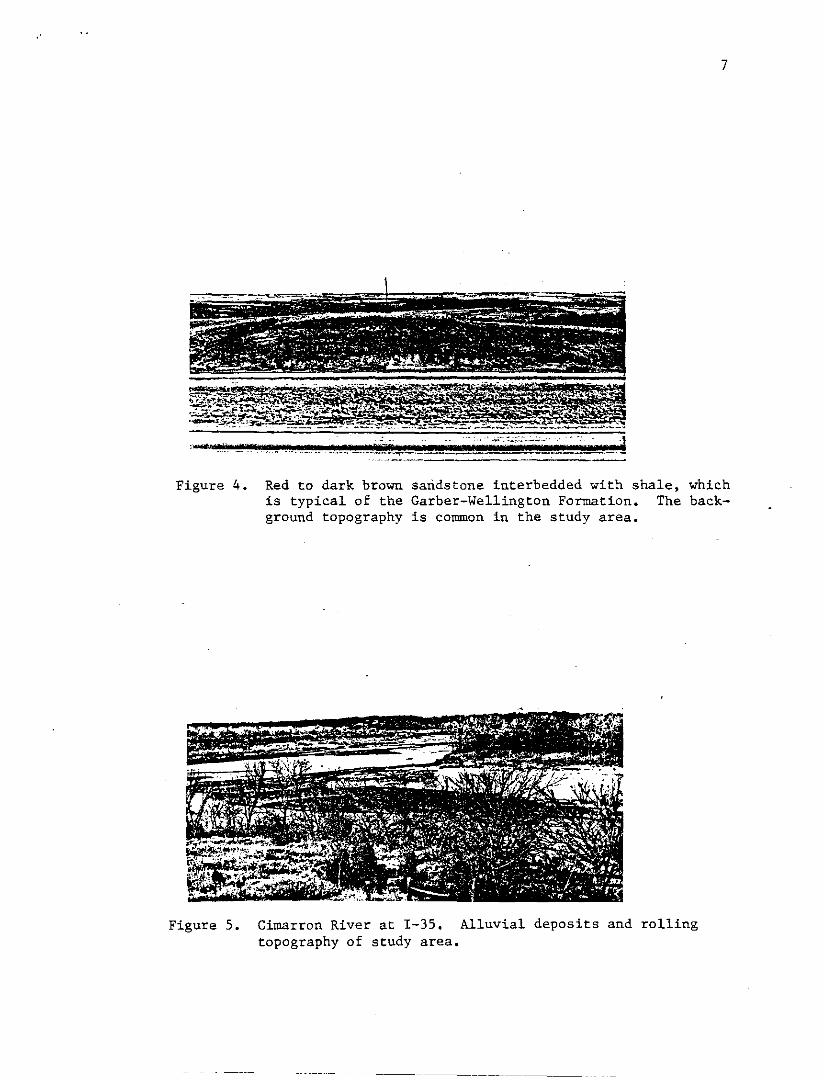
Figure 4. Red to dark brown sandstone interbedded with shale, whichis typical of the Garber-Wellington Formation. The background topography is common in the study area.
Figure 5. Cimarron River at 1-35. Alluvial deposits and rollingtopography of study area.
8
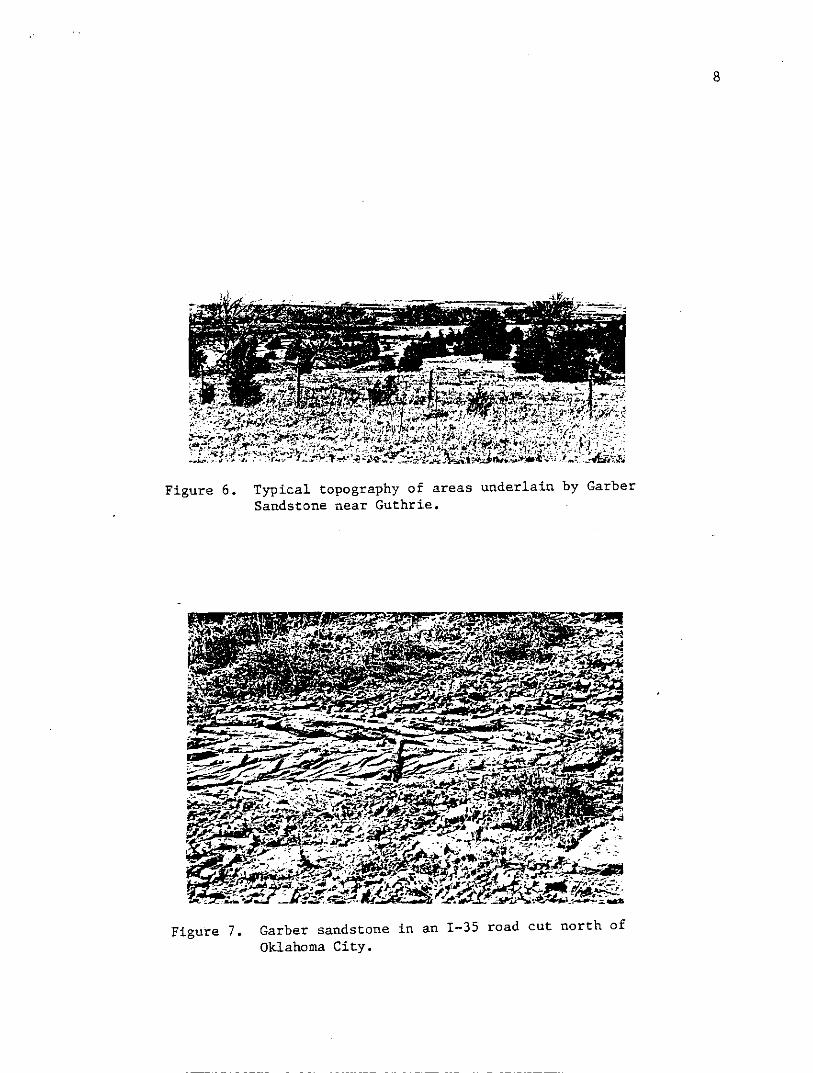
Figure 6. Typical topography of areas underlain by GarberSandstone near Guthrie.
Figure 7. Garber sandstone in an 1-35 road cut north ofOklahoma City.

9
- -".. Y6,...'as f
Figure 8. Massive lenses of Garber sandstone in a road cut near1-35 north of Oklahoma City.
Figure 9. Rocks typical of Garber-Wellington Formation. Crossbedded sandstone above shale. Road cut on 1-35 northof Oklahoma City.

10
Figure 10. Interbedded sandstoneWellington Formation.City on 1-35.
and shale of the GarberRoad cut north of Oklahoma
Figure 11. Stream northeast of Oklahoma City cutting throughcollovium on top of the Garber-Wellington.
11
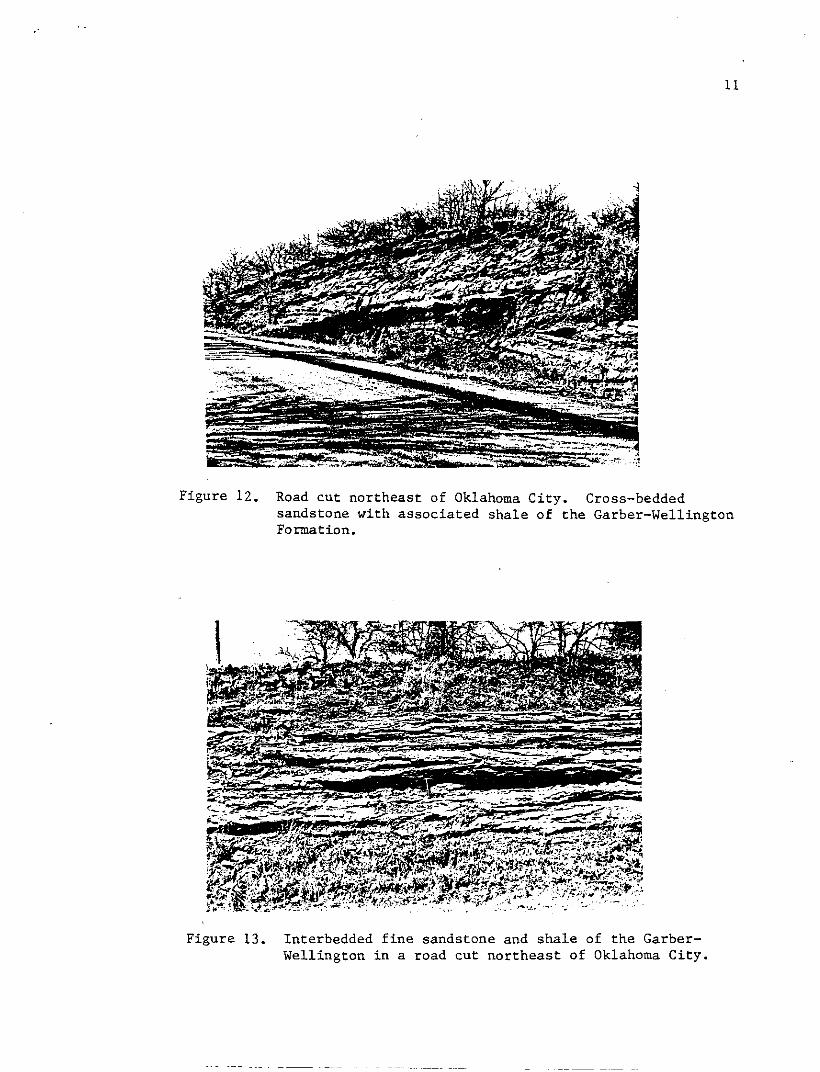
Figure 12. Road cut northeast of Oklahoma City. Cross-beddedsandstone with associated shale of the Garber-WellingtonFormation.
Figure 13. Interbedded fine sandstone and shale of the GarberWellington in a road cut northeast of Oklahoma City.
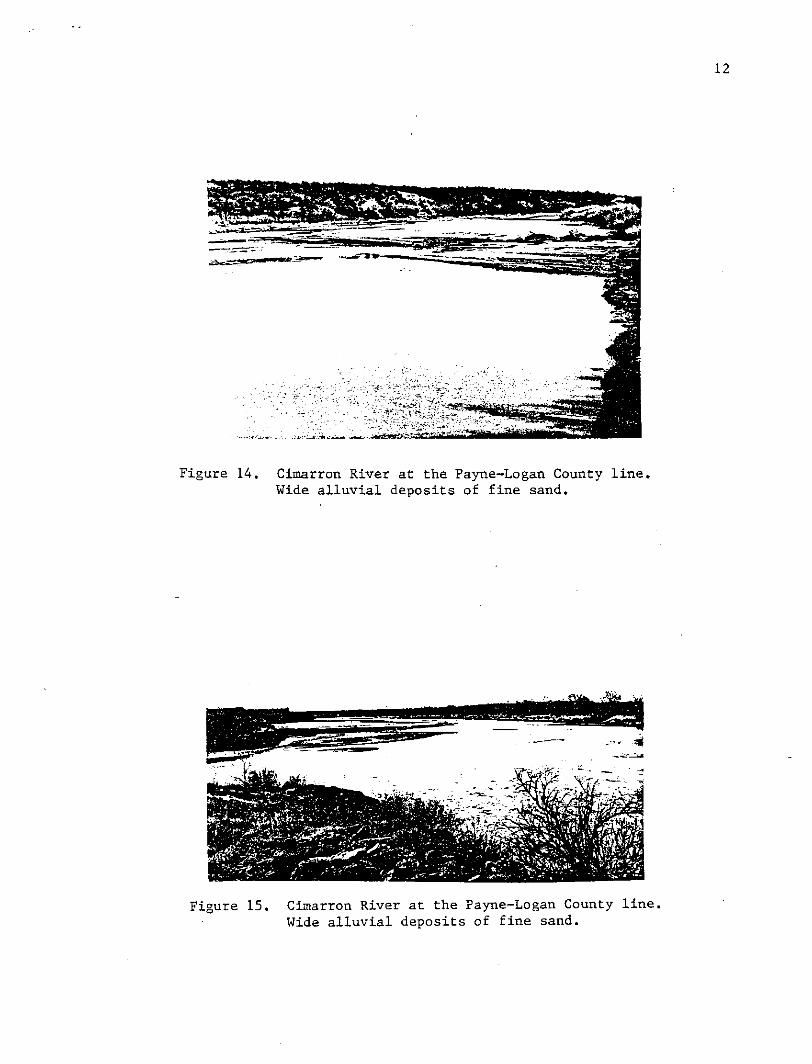
Figure 14. Cimarron River at the Payne-Logan County line.Wide alluvial deposits of fine sand.
Figure 15. Cimarron River at the Payne-Logan County line.Wide alluvial deposits of fine sand.
12

Figure 16. Wildhorse Creek at Highway 33 where it cuts throughcolluvium that overlie the Garber-Wellington.
Figure 17. Perkins Terrace, one mile west of Perkins. Sanddunes consisting of fine, permeable sand overlyingthe Garber-Wellington.
13
14
dissolveci soli~s concentration l~ 2zces~ of 1,000 ~~/l. ~arG~ess 15 ~reates:
i~ t~~ upper parts or the 2quifer, and tae concentration oE sulf~te~ c~lori~e)
anc. dissolveti solids increase ";,ith depth. Overall, the quality of the ~later
is considered good for an area of li~ited rainfall.
Floodplain deposits e:<.:ert a 7:i.ajor influence on stream flou it: the region.
Ti.12se deposits are conTIonly sanci, several to several tens of feet thid::., alia
. . " .lI: ':nc. tn 2nd. length (plate ll,
deposits ~re hydrologically connectec to adjacent scnd dunes an0 for2
e~-~te;-~Slve, perue3Dle hyd.rologic system. In these areas there.. is 1i::e1y to De
but little surface runoff since ncst or the precipitation qDickl~r infilt=ates.
~:.lluviQ.l deposits influznce strean. ciisctar.:;e for t",;-;o :'J.[ljor rE2.SCns.
?irst t:::.ey are ::iajoI' reci1ar;;e areas. Secanely t.hey tend to ca:':lp river staze
fluctu~tiOGS oince part of tte stresnflou euring periods of =isi~S stege
iiJ.filt::atz the o2.lii:s and teZlporarily rer.Hlin t:lere 2.5 D<:fil: stora:;e ur:.til tt:e
sta:;c
:letnccs of Invest iS2.tion
T:1is preliEir-.ary esti::.ate or i1aturo.l rech.:.rge to the Garber-~;ellir..,;ton
~q~ifer is 0&sed on the 2ssurption taat the precipitation th~t intiltz2tes ~nJ
re&c~es the wa~er table in the zone of intensive circulatio~ eventually
dischcr~es to str2ans. It is this ;;rounu.-uater runoff ... ;..., .......1.. •• G;. I.. causes n streau to
flow during dry periods. A muc:l lsrgeT percentsJe ~f precipitatic~ that
infilt~ates is taken up as soil 20isture and eventually returns to the
ztuosp~ere by evaporution transpiration. i.':,. very sr::all .1iC!Ol,;.r.t of ,:.:.:.ter
ru:w££ •
"(i)~~p
"C·)ro..."rtroto
.~
,".,....,....
">-,
'"o~
"...l.,_'::
t-il'!oU
o"j
fD..... :r"r,)'!
no
".'ro~l
n:>
(r
rJo,".III
","'I
'"'"r1,C,C:I...or::~1p..
JCi'"ro'I
to
'"o..."G:i
'"U<Dne,r.:cnfD
o....:\
~
"",".pC/,~
'"n>-,t~·
h;'"ro'",".rtf~e,e,'I'~'
n~'.
c"•
o'u'".'o0'....nro,..'"p0-'
'"on...r.:'"o-l::.;~...."ro
'"Oi,
'"nr'....to
...ro,....
"'"r,('.
'"o...""d,....t,nro!J
":::1...ot'~l
,."o~'t,
"(,l
o....>-,
P'P
'"vm""~J
"on
'"<Dr'l.
'"C',
o'.....::;
rt.'o
o• I
n':'J,'I"j
<D<D,
,<fD[oJ.,'"oh1
rJo...Ue'0-'
'0...fDn....~u
I"'
"ton'".a~j
c'
'"
....~
Ii.'e,",....V)-.IW
C"fT'r,
n,.,,....nr:,....'"'"roo.
"'"n::"e'..."ro"'","ro'"~~....,....,....(1'
ro,....o.,ro"...;:,~
grL}
..-.CD
".....;;
'""'IC';"
~~,'
f')r'
vro0-'0).,"
~~
a,-;L!
'",....'U.,fDn....
"01....'"'"n....orJ>-ho,....c"o:~
ro(.l.
CJ'...,
".;'CDn
.....;
""'1~)
",".::J
1-".,ronf·,c"
"oh1
.,p
"(i),.,
Ii'!,.,o
":Jc:' ,, \r)n(,)I-~
...I:-~rJoct,H,
•
"Jo...m
i~,j.tj,....m
....1"1i
rio... ,'ro...roii'l~l
e,
co'
'"co::J
n.,.,o
o...,-,•...~...mco
...~~m~)
""o'"
,.,,.. ~(~
,....o::J
G·!
ro
'"n'CJ...filn....
"'rJ...."I,'n1-"nrJ
.~
rt·nro
~
r",-,c..o
:,"'!~ )c,
r'l:Jm1-1".to,',fO(>r-,L
o~
'"I'j'q
"p:.1t:11__'
q
":1r~·
l-il
~;.iiI(~.
I..•·
~-~r,"<:fl0-'
~n::)~
oroo'"',:J...o~c"(:).
'"I"'"r:.'
"5corot
notj'd
""r-)~','
0-'(1)
t"j
t"
'"C'I··..("I'
C,
r/p
", ."
'"lor
ot:pt·!fil•
"''"~,.
l'j
(j.)
rol::lco.,p,....,....
0.,.:
f\"
"nto(;)
{It
....rJt.-}
CDrJt-·;
"Po't--,
o:;,'t-'~j,
or!"L~'
"'",~....,.t·'·.,1
t,',
~~r,
C"
""'""~....p,fl'
(".10
'g'"....".'"-:1
fD,.!fO
rl'..,,>0ronc>pc'
"t;'.'
>-(;
co
~fPC'C,'~_..P
;J
""""....rl\
0-'
c"
[\':::1".I"..",hi,....r-:
"r1"ro
(.::.,....1-;.h)p.,ro..,n
"'.,....:',1
"r-o'
""..:p ...
"o,....o
(,.'
",~
o'h
n......'rot:;-'
"C.1--"~"j
•',;
"t':"I''''n(.~
t-'
"",.,"-:n:-:)'ro
"Oi,t"ll
"nr'..
o1-:\
r~
(:,,"t~
tUu".'""'j~
::",',".~-..,C"
,-tp
"~-)-I"·,.,P ..
,.,~\)
.. ~
c-.,".1·;\h)
'-0'0
Do::1(,)
j- .••
{_1.
"t·';"L"1-"'
".~
H,,,.,.'....co
".t;)
c,'r:It'
I:j'
o
i..:·tjt:·i::!!
Ii'),t
~...",_.,-,
<.c:r<-":'oo1"11
"rs'fil
.-~
FC'"'"rl(j)t"::'J.Dr...,co
>-~'j
tln~;:....c.no
""cor:1-'ri"
'"r.tF;n
p
"(j),".:jn,....o'"m
o,.,.'..,ro...c.-'.....I-;"}
'h(1).,'"t_ln'
'1rort~~
op.
'""t::.tro
'"1-'....p.....rj
cc:'
Uro'"p'o0 ...
."r,'ro'"".tJn'
'"~p,....n""on.
,.l::lrc,,....oop>-,
H
i~'
ro1-10h\
"n"....~
'""ron:-j'
"'!(j'.)
ro
...",tm
'""'"ro
'"n'!,".u·mp.
,"(1)
"fl)1-"~\
~)
"ron.n,""n~..17J<Dp,
("j'
~<.1
'";{film
c'tw~
(i)
:-J
"'"r:,.,"...,"roo-,-n'"(,,~.ro.,"rtro'"p.CD
'"(>
"....C.-
'"p"p~
m...m....l::l
"ii'"c'0'
"r:t"con·o",...fOt-i.r:,~,....
~<':
I'"'co
ncl'0~t-:,r"I-lto0'c"ro•C."
"'"I"'·n'
:;:.-'t,
'";Jon
u·ro(1)::J
'CJt'-lo~rol::lt) ,
....::
o,'t."ro,.!
:-1illr'8'",.c,
t:j
ot-j
r.~.
".'"HIV
'"too"
""c·;....o;J
nr,"p
'"....v,
~.
p.qo,~
oC,.-,I"'n
"1__',~
"<-:
'"1-"L!....,....","rtoo:.;'c"to
~rn"I~J
"co.,f'-ibQ'
c'~ ..~Cl't:)'ID
ncon
~I"·
,.:"><:m
c,rD'c,prtI····,:c,"nt,riiii
oI-il
o~......o
,-In
::J~
"'"0'ro
"ljr:"'"p"
tPt~
","..'.>-.-.
[J,.!rop,1""
too
u',:c'
"o(0
I"'
""
~j;::.'"·u"..."1-"nr:,~,.,...(0'
mn:-..:~
::J.....ar::ro:l:1,~
'"<:'"rore.
'"r::onro
"'"H,r:c",~..~....::J
"'"I-I·r"p.
'-..:.~
rt·D'Cj
",".~j
(>t~,;(Y.
rop.
(,;1
"or:rJ
"jp;n<D.:
"fOn;:-.1'to...
Gelfil
,,'rJc:,.
m
"p,..pc-:~
>-"
'"-,<0~
<-,'!or:l::l
'"I.,p;nCO.,"r:"o~-ll
t-:.
....c,
"'"c,r.:nCOr., ,
r'o
tD.n<:,.,c"
tDt-rl
",HInrt~,.
~CO
1- ~
r:~lot-hcl,
~_1'-'I·.. •
"'~, .0'
pon8·30-'....'";::..''0".c.-',<
"~....o0..
()..
<D~
"1-'o
>-0
"c'
"tjc.('-,
COc,(>-,r"IJ'IDn·t~'"
'v.::'UCOClct~.~
(..,.or;-:;p
.,~~()
f\i
"'"p"~,~r'o
"ro·u',J
"tonfil
r·'
"f'I'"tilpf1
~'
C.,o
C':,
"'"t,I·'~Jcto
"r"t·'1-:.
"()CO
.,i;:rioH-,1"1
",tJ.'-,c!.,"r::J".
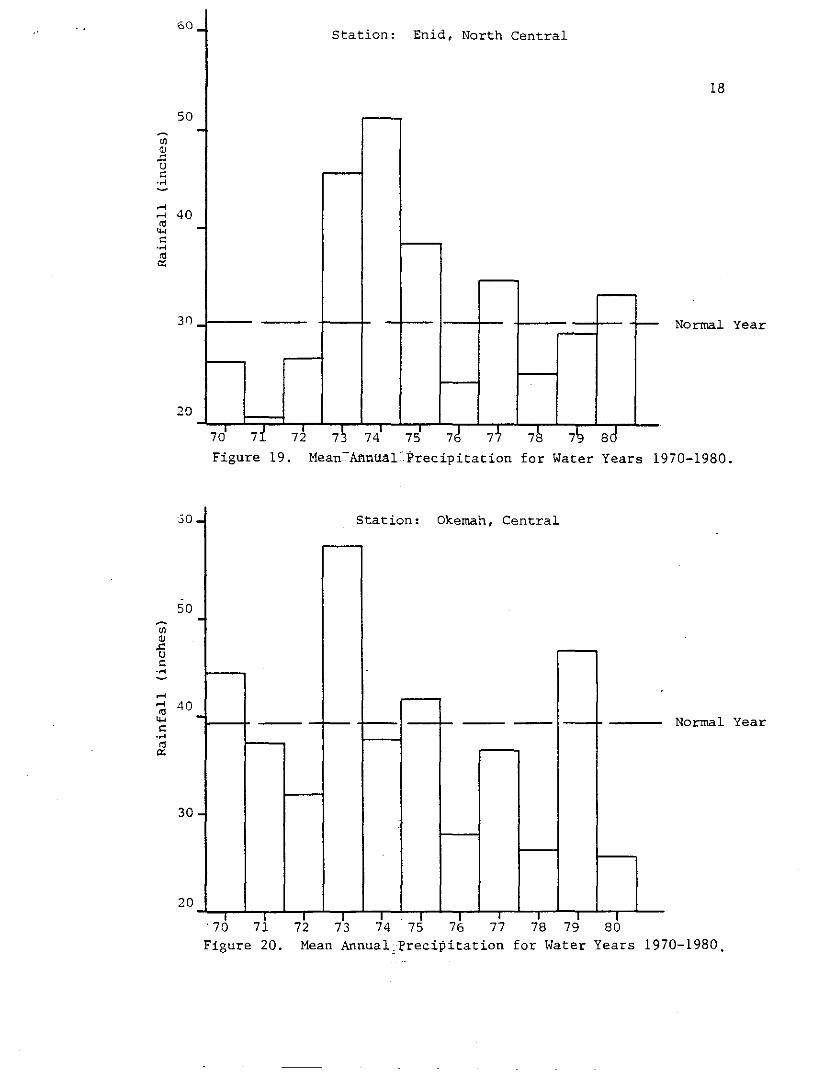
16
t~ese years ~ere sugsested ~y t~e Oklahc~a ~~~ter rre30U~C8S 30arci as bei~;
in~ic2tiva of vet, dry, anc narcsl years of precipitation. LS. .
s c..o~;n l.r;,
t~~n bein~ nor~21 these tllrce
as aver.:.ge
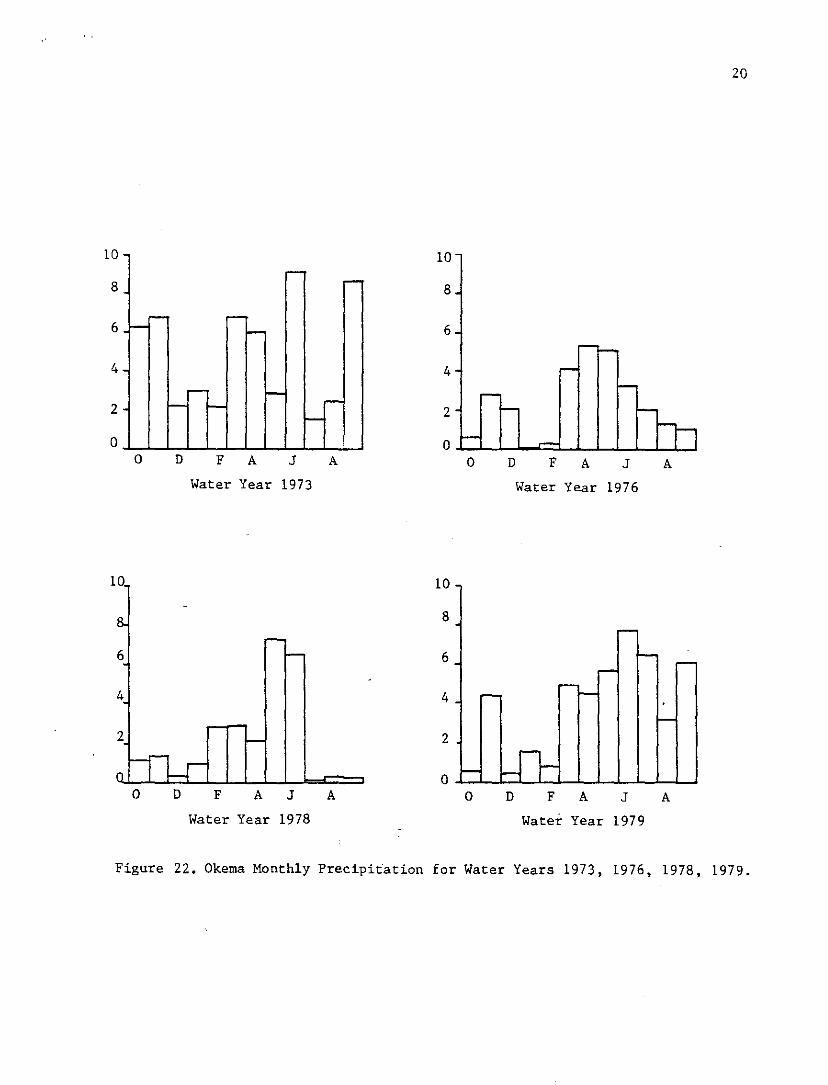
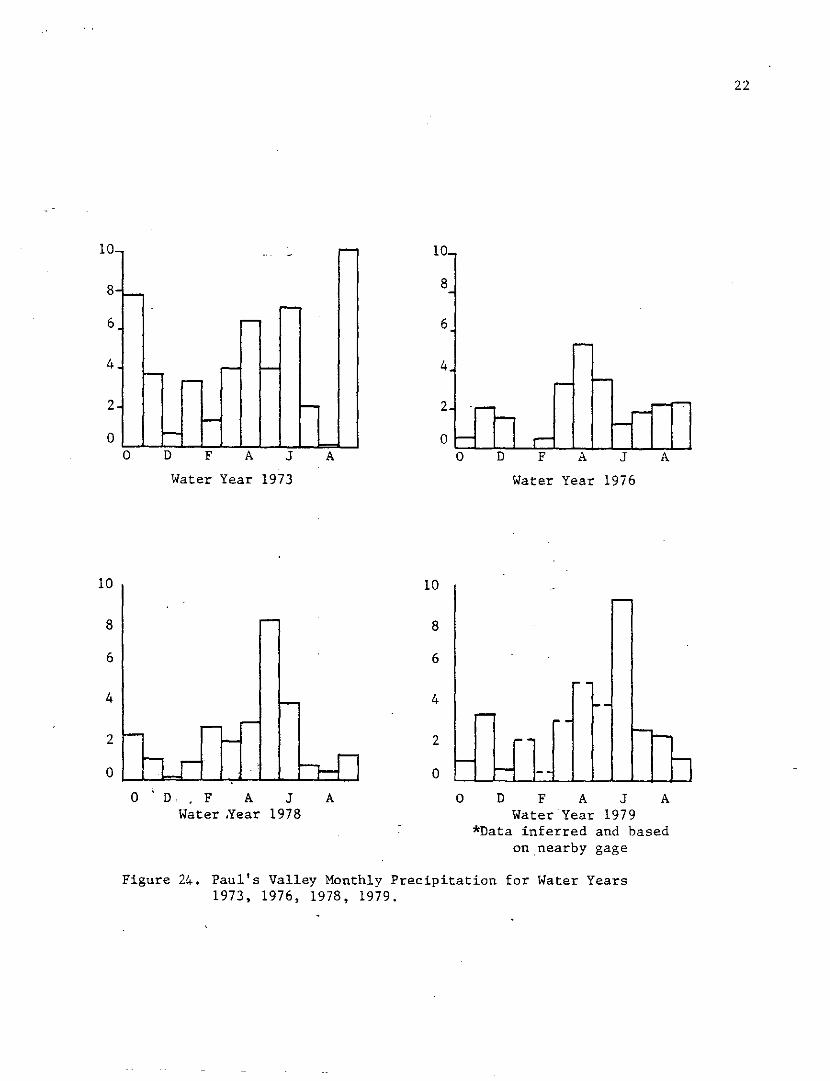
~or these reasons uater year 1979 ~as eza8~nea. ~:or..thl~i
precipitation of these stations is sho~n in Figurs 22, 23, ~~~ 2~.
A 80i13 :.o:ap ot O~::.lshor;,.a ~·jas ;;rer..t ly ~er:.e::alizeci 1.4 orde!' to EccG.S :-.:0=2
clesrly on arezs that shoulc.i have 11i;;b.er natural rates 0: :rec~:2:;:,:;e (fi;;. 25).
~~e catesory witt t~e highest pote~tial for natural r2cierJ2 cont&ins snndy
ea.stern parts of t~le area. T::e fl.rec:. of sa.ndy soils t:H:i.t cor:~:::only h.::ve fii.:e
3rai~ed subsoils have & 20derate to low potential for rec~ar3e.
sene=ally cccur alons or ~Gj2ceilt to tGe najor riverG.
lo<.::J.y soils and 10a~~y cujsoils in lOCL1y reG~ecls or alluvius. -"\.5 a s=::e::al
rules tney ~~ve the least potential for natur~l rectarse ~n~ cover a lGr~e
.s.SSurae, all otller factors t:eing equ2.1 s that the ;;rec:.test £:.:.:ount of nc:.tul:21
rechz.:-:;e to t:-~e Garber-~7ellingtor;.uould occur Ul the sout:-::ern and c£.st-ce:-~:::r·3.1
parts oE t~e study area ~nc adj2c8Lt to the wsjor rivers.
:'..ecords of 21 ~aJins sta::ions ,;;ere e:~lli~in.eri for ~!<.lter
:.::.v.:.ilacle ior all of ti:e ye2rs.

1. Enid2. Okemah3. Pauls Valley
Figure 18. Precipitation stations used in the recharge investigation.
10 0 20 40 60 10 100oi,..., 'Uti'"-,--;;.:..--,-~,c:-::,,:--,,,:,,--,--,,,,,_ ..........,
"ILES
60
50
Ul<OJ.c0
"..........
40.....'"""'".....'"a:;
30
20
- Station: Enid, North Central
-
-
.-
70' 71 72 7~ 74' 75 7~ 77 78 7'9 sd
18
Normal Year
Figure 19. Mean~Annual~Precipitationfor Water Years 1970-1980.
:,50
50
UlOJ
.<:0
"............... 40'"""'".....'"'"
30
20
- Station: Okemah, Central
-
- ---
-
, I I I I I I , I I I
Normal Year
. 70 71
Figure 20.72 73 74 75 76 77 7S 79 SOMean Annual:Erecipitation for Water Years 1970-1980.

Station: Pauls Valley, South Central
Normal Year
-
-
4
-----!-- -I-- - - f----
~
• • • , , • I I I I I20
60 19
50
Ul
";::u
"........ 40...<1l
""'".....<1l0:
30
70 71 72 73 74 75 76 77 78 79 80
Year
Figure 21. Mean Annual Precipitation for Water Years 1970-1980.
....... ,......
-
1--'-,......
I--
.,...... t-
o I-- I-- r-I--
·
· ,......
r-I--
l- I--
r- r;
10
8
6
4
2
oo D F A J
Water Year 1973
A
10
8
6
4
2
oo D F A J
Water Year 1976
A
20
-
B.,......
6. -
4.
2 I--
n l Lr
·
,......'--
~· ~
r- -I-0
I-
r- Ln-
10
o D F A J A
10
8
6
4
2
oo D F A J A
Water Year 1978 Water Year 1979
Figure 22. Okema Monthly Precipitation for Water Years 1973, 1976, 1978, 1979.

-r-
--
-r-
- ,... --r- --
r-f-
10
8
6
4
2
oo D F A
Water Year
J
1973
A
Water Year 1976
21
-
--- r"--
-- - - .
- - rl-Water Year 1979 I
10 10
8 8
6 6
4
2 2
0 00 D F A J A
Water Year 1978
o D F A J A
Figure 23. Monthly Precipitation for Water Years1973, 1976, 1978, 1979 at Enid.
22
6
2
- - .-
-I- ......--
- .-- I-.....~
l-I--
Water Year 1976
2
4
6
8
10
AD F A J
Water Year 1973
o
4
8
o
10
10 10
8 8
6 6
4 4
2 2
0 0
0,
D F A J AWater ,Year 1978
-.--
.. .
~1--...
~r-I--
l-I-- h-
o D F A J AWater Year 1979
*Data inferred and basedon nearby gage
Figure 24. Paul's Valley Monthly Precipitation for Water Years1973, 1976, 1978, 1979.

[illill~ Sandy soils-sandy soils with reddishsubsoils on various sandy materials.Good potential for natural recharge.
[ I Loamy soils-loamy or sandy soils with~--~loamy, clay loam or sandy subsoils,commonly developed on loamy redbeds.Moderate to poor potential fornatural recharge.
~~~ Clayey soils-dark soils with clayeysubsoils; loamy soils with loamy subsoils in loamy redbeds or alluvium.Generally poor potential for naturalrecharge.
Figure 25. Genralized soils map for Central Oklahoma.
~ .'" It '
,.o
~ Wt t •
Mllil
o.o
'00,
24
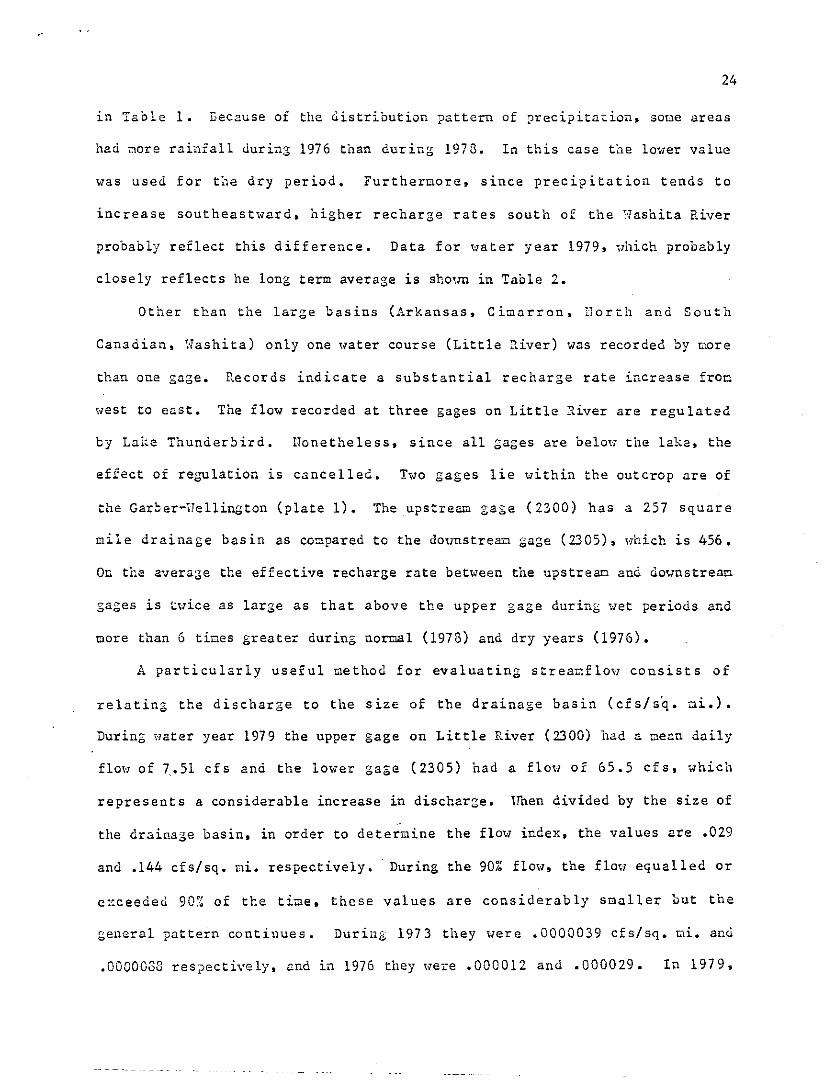
in Table 1. Because of the distribution pattern of precipitation. some areas
had nore raiilrall during 1976 than during 1973. In this case the lower value
was used for the dry period. Furthermore. since precipitation tends to
increase southeastward. higher recharge rates south of the ~-Jashita River
probably reflect this difference. Data for water year 1979. "hich probably
closely reflects he long term average is shotm in Table 2.
Other than the large basins (Arkansas. Cimarron. Dorth and South
Canadian. Washita) only one water course (Little rriver) was recorded by more
than one gage. Records indicate a substantial recharge rate increase fron
west to east. The flow recorded at three gages on Little River are regulated
by Lake Thunderbird. Nonetheless. since all gages are belou the lake. the
effect of regulation is cancelled. Two gages lie within the outcrop are of
the Garber-Hellington (plate 1). The upstream gage (2300) has a 257 square
mile drainage basin as compared to the do,rostrea!:! gage (2305). Hhich is 456.
On the avera-cie the effective recharge rate between the upstreBI:l and Qo,;;nstream
gages is tuice as large as that above the upper gage during wet periods and
more than 6 times greater during nOrr.lal (1978) and dry years (1976).
A particularly useful "'ethod for evaluating strea",flou consists of
relating the discharge to the size of the drainage basin (cfs/sq. mi.).
During uater year 1979 the upper gage on Little River (2300) had a mean daily
floH of 7.51 cfs and the lower gage (2305) had a flou of 65.5 cfs, which
represents a considerable increase in discharge. Irnen divided by the size of
the drainage basin. in order to determine the flow index. the values are .029
and .144 cfs/sq. mi. respectively •. During the 901: flow. the flotI equalled or
exceeded 90% of the time, these values are considerably smaller but the
general pattern continues. During 1973 they were .0000039 cfs/sq. mi. and
.0000033 respectively. and in 1976 they were .000012 and .000029. In 1979.

25
.Table 1
Information on stream regulation
Stationliuuber
1510-
1520-
1525-
2291-
Remarks
Some regulation by Great Salt Plains Lake
Some regulation at low flow by Lake Carl Blackwell. Small diversion
made from research for minicipal supply.
Some regulation by John Martin Research Co. Great Salt Plains Lake.
Extreme low flow sustained by sewage from Norman, occasional
regulation by research in Texas and New Mexico.
2300- Flow completely regulated by flow from Lake Thunderbird.
2305- Flow regulated or diverted by Lake Thunderbird.
2310- Flow regulated by Lake Thunderbird.
2395- Some regulated by Canton Lake.
2400- Canal from Canadian River to Lake Hefner.
2415.5- Low flow sustained by Oklahoma City sewage.
3274.9- Small diversions above station for irrigation
3280.7- Flow regulated by flood-retarding structures. some diversions for
irrigation above station.
3281-
3235-
3297-
Regulated by Fort Cobb. Foss Research flood-retarding structure.
Same as above, some irrigation diversions above station.
Flow regulated by flood-retarding structure an~ lakes.

26
Recharge rate, gpd/ sq. mi. , inches
Station Number Fixed Interval Sliding Interval Local Min.
Wildhorse Ck 3297 83,000, 1.74 67,000, 1.41 15,000, .32
Winter Ck 3280.7 134,000, 2.83 143,000, 3.02 61,000, 1.29
Little Washita 3274.9 101,000, 2.13 99,000, 2.09 56,000, 1.18
Dry Ck 2430 65,000, 1.38 67,000, 1.41 12,000, .26
Deep Fork* 2423.5 396,000, 8.33 396,000, 8.32 257,000, 5.4
Little River 2300 13,000, .28 13,000, .29 1,354, .03
Little River 2305 73,000, 1.54 59,000, 1.25 33,000, .70
Little River 2310 111,000, 2.35 107,000, 2.27 22,000, .46
Walnut Ck 2293 113,000, 2.38 115,000, 2.42 54,000, 1.15
Council Ck 1630 181,000, 3.82 175,000, 2.70 19,000, .42
Skeleton Ck 1605 101,000, 2.14 97,000, 2.05 25,000, .54
Black Bear Ck 1530 100,000, 2.11 99,000, 2.10 14,000, .31
Salt Fork 1510 73,000, 1.53 70,000, 1.48 4,470, .09
Chickaskia R 1520 103,000, 2.18 105,000, 2.21 20,000, .43
*Influenced by discharge of sewage effluent
Table 2. Effective ground-water rechargerates for water year 1979.

27
however, they were reversed (.0000075 snd .0000022, respectively), very likely
because of diversion for irrigation.
Regardless of the technique used, it is evident that the flow increases
downstream at a rate that is not uniform throughout the drainage basin. This
indicates that natural recharge to the Garber-Uellington in the basin of
Little River is larger than els~,here. It also indicutes that the aquifer 1n
this area is full to overflouing and that it dischar6es into stre6.TI'.s.
Elsewhere an analysis can be provided only in generul terms because of
the limited nUt;lber of gages, the unusually large size of the drainage basin or
external effects on the stream brought about by regulation or the dischurge of
effluent. For example, gage 2423.5 on Deep Fork provides records that
indicate a recharge rate that is about four tiwes larger than sur=ounding
stations (plate 1). The high and consistent flow is the result of discharse
of cunicipal sewage effluent into the stream.
The very large basins (Arkansas, Cimarron, !lorth and South Canadian, and
liashita) cannot be adequately examined because the conputer analysis results
in values that are much too low. The COlilputer prograra is based o.n the
assunption that natural rechar~e occurs, at least in a general way, Dore or
less unifoTnly throughout the besin. In these basins. hOllever, t'\'lO distinctly
different tYFes of strata appear--consolidated rocks of relatively low
perne2bility and alluvial or sand dune deposits that sre quite pe~.eable.
Pres~ntly it is not possible to separate the streamflow into the quantities
derived from the different strata. Eventually it should be possible to do
this with a more refined program that is based in part on differences in vater
quality. On the other h~nds it isn't necessary to use data froc gages on the
uaJor rivers because their gaged tributaries provide the sa~e in£ornation and
it is influenced by far feller externalities.

27
hOllever s i:~ey ~;ere reversed (.0000075 and .0000022~ respectively), very likely
bec~use of diversion for irrigation.
Regardless of the technique used, it is eviGent that the flow increases
downstream at a rate that is not uniform throughout the drainage basin. This
indicates that natural recharge to the Garber-Wellington 1n the basin of
Little River is larger than elsewhere. It also indicates that the aquifer in
this area is full to overflowing and that it discharges into streaLls.
Elsewhere c:m analysis can be provided only in general terns because or
the limited nutlber of gages. the unusually large size of the drainage basin or
external effects on the stream brought about by regulation or the discharge of
effluent. For example, gage 2423.5 on Deep Fork provides records that
indicate a recharge rate that is about four times larger than surrounding
stations (plate 1). The high and consistent flow is the result of discharge
of municipal sewage effluent into the stream.
The very l~r.;e basins (Arkansas, Cir.arron, Horth and South Canadian, and
\/ashi ta) cannot be adequately examined because the conputer analysis results
in values that are much too low. The conputer progran 1S based on the
assu~ption that natural recharge occurs, at least in a general T.,.;ay, Dore Or
less unifornly throughout the basin. In these basins, however, two distinctly
different types of strata appear--consolidated rocks of relatively low
peroneaDility and alluvial or sand dune deposits that are quite permeable.
Presently it is not possible to separate the strea~flow.into the quantities
derived fran the different strata~ Eventually it should be possible to do
this with a wore refined pro gran that is based in part on differences in water
quality. On the other hand, it isn't necessary to use data fron gages on t~e
najor rivers because their ga~ed tributaries provide the sane infor~ation and
it is influenced by far fewer externalities.
28
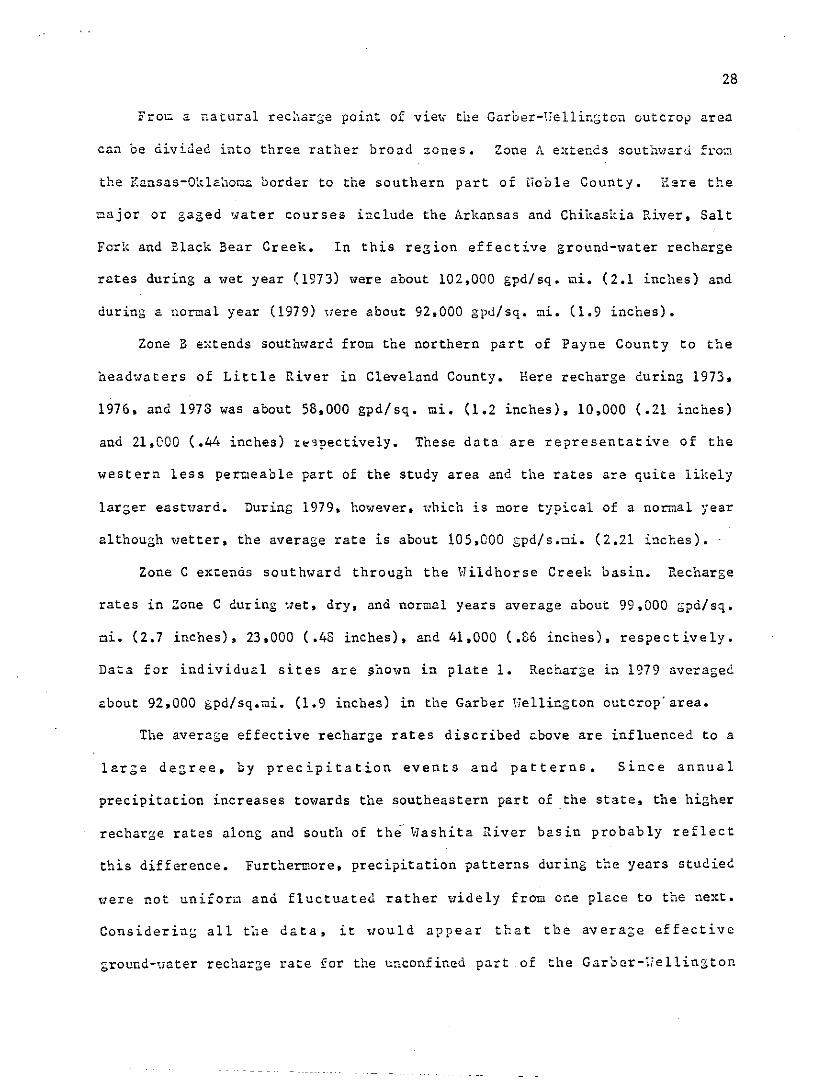
Fro:.:.. a natural rec~large point of viet~· tue Garoer-Hellin~to~ outcrolJ area
can be divided into three rather broad zoneS. Zone A e::~tends south'·la.rd .fro';.:-~
the Kansas-Oklz.:1oma border to the southern part of noble County. Hsre the
major or gaged water courses include the Arkansas and Chikaskia River. Salt
Fork and Black Bear Creek. In this region effective ground-water recharge
rates during a wet year (1973) were about 102.000 Spd/sq. Qi. (2.1 inches) and
during a normal year (1979) uere about 92.000 gpd/sq. Qi. (1.9 inches).
Zone B extends soutlward froQ the northern part of Payne County to the
headwaters of Little River in Cleveland County. Here recharge during 1973.
1976. and 1973 was about 58.000 gpd/sq. mi. (1.2 inches). 10.000 (.21 inches)
and 21.000 (.44 inches) I~spective1y. These data are representative of the
western less permeable part of the study area and the rates are quite likely
laroer eastllard. Durinb 1979. however. '\:hich is more typical of a normal year
although wetter. the average rate is about 105.000 gpd/s.ui. (2.21 inches).
Zone C excends southward through the Wi1dhorse Creek basin. Recharge
rates in Zone C during ';-let. dry, and normal years average about 99,000 gpo/sq.
ui. (2.7 inches). 23.000 (.48 inches). and 41.000 (.86 inches). respectively.
Data for individu~l sites are $hown in plate 1. Recharge in 1979 averaged
about 92.000 gpd/sq.",i. (1.9 inches) in the Garber Wellington outcrop· area.
The average effective recharge rates discribed above are influenced to a
large degree. by precipitation events and patterns. Since annual
precipitation increases towards the southeastern part of the state. the higher
recharge rates along and south of the vJashita River basin probably reflect
this difference. Furthermore. precipitation patterns during the years studieC:
were not uniform and fluctuated rather widely from one place to the next.
Considering all the data, it \lould appear that tbe average effective
ground-llater rechar:;;e rate for the unconfined part .or the Garber-Uellington

29
Station No. 1973 1976 1978 1979
1510 12•51 0.56 0.6222•31 0.56 0.5931.49 0.53 0.46
1520 2.37 0.85 loll2.17 0.87 1.12 2.181. 75 0.82 1.08 2.21
.43
1525 1.40 0.40 0.561.26 0.42 0.571.07 0.32 0.53
1530 2.05 0.26 0.21 2.112.10 0.26 0.22 2.101.09 0.23 0.18 .31
1605 0.99 0.50 0.29 2.141.01 0.50 0.30 2.050.91 0.46 0.27 .54
1610 0.76 0.21 0.180.63 0.22 0.170.57 0.21 0.18
1630 1.35 0.31 0.38 3.821.34 0.31 0.45 3.701.20 0.30 0.30 .42
(1967) (1968)2291 0.09 0.05 0.10
0.09 0.04 0.100.09_ 0.02 0.04
2293 2.84 1.17 0.28 2.382.84 1.16 0.30 2.42• 0.24 1.152.82 1.10
1Fixed Interval
2Sliding Interval
3Local Minima
Table 3. Effective ground-water recharge, in inches
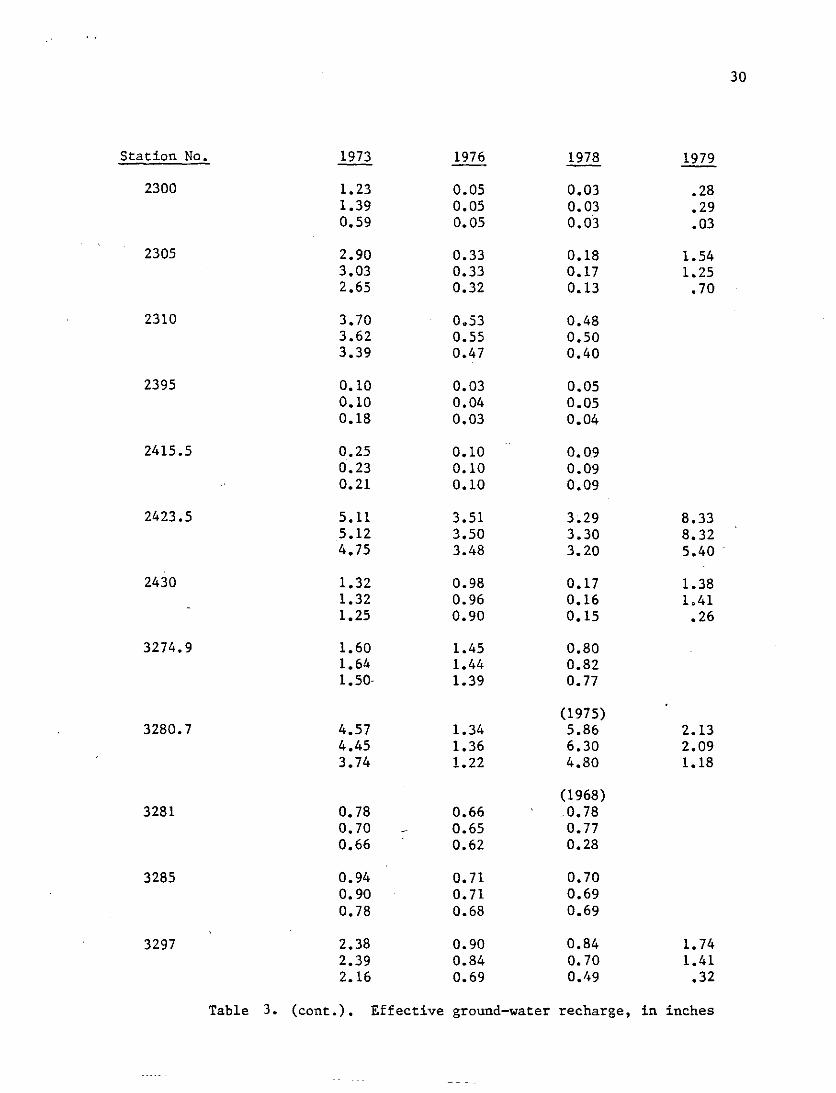
Station No. 1973 1976 1978 1979
2300 1.23 0.05 0.03 .281.39 0.05 0.03 .290.59 0.05 0.03 .03
2305 2.90 0.33 0.18 1.543.03 0.33 0.17 1.252.65 0.32 0.13 .70
2310 3.70 0.53 0.483.62 0.55 0.503.39 0.47 0.40
2395 0.10 0.03 0.050.10 0.04 0.050.18 0.03 0.04
2415.5 0.25 0.10 0.090.23 0.10 0.090.21 0.10 0.09
2423.5 5.11 3.51 3.29 8.335.12 3.50 3.30 8.324.75 3.48 3.20 5.40
2430 1.32 0.98 0.17 1.381.32 0.96 0.16 1,411.25 0.90 0.15 .26
3274.9 1.60 1.45 0.801.64 1.44 0.821.50- 1.39 0.77
(1975)3280.7 4.57 1.34 5.86 2.13
4.45 1.36 6.30 2.093.74 1.22 4.80 1.18
(1968)3281 0.78 0.66 0.78
0.70 0.65 0.770.66 0.62 0.28
3285 0.94 0.71 0.700.90 0.71 0.690.78 0.68 0.69
3297 2.38 0.90 0.84 1.742.39 0.84 0.70 1.412.16 0.69 0. 1'9 .32
Table 3. (cont.) • Effective ground-water recharge, in inches
30

Recharge rates expressed in
31
aquifer is about 100.000 gpd/sq.ui. or about 2.11 inches. On sost appraisals.
this is the rate that should be considered.
inches are ShovlU in Table 3.
The frequency of droughts and wet periods also have a subtle effect on
the hydrologic syste",. For ex=ple. a wet year following ",onths or years of
dry weather will not influence streamflow or ground-water rechar3e es much as
a i:.~et year following a norUlal or \let year. In part this is due to a large
share of the water being used to replace the soil-moisture dificiency Qua
there may be little excess for surface runoff or ground-'later recharge.
Resultingly there may be a large difference in calculated effective recharge
rates fro'" one year to the ne"t or fro", place to place.
The preliminary estimates of effective ground-water recharge rates
described herein reflect only a short time sp~n and, consequently, are subject
to revision. Another project is presently uncle=\,,~ay by the author to ev.:.luate
rates using a lO-year continuous data base. This study will result in
effective recharge rates that are less influenced by unconmon precipitation
events or periods. On the other hand~ rechar~e rates during dry yea~s are
i~port3nts particularly for pl?nning purposes, because it is during dry
periods thD.t \'1e11s Llust ~lithdrm"l largely from storage.
Recharge rates for other areas in Oklaho~a have been deternined by ~
variety of methods by gra~uate students in the Departnent of Geology at
Oklahoua State University. Generally the rates "ere based on couputerized
ground-water flow uodels and thus recharge was not actually measured but
rather estimated by calibrating 'each 'G"~odel. The calibrations \lere based on
long te~ avera3es. In most cases only the most perneable areas were wodeled.
The Enid Terrace was investiseted by Beausoleil (1981). Using ~ell
hydrographs snd precipitation datn for this models he concludec that the
, .32
natural recharge rate was about 2.3 inches/year (109,500 gpd/ni.sq.). Lyons
(1981) in his study of the Elk City-l1ashita area. cclculated a rechar~e rate
of 3.92 inches/year (lC6,630 gpd/",i.sq.), which as 14.1;; of the long term
precipitation rate. The North Fork of the Red River was investigated by
Paukstartis (1982). He estimated a long term recharge rate of 2.23
inches/year (l08,550 gpd/mi.sq.), which was equivalent to 9.4% of the total
runoff. Shippers Hhose \'lork is still in progress, studied part of the ~-1ashita
basin. His preliminary estimate of recharge through permeable alluvial
deposits is 3.3 inches/year (157,100 gpd/mi.sq.).
rreferences Cited
Beausoleil, Y. J., 1981. A ground-water management model for the Enidisolated terrace aquifer in Garfield County, OK: Unpublished U.S.thesis, Departnent of Geology, Okl&ho~a State University, 66 p.
Lyoas, T. D., 1981. A ground-water managa1ent codel for the Ell, City aquiferin Hashita, Beckham, Custer and Roger Hills Counties, OK: Unpublisheda.s. thesis, Department of Geology, Oklahoma State University.
Paul,stratis, C:. J .. 1981. Computer simulation of the alluvial aquifer alongthe :7orth Fork of the Red River in soutl'n-;estern Oklahona: UnpublishedU.S. thesis, Department of Geology, O~lahoma State University, 111 p.
Pettyjohn, H. A. and R. J. Rennin:!;, 1979. PreliDinary estiro<lte of:;rocnd-l1ater recharge rates, related strear.:flo'u and 'Hater quality inOhio: Ohio State University Hater Resources Center. Rept. 552, 323 p.
u. S. Geological Survey, Hater reSources data for Oklahoma, 1973, 1976,1973 und 1979: U. S. Departnent of Interior, Geologicnl Survey.


