
Preliminary Enrollment Report Spring 2012 · Native Hawaii/ Pacific Isl 3 2 5 0.1% International 80...
21
Preliminary Enrollment Report Spring 2012 Prepared by the Office of Academic Affairs (As of January 25, 2012)
Transcript of Preliminary Enrollment Report Spring 2012 · Native Hawaii/ Pacific Isl 3 2 5 0.1% International 80...

Preliminary Enrollment Report
Spring 2012
Prepared by the Office of Academic Affairs
(As of January 25, 2012)

Preliminary Enrollment ReportSpring 2012
Table of Contents
REPORT NAME PAGE
Enrollment Summary 1
Headcount and FTE Comparison 2
5-Year HeadCount Comparison 3
10-Year HeadCount Comparison 4
5-Year FTE Comparison 5
10-Year FTE Comparison 6
Student Credit Hour Production 7
Enrollment by Class and Gender 8
Enrollment by Class & Full/Part-Time Status 9
Enrollment by Ethnicity 10
Ethnicity Comparison by Gender 11
Average Age Comparison 12
Average Age By Class Level 13
Enrollment by Geographic Origin 14
5 Year Comparison by Geographic Origin 15
International Enrollment by Country 16
First-Time Freshmen - Enrollment by Ethnicity, Gender & Status 17
First-Time Freshmen - Enrollment by Geographic Origin 18
First-Time Transfers - Enrollment by Ethnicity, Gender & Status 19
First-Time Transfers - Enrollment by Last College Attended 20
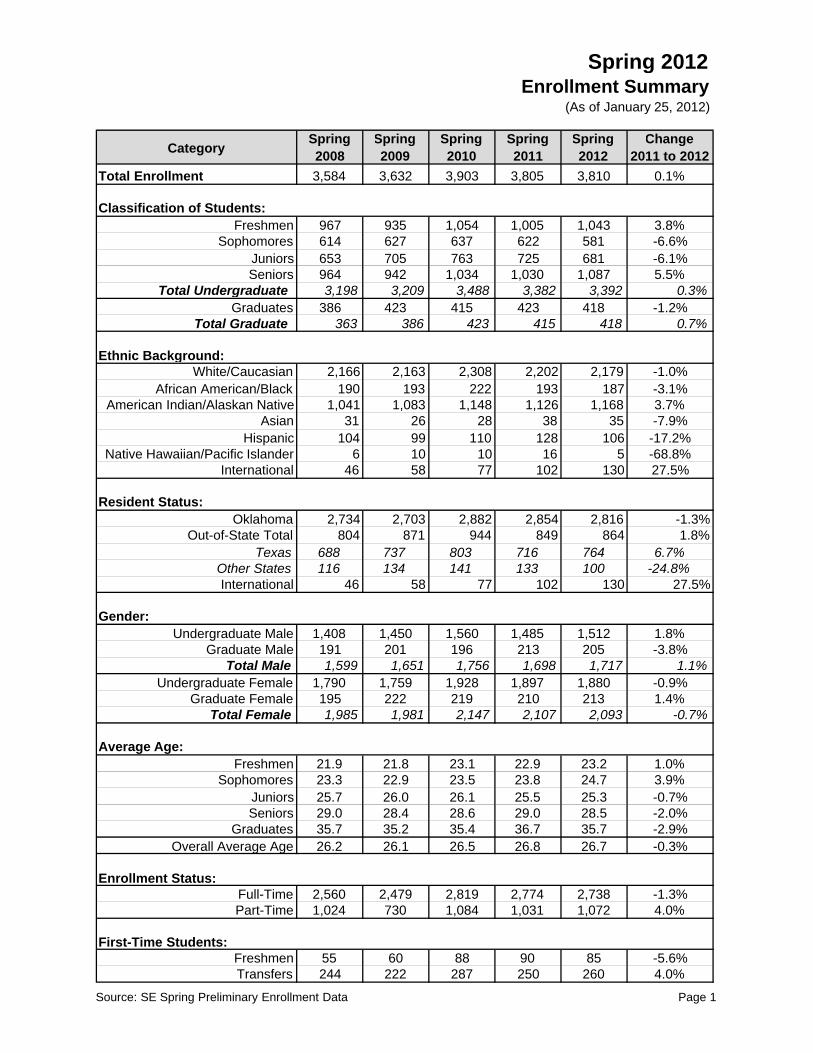
Spring 2012Enrollment Summary
(As of January 25, 2012)
CategorySpring2008
Spring2009
Spring2010
Spring2011
Spring2012
Change2011 to 2012
Total Enrollment 3,584 3,632 3,903 3,805 3,810 0.1%
Classification of Students:Freshmen 967 935 1,054 1,005 1,043 3.8%
Sophomores 614 627 637 622 581 -6.6%Juniors 653 705 763 725 681 -6.1%Seniors 964 942 1,034 1,030 1,087 5.5%
Total Undergraduate 3,198 3,209 3,488 3,382 3,392 0.3%Graduates 386 423 415 423 418 -1.2%
Total Graduate 363 386 423 415 418 0.7%
Ethnic Background:White/Caucasian 2,166 2,163 2,308 2,202 2,179 -1.0%
African American/Black 190 193 222 193 187 -3.1%American Indian/Alaskan Native 1,041 1,083 1,148 1,126 1,168 3.7%
Asian 31 26 28 38 35 -7.9%Hispanic 104 99 110 128 106 -17.2%
Native Hawaiian/Pacific Islander 6 10 10 16 5 -68.8%International 46 58 77 102 130 27.5%
Resident Status:Oklahoma 2,734 2,703 2,882 2,854 2,816 -1.3%
Out-of-State Total 804 871 944 849 864 1.8%Texas 688 737 803 716 764 6.7%
Other States 116 134 141 133 100 -24.8%International 46 58 77 102 130 27.5%
Gender:Undergraduate Male 1,408 1,450 1,560 1,485 1,512 1.8%
Graduate Male 191 201 196 213 205 -3.8%Total Male 1,599 1,651 1,756 1,698 1,717 1.1%
Undergraduate Female 1,790 1,759 1,928 1,897 1,880 -0.9%Graduate Female 195 222 219 210 213 1.4%
Total Female 1,985 1,981 2,147 2,107 2,093 -0.7%
Average Age:Freshmen 21.9 21.8 23.1 22.9 23.2 1.0%
Sophomores 23.3 22.9 23.5 23.8 24.7 3.9%Juniors 25.7 26.0 26.1 25.5 25.3 -0.7%Seniors 29.0 28.4 28.6 29.0 28.5 -2.0%
Graduates 35.7 35.2 35.4 36.7 35.7 -2.9%Overall Average Age 26.2 26.1 26.5 26.8 26.7 -0.3%
Enrollment Status:Full-Time 2,560 2,479 2,819 2,774 2,738 -1.3%Part-Time 1,024 730 1,084 1,031 1,072 4.0%
First-Time Students:Freshmen 55 60 88 90 85 -5.6%Transfers 244 222 287 250 260 4.0%
Source: SE Spring Preliminary Enrollment Data Page 1
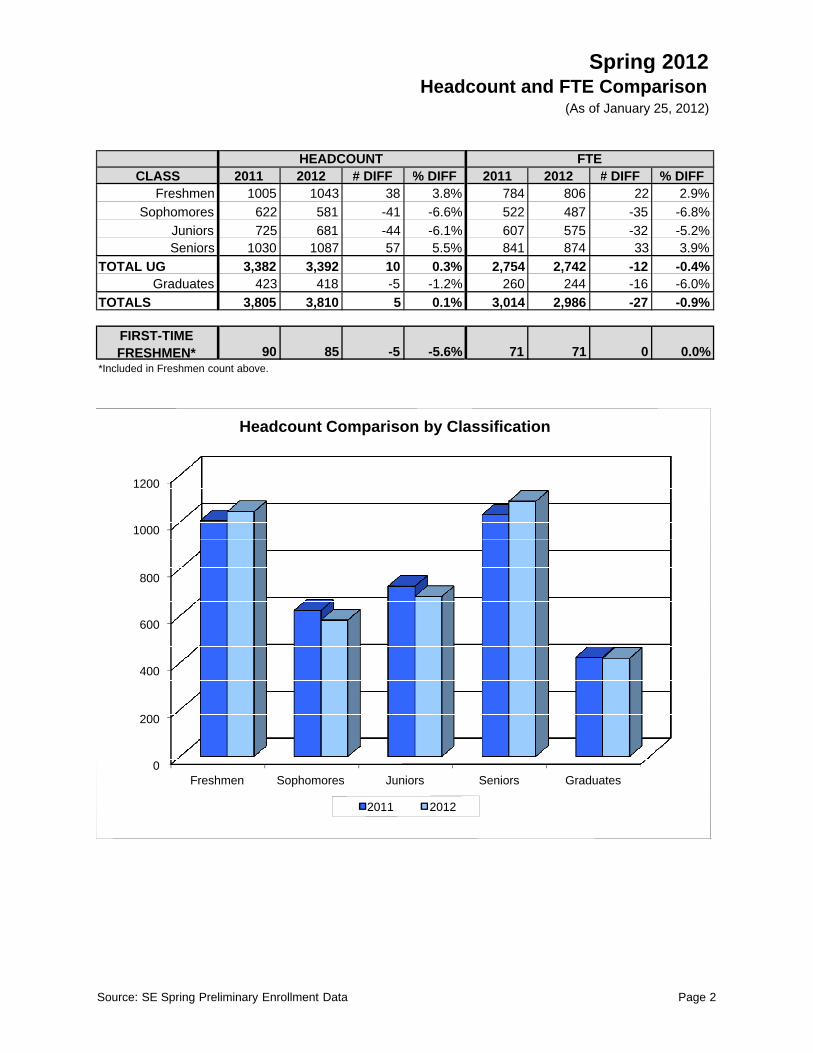
Spring 2012Headcount and FTE Comparison
(As of January 25, 2012)
CLASS 2011 2012 # DIFF % DIFF 2011 2012 # DIFF % DIFFFreshmen 1005 1043 38 3.8% 784 806 22 2.9%
Sophomores 622 581 -41 -6.6% 522 487 -35 -6.8%Juniors 725 681 -44 -6.1% 607 575 -32 -5.2%Seniors 1030 1087 57 5.5% 841 874 33 3.9%
TOTAL UG 3,382 3,392 10 0.3% 2,754 2,742 -12 -0.4%Graduates 423 418 -5 -1.2% 260 244 -16 -6.0%
TOTALS 3,805 3,810 5 0.1% 3,014 2,986 -27 -0.9%
FIRST-TIMEFRESHMEN* 90 85 -5 -5.6% 71 71 0 0.0%
*Included in Freshmen count above.
HEADCOUNT FTE
1000
1200
Headcount Comparison by Classification
0
200
400
600
800
Freshmen Sophomores Juniors Seniors Graduates
2011 2012
Source: SE Spring Preliminary Enrollment Data Page 2

Spring 20125-Year HeadCount Comparison
(As of January 25, 2012)
CLASS 2008 2009 2010 2011 2012 # DIFF % DIFFFreshmen 967 935 1054 1005 1043 38 3.8%
Sophomores 614 627 637 622 581 -41 -6.6%Juniors 653 705 763 725 681 -44 -6.1%Seniors 964 942 1034 1030 1087 57 5.5%
TOTAL UG 3,198 3,209 3,488 3,382 3,392 10 0.3%Graduates 386 423 415 423 418 -5 -1.2%
TOTALS 3,584 3,632 3,903 3,805 3,810 5 0.1%
FIRST-TIMEFRESHMEN*
55 60 88 90 85 -5 -5.6%
*Included in Freshmen count above.
HEADCOUNT 2011 to 2012
3,850
3,900
3,9503,903
3,805 3,810
5-Year Total Headcount Comparison
3,400
3,450
3,500
3,550
3,600
3,650
3,700
3,750
3,800
3,850
2008 2009 2010 2011 2012
3,584
3,632
Source: SE Spring Preliminary Enrollment Data Page 3

Spring 201210-Year HeadCount Comparison
(As of January 25, 2012)
CLASS 2003 2004 2005 2006 2007 2008 2009 2010 2011 2012Freshmen 996 1,108 996 871 904 967 935 1054 1005 1043
Sophomores 650 601 678 646 555 614 627 637 622 581Juniors 714 698 710 743 696 653 705 763 725 681Seniors 987 956 1010 1018 1008 964 942 1034 1030 1087
TOTAL UG 3,347 3,363 3,394 3,278 3,163 3,198 3,209 3,488 3,382 3,392Graduates 409 397 390 392 363 386 423 415 423 418
TOTALS 3,756 3,760 3,784 3,670 3,526 3,584 3,632 3,903 3,805 3,810
FIRST-TIMEFRESHMEN*
74 85 61 68 54 55 60 88 90 85
*Included in Freshmen count above.
HEADCOUNT
4,0003,903
10-Year Total Headcount Comparison
3,300
3,400
3,500
3,600
3,700
3,800
3,900
2003 2004 2005 2006 2007 2008 2009 2010 2011 2012
3,756 3,7603,784
3,670
3,5263,584
3,632
3,903
3,805 3,810
Source: SE Spring Preliminary Enrollment Data Page 4

Spring 20125-Year FTE Comparison
(As of January 25, 2012)
CLASS 2008 2009 2010 2011 2012 # DIFF % DIFFFreshmen 741 710 819 784 806 22 2.9%
Sophomores 531 547 551 522 487 -35 -6.8%Juniors 551 601 640 607 575 -32 -5.2%Seniors 779 786 843 841 874 33 3.9%
TOTAL UG 2,602 2,645 2,853 2,754 2,742 -12 -0.4%Graduates 206 238 230 260 244 -16 -6.0%
TOTALS 2,808 2,883 3,083 3,014 2,986 -27 -0.9%
FTE 2011 to 2012
3,000
3,500
4,000
2,808 2,883
3,0833,014 2,986
5-Year Total FTE Comparison
0
500
1,000
1,500
2,000
2,500
3,000
2008 2009 2010 2011 2012
Source: SE Spring Preliminary Enrollment DataPage 5
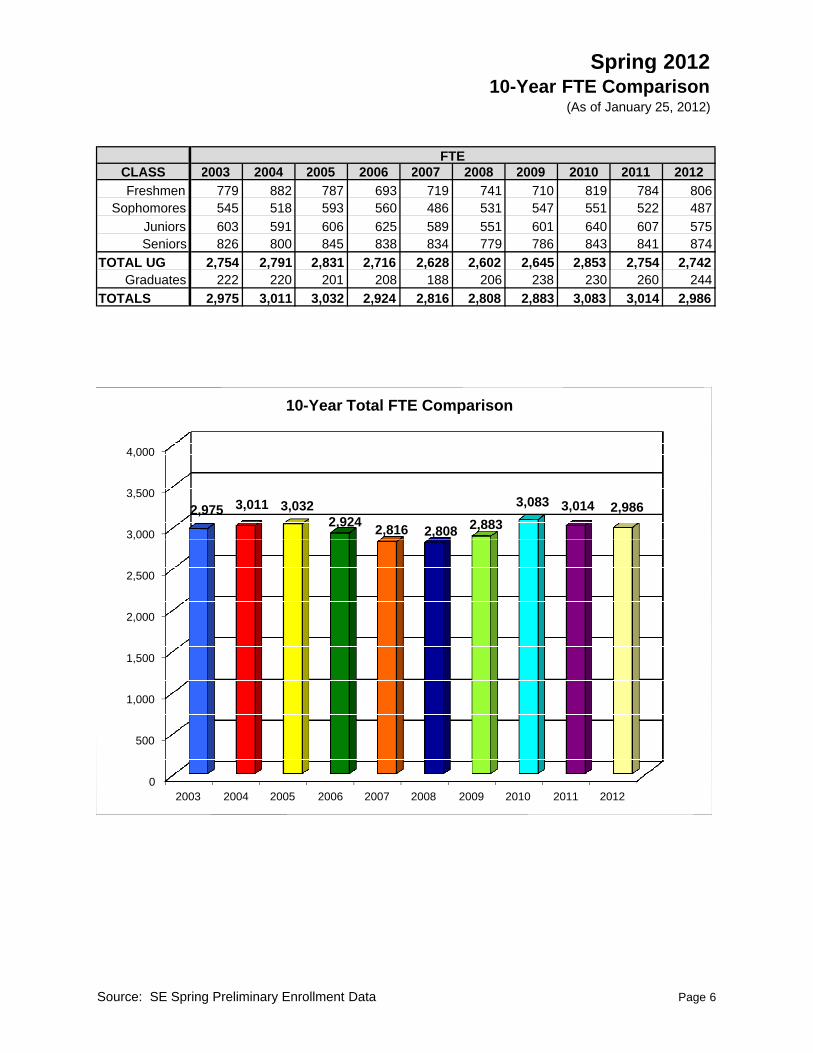
Spring 201210-Year FTE Comparison
(As of January 25, 2012)
CLASS 2003 2004 2005 2006 2007 2008 2009 2010 2011 2012Freshmen 779 882 787 693 719 741 710 819 784 806
Sophomores 545 518 593 560 486 531 547 551 522 487Juniors 603 591 606 625 589 551 601 640 607 575Seniors 826 800 845 838 834 779 786 843 841 874
TOTAL UG 2,754 2,791 2,831 2,716 2,628 2,602 2,645 2,853 2,754 2,742Graduates 222 220 201 208 188 206 238 230 260 244
TOTALS 2,975 3,011 3,032 2,924 2,816 2,808 2,883 3,083 3,014 2,986
FTE
3,000
3,500
4,000
2,975 3,011 3,0322,924 2,816 2,808 2,883
3,083 3,014 2,986
10-Year Total FTE Comparison
0
500
1,000
1,500
2,000
2,500
3,000
2003 2004 2005 2006 2007 2008 2009 2010 2011 2012
Source: SE Spring Preliminary Enrollment Data Page 6

Spring 2012Student Credit Hour Production
(As of January 25, 2012)
CLASS # DIFF %DIFF2011 5,258 6,497 11,7552012 5,488 6,604 12,0922011 3,660 4,175 7,8352012 3,326 3,980 7,3062011 4,149 4,953 9,1022012 4,125 4,504 8,6292011 5,337 7,285 12,6222012 6,006 7,104 13,1102011 1,628 1,488 3,1162012 1,427 1,506 2,9332011 20,032 24,398 44,4302012 20,372 23,698 44,070
SCH PRODUCTION 2007 2008 2009 2010 2011 2012
TOTAL 41,675 41,509 42,525 45,555 44,430 44,070
-5.9%
-0.8%
2.9%
-6.8%
3.9%
-5.2%
Graduates
TOTAL
337
-529
-473
488
-183
-360
Freshmen
Sophomores
Juniors
Seniors
From SPRING 2011MENSPRING WOMEN TOTAL
Total SCH Production
Source: SE Spring Preliminary Enrollment Data Page 7
0
10,000
20,000
30,000
40,000
50,000
2007 2008 2009 2010 2011 2012
41,675 41,509 42,52545,555
44,430 44,070
Total SCH Production
Source: SE Spring Preliminary Enrollment Data Page 7

Spring 2012Enrollment by Class and Gender
(As of January 25, 2012)
CLASS 2011 2012 % DIFF 2011 2012 % DIFF 2012 %DIFFFreshmen 441 453 2.7% 564 590 4.6% 1,043 3.8%
Sophomores 284 258 -9.2% 338 323 -4.4% 581 -6.6%Juniors 325 310 -4.6% 400 371 -7.3% 681 -6.1%Seniors 435 491 12.9% 595 596 0.2% 1,087 5.5%
TOTAL UG 1,485 1,512 1.8% 1,897 1,880 -0.9% 3,392 0.3%Graduates 213 205 -3.8% 210 213 1.4% 418 -1.2%
TOTALS 1,698 1,717 1.1% 2,107 2,093 -0.7% 3,810 0.1%
MEN WOMEN TOTAL
500
600
Enrollment Comparison by Class and Gender
0
100
200
300
400
Freshmen Sophomores Juniors Seniors Graduates
MEN WOMEN
Source: SE Spring Preliminary Enrollment Data Page 8

Spring 2012Enrollment by Class & Full/Part-Time Status
(As of January 25, 2012)
CLASS FT PT TOTAL FT PT TOTAL FT PT TOTALFreshmen 351 102 453 402 188 590 753 290 1,043
Sophomores 212 46 258 253 70 323 465 116 581Juniors 277 33 310 276 95 371 553 128 681Seniors 368 123 491 429 167 596 797 290 1,087
TOTAL UG 1,208 304 1,512 1,360 520 1,880 2,568 824 3,392Graduates 79 126 205 91 122 213 170 248 418
TOTALS 1,287 430 1,717 1,451 642 2,093 2,738 1,072 3,810
MEN WOMEN TOTAL
1,000
1,200
Enrollment Comparison by Full-Time/Part-Time Status
0
200
400
600
800
Freshmen Sophomores Juniors Seniors Graduates
MEN-FT MEN-PT WOMENT-FT WOMEN-PT
Source: SE Spring Preliminary Enrollment Data Page 9
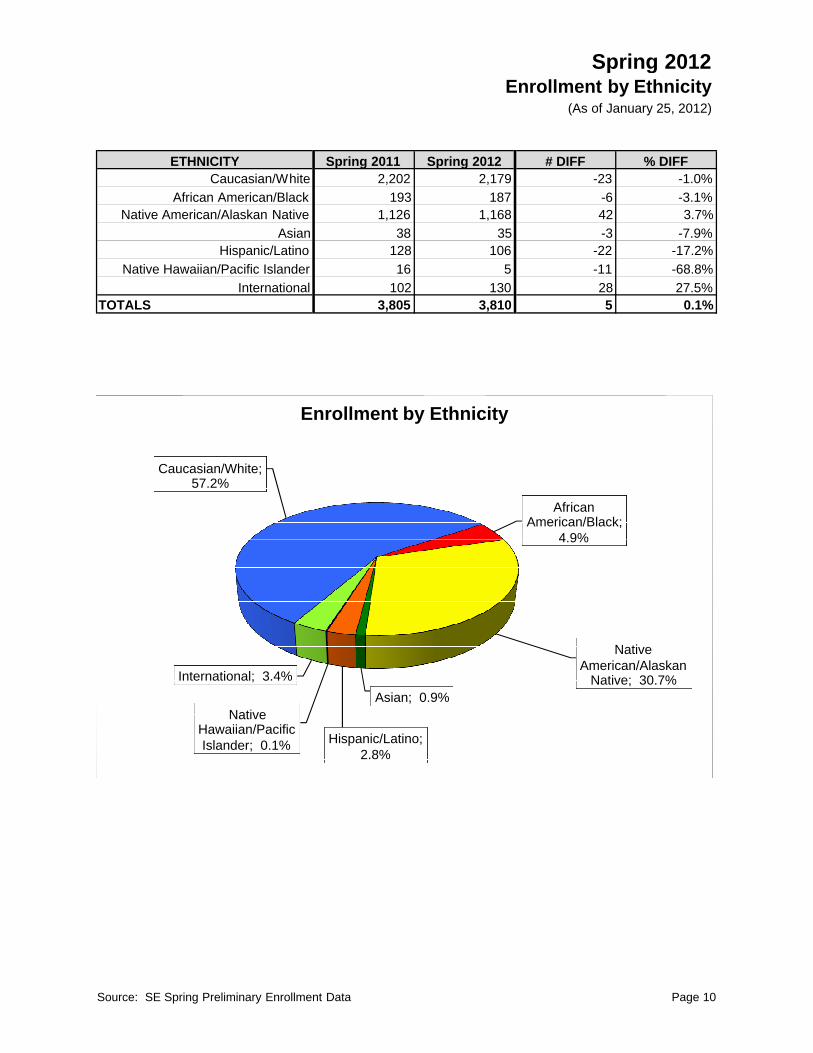
Spring 2012Enrollment by Ethnicity
(As of January 25, 2012)
ETHNICITY Spring 2011 Spring 2012 # DIFF % DIFFCaucasian/White 2,202 2,179 -23 -1.0%
African American/Black 193 187 -6 -3.1%Native American/Alaskan Native 1,126 1,168 42 3.7%
Asian 38 35 -3 -7.9%Hispanic/Latino 128 106 -22 -17.2%
Native Hawaiian/Pacific Islander 16 5 -11 -68.8%International 102 130 28 27.5%
TOTALS 3,805 3,810 5 0.1%
Caucasian/White;57.2%
AfricanAmerican/Black;
4.9%
Enrollment by Ethnicity
4.9%
NativeAmerican/Alaskan
Native; 30.7%Asian; 0.9%
Hispanic/Latino;2.8%
NativeHawaiian/PacificIslander; 0.1%
International; 3.4%
Source: SE Spring Preliminary Enrollment Data Page 10
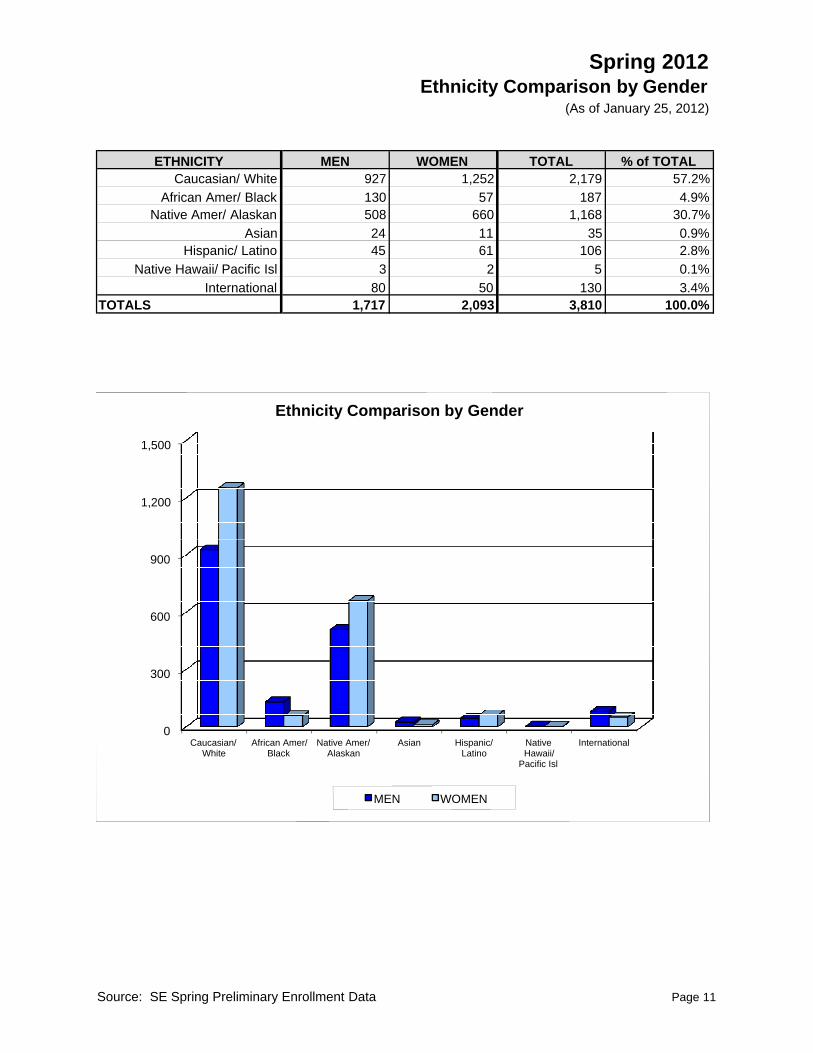
Spring 2012Ethnicity Comparison by Gender
(As of January 25, 2012)
ETHNICITY MEN WOMEN TOTAL % of TOTALCaucasian/ White 927 1,252 2,179 57.2%
African Amer/ Black 130 57 187 4.9%Native Amer/ Alaskan 508 660 1,168 30.7%
Asian 24 11 35 0.9%Hispanic/ Latino 45 61 106 2.8%
Native Hawaii/ Pacific Isl 3 2 5 0.1%International 80 50 130 3.4%
TOTALS 1,717 2,093 3,810 100.0%
1,200
1,500
Ethnicity Comparison by Gender
0
300
600
900
Caucasian/White
African Amer/Black
Native Amer/Alaskan
Asian Hispanic/Latino
NativeHawaii/
Pacific Isl
International
MEN WOMEN
Source: SE Spring Preliminary Enrollment Data Page 11

Spring 2012Average Age Comparison
(As of January 25, 2012)
AGES Spring 2011 Spring 2012 DIFFUNDER 21 22.0% 20.8% -1.2%21-23 32.6% 31.4% -1.2%24-26 13.3% 14.9% 1.6%27-30 8.7% 9.7% 1.0%31-40 13.0% 14.0% 1.0%41-50 6.9% 6.7% -0.2%51-60 3.0% 2.3% -0.7%OVER 60 0.4% 0.3% -0.1%AVERAGE AGE 26.8 26.7 -0.1
21-23; 31.4%
24-26; 14.9%
Average Age Comparison
UNDER 21; 20.8%
24-26; 14.9%
27-30; 9.7%
31-40; 14.0%
41-50; 6.7%51-60; 2.3%
OVER 60; 0.3%
Source: SE Spring Preliminary Enrollment Data Page 12

Spring 2012Average Age By Class Level
(As of January 25, 2012)
CLASS FT PT ALL FT PT ALL FT PT ALLFreshmen 22.3 24.6 22.9 22.8 24.1 23.2 0.5 -0.5 0.2
Sophomores 22.8 28.2 23.8 23.6 29.3 24.7 0.8 1.1 0.9Juniors 24.6 29.1 25.5 24.6 28.3 25.3 0.1 -0.8 -0.2Seniors 27.7 33.3 29.0 27.3 31.7 28.5 -0.4 -1.6 -0.6
Graduates 37.5 36.5 36.7 35.4 35.7 35.7 -2.1 -0.8 -1.1TOTAL AVE AGE 24.9 31.2 26.8 24.9 30.5 26.7 0.0 -0.7 -0.1
Spring 2011 Spring 2012 Difference from 2011
40
50
35.7
Average Age by Class Level
0
10
20
30
40
Freshmen Sophomores Juniors Seniors Graduates
23.224.7 25.3
28.5
35.7
Ave
rage
Age
Source: SE Spring Preliminary Enrollment Data Page 13

Spring 2012Enrollment by Geographic Origin
(As of January 25, 2012)
COUNTY HC % of TOTAL HC % of TOTAL # DIFF %DIFFAtoka 03 187 4.9% 186 4.9% -1 -0.5%Bryan 07 1,018 26.8% 1,068 28.0% 50 4.9%Carter 10 191 5.0% 183 4.8% -8 -4.2%Choctaw 12 146 3.8% 134 3.5% -12 -8.2%Johnston 35 72 1.9% 59 1.5% -13 -18.1%Latimer 39 21 0.6% 25 0.7% 4 19.0%Love 43 31 0.8% 31 0.8% 0 0.0%McCurtain 45 333 8.8% 303 8.0% -30 -9.0%Marshall 48 155 4.1% 138 3.6% -17 -11.0%Pushmataha 64 88 2.3% 88 2.3% 0 0.0%Okla Service Area SA 2,242 58.9% 2,215 58.1% -27 -1.2%Other Okla Counties OTH 612 16.1% 601 15.8% -11 -1.8%
TOTAL IN-STATE OK 2,854 75.0% 2,816 73.9% -38 -1.3%TOTAL TEXAS TX 716 18.8% 764 20.1% 48 6.7%
TOTAL OTHER STATES OS 133 3.5% 100 2.6% -33 -24.8%TOTAL INTERNATIONAL INT 102 2.7% 130 3.4% 28 27.5%
GRAND TOTAL 3,805 100.0% 3,810 100.0% 5 0.1%
Spring 2011 Spring 2012 TOTAL
Enrollment by Geographic Origin
Source: SE Spring Preliminary Enrollment Data Page 14
0
250
500
750
1,000
1,250
1,500
1,750
2,000
2,250
03 07 10 12 35 39 43 45 48 64 SA OTH TX OS INT
Enrollment by Geographic Origin
Spring 2011 Spring 2012
Source: SE Spring Preliminary Enrollment Data Page 14

Spring 20125 Year Comparison by Geographic Origin
(As of January 25, 2012)
Spr 2008 Spr 2009 Spr 2010 Spr 2011 Spr 2012 %DIFFCOUNTY HC HC HC HC HC From Spr 12
Atoka 03 172 165 188 187 186 -0.5%Bryan 07 934 952 1,034 1,018 1,068 4.9%Carter 10 213 201 192 191 183 -4.2%Choctaw 12 150 144 166 146 134 -8.2%Johnston 35 69 73 77 72 59 -18.1%Latimer 39 20 21 26 21 25 19.0%Love 43 53 40 45 31 31 0.0%McCurtain 45 296 275 341 333 303 -9.0%Marshall 48 141 152 153 155 138 -11.0%Pushmataha 64 103 100 80 88 88 0.0%Okla Service Area SA 2,151 2,123 2,302 2,242 2,215 -1.2%Other Okla Counties OTH 583 580 580 612 601 -1.8%
TOTAL IN-STATE OK 2,734 2,703 2,882 2,854 2,816 -1.3%TOTAL TEXAS TX 688 737 803 716 764 6.7%
TOTAL OTHER STATES OS 116 134 141 133 100 -24.8%TOTAL INTERNATIONAL INT 46 58 77 102 130 27.5%GRAND TOTAL 3,584 3,632 3,903 3,805 3,810 0.1%
2008 2009 2010 2011 2012 % Change
38 37 41 39 38 -2.6%
States Represented
Total Number of States
5-Year Comparison by Geographic Origins
Source: SE Spring Preliminary Enrollment Data Page 15
0
500
1,000
1,500
2,000
2,500
3,000
3,500
Spr 2008 Spr 2009 Spr 2010 Spr 2011 Spr 2012
2,734 2,7032,882 2,854 2,816
688 737 803 716 764
116 134 141 133 10046 58 77 102 130
5-Year Comparison by Geographic Origins
Oklahoma Texas Other States International
Source: SE Spring Preliminary Enrollment Data Page 15

Spring 2012International Enrollment by Country
(As of January 25, 2012)COUNTRY OF ORIGIN Spring 2011 Spring 2012 # DIFFAfghanistan 0 1 1Australia 0 1 1Bangladesh 0 1 1Benin 3 3 0Brazil 2 3 1Cameroon 3 4 1Canada 2 6 4Chad 0 1 1China 4 6 2Colombia 2 2 0Congo 1 3 2Cuba 1 0 -1Czech Republic 0 1 1Ecuador 1 0 -1El Salvador 1 1 0France 0 2 2Germany 1 2 1Gabon 13 13 0The Gambia 1 1 0Guinea 1 0 -1Hong Kong 1 1 0Iceland 0 1 1India 4 1 -3Iraq 2 0 -2Ivory Coast 1 2 1Japan 2 1 -1Jordan 3 2 -1Kenya 0 1 1Lativa 0 2 2Maldives 1 0 -1Mexico 9 13 4Moldova 1 0 -1Nepal 23 32 9Nigeria 0 1 1Pakistan 1 1 0Panama 1 1 0Peru 1 1 0Puerto Rico 2 2 0Romania 1 1 0Russia 1 1 0Saudi Arabia 0 1 1Senegal 1 1 0Serbia 0 3 3Slovakia 1 1 0South Africa 1 0 -1Sri Lanka 2 2 0Thialand 0 1 1Taiwan 0 1 1United Kingdom 2 1 -1Vanuatu 1 0 -1Venezuela 2 1 -1Vietnam 1 2 1Zaire 1 1 0TOTALS 102 130 25PERCENT DIFFERENCE 27.5%
Source: SE Spring Preliminary Enrollment Data Page 16

Spring 2012First-Time Freshmen
Enrollment By Ethnicity, Gender & Status(As of January 25, 2012)
CLASS FT PT TOTAL FT PT TOTAL FT PT TOTALCaucasian/White 14 2 16 28 4 32 42 6 48
African Amer/Black 7 0 7 2 0 2 9 0 9Native Amer/Alaskan 10 0 10 10 0 10 20 0 20
Asian 0 1 1 0 0 0 0 1 1Hispanic/Latino 1 0 1 0 0 0 1 0 1
Native Hawaii/Pac Isl 0 0 0 0 0 0 0 0 0International 5 0 5 1 0 1 6 0 6
TOTAL UG 37 3 40 41 4 45 78 7 85
MEN WOMEN TOTAL
Caucasian/White56.5%
AfricanAmer/Black10.6%
First Time Freshmen by Ethnicity
WOMEN;52.9%
First Time Freshmen by Gender
NativeAmer/
Alaskan23.5%
Asian1.2%
Hispanic/Latino1.2%
NativeHawaii/Pac Isl0.0%
Internatnl7.1% MEN;
47.1%
Source: SE Spring Preliminary Enrollment Data Page 17

Spring 2012First-Time Freshmen
Enrollment by Geographic Origin(As of January 25, 2012)
COUNTY HC % of TOTAL HC % of TOTAL # DIFF %DIFFAtoka 03 7 7.8% 7 8.2% 0 0.0%Bryan 07 38 42.2% 43 50.6% 5 13.2%Carter 10 2 2.2% 1 1.2% -1 -50.0%Choctaw 12 3 3.3% 4 4.7% 1 33.3%Johnston 35 0 0.0% 0 0.0% 0 0.0%Latimer 39 0 0.0% 0 0.0% 0 0.0%Love 43 0 0.0% 1 1.2% 1 0.0%McCurtain 45 11 12.2% 9 10.6% -2 -18.2%Marshall 48 8 8.9% 1 1.2% -7 -87.5%Pushmataha 64 2 2.2% 3 3.5% 1 50.0%Okla Service Area SA 71 78.9% 69 81.2% -2 -2.8%Other Okla Counties OTH 4 4.4% 2 2.4% -2 -50.0%
TOTAL IN-STATE 75 83.3% 71 83.5% -4 -5.3%TOTAL TEXAS TX 11 12.2% 6 7.1% -5 -45.5%
TOTAL OTHER STATES OS 3 3.3% 2 2.4% -1 -33.3%TOTAL INTERNATIONAL INT 1 1.1% 6 7.1% 5 500.0%
GRAND TOTAL 90 100.0% 85 100.0% -5 -5.6%
Spring 2011 Spring 2012 TOTAL
First-Time Freshmen Enrollment by Geographic Origin
Source: SE Spring Preliminary Enrollment Data Page 18
0
10
20
30
40
50
60
70
80
03 07 10 12 35 39 43 45 48 64 SA OTH TX OS INT
First-Time Freshmen Enrollment by Geographic Origin
Spring 2011 Spring 2012
Source: SE Spring Preliminary Enrollment Data Page 18

Spring 2012First-Time Transfers*
Enrollment By Ethnicity, Gender & Status(As of January 25, 2012)
CLASS FT PT TOTAL FT PT TOTAL FT PT TOTALCaucasian/White 46 19 65 36 39 75 82 58 140
African Amer/Black 7 3 10 2 3 5 9 6 15Native Amer/Alaskan 20 8 28 23 30 53 43 38 81
Asian 0 0 0 0 0 0 0 0 0Hispanic/Latino 2 0 2 2 2 4 4 2 6
Native Hawaii/Pac Isl 0 0 0 0 0 0 0 0 0International 10 1 11 7 0 7 17 1 18
TOTAL UG 85 31 116 70 74 144 155 105 260
*Based on Student's Input
MEN WOMEN TOTAL
Caucasian/White53.8%
AfricanAmer/Black5.8%
First Time Transfers by Ethnicity
WOMEN55.4%
First Time Transfers by Gender
NativeAmer/
Alaskan31.2%Asian
0.0%
Hispanic/Latino2.3%
NativeHawaii/Pac Isl0.0%
Internatnl6.9%
MEN44.6%
Source: SE Spring Preliminary Enrollment Data Page 19


![rohtak-district...Simpla • 4 9 122 162,423 397.1 + 8'4 I 3,810]bajlar • 466 rll9 123,227 164'4 + 3.2 3,598 Gohina. 336 31' 7 8 147,295 438'4 + 6'3 2,011 I District total 1,797](https://static.fdocuments.us/doc/165x107/6123fbf5d1a24a7962482404/rohtak-district-simpla-a-4-9-122-162423-3971-84-i-3810bajlar-a-466.jpg)

