Preliminary Assessment Report - bristol.gov.uk · This Preliminary Assessment Report for Bristol...
66
Bristol City Council Preliminary Flood Risk Assessment Preliminary Assessment Report June 2011 Bristol City Council Brunel House St. George's Road Bristol BS1 5UY
Transcript of Preliminary Assessment Report - bristol.gov.uk · This Preliminary Assessment Report for Bristol...
Bristol City Council Preliminary Flood Risk Assessment
Preliminary Assessment Report
June 2011
Bristol City Council
Brunel House
St. George's Road
Bristol
BS1 5UY

2011s4891 BCC PFRA final.doc
JBA Office
JBA Consulting Nelson House Langstone Park Priory Drive Newport South Wales NP18 2LH
JBA Project Manager
Peter May
Revision History
Revision Ref / Date Issued Amendments Issued to
Draft v1 10/06/2011 Steven Sodek
Draft v2 16/06/2011 Steven Sodek
Final 22/06/2011 Steven Sodek
Contract
This report describes work commissioned by Steven Sodek, on behalf of Bristol City Council. JBA‟s representative for the contract was Peter May. Peter May, Beth Jones and George Baker of JBA Consulting carried out this work.
Prepared by .................................................. Beth Jones
Analyst
Reviewed by ................................................. Peter May
Technical Director
Purpose
This document has been prepared as a draft report for Bristol City Council. JBA Consulting accepts no responsibility or liability for any use that is made of this document other than by the Client for the purposes for which it was originally commissioned and prepared.
JBA Consulting has no liability regarding the use of this report except to Bristol City Council.

2011s4891 BCC PFRA final.doc
References
Defra and WAG guidance on Flood Risk Areas 2010; Environment Agency (2010 and later amendments) Preliminary Flood Risk Assessment (PFRA) Final guidance and annexes and guidance notes associated with Environment Agency data as dated. Standard text on climate change and development in Sections 5.4 and 5.5 © Environment Agency
Carbon Footprint
874g
A printed copy of the main text in this document will result in a carbon footprint of 874g if 100% post-consumer recycled paper is used and 1113g if primary-source paper is used. These figures assume the report is printed in black and white on A4 paper and in duplex.
JBA is a carbon neutral company and the carbon emissions from our activities are offset.

2011s4891 BCC PFRA final.doc
Executive Summary
This Preliminary Assessment Report for Bristol City Council has been prepared as part of the duties established under the Flood Risk Regulations 2009. It is due for submission to the Environment Agency (EA) by 22nd June 2011. The Regulations transpose and implement the requirements of the European Floods Directive, which aims to provide a consistent approach to managing flood risk across Europe.
The first stage of the process is to undertake a Preliminary Flood Risk Assessment (PFRA). This involves the review of past floods and the potential for future floods, as well as determining and reviewing the presence of any "areas of significant flood risk", the so called Flood Risk Areas. Where such Flood Risk Areas have been determined, on the basis of national guidance issued by Defra and Welsh Assembly Government (WAG), Lead Local Flood Authorities (LLFAs) are required to review, and if necessary propose amendments to, the indicative areas using locally held information. One such indicative Flood Risk Area has been proposed for the Greater Bristol area, one of ten such areas in England. This is centred on the administrative area of Bristol City Council, although also extends a short way into three neighbouring LLFA areas.
Bristol City Council, as a LLFA, has a responsibility under both the Flood Risk Regulations 2009 and the Flood & Water Management Act 2010 for managing local flood risk within its area. To meet this duty, the council has completed the PFRA and assessed the risk of flooding from surface water, groundwater and ordinary watercourses, together with any interaction with drainage systems, sewers and other sources. The EA is responsible for assessing the risk of flooding from main river, the sea and large reservoirs.
The assessment of local flood risk has involved the collection and review of readily available information held by Bristol City Council and partners on past floods across the area. This has been considered in light of national datasets provided by the EA and informed by discussions with the local multi-agency partnership group involving other risk management authorities, including the EA, Wessex Water, the Lower Severn IDB and neighbouring LLFAs. This review has then been informed by the ongoing Surface Water Management Plan (SWMP) work and supplemented by a detailed and objective assessment of the potential risks of future flooding across the area.
The PFRA has been undertaken using JBA Consulting's bespoke analytical GIS "Flood Risk Metrics" software (JFrism). This powerful graphical analysis has allowed a comprehensive study of the flood risk facing people, properties and critical infrastructure across Bristol. The exposure of these and other vulnerable receptors to a range of local flood sources has been assessed on a 1km grid square basis across the entire area. This has allowed the completion of the PFRA and provided the means to analyse and clearly display the risk from different flood sources on a Parish, Ward or entire authority basis. Details of the critical infrastructure and properties at risk will also help inform the multi-agency Emergency Flood Plan and assist in emergency planning.
The PFRA has shown there are approximately 68,300 people, 29,200 residential properties, 5,000 non-residential properties and 200 critical infrastructure sites at risk from surface water flooding across Bristol City Council's administrative area. These figures form the bulk of the wider indicative Flood Risk Area that extends across into the three neighbouring LLFA areas. Within the wider Flood Risk Area, there are approximately 73,900 people, 31,600 residential properties, 5,700 non-residential properties and 200 critical infrastructure sites at risk from surface water flooding. These figures have been derived from the locally agreed Surface Water Management Plan data, in conjunction with the Flood Map for Surface Water Flooding (FMfSWF).

2011s4891 BCC PFRA final.doc
The indicative Flood Risk Area has been further reviewed in light of the locally available information, in particular that obtained and produced as part of the SWMP. This analysis has confirmed there are no proposals to suggest any amendments to the area, or to propose any new Flood Risk Areas. Consequently Bristol City Council and neighbouring partners will have further obligations to prepare Flood Hazard and Risk Maps in 2013 and Flood Risk Management Plans in 2015 as required under the Regulations.
The PFRA process has helped strengthen and underline the importance of partnership working and the need for sharing data and information through the Partnership Group. A comprehensive archive of past floods has been compiled and a database structure exists to record the mandatory information necessary for documenting all future floods. This will greatly ease the PFRA review process in 6 years time.
Understanding and communicating local flood risk in this way will provide the foundations for developing and delivering Bristol City Council's Local Flood Risk Management Strategy. This will be developed over the next year as part of the duties under the Flood & Water Management Act 2010. The Local Flood Risk Management Strategy will define how flood risk is to be assessed and managed across Bristol in future years. The PFRA analysis has provided the opportunity to inform how this future strategy will be taken forward.

2011s4891 BCC PFRA final.doc
Contents
Executive Summary .......................................................................................................... 3
1. Introduction .......................................................................................................... 9
1.1 Scope of the Report ............................................................................................... 9 1.2 Objectives and Approach....................................................................................... 9 1.3 Study Area ............................................................................................................. 11
2. Lead Local Flood Authority Responsibilities ................................................... 14
2.1 Governance and Partnership ................................................................................. 14 2.2 Communication ...................................................................................................... 15
3. Methodology and Data Review ........................................................................... 16
3.1 Information from EA ............................................................................................... 16 3.2 Data Review .......................................................................................................... 18 3.3 Data Availability and Limitations ............................................................................ 19 3.4 Data Management Systems .................................................................................. 20
4. Past Flood Risk .................................................................................................... 22
4.1 Introduction ............................................................................................................ 22 4.2 Significant Harmful Consequences ....................................................................... 22 4.3 Past Flood Events .................................................................................................. 23
5. Future Flood Risk ................................................................................................ 26
5.1 Introduction ............................................................................................................ 26 5.2 Locally Agreed Surface Water Information ............................................................ 27 5.3 Future Floods and Consequences ........................................................................ 29 5.4 The Impacts of Climate Change ............................................................................ 36 5.5 Significant Local Developments ............................................................................ 37
6. Identification of Flood Risk Areas ..................................................................... 38
6.1 Indicative Flood Risk Areas ................................................................................... 38 6.2 New Flood Risk Areas ........................................................................................... 44
7. Next Steps ............................................................................................................ 46
7.1 Review ................................................................................................................... 46 7.2 Local Flood Risk Management Strategy ................................................................ 46
Appendices........................................................................................................................ 48
A.1 Records of past floods and their significant consequences (preliminary assessment report spreadsheet) ........................................................................... 48
A.2 Records of future floods and their consequences (preliminary assessment report spreadsheet) ............................................................................................... 49
A.3 Records of Flood Risk Areas and their rationale (preliminary assessment report spreadsheet) .......................................................................................................... 50
A.4 Review checklist ........................................................................................................... 51 A.5 GIS layer of flood risk area ........................................................................................... 52

2011s4891 BCC PFRA final.doc
List of Figures
Figure 1.1 Bristol City PFRA Area ................................................................................ 11
Figure 1.2 Location Plan Showing Indicative Flood Risk Area and Severn River Basin District Boundary. ......................................................................... 12
Figure 2.1 Flood Risk Partnership Data Sharing Model ........................................... 14
Figure 3.1 Places above Local Flood Risk Threshold ............................................... 17
Figure 3.2 City of Bristol Initial Flood Incident Report Data ..................................... 20
Figure 3.3 City of Bristol Flood Incident Pro-forma and Accompanying Letter ...... 21
Figure 4.1 Location of Past Flood Events .................................................................... 25
Figure 5.1 Hotspot Locations within Bristol ............................................................... 26
Figure 5.2 Clustered Locations above Thresholds ..................................................... 27
Figure 5.3 Residential Properties at Risk of Surface Water Flooding ....................... 32
Figure 5.4 Non Residential Properties at Risk of Surface Water Flooding ............... 33
Figure 5.5 Critical Infrastructure at Risk of Surface Water Flooding ........................ 34
Figure 5.6 Residential properties at Risk of Surface Water Flooding by Ward ........ 35
Figure 6.1 Surface Water Management Extent ............................................................ 39
Figure 6.2 Residential Properties at Risk of Surface Water Flooding - IFRA .......... 41
Figure 6.3 Non Residential Properties at Risk of Surface Water Flooding - IFRA ..................................................................................................................... 42
Figure 6.4 Critical Infrastructure at Risk of Surface Water Flooding - IFRA ........... 43
Figure 6.5 FMfSW v SWMP Hotspot Locations........................................................... 45
List of Tables
Table 3-1 Information and Data Review ...................................................................... 18
Table 4-1 Summary of Past Flood Events and their Consequences ....................... 24
Table 5-1 Predicted Residential Property Counts using SWMP and ....................... 28
FMfSW results for the City of Bristol ............................................................................ 28
Table 5-2 Assessment of Key Flood Risk Indicators for Bristol City Council Area ..................................................................................................................... 30
Table 5-3 Categories of Flood Risk for Local Assessment ........................................ 31
Table 6-1 Predicted Residential Property Counts using FMfSW and the ................ 38
locally agreed SWMP/FMfSW results for the Bristol IFRA ......................................... 38
Table 6-2 Assessment of Key Flood Risk Indicators for Bristol IFRA ..................... 39
Table 6-3 Additional LLFA Critical Infrastructure Analysis ....................................... 40
2011s4891 BCC PFRA final.doc
Abbreviations & Glossary
Term or Abbreviation Definition
AONB Area of Outstanding Natural Beauty
Assets Structures, or a system of structures used to manage flood risk
AStGWF Areas Susceptible to Groundwater Flooding
AStSWF Areas Susceptible to Surface Water Flooding
Catchments An area that serves a river with rainwater. Every part of land where the rainfall drains to a single watercourse is in the same catchment
CFMP Catchment Flood Management Plan
Cultural heritage Buildings, structures and landscape features that have an historic value. These are also known as heritage assets
Defences A structure that is used to reduce the probability of floodwater or coastal erosion affecting a particular area (for example a raised embankment or sea wall)
Defra Department for Environment, Food and Rural Affairs
EC European Commission
EC Inspire Directive Implemented by the 'Inspire Regulations 2009'. The main aim being to improve the quality, consistency and accessibility of spatial data sets and services for environmental data
FCERM Flood and coastal erosion risk management
Flood The temporary covering by water of land not normally covered with water
FMfSW Flood Map for Surface Water
Flood Risk Area An area determined as having a significant risk of flooding in accordance with guidance published by Defra and WAG
FRIS Flood Reconnaissance Information System
FWMA Flood and Water Management Act
GHG Greenhouse Gasses
GIS Geographic Information Systems
Groundwater Water which is below the surface of the ground and in direct contact with the ground or subsoil
HSWGW Historic Surface Water and Groundwater
IDB Internal Drainage Board
Indicative Flood Risk Areas Areas determined by the Environment Agency as indicatively having a significant flood risk, based on guidance published by Defra and WAG and the use of certain national datasets. These indicative areas are intended to provide a starting point for the determination of Flood Risk Areas by LLFAs
Jfrism JBA Consulting's bespoke 'Flood Risk Metrics' GIS tool
LLFA Lead Local Flood Authority

2011s4891 BCC PFRA final.doc
Local flood risk Flood risk from sources other than main rivers, the sea and reservoirs, principally meaning surface runoff, groundwater and ordinary watercourses
Main River A watercourse shown as such on the Main River Map, and for which the Environment Agency has responsibilities and powers
MFP City of Bristol Multi-Agency Flood Plan
NRD National Receptor Dataset – a collection of risk receptors produced by the Environment Agency
Ordinary Watercourses All watercourses that are not designated Main River, and which are the responsibility of Local Authorities or, where they exist, IDBs
Preliminary Assessment Report
A high level summary of significant flood risk, based on available and readily derivable information, describing both the probability and harmful consequences of past and future flooding
Preliminary Assessment Spreadsheet
Reporting spreadsheet which LLFAs need to complete. The spreadsheet will form the basis of the Environment Agency‟s reporting to the European Commission
PFRA Preliminary Flood Risk Assessment
PPS25 Planning Policy Statement 25
Receptor Something that may be harmed by flooding
Regulations The Flood Risk Regulations 2009
Resilience The ability of the community, services, area or infrastructure to withstand the consequences of an incident
Risk Measures the significance of a potential event in terms of likelihood and impact
River basin district There are 11 river basin districts in England and Wales, each comprising a number of contiguous river basins or catchments. The Environment Agency is responsible for collating LLFA reports at a river basin district level
SACs Special Area of Conservation
SFRA Strategic Flood Risk Assessment
Source The origin of a hazard (e.g. heavy rainfall, strong winds, surge etc)
SPAs Special Protection areas
SSSIs Sites of Special Scientific Interest
Surface runoff Rainwater (including snow and other precipitation) which is on the surface of the ground (whether or not it is moving), and has not entered a watercourse, drainage system or public sewer
SWMP Surface Water Management Plan
UKIP09 UK Climate Change Projections 2009
WAG Welsh Assembly Government

2011s4891 BCC PFRA final.doc 9
1. Introduction
1.1 Scope of the Report
Bristol City Council has new duties as a Lead Local Flood Authority (LLFA) to manage local flood risk across its area. The focus of this new role is to assess the flood risk from local sources such as surface water, groundwater and ordinary watercourses. The Environment Agency (EA) is responsible for assessing the risk of flooding from main rivers (such as the River Avon and Frome), the sea and from large reservoirs.
One of the first duties is to complete a Preliminary Flood Risk Assessment (PFRA). This is required as part of the obligations under the Flood Risk Regulations 2009, which transposes and implements the requirements of the European Floods Directive. This aims to manage and reduce the risks that floods pose to human health, the environment, economic activity and cultural heritage, by providing a consistent approach to managing flood risk across Europe.
This Preliminary Assessment Report presents the findings of an assessment of local flood risk and the past and potential future impacts of flooding across Bristol. It has to be provided to the EA by 22nd June 2011 as part of a national submission to be reviewed and then published and sent to the European Commission in December 2011.
The Flood Risk Regulations 2009 establish a flood risk management framework consisting of four stages that will be reviewed on a 6-yearly basis, namely:
To prepare a Preliminary Assessment Report on past floods and potential future floods
To identify Flood Risk Areas (FRAs) where flood risk is deemed nationally significant
To produce appropriate Flood Hazard and Flood Risk Maps for FRAs
To prepare Flood Risk Management Plans for FRAs
This Preliminary Assessment Report presents the outcomes of the first two stages that together make up the PFRA process, namely the assessment of local flood risk and the identification of any Flood Risk Areas, where the risk of flooding is considered nationally significant.
The Defra and Welsh Assembly Government guidance sets out the criteria and thresholds for assessing whether a risk of flooding is of national significance. This confirms that the Bristol area has been defined as one of the 10 indicative FRAs that have been identified in England, based upon nationally available information. The area straddles across three neighbouring LLFA areas - South Gloucestershire; Bath & North East Somerset; and North Somerset - as well as covering the bulk of Bristol City Council's area. This report therefore includes a review of this indicative FRA in respect of locally held information, in particular the data and modelling that relates to the ongoing Bristol Surface Water Management Plan.
For those FRAs that are agreed with the EA and published by December 2011 as areas of significant flood risk, these will be subject to the further stages outlined above, namely the preparation of Flood Hazard and Risk Maps by 2013 and the production of Flood Risk Management Plans by 2015.
1.2 Objectives and Approach
The overall aim and objective of the PFRA process is to carry out a high level exercise designed to make use of all existing and readily available data, in order to review past floods and the potential for future floods across Bristol.

2011s4891 BCC PFRA final.doc 10
The key objectives are to:
Identify partner organisations involved in local flood risk management and engage in the PFRA process through ongoing collaboration
Establish agreed systems for future data management, sharing and storage
Describe the agreed systems and data standards for recording future flood incidents
Describe the adopted approach to the PFRA
Undertake an assessment of past floods across Bristol from local sources of flooding and summarise the consequences and impacts of these events
Assess the potential adverse consequences of future flood events within the area
Review and update the system to enable the recording of all relevant information for future floods
Review the provisional national assessment of indicative Flood Risk Areas provided by the EA and provide explanation and justification for any amendments
The assessment of local flood risk has involved the collection and review of readily available information held by Bristol City Council and partners on past floods across the Bristol area. This has been considered in light of national datasets provided by the EA and further informed by discussions with the local multi-agency partnership group involving other Risk Management Authorities, including the EA, Wessex Water, the Lower Severn Internal Drainage Board (LSIDB) and neighbouring LLFAs.
Previous and current flood risk management studies relevant to the study area that have been reviewed for the purpose of producing this PFRA include the following:
The Shoreline Management Plan
Bristol Avon Catchment Flood Management Plan
BCC Strategic Flood Risk Assessment level 1
BCC Strategic Flood Risk Assessment level 2, including Avonmouth and Severnside
BCC Surface Water Management Plan (ongoing at time of writing)
BCC Central Area Flood Risk Assessment (ongoing at time of writing)
Dundry Hills Flood Risk Assessment (ongoing at time of writing)
This review has then been supplemented by a detailed and objective assessment of the potential risks of future flooding across the area. This has been undertaken using JBA Consulting's bespoke GIS analytical "Flood Risk Metrics" ("JFrism") software, which allows a detailed assessment of the risk from local flood sources to a wide range of receptors and at differing threshold levels. This has helped with the consideration of significant flood risk and the identification of any Flood Risk Areas. It has also provided Bristol City Council with a powerful graphical tool that helps understand and communicate a range of flood risks across the area, capable of being presented at a Parish, Ward or LLFA-wide basis. The decision was taken to invest in and use these GIS tools in order to not only ensure the analysis delivered both the PFRA that is required now, but to also gain efficiencies and avoid duplication of efforts in the preparation of future flood management strategies across the council area.
Understanding and communicating local flood risk in this way will provide the foundations for developing and delivering Bristol City Council's Local Flood Risk Management Strategy. This will be developed later this year as part of the duties under the Flood & Water Management Act 2010. The Local Flood Risk Management Strategy will define how flood risk is to be assessed and managed across Bristol in future years. The PFRA analysis has therefore been used as an opportunity to inform how this future strategy will be taken forward.
The PFRA process is also an opportunity to review, strengthen and promote local partnership and information sharing arrangements between the local Risk Management Authorities. It
2011s4891 BCC PFRA final.doc 11
represents one of the first activities to be performed in accordance with the new requirements established under the Flood & Water Management Act 2010. Roles and responsibilities of operating authorities have now been clarified, as has the need for partner organisations to cooperate and share data and information in a spirit of partnership. This delivers on two of the central recommendations of the Pitt Review into the Summer 2007 floods.
A further objective and outcome of this work is to establish or describe existing agreed data management standards and systems that will be used by Bristol City Council for recording all the critical information relating to all future floods that occur across the area. Records of past floods held by the council and others have been reviewed and consolidated into the spreadsheet contained in Annex 1. This includes a number of mandatory fields that are required as part of the EC reporting duties and provide the template for the new system, such that all flood events are thoroughly recorded in the future. This will ensure that comprehensive records are collected and recorded in the correct format, simplifying the future revision of the PFRA and updating of "past floods" which will be required in 6 years time.
1.3 Study Area
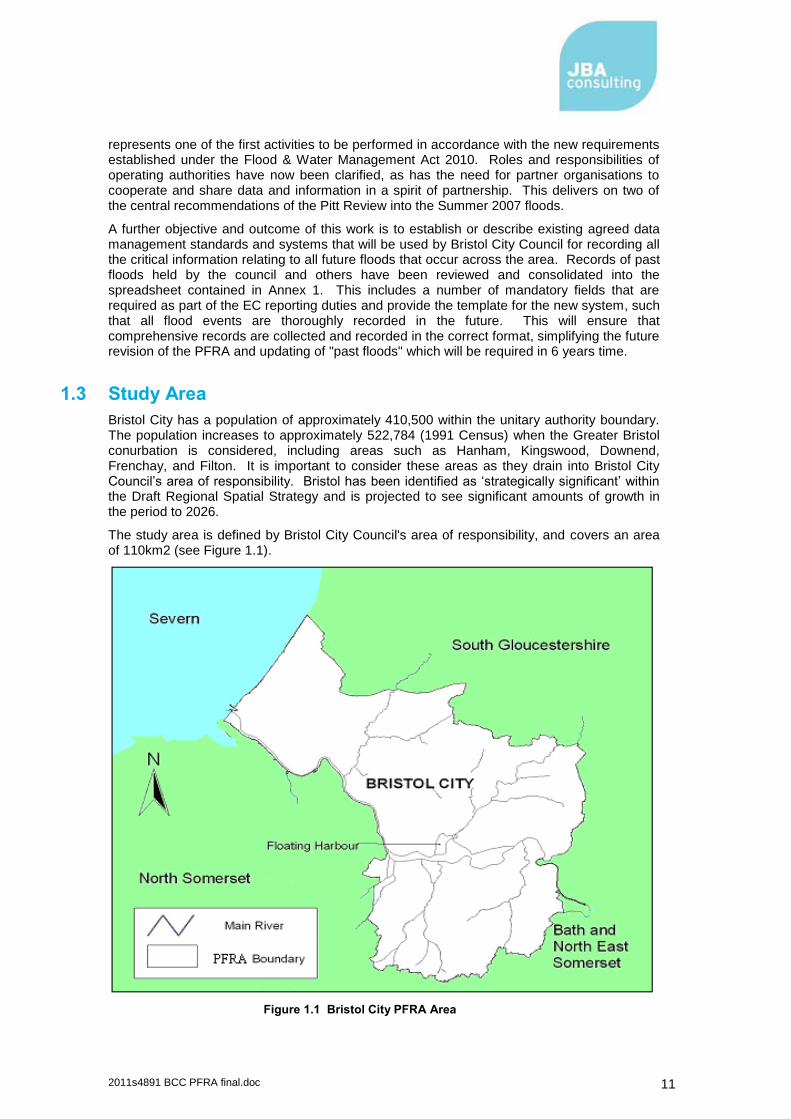
Bristol City has a population of approximately 410,500 within the unitary authority boundary. The population increases to approximately 522,784 (1991 Census) when the Greater Bristol conurbation is considered, including areas such as Hanham, Kingswood, Downend, Frenchay, and Filton. It is important to consider these areas as they drain into Bristol City Council‟s area of responsibility. Bristol has been identified as „strategically significant‟ within the Draft Regional Spatial Strategy and is projected to see significant amounts of growth in the period to 2026.
The study area is defined by Bristol City Council's area of responsibility, and covers an area of 110km2 (see Figure 1.1).
Figure 1.1 Bristol City PFRA Area
2011s4891 BCC PFRA final.doc 12
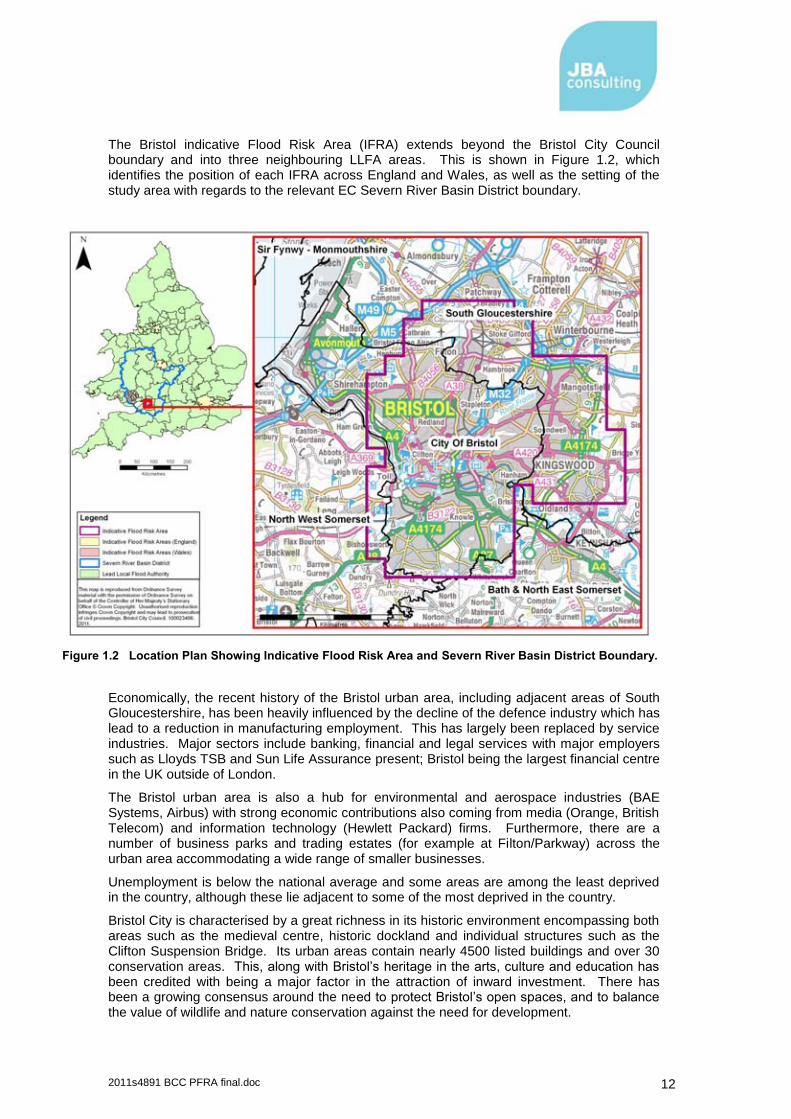
The Bristol indicative Flood Risk Area (IFRA) extends beyond the Bristol City Council boundary and into three neighbouring LLFA areas. This is shown in Figure 1.2, which identifies the position of each IFRA across England and Wales, as well as the setting of the study area with regards to the relevant EC Severn River Basin District boundary.
Figure 1.2 Location Plan Showing Indicative Flood Risk Area and Severn River Basin District Boundary.
Economically, the recent history of the Bristol urban area, including adjacent areas of South Gloucestershire, has been heavily influenced by the decline of the defence industry which has lead to a reduction in manufacturing employment. This has largely been replaced by service industries. Major sectors include banking, financial and legal services with major employers such as Lloyds TSB and Sun Life Assurance present; Bristol being the largest financial centre in the UK outside of London.
The Bristol urban area is also a hub for environmental and aerospace industries (BAE Systems, Airbus) with strong economic contributions also coming from media (Orange, British Telecom) and information technology (Hewlett Packard) firms. Furthermore, there are a number of business parks and trading estates (for example at Filton/Parkway) across the urban area accommodating a wide range of smaller businesses.
Unemployment is below the national average and some areas are among the least deprived in the country, although these lie adjacent to some of the most deprived in the country.
Bristol City is characterised by a great richness in its historic environment encompassing both areas such as the medieval centre, historic dockland and individual structures such as the Clifton Suspension Bridge. Its urban areas contain nearly 4500 listed buildings and over 30 conservation areas. This, along with Bristol‟s heritage in the arts, culture and education has been credited with being a major factor in the attraction of inward investment. There has been a growing consensus around the need to protect Bristol‟s open spaces, and to balance the value of wildlife and nature conservation against the need for development.

2011s4891 BCC PFRA final.doc 13
Understanding and managing flood risk is therefore an essential requirement to help protect and minimise any damage and disruption to the social, cultural, economic and environmental assets of the city. This PFRA helps define these risks and plan for their long-term management.

2011s4891 BCC PFRA final.doc 14
2. Lead Local Flood Authority Responsibilities
2.1 Governance and Partnership
The Flood & Water Management Act 2010 has established an enhanced role for local authorities so that they take on the responsibility for leading the co-ordination of flood risk management in their area. Bristol City Council, as one such Lead Local Flood Authority (LLFA), is responsible for all local flood risk management within its administrative area. This includes flooding which primarily originates from ordinary watercourses, surface water and groundwater sources, as well as any interactions between all sources of flooding, such as from main rivers or the sea, where these could impact upon local sources.
These new duties also define the EA as the responsible body for the management of flood risk from main rivers, large reservoirs and the sea. The EA is also responsible for providing a strategic overview on all flood risk matters and for producing a national strategy for Flood and Coastal Erosion Risk Management (FCERM) for England.
It is evident therefore that close partnership working between all the risk management authorities has been recognised as essential and of the upmost importance for effective flood risk management. Duties to co-operate and share information are now included in the Act and the Regulations. The Flood & Water Management Act also places a responsibility on LLFAs to take the lead and co-ordinate partners in the management of FCERM duties. These responsibilities now form a central principal in the delivery of the PFRA and the future development of Bristol City Council's Local Flood Risk Management Strategy.
It is recognised that it is essential for all stakeholders - such as neighbouring authorities, the EA, Internal Drainage Boards (IDBs), and Water Companies - to be fully engaged and working together to fully understand any flood risk issues that may impact upon the area. Bristol City Council has engaged with the EA, Wessex Water and the Lower Severn Internal Drainage Board (LSIDB) to form a partnership that is led by Bristol City Council. The partnership model for sharing data and maintaining a central Bristol City Council database is shown in Figure 2.1 below.
Figure 2.1 Flood Risk Partnership Data Sharing Model
2011s4891 BCC PFRA final.doc 15
The partnership was established as part of the ongoing Bristol Surface Water Management Plan, in order to improve communication; to develop a shared understanding of surface water flooding issues; and to work together to share data and understanding of key asset ownership and maintenance obligations. It operates under a Memorandum of Understanding which remains in place and has helped the effective management of the PFRA process, proving particularly useful for the sharing of information.
The partnership group will play a crucial role in the future delivery of local flood risk management services. Such partnership working helps facilitate more effective communications with residents at flood risk, as well as provide more co-ordinated emergency response plans and longer term management strategies. It provides the integrated approach as originally recommended by the Pitt Review, helping to deliver the SWMP and PFRA now and to prepare the foundations to the Local Flood Risk Management Strategy required in the future.
2.2 Communication
Communication with partners takes place in the form of regular flood partnership group meetings, providing the forum for regular liaison with and communication between the local risk management authorities. These meetings are chaired and co-ordinated by Bristol City Council, helping to clarify roles and responsibilities as well as to plan for the effective future management of local flood risk. They provide an opportunity for partners to share data, information and knowledge and to agree a co-ordinated plan of flood management and response. This partnership approach helps to optimise locally available resources and experience, as well as to identify funding opportunities and agree local flood risk management priorities
This forum provides the opportunity to communicate this shared understanding and the agreed management actions across the Council and between partner organisations. It also enables the vital link to be made with local communities and members of the public directly affected and at flood risk.
Communication with the public is also achieved primarily through the Bristol City Council website. The flood risk section has recently been revised to provide a comprehensive source of local flood risk information and references to further related material. There is an intention to utilise the Neighbourhood Initiative to increase dialogue with the public, following recent success in gathering historical flooding information from members of the public through a flood event survey. This will help gather information from members of the public about either a very recent flood or perhaps capturing knowledge and experience of past floods.

2011s4891 BCC PFRA final.doc 16
3. Methodology and Data Review
3.1 Information from EA
The methodology for undertaking this PFRA is based upon the national guidance prepared by the EA and the Ministerial Guidance produced by Defra and WAG. The latter provides the thresholds and criteria used for determining Flood Risk Areas where the risk of flooding is identified as significant. The EA guidance has explained the technical detail behind the PFRA, the form of the report and how to apply the Defra/WAG guidance on significant risk.
The EA has also provided CDs containing supporting information and made available national datasets distributed via DataShare. This information has included:
Maps, spreadsheets and GIS layers of all places above local flood risk thresholds (Figure 3.1 - the "blue squares" map) and the clusters then created in determining Flood Risk Areas
Details on the consequences of flooding to cultural, environmental and historic assets and Pollution, Prevention & Control (PPC) sites
Two national datasets showing surface water flooding extents have been made available by the EA to LLFAs, namely:
Areas Susceptible to Surface Water Flooding map (AStSWF) - derived from one rainfall event with three susceptibility bandings: less, intermediate and more.
Flood Map for Surface Water (FMfSW) - derived from two rainfall events dividing into two depth bandings: 1:200 rainfall and 1:200 rainfall deep, as well as 1:30 rainfall and 1:30 rainfall deep.
There are also four national datasets on groundwater flooding detailed in the EA guidance, including the Areas Susceptible to Groundwater Flooding broad-scale map.
In addition, there are details on DataShare of information on past floods, including the Historic Flood Map and Flood Event Outlines, although primarily focussing on flooding from main river and the sea. The Historic Surface Water and Groundwater (HSWGW) Geodatabase has not been available, although it is known that this contains some records originally submitted by local authorities.
Whilst the information above relates to differing flood sources and records of past events, another key dataset provided by the EA and used in the PFRA is the National Receptor Dataset (NRD. This relates to receptor vulnerability to flooding and provides details of social, economic, environmental and cultural receptors including residential properties, hospitals, schools, electricity sub-stations and critical transport infrastructure.
It can be seen from Figure 3.1 that the places where the national thresholds for residential, non-residential and critical infrastructure are exceeded include much of the City of Bristol, areas such as Clifton, Cabot, Ashley Ward; Redland, Cotham and Southville Wards together with other local hotspots.

0 2.5 51.25 KM
HotspotsCity of Bristol BoundaryBristol Indicative Flood Risk Area (IFRA)
This map is reproduced from Ordnance Survey material withthe permission of Ordnance Survey on behalf of the Controller of Her Majesty’s Stationary Office ©Crown Copyright. Unauthorised reproduction infringes Crown Copyright and may lead to prosecution of civil proceedings. Bristol City Council. 100023406. 2011.
OS Licence: Drawing Number:Status:Date: 22/06/2011Drawn by:
Legend
Based on the Flood Map for Surface Water (200 year Deep) which indicates the chance of land flooding to a depth greater than 0.3m during a 1 in 200 year rainfall event.
Bethlyn Jones
DraftFigure 3.1
Places Above Flood Risk Threshold
Hotspots are1km grid squares where at least one of the following flood risk indicators is above the threshold given below (using NRD v1.0):1. Number of People > 2002. Critical Services > 13. Number of Non-Residential Properties > 20Indicators calculated using the EnvironmentAgency's detailed method of counting (based on property outlines).
Local Authority BoundariesCity of Bristol Boundary
± PFRA Analysis City of Bristol
2011s4891 BCC PFRA final.doc 18
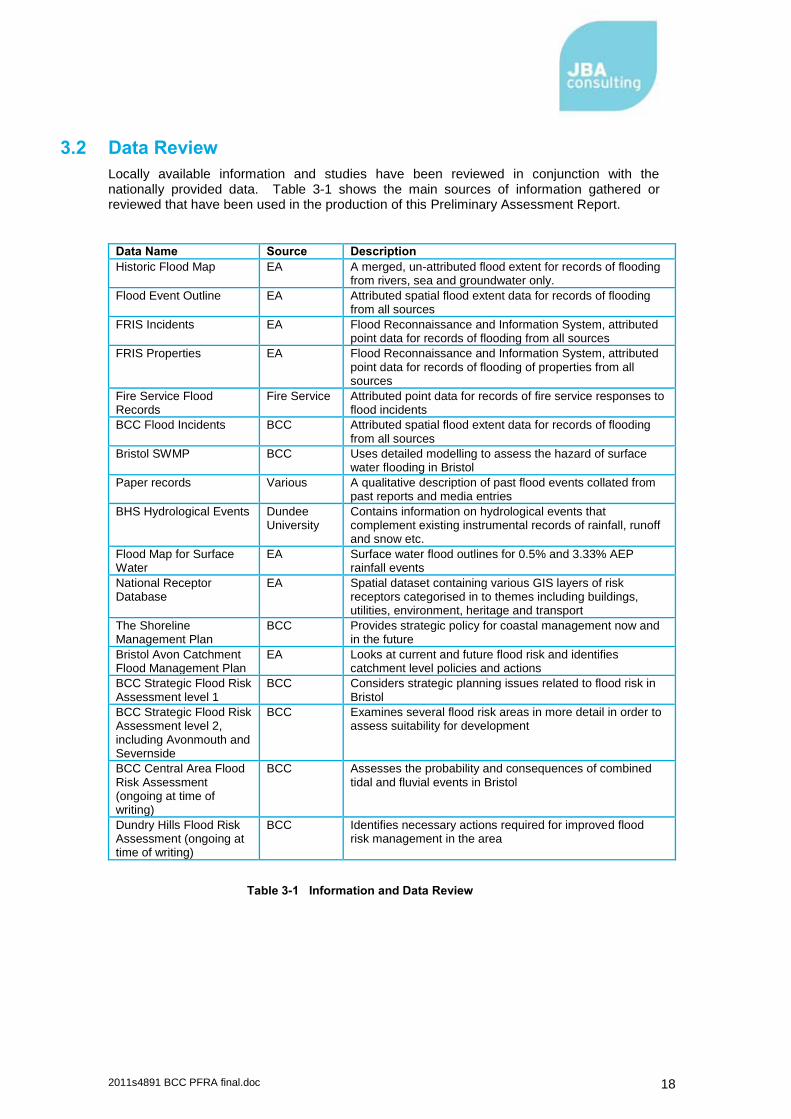
3.2 Data Review
Locally available information and studies have been reviewed in conjunction with the nationally provided data. Table 3-1 shows the main sources of information gathered or reviewed that have been used in the production of this Preliminary Assessment Report.
Data Name Source Description
Historic Flood Map EA A merged, un-attributed flood extent for records of flooding from rivers, sea and groundwater only.
Flood Event Outline EA Attributed spatial flood extent data for records of flooding from all sources
FRIS Incidents EA Flood Reconnaissance and Information System, attributed point data for records of flooding from all sources
FRIS Properties EA Flood Reconnaissance and Information System, attributed point data for records of flooding of properties from all sources
Fire Service Flood Records
Fire Service Attributed point data for records of fire service responses to flood incidents
BCC Flood Incidents BCC Attributed spatial flood extent data for records of flooding from all sources
Bristol SWMP BCC Uses detailed modelling to assess the hazard of surface water flooding in Bristol
Paper records Various A qualitative description of past flood events collated from past reports and media entries
BHS Hydrological Events Dundee University
Contains information on hydrological events that complement existing instrumental records of rainfall, runoff and snow etc.
Flood Map for Surface Water
EA Surface water flood outlines for 0.5% and 3.33% AEP rainfall events
National Receptor Database
EA Spatial dataset containing various GIS layers of risk receptors categorised in to themes including buildings, utilities, environment, heritage and transport
The Shoreline Management Plan
BCC Provides strategic policy for coastal management now and in the future
Bristol Avon Catchment Flood Management Plan
EA Looks at current and future flood risk and identifies catchment level policies and actions
BCC Strategic Flood Risk Assessment level 1
BCC Considers strategic planning issues related to flood risk in Bristol
BCC Strategic Flood Risk Assessment level 2, including Avonmouth and Severnside
BCC Examines several flood risk areas in more detail in order to assess suitability for development
BCC Central Area Flood Risk Assessment (ongoing at time of writing)
BCC Assesses the probability and consequences of combined tidal and fluvial events in Bristol
Dundry Hills Flood Risk Assessment (ongoing at time of writing)
BCC Identifies necessary actions required for improved flood risk management in the area
Table 3-1 Information and Data Review

2011s4891 BCC PFRA final.doc 19
Locally held data and information on past flooding has been collected over the years and has been consolidated into an archive of past flood records. The most comprehensive source of information is contained within Bristol City Councils' database of past flood events, drawn from records held by the Council's Highways Department, as well as reports received from members of the public. This main source of flood event information has been supplemented where possible with records and information from Wessex Water, the EA and the LSIDB. In addition, some records held by the Fire Service have also been incorporated into the database. The Water Company also hold records of historic sewer flooding incidents in the area on their DG5 Registers although these have not been used in the production of this PFRA. They will however provide additional useful information for the partnership group to consider for the future preparation of the Local Flood Risk Management Plan.
The Bristol City Council database has provided the primary resource for the PFRA. However these records had some limitations and were often incomplete so they have been further refined and consolidated into the revised spreadsheet that is contained within Annex 1 to this report.
3.3 Data Availability and Limitations
The data referenced above were readily available, the majority having already been collated for previous and ongoing studies, as well as for day-to-day flood risk management responsibilities. Quality assurance checks were carried out on the flood records, in order to identify and exclude inaccurate or incomplete records. This has improved the quality and reliability of information on past floods, helping to better inform the response to future floods.
The review identified that there were limitations in the value of much of these data, as described further below:
The Historic Flood Map contained spatial extents of flooding caused by main rivers only. The data were therefore not helpful for the analysis of historic flood events from local sources of flooding from surface water, ordinary watercourses and groundwater.
The Flood Event Outlines data, although attributed, also contained spatial extents of flooding caused predominantly by main rivers only. This dataset therefore was also not helpful for the analysis of historic flood events from local sources.
The FRIS incidents data proved most useful in identifying significant past flood events. The only limitation was that it is unknown how complete this dataset is and therefore some historical events may have been overlooked.
The FRIS properties dataset was useful in verifying the locations of past events, however because incident dates were not recorded it was not possible to group incidents by date to determine significant events.
The Fire Service flood records data contained data on incident date, however showed a limited number of records occurring on or around the same date and so contributed little in determining significant events.
The Bristol City Council flood incidents data is a new dataset that records known and reported instances of flooding from 2009 onwards. There were no significant events identified from this data source during this short period of time.
Paper records offered valuable information on significant past events. Exact property numbers were not recorded, however significant events were identified on the basis of the number of reported flooding incidents.
The BHS hydrological events information lacked information on the source and extent of flooding therefore no significant events were identified from this data source.
Restricted data are stored in a secure drive location with limited access to approved Council personnel only. Data licensing requirements were considered and addressed at each stage of the assessment when viewing, storing and sharing information.
2011s4891 BCC PFRA final.doc 20
3.4 Data Management Systems
Through the process of collecting and consolidating information and records on past floods, the existing flood event and data storage system has been updated by the Council. This ensures that future records contain all the necessary data fields and information consistent with the PFRA reporting template set out by the EA in Annex 1. Mandatory fields within the PFRA reporting template are included as well as some of the additional fields that are likely to be required in the future.
All spatial data used in this assessment are captured by the City of Bristol Council in Arc GIS format in order to readily store and view information. It is the intention to continue with this format in to the future. Procedures for recording all future flood incidents going forward are in the process of being put in to place. This system will be shared both right across the various council departments and with the Multi-Agency Partnership Group, enabling interchange of data and the recording of all flood events regardless of responsibility or source.
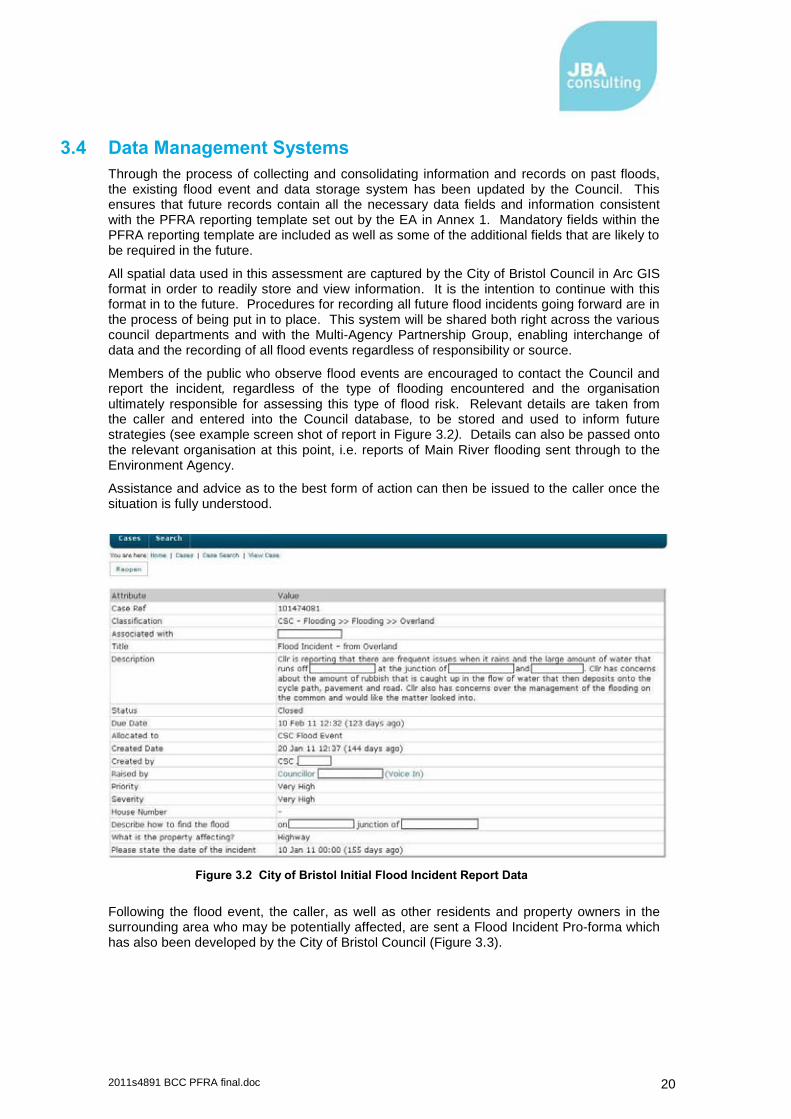
Members of the public who observe flood events are encouraged to contact the Council and report the incident, regardless of the type of flooding encountered and the organisation ultimately responsible for assessing this type of flood risk. Relevant details are taken from the caller and entered into the Council database, to be stored and used to inform future strategies (see example screen shot of report in Figure 3.2). Details can also be passed onto the relevant organisation at this point, i.e. reports of Main River flooding sent through to the Environment Agency.
Assistance and advice as to the best form of action can then be issued to the caller once the situation is fully understood.
Figure 3.2 City of Bristol Initial Flood Incident Report Data
Following the flood event, the caller, as well as other residents and property owners in the surrounding area who may be potentially affected, are sent a Flood Incident Pro-forma which has also been developed by the City of Bristol Council (Figure 3.3).

2011s4891 BCC PFRA final.doc 21
Figure 3.3 City of Bristol Flood Incident Pro-forma and Accompanying Letter
These processes will ensure that all required information on flood events is captured in the future, recorded in the correct format for direct input to future PFRA reviews. It will ensure all local flood events are captured and assessed, providing invaluable records for developing and delivering the Local Flood Risk Management Strategy. It will also serve to simplify the process going forward and make for a more efficient means of submitting the required information on past floods.
The Memorandum of Understanding between local risk management operating authorities addresses the principals of data sharing, co-operation and partnership. At its heart is the agreement for sharing data and information and recording flood event information in a consistent and complete manner, providing an invaluable archive of quality assured flood records.

2011s4891 BCC PFRA final.doc 22
4. Past Flood Risk
4.1 Introduction
This section summarises the relevant information collected and analysed on past floods within the Bristol City Council area from local flood sources. This has been derived from the records described in Section 3 above and is presented in the required format in Annex 1 of this report.
The Flood Risk Regulations refer to past floods which had "significant harmful consequences". However, while the meaning of "significant" has been defined in terms of national risk used to identify Flood Risk Areas, there is no such definition in terms of past floods from local sources. The guidance leaves this for individual LLFAs to determine as circumstances and approaches vary.
4.2 Significant Harmful Consequences
The information provided by the EA shows there are numerous locations across the Bristol area where flood risk from surface water in any 1km
2 grid square exceeds the nationally
defined thresholds (see the "Blue Squares" map in Figure 3.1). The subsequent clustering process described in the Defra/WAG Guidance highlights the extent of potential flood risk across the area. Records of past floods illustrate how there are many areas where local flood risk has been an issue in the past and remains a risk in the future.
The PFRA analysis has therefore been carried out focussing on all these areas, utilising the JBA Consulting JFrism GIS tools to replicate the national analysis and to consider remaining areas across the area. In considering thresholds for local flood risk across Bristol, emphasis has been placed upon ensuring the PFRA process is used to also inform and provide a consistent basis and foundation for the forthcoming Local Flood Risk Management Strategy. There are efficiencies to be gained from dovetailing the two processes and ensuring one consistent approach. This will also avoid any unnecessary duplication of effort.
For the purposes of collating information on past floods for this assessment, the following indicators were used to identify past floods with significant harmful consequences:
5 or more residential properties
1 or more critical services
2 or more non-residential properties
These indicators were chosen to reflect the availability of historical flooding data, in order to identify a suitable number of past flood events with significant harmful consequences. In addition, it should be stressed that the only events included in the identification of past floods are those where the main source of flooding was from a source other than main rivers or the sea. Numerous tidal and fluvial flooding events have therefore been excluded from this report.

2011s4891 BCC PFRA final.doc 23
4.3 Past Flood Events
The following methodology was used in determining significant past flood events. Point data sources were analysed by date in order to group individual incidents into an event. For instances where 5 or more residential properties were flooded; 2 or more non-residential properties flooded; or incidents where one or more critical infrastructure sites were flooded, these have been recorded as distinct flood events and identified as of local significance.
Paper records of past flooding incidents and events were also reviewed and professional judgment was applied to determine significant events. Spatial extent outlines of past flood events were not used to determine significant events due to data limitations described in the data review section.
The list of past flood events and details of associated consequences is presented in Annex 1.
It is important to realise that this record is based on available data only. It is therefore likely to overlook a number of past floods for which historical data are incomplete, unreliable or simply not available. Unreliable or incomplete records have been omitted to ensure the archive contains the best available information, to provide increased confidence in the record of past floods.
The process of analysing historical flood event data and records has emphasised the importance of improving future flood event recording. This is being addressed by Bristol City Council such that all the relevant and necessary information for future flood events will be collected and archived for future reference.
From the many individual entries contained in the original database, an archive of 11 distinct flood events has been prepared, dating back to 1937. Various other instances of flooding are also noted. For each event, details have been provided of the source, location and extent of the flooding. For each event, the human health, economic, environmental and cultural heritage impacts and consequences are detailed where known.
These events record flooding that, for the most part, was caused by natural exceedance from either excessive surface water runoff, or from ordinary watercourse flooding, often in combination with flooding from main rivers and tidal effects. The events were generally short lived (around one day) as is characteristic with surface water flooding, although periods of river flooding lasted longer.
By far the most severe event on record were the "Great Floods of 1968", when over 800 properties were flooded from surface runoff and the River Chew, as a result of an extreme rainfall event over Chew Stoke.
Further details of these and other past floods and their consequences are summarised in Table 4-1 below and reproduced in Annex 1 in full. The general locations of past floods, where known, are show in Figure 4.1.

2011s4891 BCC PFRA final.doc 24
Date Flood Details Consequences
15/07/1937 5 reported incidents around the centre of the city 1 residential property and 2 non-residential properties affected
18/12/1965 10 reported incidents of flooding around Stapleton, thought to be from the Frome main river. Exact source unknown
2 residential properties and 2 non-residential properties affected
10/07/1968 “The great floods of 1968”. Major flooding caused by the river Chew and surface water run-off from Dundry Hills. 175mm rainfall in 18 hours falling on Chew Stoke
805 residential properties flooded.
30/05/1979 40mm rainfall at Horfield between 9am and 4pm. Emergency services called to approx. 150 incidents, with major flooding of premises in Whitchurch, Knowle, Redland, Frenchay and Westbury-on-Trym.
Number of properties flooded not known, internal flooding of more than 5 properties confirmed
09/12/1979 From midnight 8th/9th to the following midnight 32mm of rainfall recorded at Hartcliffe, 28mm at Horfield. 70 reports of flooding relating to 33 separate incidents.
Number of properties flooded not known, internal flooding of more than 5 properties confirmed
29/07/1980 5 reported incidents in North / West of city 5 residential properties and 2 non-residential properties affected
06/03/1982 9 reported incidents, concentrated around Bishopsworth 7 residential properties affected
06/08/1982 12 reported incidents across Bristol, 18mm of rainfall recorded in 1hr 9 residential properties affected
02/08/1984 86mm of rainfall recorded in 24hrs at Horfield, highest since 1968. Majority of the rainfall occurred between 1200 and 1800hrs (80mm). Extensive surface water and foul sewage flooding across the city.
Number of properties flooded not known, extensive surface water flooding across the City confirmed
08/01/1995 72 reported incidents of flooding causing flooding to property, land, and transport routes
19 residential properties and 3 non-residential properties affected
19/01/1999 Several residential and non-residential properties across Bristol 3 residential and 2 non-residential properties affected
Various 40 reported instances of flooding to property in Station Road and Nibley Road, Shirehampton. Main source of flooding recorded as tidal but interaction with drainage and surface water known to be a key issue
Number of properties flooded not known, internal flooding of more than 5 properties confirmed
Table 4-1 Summary of Past Flood Events and their Consequences

##
#
#
##
#
#
##
#
#
#
0 3 61.5 KM
# Location of Past FloodingCity of Bristol Boundary
OS Licence: Drawing Number:Status:Date: 22/06/2011Drawn by:
Legend
Based on information collated by Bristol City Council, where more detailed location information has been provided. All recorded locations of flood events have been plotted. However a number of additional flood events could not be plotted due to incomplete records.
Bethlyn Jones
DraftFigure 4.1
Recorded Locations of Surface Water Flooding
City of Bristol BoundaryLocal Authority Boundaries
± PFRA Analysis City of Bristol
This map is reproduced from Ordnance Survey material with the permission of Ordnance Survey on behalf of the Controller of Her Majesty’s Stationary Office © Crown Copyright. Unauthorised reproduction infringes Crown Copyright and may lead to prosecution of civil proceedings. Bristol City Council. 100023406. 2011.

2011s4891 BCC PFRA final.doc 26
5. Future Flood Risk
5.1 Introduction
This section of the report summarises all relevant information on future floods and provides an essential foundation for informing future flood risk strategies across the area.
The national guidance issued by Defra and WAG sets out the criteria used for defining significant flood risk and the indicative Flood Risk Areas. In developing the methodology for assessing flood risk, threshold levels were defined for the key Flood Risk Indicators as follows:
Number of People > 200
Non-Residential Properties > 20
Critical Infrastructure > 1
Maps of 'Hotspots' or "places above the thresholds" have been produced, defined where 1 km grid squares meet the significance level set for at least one of the key Flood Risk Indicators shown above.
The national data that were provided (shown in Figure 3.1) have been reassessed using the revised NRD (v1.1) provided to LLFAs, resulting in slightly higher property counts. In addition, pumping stations, electricity sub-stations and water supply sites have been included as critical infrastructure sites. This process has resulted in a revised "Hotspots" map which is shown in Figure 5-1.
Figure 5.1 Hotspot Locations within Bristol
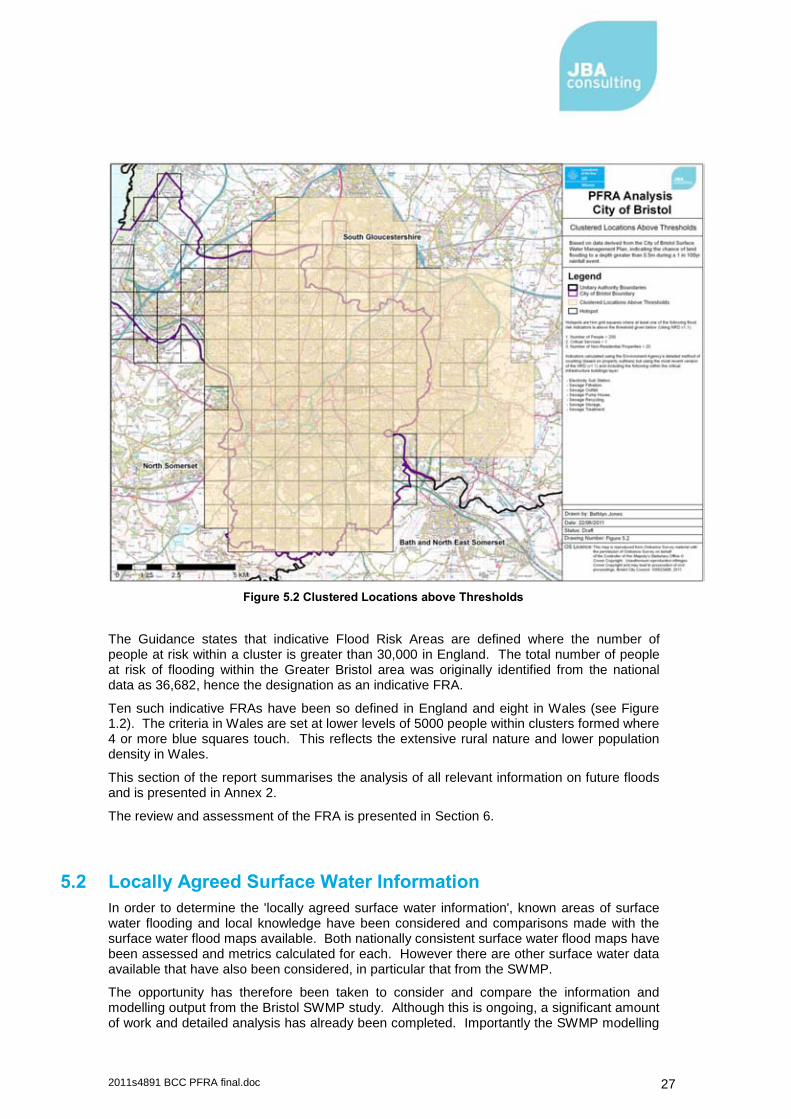
Where 5 or more "hotspots" are touching within a 3km2 roving grid, they are deemed to form
a cluster. Those for Bristol are shown in Figure 5.2.
2011s4891 BCC PFRA final.doc 27
Figure 5.2 Clustered Locations above Thresholds
The Guidance states that indicative Flood Risk Areas are defined where the number of people at risk within a cluster is greater than 30,000 in England. The total number of people at risk of flooding within the Greater Bristol area was originally identified from the national data as 36,682, hence the designation as an indicative FRA.
Ten such indicative FRAs have been so defined in England and eight in Wales (see Figure 1.2). The criteria in Wales are set at lower levels of 5000 people within clusters formed where 4 or more blue squares touch. This reflects the extensive rural nature and lower population density in Wales.
This section of the report summarises the analysis of all relevant information on future floods and is presented in Annex 2.
The review and assessment of the FRA is presented in Section 6.
5.2 Locally Agreed Surface Water Information
In order to determine the 'locally agreed surface water information', known areas of surface water flooding and local knowledge have been considered and comparisons made with the surface water flood maps available. Both nationally consistent surface water flood maps have been assessed and metrics calculated for each. However there are other surface water data available that have also been considered, in particular that from the SWMP.
The opportunity has therefore been taken to consider and compare the information and modelling output from the Bristol SWMP study. Although this is ongoing, a significant amount of work and detailed analysis has already been completed. Importantly the SWMP modelling

2011s4891 BCC PFRA final.doc 28
has taken into account the sub-surface drainage infrastructure in Bristol, a substantial improvement to nationally produced modelling. As a result, further work has been undertaken as part of the PFRA project, to determine whether this locally available dataset advances the understanding of surface water flooding, such that this now forms the "locally agreed surface water information".
The surface water flooding results from the detailed SWMP modelling were obtained and incorporated into a format for reprocessing by the PFRA JFrism analytical tool. This required considerable reprocessing as the SWMP hydraulic modelling of Bristol represents buildings as solid features. This representation of buildings was done to improve the depiction of urban flow paths and is common practice. However, as a consequence modelled rainfall drains quickly off the buildings within the model thereby reporting very shallow flood depth across all building footprints. As a result no surface water flooding is reported for buildings, a fundamental requirement of property counts.
To overcome this problem, the JBA ArcGIS "JPatch" tool was applied to the SWMP results, to generate depth and water level grids from the SWMP modelling. This effectively served to "correct" for the presence of buildings, by interpolating depth and water levels through the buildings. This tool treats the buildings as „holes‟ in rasters and fills them by interpolation of the values in the cells surrounding the “hole”. This method was successfully applied by JBA on the Northern Ireland PFRA.
A detailed check of the patched water level and DTM grids generated by JPatch was undertaken, to verify that the tool correctly interpolated water levels over the building footprints. The depth grid generated from the patched water level and DTM grids was compared to the supplied depth grid. Typically, an increase in water depths occurs within building footprints, where water levels from either side of the building have been interpolated through the structure. An increased extent in flood outline polygons was observed in the patched data for depth outlines. This is due to the increased extent of flooding within building footprints where the depth grid was formerly shallow and has now been interpolated through the structure.
A range of flood depth cut-off values and storm events (100yr and 200yr) for the SWMP data were analysed and processed with the JFrism PFRA tool to determine the predicted numbers of residential properties and people at risk from surface water flooding. The results are presented in Table 5-1 and compared to the results obtained using the Flood Map for Surface Water (FMfSW 200 year deep) which was run both nationally by the EA, and also reassessed by JBA Consulting using the updated NRD v1.1 as mentioned in the above section.
Source Residential Properties
Total People
EA FMfSW 200yr Deep 11,562 27,055
JBA FMfSW 200yr Deep 12,800 29,952
200yr SWMP (0.3m) 63,414 148,388
200yr SWMP (0.5m) 33,817 79,132
100yr SWMP (0.3m) 58,500 136,890
100yr SWMP (0.5m) * 29,200 68,328
Table 5-1 Predicted Residential Property Counts using SWMP and FMfSW results for the City of Bristol
* Locally Agreed Surface Water Information

2011s4891 BCC PFRA final.doc 29
Table 5-1 illustrates the range of testing and analysis which took place in order to fully assess the various types of surface water data available. It is important to note that this addresses just the Bristol City Council area, not the whole indicative FRA. The FMfSW 200yr deep data was reassessed, with the slight increase in property counts explained due to the use of the most up to date version of NRD data (v1.1 compared to that used by the Environment Agency - v1.0); considered to be more accurate and known to contain a greater amount of property points in general. The JFrism PFRA tool was then used to assess the SWMP data derived for the 200yr rainfall event for both 0.3m and 0.5m cut-off depths. Through discussions with members of the City of Bristol Council it was decided that the 0.5m cut-off depth appeared most representative of local flooding, however the rainfall event was not comparative to that of the national data provided.
The FMfSW 200yr event is indicative of a 200yr rainfall scenario, resulting in approximately a 100yr flood event. The 200yr SWMP data however, represents a more "like for like" scenario, where the 200yr rainfall event equates to a 200 year flood, this scenario therefore doubling the flood return period used nationally. JFrism was again used to run the 100yr SWMP data which is comparative to that of the FMfSW 200yr event. Table 5.1 clearly shows that the 100yr SWMP data still predicts significantly higher numbers of residential properties at risk from surface water flooding than the national data. By adopting the more conservative depth cut-off figure (0.5m) still results in the SWMP information predicting over twice the numbers of properties at risk than the FMfSW.
It is important to stress that all of the surface water flood maps and modelled outlines are only indicative. They are not for determining individual property risks. Following discussions between Bristol City Council, the EA, Wessex Water and the neighbouring LLFA partners, it was concluded that as it is the most accurate and up-to-date information available, the SWMP results would be adopted as the locally agreed surface water information.
The SWMP modelling results provide the most detailed and informative picture of risk, however it should be noted that this work is ongoing and dependent upon a number of complex modelling assumptions. Despite this, the SWMP data is still anticipated to be the most accurate and should therefore be taken forward as the locally agreed surface water information and has been used in analysis of future flood risk that is described below.
In making this decision, it is important to stress that the reported risks are potentially much higher than the national mapping suggests. It has therefore been agreed that this decision will be kept under review, with further assessment, for example, being made of surface water interactions with the sub-surface flows through the sewer system. If this work recommends that the locally agreed information be changed, Bristol City Council will re-run the analysis. This could provide important information that will have a significant bearing on the future Hazard and Risk Mapping that will be required by 2013.
The AStSWF map will also be retained and considered in future flood risk assessments as well, in particular as it is deemed to provide a more accurate representation of risk in the flat, low lying areas such as the LSIDB floodplain areas.
5.3 Future Floods and Consequences
Future flood risk has been assessed predominantly using NRD data (version 1.1), supplied to JBA Consulting by Bristol City Council. To replicate the national strategy, flood risk indicators have been calculated using building outlines where appropriate. To derive the number of people at risk of flooding within a given area, building outline counts were multiplied by 2.34, which is the nationally agreed average occupancy per household.
Table 5-2 shows the key flood risk indicators and the counts derived for the SWMP data, both the Areas Susceptible to Surface Water Flooding (1st Generation Surface Water Map - ASTSWF) and the Flood Map for Surface Water Flooding (2nd Generation Surface Water Map), as well as the Areas Susceptible to Ground Water Flooding map (ASTGWF). In addition to this, Flood Zones 2 and 3 were also considered to try and understand any interactions that may take place despite the onus being on the Environment Agency rather than the LLFA with regard to flooding originating from main rivers and the sea.

2011s4891 BCC PFRA final.doc 30
This information has been derived using JBA Consulting's bespoke analytical GIS software (FRiSM). This powerful graphical analysis tool has allowed a comprehensive study of the risk facing people, properties and critical infrastructure across the Greater Bristol area. The exposure of these and other vulnerable receptors to a range of local flood sources has been assessed on a 1km grid square basis across the entire area, also allowing for in-depth analysis and interrogation of the data.
A detailed record of future floods and their possible consequences can be found in Annex 2 but is also summarised below in Table 5-2.
Flood Outline Residential Properties at Flood Risk
No. People at Flood Risk
Critical Infrastructure at Flood Risk
Non Residential Properties at Flood Risk
ASTSWF - Less 31,500 73,700 300 7,900
ASTSWF - Intermediate
15,100 35,300 100 3,900
ASTSWF - More 4,200 9,800 0 1,000
FMfSW - 30 year 12,900 31,200 100 3,000
FMfSW - 30 year Deep 3,100 7,300 0 800
FMfSW - 200 year 36,300 84,900 300 7,400
FMfSW - 200 year Deep
12,800 30,000 100 2,500
Bristol SWMP 29,200 68,300 200 5,000
ASTGWF - - - -
Flood Zone 3 4,300 10,100 100 3,100
Flood Zone 2 10,300 24,100 200 5,100
Table 5-2 Assessment of Key Flood Risk Indicators for Bristol City Council Area
*Locally agreed surface water information - rounded to nearest 100
As Table 5-2 illustrates, the key flood risk indicators have also been assessed in respect of the Areas Susceptible to Ground Water Flooding map (AStGWF). However this information is both very broad scale and only really addresses locations of alluvial drift. It is known that there are very few instances of groundwater flooding and that these are in general also associated with areas of surface water flooding. It is important to note that results would provide an unreliable and inaccurate picture of risk to properties. Consequently it is recommended that the groundwater information is too broadscale and should not be taken forward in any future assessment until more detailed local assessments are available.
The assessment of future flood risk was also extended to include the EA main river Flood Zones 2 and 3. These were considered to help the understanding of any interactions that may take place between local flood sources of risk and main river. However the EA is responsible for main river assessments rather than the LLFA, so this has not been considered further other than to determine possible interactions.
As has been stated, the PFRA stage of the Regulations has also been used to provide the basis for a flood assessment for the Local Flood Risk Management Strategy. Whilst national thresholds have been established for the key flood risk indicators to define significance (see Section 5.1 above), LLFAs are encouraged to consider the full range of local flood risk across their area in addition to any areas of "significant risk". In view of the flooding issues across the area, a further set of thresholds for residential properties - and therefore people - at risk of surface water flooding has been established. This provides additional categories of "low", "medium" and "high" risk below "significant". In this way, the scale of risk and consequence can be assessed and prioritised across the City of Bristol.

2011s4891 BCC PFRA final.doc 31
CATEGORY NUMBER OF PEOPLE
NUMBER OF PROPERTIES
LOW RISK >1 – 20 people 1 - 9 properties
MEDIUM RISK 21-99 people 10 - 42 properties
HIGH RISK 100-199 people 43 - 85 properties
SIGNIFICANT RISK >200 people >85 properties
Table 5-3 Categories of Flood Risk for Local Assessment
Using these locally applied thresholds, it is possible to analyse and produce an extensive suite of maps, to illustrate a range of flood sources affecting different indicators. Furthermore, these can be presented at any scale and on a Ward or City-wide basis. This will be of value in taking the management of flood risk forward in preparing the local strategy.
Figures 5.3 to 5.6 illustrate the range of maps produced as part of the PFRA process, using the City of Bristol Surface Water Management Plan data for the 100yr rainfall event, at a flood depth of 0.5m as the agreed surface water information.
Figure 5.3 (Residential Properties at Risk of Surface Water Flooding), identifies that there is significant risk of surface water flooding to the majority of the City of Bristol, with the most extensive flooding identified throughout the central area. The greatest amount of properties anticipated to be at risk of surface water flooding within a single kilometre grid square are located in the Clifton area, with 1614 properties affected. This is followed by 1252 properties located in and around Montpelier (nothern Ashley Ward), and 1188 properties within Redland.
Figure 5.5 shows a fairly even distribution of critical infrastructure sites at risk of surface water flooding throughout the City, with 91 of 150 grid squares containing at least 1 critical infrastructure building at risk. The grid square containing the greatest amount of risk (8 critical infrastructure buildings) is located to the south of Montpelier, located within Ashley Ward. Here there are 2 buildings of education that are thought to be at risk, along with an ambulance station (which falls within Cabot Ward), a telecommunications site and 2 electricity sub-stations. 8 critical infrastructure buildings are also at risk in Kingsdown which neighbours Ashley Ward.
In total, 8 pre-school buildings and 59 buildings of education, ranging from nursery, primary to further education collages are all predicted to be at risk of surface water flooding when using the SWMP data. 3 police services buildings which are located in Bishopsworth, Southville and Cotham Wards and the aforementioned Ambulance station in Cabot Ward. 2 Fire Stations in Lawrence Hill and Brislington East Wards as well as 4 hospitals, 3 of which are located in Cabot Ward and the final one in Brislington West Ward. 93 Electrictity Sub-Stations/Electricity Generating sites, 17 Telecommunication, 4 Nursing Homes, 1 Nurses home, 1 Water Regulating site and 1 Prison located in Bishopston Ward are all predicted to be at risk of surface water flooding.
On a Ward basis, Figure 5.6 shows that Cabot, Clifton, Clifton East and Ashely Wards are all deemed to be at significant risk of surface water flooding to residential properties. The analysis shows there are 2301 residential properties at flood risk within Cabot Ward, however this includes a number of house boats moored within the floating harbour. There are also in excess of 1,500 upper floor flats. These have been included within the analysis as flooding to the lower levels of apartment blocks will ultimately cause disruption to the upper levels as well.
These maps and analyses provide examples of the many outputs that are possible. They show how flood risk can be assessed and illustrated across the county and the benefits this will provide in preparing the local strategy and managing the risks identified.

North Somerset
South Gloucestershire
Bath and North East Somerset
Unitary Authority BoundariesCity of Bristol BoundaryHotspots
Human Health: Residential Properties
None Low Risk (0.01 - 9.99)Medium Risk (10 - 42.99)High Risk (43 - 85.5)Significant(85.51 - 1614)
0 2 41 KM
±
Hotspots are1km grid squares where at least one of the following flood risk indicators is above the threshold given below:1. Number of People > 2002. Critical Services > 13. Number of Non-Residential Properties > 20Indicators calculated using the EnvironmentAgency's detailed method of counting (based on property outlines).
This map is reproduced from Ordnance Survey material with the permission of Ordnance Survey on behalf of the Controller of Her Majesty’s Stationary Office © Crown Copyright. Unauthorised reproduction infringes Crown Copyright and may lead to prosecution of civil proceedings. Bristol City Council. 100023406. 2011.
OS Licence: Drawing Number:Status:Date: 22/06/2011Drawn by: Bethlyn Jones
DraftFigure 5.3
Legend
Based on data derived from the City of Bristol Surface Water Management Plan, indicating the chance of land flooding to a depth greater than 0.5m during a 1 in 100yrrainfall event.
Residential Properties At Risk Of Surface Water Flooding
PFRA Analysis City of Bristol

North Somerset
South Gloucestershire
Bath and North East Somerset
0 2.5 51.25 KM
Unitary Authority BoundariesCity of Bristol BoundaryHotspot
Economic: Non-Residential Properties
None Low Risk (0.01 - 9.99)Medium Risk (10 - 14.99)High Risk (15 - 19.99)Significant(20 - 410)
Hotspots are1km grid squares where at least one of the following flood risk indicators is above the threshold given below:1. Number of People > 2002. Critical Services > 13. Number of Non-Residential Properties > 20Indicators calculated using the EnvironmentAgency's detailed method of counting (based on property outlines).
This map is reproduced from Ordnance Survey material with the permission of Ordnance Survey on behalf of the Controller of Her Majesty’s Stationary Office © Crown Copyright. Unauthorised reproduction infringes Crown Copyright and may lead to prosecution of civil proceedings. Bristol City Council. 100023406. 2011.
OS Licence: Drawing Number:Status:Date: 22/06/2011Drawn by: Bethlyn Jones
DraftFigure 5.4
Legend
Based on data derived from the City of Bristol Surface Water Management Plan, indicating the chance of land flooding to a depth greater than 0.5m during a 1 in 100yrrainfall event.
Non-residential Properties At Risk Of Surface Water Flooding
PFRA Analysis City of Bristol

North Somerset
South Gloucestershire
Bath and North East Somerset0 2.5 51.25 KM
Unitary Authority BoundariesCity of Bristol BoundaryHotspot
Human Health: Critical Infrastructure
None Low Risk Medium Risk High Risk (0.01 - 0.99)Significant(1 - 9)
Hotspots are1km grid squares where at least one of the following flood risk indicators is above the threshold given below:1. Number of People > 2002. Critical Services > 13. Number of Non-Residential Properties > 20Indicators calculated using the EnvironmentAgency's detailed method of counting (based on property outlines).
This map is reproduced from Ordnance Survey material with the permission of Ordnance Survey on behalf of the Controller of Her Majesty’s Stationary Office © Crown Copyright. Unauthorised reproduction infringes Crown Copyright and may lead to prosecution of civil proceedings. Bristol City Council. 100023406. 2011.
OS Licence: Drawing Number:Status:Date: 22/06/2011Drawn by: Bethlyn Jones
DraftFigure 5.5
Legend
Based on data derived from the City of Bristol Surface Water Management Plan, indicating the chance of land flooding to a depth greater than 0.5m during a 1 in 100yrrainfall event.
Critical Infrastructure At Risk Of Surface Water Flooding
PFRA Analysis City of Bristol
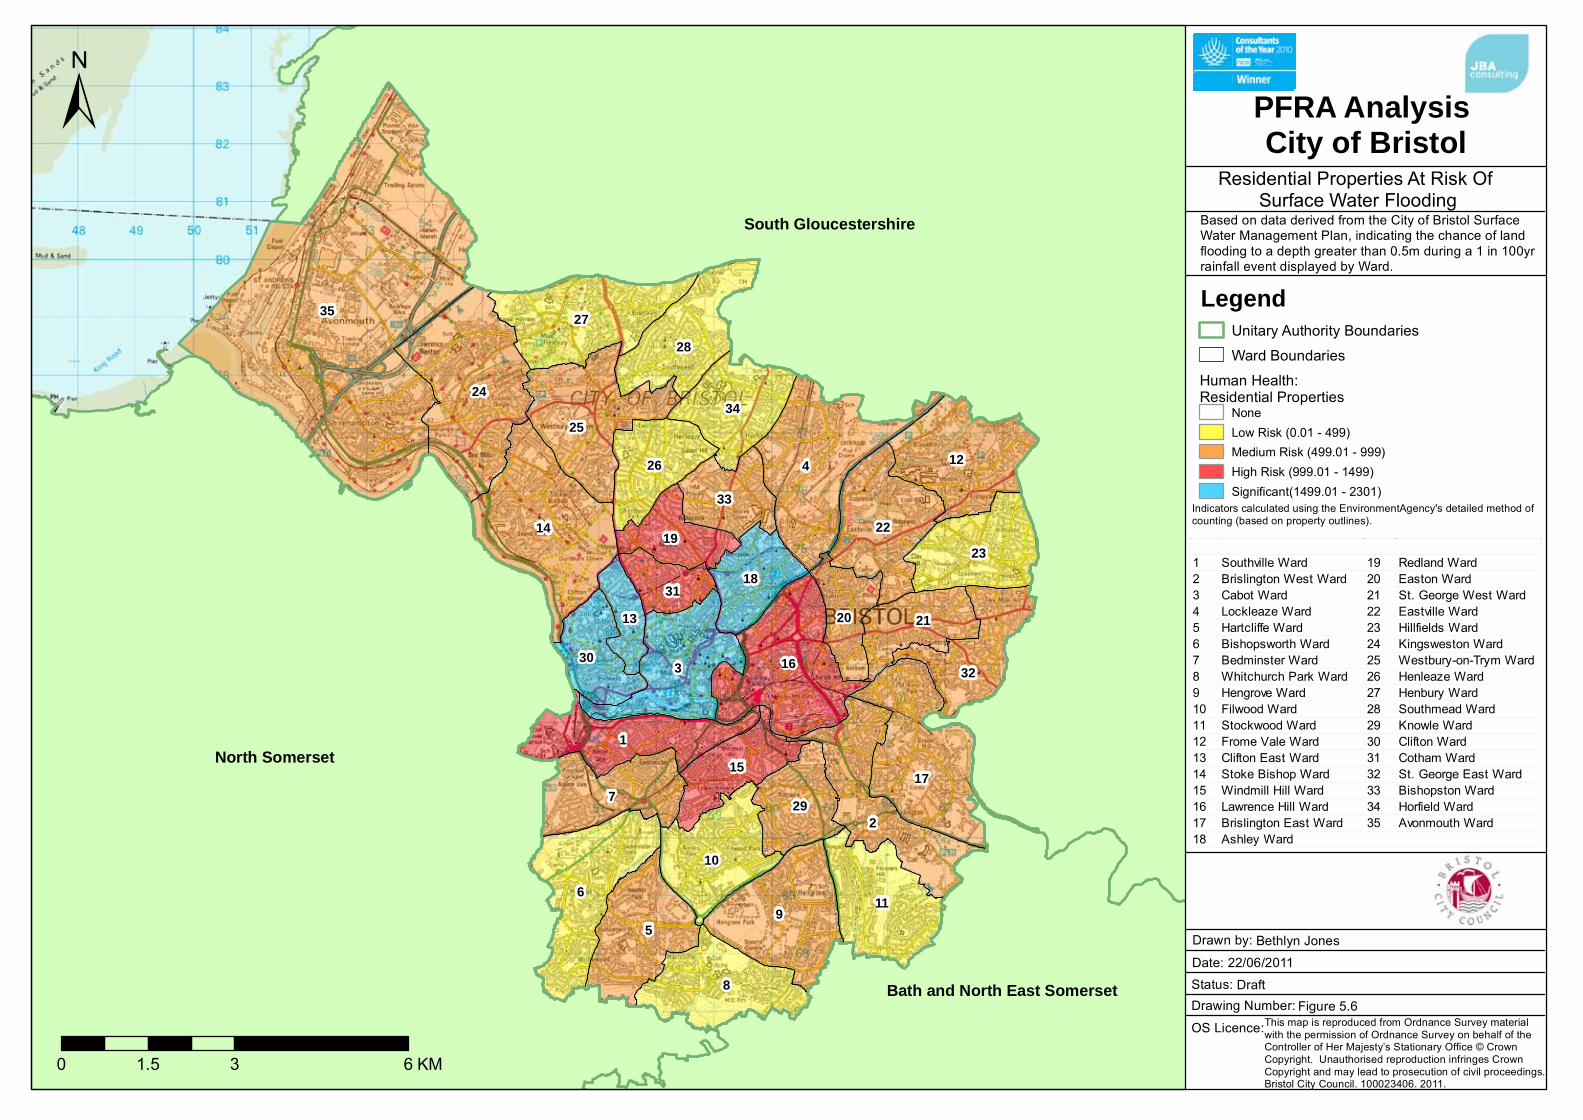
North Somerset
South Gloucestershire
Bath and North East Somerset
35
4
69
2
24
14
3
8
5
1
16
177
25
27
12
11
22
28
10
23
34
32
26
29
21
15
18
33
30
19
2031
13
0 3 61.5 KM
Unitary Authority BoundariesWard Boundaries
Human Health: Residential Properties
None Low Risk (0.01 - 499)Medium Risk (499.01 - 999)High Risk (999.01 - 1499)Significant(1499.01 - 2301)
ID Ward ID Ward1 Southville Ward 19 Redland Ward2 Brislington West Ward 20 Easton Ward3 Cabot Ward 21 St. George West Ward4 Lockleaze Ward 22 Eastville Ward5 Hartcliffe Ward 23 Hillfields Ward6 Bishopsworth Ward 24 Kingsweston Ward7 Bedminster Ward 25 Westbury-on-Trym Ward8 Whitchurch Park Ward 26 Henleaze Ward9 Hengrove Ward 27 Henbury Ward10 Filwood Ward 28 Southmead Ward11 Stockwood Ward 29 Knowle Ward12 Frome Vale Ward 30 Clifton Ward13 Clifton East Ward 31 Cotham Ward14 Stoke Bishop Ward 32 St. George East Ward15 Windmill Hill Ward 33 Bishopston Ward16 Lawrence Hill Ward 34 Horfield Ward17 Brislington East Ward 35 Avonmouth Ward18 Ashley Ward
±
This map is reproduced from Ordnance Survey material with the permission of Ordnance Survey on behalf of the Controller of Her Majesty’s Stationary Office © Crown Copyright. Unauthorised reproduction infringes Crown Copyright and may lead to prosecution of civil proceedings. Bristol City Council. 100023406. 2011.
OS Licence: Drawing Number:Status:Date: 22/06/2011Drawn by: Bethlyn Jones
DraftFigure 5.6
Legend
Based on data derived from the City of Bristol Surface Water Management Plan, indicating the chance of land flooding to a depth greater than 0.5m during a 1 in 100yrrainfall event displayed by Ward.
Residential Properties At Risk Of Surface Water Flooding
PFRA Analysis City of Bristol
Indicators calculated using the EnvironmentAgency's detailed method of counting (based on property outlines).

2011s4891 BCC PFRA final.doc 36
5.4 The Impacts of Climate Change
The Evidence
There is clear scientific evidence that global climate change is happening now. It cannot be ignored.
Over the past century around the UK we have seen sea level rise and more of our winter rain falling in intense wet spells. Seasonal rainfall is highly variable. It seems to have decreased in summer and increased in winter, although winter amounts changed little in the last 50 years. Some of the changes might reflect natural variation, however the broad trends are in line with projections from climate models.
Greenhouse gas (GHG) levels in the atmosphere are likely to cause higher winter rainfall in future. Past GHG emissions mean some climate change is inevitable in the next 20-30 years. Lower emissions could reduce the amount of climate change further into the future, but changes are still projected at least as far ahead as the 2080s.
We have enough confidence in large scale climate models to say that we must plan for change. There is more uncertainty at a local scale but model results can still help us plan to adapt. For example we understand rain storms may become more intense, even if we can‟t be sure about exactly where or when. By the 2080s, the latest UK climate projections (UKCP09) are that there could be around three times as many days in winter with heavy rainfall (defined as more than 25mm in a day). It is plausible that the amount of rain in extreme storms (with a 1 in 5 annual chance or rarer) could increase locally by 40%.
Key Projections for Severn River Basin District
If emissions follow a medium future scenario, UKCP09 projected changes by the 2050s relative to the recent past are:
Winter precipitation increases of around 12% (very likely to be between 2 and 26%)
Precipitation on the wettest day in winter up by around 9% (very unlikely to be more than 22%)
Relative sea level at Bristol very likely to be up between 10 and 40cm from 1990 levels (not including extra potential rises from polar ice sheet loss)
Peak river flows in a typical catchment likely to increase between 9 and 18%
Increases in rain are projected to be greater at the coast and in the south of the district.
Implications for Flood Risk
Climate change can affect local flood risk in several ways. Impacts will depend on local conditions and vulnerability.
Wetter winters and more of this rain falling in wet spells may increase river flooding along the Severn and its tributaries. More intense rainfall causes more surface runoff, increasing localised flooding and erosion. In turn, this may increase pressure on drains, sewers and water quality. Storm intensity in summer could increase even in drier summers, so we need to be prepared for the unexpected.
Drainage systems in the district have been modified to manage water levels and could help in adapting locally to some impacts of future climate on flooding, but may also need to be managed differently. Rising sea or river levels may also increase local flood risk inland or away from major rivers because of interactions with drains, sewers and smaller watercourses.
Where appropriate, we need local studies to understand climate impacts in detail, including effects from other factors like land use. Sustainable development and drainage will help us adapt to climate change and manage the risk of damaging floods in future.

2011s4891 BCC PFRA final.doc 37
Adapting to Change
Past emission means some climate change is inevitable. It is essential we respond by planning ahead. We can prepare by understanding our current and future vulnerability to flooding, developing plans for increased resilience and building the capacity to adapt. Regular review and adherence to these plans is key to achieving long-term, sustainable benefits.
Although the broad climate change picture is clear, we have to make local decisions against deeper uncertainty. We will therefore consider a range of measures and retain flexibility to adapt. This approach, embodied within flood risk appraisal guidance, will help to ensure that we do not increase our vulnerability to flooding.
5.5 Significant Local Developments
It is possible that long term developments might affect the occurrence and significance of flooding. However current planning policy aims to prevent new development from increasing flood risk.
In England, Planning Policy Statement 25 (PPS25) on development and flood risk aims to "ensure that flood risk is taken into account at all stages in the planning process to avoid inappropriate development in areas at risk of flooding, and to direct development away from areas at highest risk. Where new development is, exceptionally, necessary in such areas, policy aims to make it safe without increasing flood risk elsewhere and where possible, reducing flood risk overall". In addition, the Bristol Core Strategy Policy BCS16 requires that water management measures be used to reduce surface water run-off to minimise its contribution to flood risk elsewhere.
Adherence to Government and local policy ensures that new development does not increase local flood risk. However, in exceptional circumstances the Local Planning Authority may accept that flood risk can be increased contrary to Government policy, usually because of the wider benefits of a new or proposed major development. Any exceptions would not be expected to increase risk to levels which are "significant" (in terms of the Government's criteria).

2011s4891 BCC PFRA final.doc 38
6. Identification of Flood Risk Areas
6.1 Indicative Flood Risk Areas
The Bristol indicative Flood Risk Area has been assessed and identified as such by the Environment Agency through their national, strategic assessment of flood risk. This has been carried out to support LLFAs in their new role under the Flood and Water Management Act (2010), and to provide nationally consistent surface water information.
The national guidance issued by Defra and WAG sets out the criteria used for defining significant flood risk and the indicative Flood Risk Areas. In developing the methodology for assessing flood risk, threshold levels were defined for the key Flood Risk Indicators as follows:
Number of People > 200
Non-Residential Properties > 20
Critical Infrastructure > 1
Maps of 'Hotspots' or "places above the thresholds" were produced, defined where 1 km grid squares meet the significance level set for at least one of the key Flood Risk Indicators shown above.
Where 5 or more "hotspots" were touching within a 3km2 roving grid, they were deemed to
form a cluster and if the amount of people at risk of surface water flooding within this cluster exceeded 30,000 it was then classed as an indicative Flood Risk Area (IFRA).
The national strategy identified 10 such IFRAs within England, with the Bristol IFRA showing that 36,681 people were at potential risk of surface water flooding, assessed by the Environment Agency using the FMfSW 200yr Deep scenario.
As part of this PFRA, the national data provided by the Environment Agency have been reassessed using the revised NRD (v1.1) which was also provided to LLFAs, using the JBA JFrism PFRA tool. In addition to this, property counts were derived using the locally agreed 100yr SWMP surface water information, as detailed in section 5.2 of this report. Comparisons between the different data sets could then be made, the results of which can be seen in Table 6-1.
Coverage of the SWMP data extends to the City of Bristol boundary; however it does not cover the whole of the IFRA area as this analysis was carried out solely by the City of Bristol Council. Areas of the IFRA which fall under the jurisdiction of South Gloucestershire, North Somerset or Bath and North East Somerset and are not covered by the SWMP have been assessed using the FMfSW 200yr Deep scenario (Figure 6.1).
Source Residential Properties
Total People
EA FMfSW 200yr Deep 15,676 36,681
JBA FMfSW 200yr Deep 17,108 40,033
100yr SWMP (0.5m)* 31,600 73,944
Table 6-1 Predicted Residential Property Counts using FMfSW and the locally agreed SWMP/FMfSW results for the Bristol IFRA
*Locally Agreed Surface Water Information

2011s4891 BCC PFRA final.doc 39
Figure 6.1 Surface Water Management Extent
Table 6-1 again identifies that by using the 100yr SWMP data, the number of properties predicted to be at risk of surface water flooding is over double that of the national data supplied by the Environment Agency. As the locally agreed surface water information, this SWMP data has been used to derive the final property counts for the Bristol IFRA. The key results of the analysis can be found in Table 6-2 below, with further detail provided in the Annex 3 spreadsheet.
Area Residential Properties at Flood Risk
No. People at Flood Risk
Critical Infrastructure at Flood Risk
Non Residential Properties at Flood Risk
Bristol FRA - total 31,600 73,944 200 5,700
City of Bristol 27,600 64,584 200 4,600
South Gloucestershire 3,900 9,126 0 1000
North Somerset 100 234 0 100
Bath & NE Somerset 100 234 0 0
Table 6-2 Assessment of Key Flood Risk Indicators for Bristol IFRA
Rounded to nearest 100

2011s4891 BCC PFRA final.doc 40
Figures 6.2 to 6.4 illustrate the above results, the maps produced as part of the PFRA process, using the locally agreed surface water information (100yr SWMP 0.5m/ FMfSW combination).
Figure 6.2 (Residential Properties at Risk of Surface Water Flooding), identifies that there is significant risk of surface water flooding throughout the IFRA, with the most extensive flooding identified throughout the centre of the City of Bristol. The greatest amount of properties anticipated to be at risk of surface water flooding within a single kilometre grid square are located in the Clifton area, with 1614 properties affected. This is followed by 1252 properties located in and around Montpelier (northern Ashley Ward), and 1188 properties within Redland.
Figure 6.3 shows the distribution of non-residential properties predicted to be at risk from the agreed SWMP data, which again shows significant flooding throughout the IFRA. Key areas have been identified as central Bristol City, where 410 non-residential properties are at risk within a single kilometre grid square (within the Kingsdown area of the City). Outside of the City of Bristol LLFA, there is a clustering of significant risk cells located around Oldland and Stoke Gifford; both of which are found within the South Gloucestershire LLFA boundary.
Figure 6.4 shows a fairly even distribution of critical infrastructure sites at risk of surface water flooding throughout the IFRA, with 101 of 219 grid squares containing at least 1 critical infrastructure building at risk. The grid square containing the greatest amount of risk (8 critical infrastructure buildings) is located to the south of Montpelier, located within Ashley Ward at the centre of Bristol City. 8 critical infrastructure buildings are also at risk in Kingsdown which neighbours Ashley Ward. A more detailed breakdown of the critical infrastructure buildings predicted to be at risk from this flood source within each LLFA can be found in Table 6-3 below.
These maps and analyses provide examples of the many outputs that are possible. They show how flood risk can be assessed and illustrated across the indicative Flood Risk Area as a whole and the benefits this will provide in preparing the local strategy, ensuring a consistent approach across the IFRA and managing the risks identified in an efficient and inclusive manor.
LLFA Additional Critical Infrastructure Analysis
City of Bristol 184 Critical Infrastructure buildings including: 7 preschool and 54 buildings of education, from nursery, primary to further education collages. 3 police services located in Bishopsworth, Southville and Cotham Wards as well as 1 ambulance station in Cabot Ward. 2 fire stations in Lawrence Hill and Brislington East Wards as well as 4 hospitals, 3 of which are located in Cabot ward and the last in Brislington ward. 84 electricity sub stations/electricity generating sites, 19 telecommunication sites, 4 nursing homes, 1 nurses home, 1 water regulating site in Westbury -on-Trym and 1 prison located in Bishopston Ward.
South Gloucestershire 41 Critical Infrastructure buildings affected including: 12 buildings of education, from nursery, primary to further education collages. 24 electricity sub stations, 1 gas regulating site 4 telecommunication and 1 pumping site.
North Somerset 1 Critical Infrastructure building affected which is an electricity substation located in Long Ashton.
Bath & NE Somerset 3 Critical Infrastructure buildings affected including: Whitchurch Primary School, 1 electricity substation and 1 telecommunication site.
Table 6-3 Additional LLFA Critical Infrastructure Analysis
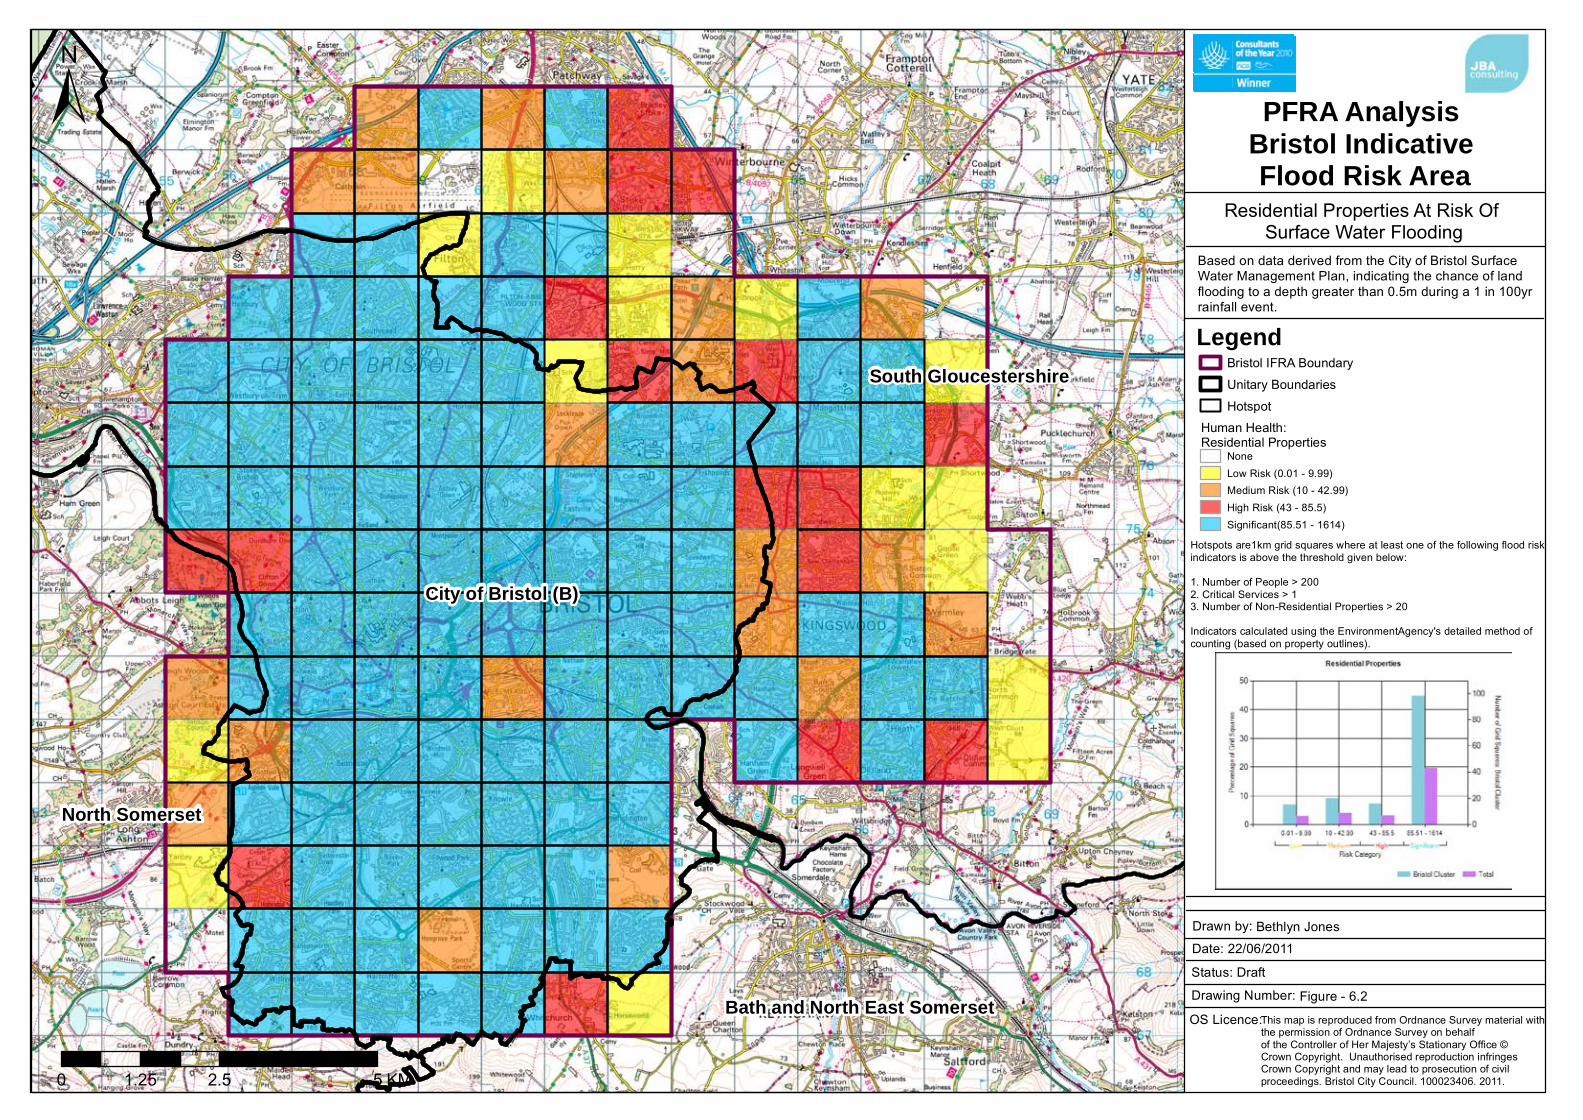
South Gloucestershire
City of Bristol (B)
North Somerset
Bath and North East Somerset
0 2.5 51.25 KM
Bristol IFRA BoundaryUnitary BoundariesHotspot
Human Health: Residential Properties
None Low Risk (0.01 - 9.99)Medium Risk (10 - 42.99)High Risk (43 - 85.5)Significant(85.51 - 1614)
Hotspots are1km grid squares where at least one of the following flood risk indicators is above the threshold given below:1. Number of People > 2002. Critical Services > 13. Number of Non-Residential Properties > 20Indicators calculated using the EnvironmentAgency's detailed method of counting (based on property outlines).
This map is reproduced from Ordnance Survey material withthe permission of Ordnance Survey on behalf of the Controller of Her Majesty’s Stationary Office ©Crown Copyright. Unauthorised reproduction infringes Crown Copyright and may lead to prosecution of civil proceedings. Bristol City Council. 100023406. 2011.
OS Licence: Drawing Number:Status:Date: 22/06/2011Drawn by: Bethlyn Jones
DraftFigure - 6.2
Legend
Based on data derived from the City of Bristol Surface Water Management Plan, indicating the chance of land flooding to a depth greater than 0.5m during a 1 in 100yrrainfall event.
Residential Properties At Risk Of Surface Water Flooding
PFRA Analysis Bristol Indicative Flood Risk Area
±

City of Bristol
South Gloucestershire
North Somerset
Bath and North East Somerset
0 2.5 51.25 KM
Bristol IFRA BoundaryUnitary Authority BoundariesHotspot
Economic: Non-Residential Properties
None Low Risk (0.01 - 9.99)Medium Risk (10 - 14.99)High Risk (15 - 19.99)Significant(20 - 410)
Hotspots are1km grid squares where at least one of the following flood risk indicators is above the threshold given below:1. Number of People > 2002. Critical Services > 13. Number of Non-Residential Properties > 20Indicators calculated using the EnvironmentAgency's detailed method of counting (based on property outlines).
This map is reproduced from Ordnance Survey material withthe permission of Ordnance Survey on behalf of the Controller of Her Majesty’s Stationary Office ©Crown Copyright. Unauthorised reproduction infringes Crown Copyright and may lead to prosecution of civil proceedings. Bristol City Council. 100023406. 2011.
OS Licence: Drawing Number:Status:Date: 22/06/2011Drawn by: Bethlyn Jones
DraftFigure 6.3
Legend
Based on data derived from the City of Bristol Surface Water Management Plan, indicating the chance of land flooding to a depth greater than 0.5m during a 1 in 100yrrainfall event.
Non Residential Properties At Risk Of Surface Water Flooding
± PFRA Analysis Bristol Indicative Flood Risk Area

South Gloucestershire
City of Bristol (B)
North Somerset
Bath and North East Somerset
0 2.5 51.25 KM
Bristol IFRA BoundaryUnitary BoundariesHotspot
Human Health: Critical Infrastructure
None Low Risk Medium Risk High Risk (0.01 - 0.99)Significant(1 - 9)
Hotspots are1km grid squares where at least one of the following flood risk indicators is above the threshold given below:1. Number of People > 2002. Critical Services > 13. Number of Non-Residential Properties > 20Indicators calculated using the EnvironmentAgency's detailed method of counting (based on property outlines).
This map is reproduced from Ordnance Survey material withthe permission of Ordnance Survey on behalf of the Controller of Her Majesty’s Stationary Office ©Crown Copyright. Unauthorised reproduction infringes Crown Copyright and may lead to prosecution of civil proceedings. Bristol City Council. 100023406. 2011.
OS Licence: Drawing Number:Status:Date: 22/06/2011Drawn by: Bethlyn Jones
DraftFigure 6.4
Legend
Based on data derived from the City of Bristol Surface Water Management Plan, indicating the chance of land flooding to a depth greater than 0.5m during a 1 in 100yrrainfall event.
Critical Infrastructure At Risk Of Surface Water Flooding
PFRA Analysis Bristol Indicative Flood Risk Area
±

2011s4891 BCC PFRA final.doc 44
6.2 New Flood Risk Areas
Figure 6.5 identifies the original Environment Agency 'hotspots' produced using NRD v1.0 and the FMfSW, compared to those hotspots identified as part of this PFRA process using the agreed surface water information and NRD v1.1. It was anticipated that all EA hotspots would be reselected when the process was carried out again using the more up-to-date data however this was not necessarily the case. Some discrepancies have been identified and investigated, with confidence in the SWMP data still strong. Slight differences in flow paths are to be expected when developing different models and therefore this is not thought to be an issue.
No amendments or proposed changes to the indicative Flood Risk Area boundary are recommended as a result of this PFRA analysis.

South Gloucestershire
City of Bristol (B)
North Somerset
Bath and North East Somerset
0 2.5 51.25 KM
Bristol IFRA BoundaryUnitary BoundariesHotspotEA Hotspots
This map is reproduced from Ordnance Survey material withthe permission of Ordnance Survey on behalf of the Controller of Her Majesty’s Stationary Office ©Crown Copyright. Unauthorised reproduction infringes Crown Copyright and may lead to prosecution of civil proceedings. Bristol City Council. 100023406. 2011.
OS Licence: Drawing Number:Status:Date: 22/06/2011Drawn by: Bethlyn Jones
DraftFigure 6.5
Legend
Based on data derived from the City of Bristol Surface Water Management Plan, indicating the chance of land flooding to a depth greater than 0.5m during a 1 in 100yrrainfall event.
Hotspot Locations
PFRA Analysis Bristol Indicative Flood Risk Area
±
Hotspots are1km grid squares where at least one of the following flood risk indicators is above the threshold given below (Using NRD v1.1):1. Number of People > 2002. Critical Services > 13. Number of Non-Residential Properties > 20Indicators calculated using the Environment Agency's detailed method of counting (based on property outlines) but using the most recent version of the NRD (v1.1) and including the following within the critical infrastructure buildings layer: - Electricity Sub Station, - Sewage Filtration, - Sewage Outfall, - Sewage Pump House, - Sewage Recycling, - Sewage Storage, - Sewage Treatment.

2011s4891 BCC PFRA final.doc 46
7. Next Steps
7.1 Review
This Preliminary Assessment Report forms a part of the PFRA process that addresses the requirements defined by the Flood Risk Regulations. These place a duty for LLFAs to assess both the impacts of past floods and the consequences of future floods. They are also required to identify whether flood risk is significant, by applying national guidance to define Flood Risk Areas. For these areas, there are further duties to prepare Flood Hazard and Risk Maps by 2013 which in turn inform the Flood Risk Management Plans that will be required by 2015.
Bristol City Council has undertaken an internal review of the PFRA, involving Cabinet, Council staff and the Overview and Scrutiny Committee. The review agreed that the indicative assessment of flood risk in Bristol was not amended and also supported the preparation of the PFRA in accordance with the Guidance provided to all LLFAs by Defra. This PFRA has been developed with advice from members of the flood risk management partnership group, as well as from members of an internal officers working group, prior to being laid before the lead Cabinet Member for final approval ahead of the EA's deadline of 22
nd June 2011.
The EA is required to review, collate and publish all PFRA submissions, in time to meet the 22nd December 2011 deadline for final submission to the European Commission. LLFAs will also publish PFRAs on their websites in accordance with the requirements of the EC Inspire Directive.
Under the Regulations, Bristol City Council will be required to undertake Hazard and Risk Mapping by 2013 and subsequently produce Flood Risk Management Plans for Bristol City by 2015. It is however important to remember that the PFRA will have to be reviewed and revised again in 2016 as part of the 6 yearly cycle of flood risk planning.
7.2 Local Flood Risk Management Strategy
In preparing the PFRA, the opportunity has been taken to establish the foundations for preparing the City of Bristol Local Flood Risk Management Strategy. This will commence later this year under duties contained in the Flood & Water Management Act 2010.
Detailed analysis of local flood risk across the City has been undertaken as part of this study and is now available to inform and communicate the issues and priorities to help prepare the future strategy. The JBA Consulting GIS software tools have allowed the completion of the PFRA and provided the means to analyse and clearly display the risk from a range of different flood sources on a Ward or entire City basis.
The PFRA process has also helped strengthen and underline the importance of partnership working between the risk management authorities and the need for sharing information through the City of Bristol Partnership Group. A comprehensive archive of past floods has been compiled and a database structure now exists to record the mandatory information necessary for documenting all future flood events. This will be of benefit and greatly simplify the PFRA review process due in 6 years time.
The details of critical infrastructure and properties at risk of flooding will also help inform the City of Bristol Multi-Agency Flood Plan (MFP) and assist in emergency planning and response.
The Local Flood Risk Management Strategy will define how flood risk is to be assessed and managed across the City of Bristol in future years. The PFRA analysis has provided the opportunity to prepare for and inform how this future strategy will be taken forward.

2011s4891 2011s4891 BCC PFRA draft pm3.docx 47
Appendices
A.1 Records of past floods and their significant consequences (preliminary assessment report spreadsheet)
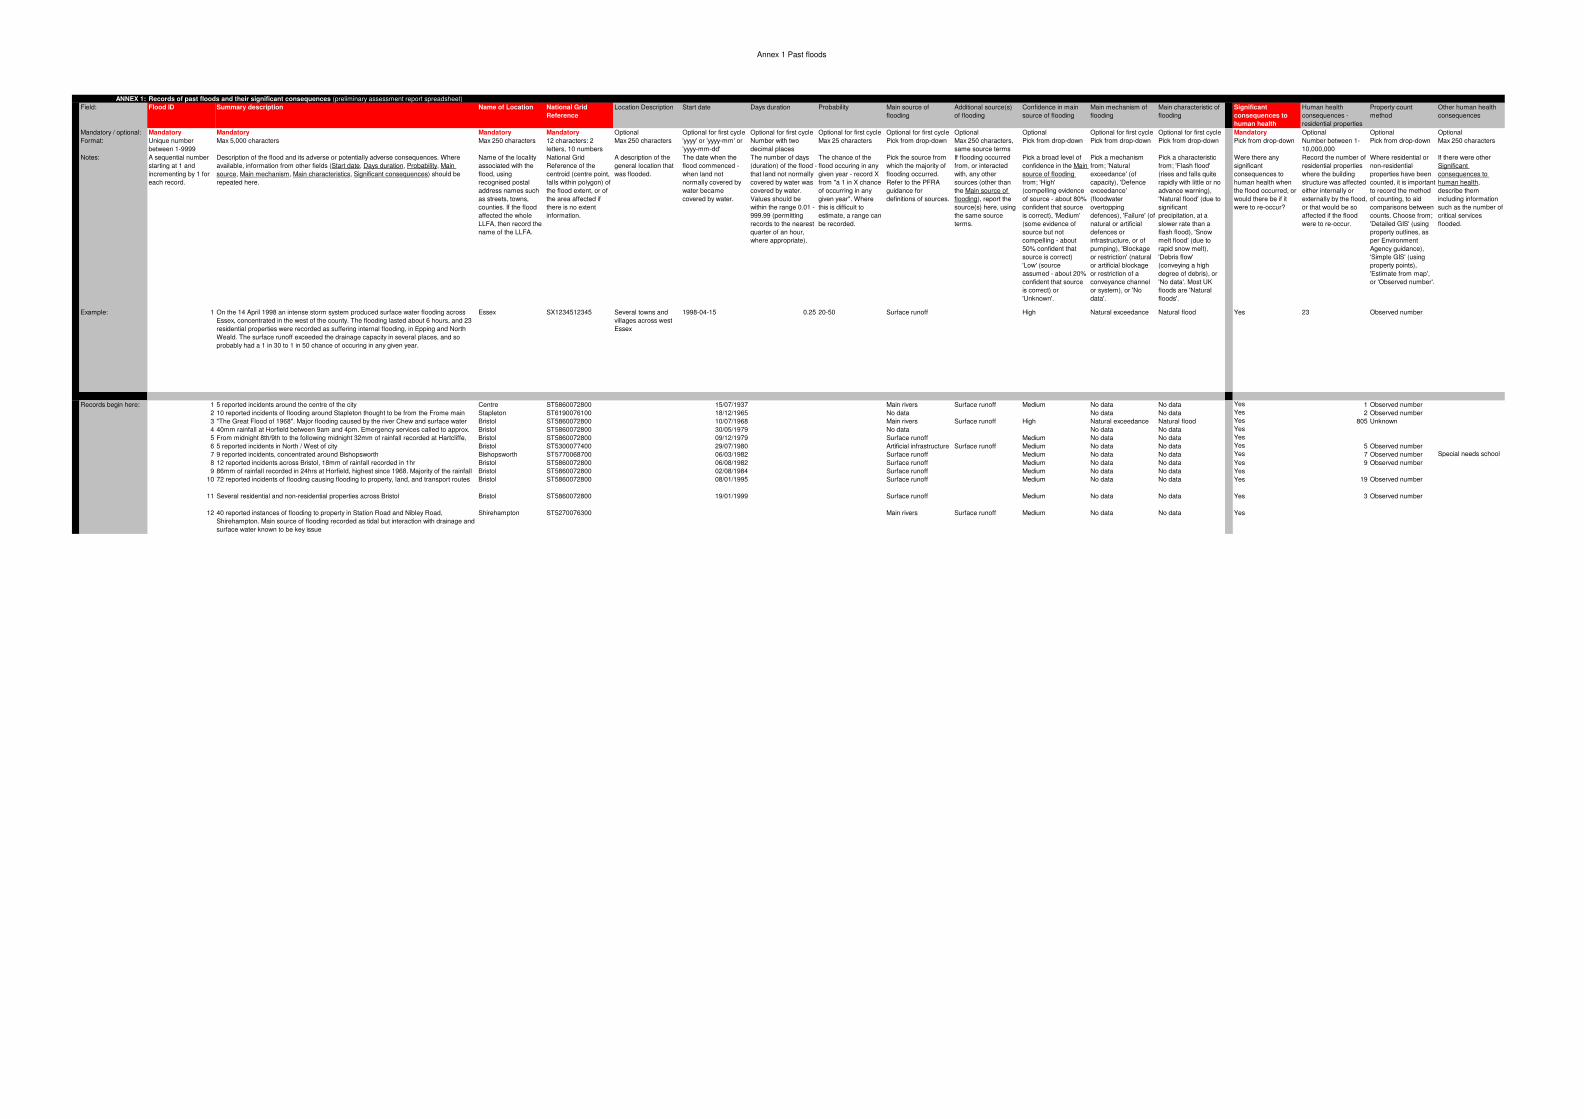
Annex 1 Past floods
ANNEX 1: Records of past floods and their significant consequences (preliminary assessment report spreadsheet)
Field: Flood ID Summary description Name of Location National Grid
Reference
Location Description Start date Days duration Probability Main source of
flooding
Additional source(s)
of flooding
Confidence in main
source of flooding
Main mechanism of
flooding
Main characteristic of
flooding
Significant
consequences to
human health
Human health
consequences -
residential properties
Property count
method
Other human health
consequences
Mandatory / optional: Mandatory Mandatory Mandatory Mandatory Optional Optional for first cycle Optional for first cycle Optional for first cycle Optional for first cycle Optional Optional Optional for first cycle Optional for first cycle Mandatory Optional Optional Optional
Format: Unique number
between 1-9999
Max 5,000 characters Max 250 characters 12 characters: 2
letters, 10 numbers
Max 250 characters 'yyyy' or 'yyyy-mm' or
'yyyy-mm-dd'
Number with two
decimal places
Max 25 characters Pick from drop-down Max 250 characters,
same source terms
Pick from drop-down Pick from drop-down Pick from drop-down Pick from drop-down Number between 1-
10,000,000
Pick from drop-down Max 250 characters
Notes: A sequential number
starting at 1 and
incrementing by 1 for
each record.
Description of the flood and its adverse or potentially adverse consequences. Where
available, information from other fields (Start date, Days duration, Probability, Main
source, Main mechanism, Main characteristics, Significant consequences) should be
repeated here.
Name of the locality
associated with the
flood, using
recognised postal
address names such
as streets, towns,
counties. If the flood
affected the whole
LLFA, then record the
name of the LLFA.
National Grid
Reference of the
centroid (centre point,
falls within polygon) of
the flood extent, or of
the area affected if
there is no extent
information.
A description of the
general location that
was flooded.
The date when the
flood commenced -
when land not
normally covered by
water became
covered by water.
The number of days
(duration) of the flood -
that land not normally
covered by water was
covered by water.
Values should be
within the range 0.01 -
999.99 (permitting
records to the nearest
quarter of an hour,
where appropriate).
The chance of the
flood occuring in any
given year - record X
from "a 1 in X chance
of occurring in any
given year". Where
this is difficult to
estimate, a range can
be recorded.
Pick the source from
which the majority of
flooding occurred.
Refer to the PFRA
guidance for
definitions of sources.
If flooding occurred
from, or interacted
with, any other
sources (other than
the Main source of
flooding), report the
source(s) here, using
the same source
terms.
Pick a broad level of
confidence in the Main
source of flooding
from; 'High'
(compelling evidence
of source - about 80%
confident that source
is correct), 'Medium'
(some evidence of
source but not
compelling - about
50% confident that
source is correct)
'Low' (source
assumed - about 20%
confident that source
is correct) or
'Unknown'.
Pick a mechanism
from; 'Natural
exceedance' (of
capacity), 'Defence
exceedance'
(floodwater
overtopping
defences), 'Failure' (of
natural or artificial
defences or
infrastructure, or of
pumping), 'Blockage
or restriction' (natural
or artificial blockage
or restriction of a
conveyance channel
or system), or 'No
data'.
Pick a characteristic
from; 'Flash flood'
(rises and falls quite
rapidly with little or no
advance warning),
'Natural flood' (due to
significant
precipitation, at a
slower rate than a
flash flood), 'Snow
melt flood' (due to
rapid snow melt),
'Debris flow'
(conveying a high
degree of debris), or
'No data'. Most UK
floods are 'Natural
floods'.
Were there any
significant
consequences to
human health when
the flood occurred, or
would there be if it
were to re-occur?
Record the number of
residential properties
where the building
structure was affected
either internally or
externally by the flood,
or that would be so
affected if the flood
were to re-occur.
Where residential or
non-residential
properties have been
counted, it is important
to record the method
of counting, to aid
comparisons between
counts. Choose from;
'Detailed GIS' (using
property outlines, as
per Environment
Agency guidance),
'Simple GIS' (using
property points),
'Estimate from map',
or 'Observed number'.
If there were other
Significant
consequences to
human health,
describe them
including information
such as the number of
critical services
flooded.
Example: 1 On the 14 April 1998 an intense storm system produced surface water flooding across
Essex, concentrated in the west of the county. The flooding lasted about 6 hours, and 23
residential properties were recorded as suffering internal flooding, in Epping and North
Weald. The surface runoff exceeded the drainage capacity in several places, and so
probably had a 1 in 30 to 1 in 50 chance of occuring in any given year.
Essex SX1234512345 Several towns and
villages across west
Essex
1998-04-15 0.25 20-50 Surface runoff High Natural exceedance Natural flood Yes 23 Observed number
Records begin here: 1 5 reported incidents around the centre of the city Centre ST5860072800 15/07/1937 Main rivers Surface runoff Medium No data No data Yes 1 Observed number
2 10 reported incidents of flooding around Stapleton thought to be from the Frome main Stapleton ST6190076100 18/12/1965 No data No data No data Yes 2 Observed number
3 "The Great Flood of 1968". Major flooding caused by the river Chew and surface water Bristol ST5860072800 10/07/1968 Main rivers Surface runoff High Natural exceedance Natural flood Yes 805 Unknown
4 40mm rainfall at Horfield between 9am and 4pm. Emergency services called to approx. Bristol ST5860072800 30/05/1979 No data No data No data Yes
5 From midnight 8th/9th to the following midnight 32mm of rainfall recorded at Hartcliffe, Bristol ST5860072800 09/12/1979 Surface runoff Medium No data No data Yes
6 5 reported incidents in North / West of city Bristol ST5300077400 29/07/1980 Artificial infrastructure Surface runoff Medium No data No data Yes 5 Observed number
7 9 reported incidents, concentrated around Bishopsworth Bishopsworth ST5770068700 06/03/1982 Surface runoff Medium No data No data Yes 7 Observed number Special needs school
8 12 reported incidents across Bristol, 18mm of rainfall recorded in 1hr Bristol ST5860072800 06/08/1982 Surface runoff Medium No data No data Yes 9 Observed number
9 86mm of rainfall recorded in 24hrs at Horfield, highest since 1968. Majority of the rainfall Bristol ST5860072800 02/08/1984 Surface runoff Medium No data No data Yes
10 72 reported incidents of flooding causing flooding to property, land, and transport routes Bristol ST5860072800 08/01/1995 Surface runoff Medium No data No data Yes 19 Observed number
11 Several residential and non-residential properties across Bristol Bristol ST5860072800 19/01/1999 Surface runoff Medium No data No data Yes 3 Observed number
12 40 reported instances of flooding to property in Station Road and Nibley Road,
Shirehampton. Main source of flooding recorded as tidal but interaction with drainage and
surface water known to be key issue
Shirehampton ST5270076300 Main rivers Surface runoff Medium No data No data Yes

Annex 1 Past floods
Significant economic
consequences
Number of non-
residential properties
flooded
Property count
method
Other economic
consequences
Significant
consequences to the
environment
Environment
consequences
Significant
consequences to
cultural heritage
Cultural heritage
consequences
Comments Data owner Area flooded Flood event outline
confidence
Flood event outline
source
Survey date Photo ID Lineage Sensitive data Protective marking
descriptor
European Flood Event Code
Mandatory Optional Optional Optional Mandatory Optional Mandatory Optional Optional Optional Optional Optional Optional Optional Optional Optional Optional Optional Auto-populated
Pick from drop-down Number between 1-
10,000,000
Pick from drop-down Max 250 characters Pick from drop-down Max 250 characters Pick from drop-down Max 250 characters Max 1,000 characters Max 250 characters Number with two
decimal places
Pick from drop-down Pick from drop-down 'yyyy' or 'yyyy-mm' or
'yyyy-mm-dd'
Max 50 characters Max 250 characters Pick from drop-down Max 50 characters Max 42 characters
Were there any
significant economic
consequences when
the flood occurred, or
would there be if it
were to re-occur?
Record the number of
non-residential
properties where the
building structure was
affected either
internally or externally
by the flood, or that
would be so affected if
the flood were to re-
occur.
Where residential or
non-residential
properties have been
counted, it is important
to record the method
of counting, to aid
comparisons between
counts. Choose from;
'Detailed GIS' (using
property outlines, as
per Environment
Agency guidance),
'Simple GIS' (using
property points),
'Estimate from map',
or 'Observed number'.
If there were other
Significant economic
consequences,
describe them
including information
such as the area of
agricultural land
flooded, length of
roads and rail flooded.
Were there any
significant
consequences to the
environment when the
flood occurred, or
would there be if it
were to re-occur?
If there were
Significant
consequences to the
environment, describe
them including
information such as
national and
international
designated sites
flooded, and pollution
sources flooded.
Were there any
significant
consequences to
cultural heritage when
the flood occurred, or
would there be if it
were to re-occur?
If there were
Significant
consequences to
cultural heritage,
describe them
including information
such as the number
and type of heritage
assets flooded.
Any additional
comments about the
past flood record.
The total area of the
land flooded, in km2
Choose from; 'High'
(data includes one of:
Aerial video, Aerial
photos, Professional
survey, Flood level
information, EA flood
data recording staff
notes), 'Medium' (data
includes one of:
EA/LA ground video,
EA/LA ground photos,
EA/LA flood event
outline map,
LA/professional
partner officer site
records, Public
ground video), 'Low'
(not confident) or
'Unknown'.
Provide references to
relevant specific
photographs, or to a
set of relevant
photographs. It may
not be practical to
reference all relevant
photographs for each
flood event.
Lineage is how and
what the data is made
from. Has this data
been created by using
data owned or derived
from data owned by
3rd party (external)
organisations? If yes
please give details.
Has the information
been classified under
the Government's
Protective Marking
Scheme? Include
protective marking
time limit where
known. Note: If
"Approved for Access"
then report
"Unmarked".
For use where
organisations apply
the Government's
Protective Marking
Scheme.
This field will autopopulate using the LLFA
name provided on the "Instructions" tab, and
the Flood ID. It is an EU-wide unique
identifier and will be used to report the flood
information.
Format: UK<ONS Code><P or F><LLFA
Flood ID>. "ONS Code" is a unique
reference for each LLFA. "P or F" indicates if
the event is past or future. "LLFA Flood ID" is
a sequential number beginning with 0001.
No No No Epping Forest District
Council
Medium Site survey 1998-04-20 Ordnance Survey
AddressPoint; CEH
1:50k River
Centreline; NextMap
DTM.
Unmarked Private UKE10000012P0001
Yes 2 Observed number No No EA data set: FRIS UKE06000023P0001
Yes 2 Observed number No No EA data set: FRIS UKE06000023P0002
Yes Yes Yes Data compiled from UKE06000023P0003
Yes No No Information compiled UKE06000023P0004
Yes No No Information compiled
Yes 2 Observed number No No EA data set: FRIS UKE06000023P0006
No 0 Observed number No No EA data set: FRIS UKE06000023P0007
No 0 Observed number No No EA data set: FRIS UKE06000023P0008
Yes No No Information compiled UKE06000023P0009
Yes 3 Observed number No No EA data set: FRIS
incidents
UKE06000023P0010
Yes 2 Observed number No No EA data set: FRIS
incidents
UKE06000023P0011
No No No Data compiled from
various data sets
UKE06000023P0012

2011s4891 2011s4891 BCC PFRA draft pm3.docx 48
A.2 Records of future floods and their consequences (preliminary assessment report spreadsheet)

Annex 2 Future floods
ANNEX 2: Records of future floods and their consequences (preliminary assessment report spreadsheet)Field: Flood ID Description of assessment method Name of Location National Grid
ReferenceLocation Description Name Flood modelled Probability Main source of
floodingAdditional source(s) of flooding
Confidence in main source of flooding
Main mechanism of flooding
Main characteristic of flooding
Adverse consequences to human health
Human health consequences - residential properties
Property count method Other human health consequences
Mandatory / optional: Mandatory Mandatory Mandatory Mandatory Optional Optional Optional Mandatory Mandatory Optional Optional Mandatory Mandatory Mandatory Optional Optional OptionalFormat: Unique number
between 1-9999Max 1,000 characters Max 250 characters 12 characters: 2 letters,
10 numbersMax 250 characters Max 250 characters Max 250 characters Max 25 characters Pick from drop-down Max 250 characters,
same source termsPick from drop-down Pick from drop-down Pick from drop-down Pick from drop-down Number between 1-
10,000,000Pick from drop-down Max 250 characters
Notes: A sequential number starting at 1 and incrementing by 1 for each record.
Description of the future flood information and how it has been produced. Cover Regulation 12(6) requirements of (a) topography, (b) the location of watercourses, (c) the location of flood plains that retain flood water, (d) the characteristics of watercourses, and (e) the effectiveness of any works constructed for the purpose of flood risk management. Information from other relevant fields (Probability, Main source, Name) should be repeated here.
Name of the locality associated with the flood, using recognised postal address names such as streets, towns, counties. If the flood affects the whole LLFA, then record the name of the LLFA.
National Grid Reference of the centroid (centre point, falls within polygon) of the flood extent, or of the area affected if there is no extent information. If the flood affects the whole LLFA, then record the centroid of the LLFA.
A description of the general location that could be flooded.
Name of the model or map product or project which produced the future flood information
Background, or additional information on the probability of the flood modelled - such as whether Probability refers to probability of rainfall or water on the ground.
The chance of the flood occuring in any given year - record X from "a 1 in X chance of occurring in any given year".
Pick the source which generates the majority of flooding. Refer to the PFRA guidance for definitions of sources.
If the flood is generated by, or interacts with, any other sources (other than the Main source of flooding), report the source(s) here, using the same source terms.
Pick a broad level of confidence in the Main source of flooding from; 'High' (compelling evidence of source - about 80% confident that source is correct), 'Medium' (some evidence of source but not compelling - about 50% confident that source is correct) 'Low' (source assumed - about 20% confident that source is correct) or 'Unknown'.
Pick a mechanism from; 'Natural exceedance' (of capacity), 'Defence exceedance' (floodwater overtopping defences), 'Failure' (of natural or artificial defences or infrastructure, or of pumping), 'Blockage or restriction' (natural or artificial blockage or restriction of a conveyance channel or system), or 'No data'.
Pick a characteristic from; 'Flash flood' (rises and falls quite rapidly with little or no advance warning), 'Natural flood' (due to significant precipitation, at a slower rate than a flash flood), 'Snow melt flood' (due to rapid snow melt), 'Debris flow' (conveying a high degree of debris), or 'No data'. Most UK floods are 'Natural floods'.
Would there be any significant consequences to human health if the future flood were to occur?
Record the number of residential properties where the building structure would be affected either internally or externally if the flood were to occur.
Where residential or non-residential properties have been counted, it is important to record the method of counting, to aid comparisons between counts. Choose from; 'Detailed GIS' (using property outlines, as per Environment Agency guidance), 'Simple GIS' (using property points), 'Estimate from map', or 'Observed number'.
If there would be other Significant consequences to human health, describe them including information such as the number of critical services flooded.
Example: 1 See records below for examples of description of assessment method. Essex SX1234512345 Flood Map for Surface Water - 1 in 200 deep
Probability refers to the probability of the rainfall event, in this case producing flooding of greater than 0.3m depth.
200 Surface runoff High Natural exceedance Natural flood Yes 12000 Detailed GIS
Records begin here: 1 • Topography is derived from LIDAR (in larger urban areas, on 1, 2 and 3m grids; original accuracy ± 0.15m) and Geoperspective data (original accuracy ± 1.5m), processed to remove buildings and vegetation, then degraded to a composite 5m DTM. Manual edits applied where flow paths clearly omitted e.g. below bridges.• Flow routes dictated by topography; no allowance made for manmade drainage. The DTM may miss flow paths below bridges. • Areas that may flood are defined by dynamically routing a 6.5 hour duration storm with 1 in 200 chance of occurring in any year, over the DTM using JBA’s JFLOW–GPU model. • Manning’s n of 0.1 is used throughout, to allow broad scale effects of buildings and other obstructions to be approximated. • No allowance made for drainage, pumping or other works constructed for the purpose of flood risk management. • The ‘less susceptible’ layer shows where modelled flooding is 0.1-0.3m deep; you must not interpret this as depth of flooding, rather as indicative of susceptibility to flooding because of modelling uncertainties.
City of Bristol ST5942072340 City of Bristol Areas Susceptible to Surface Water Flooding (AStSWF) - Less
Probability refers to the probability of the rainfall event. This identifies areas which are 'less susceptible' to surface water flooding. For more information refer to "What are Areas Susceptible to Surface Water Flooding" Environment Agency December 2010.
200 Surface runoff High Natural exceedance Natural flood Yes 31500 Detailed GIS 300 Critical Infrastructure buildings.
2 • Topography is derived from LIDAR (in larger urban areas, on 1, 2 and 3m grids; original accuracy ± 0.15m) and Geoperspective data (original accuracy ± 1.5m), processed to remove buildings and vegetation, then degraded to a composite 5m DTM. Manual edits applied where flow paths clearly omitted e.g. below bridges.• Flow routes dictated by topography; no allowance made for manmade drainage. The DTM may miss flow paths below bridges. • Areas that may flood are defined by dynamically routing a 6.5 hour duration storm with 1 in 200 chance of occurring in any year, over the DTM using JBA’s JFLOW–GPU model. • Manning’s n of 0.1 is used throughout, to allow broad scale effects of buildings and other
City of Bristol ST5942072340 City of Bristol Areas Susceptible to Surface Water Flooding (AStSWF) - Intermediate
Probability refers to the probability of the rainfall event. This identifies areas with 'intermediate susceptibility' to surface water flooding.
200 Surface runoff High Natural exceedance Natural flood Yes 15100 Detailed GIS 100 Critical Infrastructure buildings.
• Manning’s n of 0.1 is used throughout, to allow broad scale effects of buildings and other obstructions to be approximated. • No allowance made for drainage, pumping or other works constructed for the purpose of flood risk management. • The ‘intermediate susceptibility’ layer shows where modelled flooding is 0.3-1.0m deep; you must not interpret this as depth of flooding, rather as indicative of susceptibility to flooding because of modelling uncertainties.
3 • Topography is derived from LIDAR (in larger urban areas, on 1, 2 and 3m grids; original accuracy ± 0.15m) and Geoperspective data (original accuracy ± 1.5m), processed to remove buildings and vegetation, then degraded to a composite 5m DTM. Manual edits applied where flow paths clearly omitted e.g. below bridges.• Flow routes dictated by topography; no allowance made for manmade drainage. The DTM may miss flow paths below bridges. • Areas that may flood are defined by dynamically routing a 6.5 hour duration storm with 1 in 200 chance of occurring in any year, over the DTM using JBA’s JFLOW–GPU model. • Manning’s n of 0.1 is used throughout, to allow broad scale effects of buildings and other obstructions to be approximated. • No allowance made for drainage, pumping or other works constructed for the purpose of flood risk management. • The ‘more susceptible’ layer shows where modelled flooding is >1.0m deep; you must not interpret this as depth of flooding, rather as indicative of susceptibility to flooding because of modelling uncertainties.
City of Bristol ST5942072340 City of Bristol Areas Susceptible to Surface Water Flooding (AStSWF) - More
Probability refers to the probability of the rainfall event. This identifies areas which are 'more susceptible' to surface water flooding.
200 Surface runoff High Natural exceedance Natural flood Yes 4200 Detailed GIS

Annex 2 Future floods
Adverse economic consequences
Number of non-residential properties flooded
Property count method Other economic consequences
Adverse consequences to the environment
Environment consequences
Adverse consequences to cultural heritage
Cultural heritage consequences
Comments Data owner Area flooded Confidence in modelled outline
Model date Model Type Hydrology Type Lineage Sensitive data Protective marking descriptor
European Flood Event Code
Mandatory Optional Optional Optional Mandatory Optional Mandatory Optional Optional Optional Optional Optional Optional Optional Optional Optional Optional Optional Auto-populatedPick from drop-down Number between 1-
10,000,000Pick from drop-down Max 250 characters Pick from drop-down Max 250 characters Pick from drop-down Max 250 characters Max 1,000 characters Max 250 characters Number with two
decimal placesPick from drop-down 'yyyy' or 'yyyy-mm' or
'yyyy-mm-dd'Max 250 characters Max 250 characters Max 250 characters Pick from drop-down Max 50 characters Max 42 characters
Would there be any significant economic consequences if the future flood were to occur?
Record the number of non-residential properties where the building structure would be affected either internally or externally if the flood were to occur.
Where residential or non-residential properties have been counted, it is important to record the method of counting, to aid comparisons between counts. Choose from; 'Detailed GIS' (using property outlines, as per Environment Agency guidance), 'Simple GIS' (using property points), 'Estimate from map', or 'Observed number'.
If there would be other Significant economic consequences, describe them including information such as the area of agricultural land flooded, length of roads and rail flooded.
Would there be any significant consequences to the environment if the future flood were to occur?
If there would be Significant consequences to the environment, describe them including information such as national and international designated sites flooded, and pollution sources flooded.
Would there be any significant consequences to cultural heritage if the future flood were to occur?
If there would be Significant consequences to cultural heritage, describe them including information such as the number and type of heritage assets flooded.
Any additional comments about the future flood record.
The total area of the land flooded, in km2
Pick a broad level of confidence in the modelled flood outline from; 'High' (good match to past flood extents - about 80% confident that outline is correct), 'Medium' (reasonable match - about 50% confident that outline is correct), 'Low' (poor match, sparse data - about 20% confident that outline is correct) or 'Unknown'.
Type of software used to create future flood information.
Type of hydrology method used to create future flood information.
Lineage is how and what the data is made from. Has this data been created by using data owned or derived from data owned by 3rd party (external) organisations? If yes please give details.
Has the information been classified under the Government's Protective Marking Scheme? Include protective marking time limit where known. Note: If "Approved for Access" then report "Unmarked".
For use where organisations apply the Government's Protective Marking Scheme.
This field will autopopulate using the LLFA name provided on the "Instructions" tab, and the Flood ID. It is an EU-wide unique identifier and will be used to report the flood information.
Format: UK<ONS Code><P or F><LLFA Flood ID>. "ONS Code" is a unique reference for each LLFA. "P or F" indicates if the event is past or future. "LLFA Flood ID" is a sequential number beginning with 0001.
No No No Epping Forest District Council
Medium-Low 2008-08 2D-TuFlow FEH (Revised Rainfall Runoff) Ordnance Survey AddressPoint; CEH 1:50k River Centreline; NextMap DTM.
Unmarked Private UKE10000012F0001
Yes 7900 Detailed GIS During this event it is estimated that 224km of roads and 13km of railways will be affected. As the area in question is predominantly urban only 1.09km2 of agricultural land will be flooded, including 0.01km2 of grade 1 and 0.08km2 of grade 2 land.
Yes 0.44km2 of internationally designated and 0.14km2 of locally designated sites. 14 IPPC sites, 4 Active Radio Active Sites Authorisations, 3 Active Radio Active Sites Registrations and 84 Waste Licence sites.
Yes 604 Listed Buildings affected by this flood outline. 110 buildings located in one 1km grid square in Cabot Ward, centered on the Floating Harbour. 0.34km2 of historic Parks and Gardens, as well as 0.01km2 of Scheduled Ancient Monuments.
• 122 Hotspots (81% of Study Area).• Greatest Non-Residential (577) and critical infrastructure buildings (13) at risk of flooding located to the north of Temple Meads. • Greatest number of residential buildings (1596) at risk to the west of Temple Meads. • Greatest flood extent in Avonmouth Ward (4.3km2) • Greatest percentage of ward affected in Southville Ward (30.5% or 0.8km2).
JBA Consulting (distributed by Environment Agency under licence)
15.83 Low 2009-07 JFLOW-GPU Depth-duration-frequency curves derived from FEH CD-ROM, from centre of each 5km model, with areal reduction factor applied to convert point rainfall estimate to more representative figure. Curve then used to derive 6.5 hr, 1:200 chance rainfall depth; this is converted to hyetograph, using summer rainfall profile.
Protect Commercial UKE06000023F0001
Yes 3900 Detailed GIS It is estimated that 90km of roads and 7.5km of railways will be affected. As the area in question is predominantly urban only 0.35km2 of agricultural land is anticipated to flood,
Yes 0.29km2 of internationally designated and 0.09km2 of locally designated land. 10 IPPC sites, 3 Active Radio Active Sites Authorisations, 1 Active Radio Active Sites
Yes 347 Listed Buildings affected by this flood outline. 66 buildings located in one 1km grid square in Cabot Ward, centered on the Floating Harbour, as well as 0.21km2 of historic Parks and
• 85 Hotspots (57% of Study Area).• Greatest Non-Residential (447) and critical infrastructure buildings (11) at risk of flooding located to the north of Temple Meads.
JBA Consulting (distributed by Environment Agency under licence)
7.66 Low 2009-07 JFLOW-GPU Depth-duration-frequency curves derived from FEH CD-ROM, from centre of each 5km model, with areal reduction factor applied to convert point rainfall estimate to more representative figure. Curve then used to derive 6.5 hr, 1:200 chance rainfall depth; this is converted to hyetograph, using summer rainfall profile.
Protect Commercial UKE06000023F0002
anticipated to flood, including 0.06km2 of grade 2 land, no grade 1 land affected.
Radio Active Sites Registrations and 52 Waste Licence sites.
historic Parks and Gardens flooed throughout the City of Bristol.
Meads. • Greatest number of residential buildings (1136) at risk in Easton. • Greatest flood extent in Avonmouth Ward (1.3km2) • Greatest percentage of ward affected in Southville Ward (21% or 0.6km2).
Yes 1000 Detailed GIS It is estimated that 20.7km of roads and 2.5km of railways will be affected. As the area in question is predominantly urban only 0.09km2 of agricultural land is anticipated to flood, including 0.04km2 of grade 2 land, no grade 1 land affected.
Yes 0.03km2 of internationally designated land. 2 IPPC sites, however no Active Radio Active Sites Authorisations or Active Radio Active Sites Registrations affected. 14 Waste Licence sites.
Yes 106 Listed Buildings affected by this flood outline. 12 buildings located in one 1km grid square which is located between Cabot and Cliftonin Cabot Wards. 0.01km2 of historic Parks and Gardens flood throughout the City of Bristol.
• 34 Hotspots (23% of Study Area).• Greatest Residential (489) and critical infrastructure buildings (4) at risk of flooding located to the south of Temple Meads. • Greatest number of Non-Residential buildings (126) at risk to the north of Temple Meads. • Greatest flood extent in Stoke Bishop Ward (0.26km2) • Greatest percentage of ward affected in
JBA Consulting (distributed by Environment Agency under licence)
2.35 Low 2009-07 JFLOW-GPU Depth-duration-frequency curves derived from FEH CD-ROM, from centre of each 5km model, with areal reduction factor applied to convert point rainfall estimate to more representative figure. Curve then used to derive 6.5 hr, 1:200 chance rainfall depth; this is converted to hyetograph, using summer rainfall profile.
Protect Commercial UKE06000023F0003
of ward affected in Brislington East Ward (5.7% or 0.23km2).

Annex 2 Future floods
4 • Topography is derived from 64.5% LIDAR (on 0.25m-2m grids; original accuracy ± 0.15m) and 35.5% NEXTMap SAR (on 5m grid; original accuracy ± 1.0m), processed to remove buildings & vegetation, then combined on a 2m grid; buildings added with an arbitrary height of 5m based on OS MasterMap 2009 building footprints, then resampled to a 5m grid DTM. Manual edits applied where flow paths clearly omitted e.g. below bridges.• Flow routes dictated by topography; a uniform allowance of 12mm/hr has been made for manmade drainage in urban areas. Infiltration allowance reduces runoff to 39% in rural areas and 70% in urban areas.• Areas that may flood are defined by dynamically routing a 1.1 hour duration storm with 1 in 30 chance of occurring in any year over the DTM using JBA’s JFLOW–GPU model. • Manning’s n of 0.1 in rural areas; 0.03 in urban areas, to reflect explicit modelling of buildings in urban areas. • No allowance made for local variations in drainage, pumping or other works constructed for the purpose of flood risk management. • The ‘>0.1m’ layer shows where modelled flooding is greater than 0.1m deep.
City of Bristol ST5942072340 City of Bristol Flood Map for Surface Water (FMfSW) - 1 in 30
Probability refers to the probability of the rainfall event, in this case producing flooding of greater than 0.1m depth.
30 Surface runoff High Natural exceedance Natural flood Yes 12900 Detailed GIS 100 Critical Infrastructure buildings.
5 • Topography is derived from 64.5% LIDAR (on 0.25m-2m grids; original accuracy ± 0.15m) and 35.5% NEXTMap SAR (on 5m grid; original accuracy ± 1.0m), processed to remove buildings & vegetation, then combined on a 2m grid; buildings added with an arbitrary height of 5m based on OS MasterMap 2009 building footprints, then resampled to a 5m grid DTM. Manual edits applied where flow paths clearly omitted e.g. below bridges.• Flow routes dictated by topography; a uniform allowance of 12mm/hr has been made for manmade drainage in urban areas. Infiltration allowance reduces runoff to 39% in rural areas and 70% in urban areas.• Areas that may flood are defined by dynamically routing a 1.1 hour duration storm with 1 in 30 chance of occurring in any year over the DTM using JBA’s JFLOW–GPU model. • Manning’s n of 0.1 in rural areas; 0.03 in urban areas, to reflect explicit modelling of buildings
City of Bristol ST5942072340 City of Bristol Flood Map for Surface Water (FMfSW) - 1 in 30 deep
Probability refers to the probability of the rainfall event, in this case producing flooding of greater than 0.3m depth.
30 Surface runoff High Natural exceedance Natural flood Yes 3100 Detailed GIS
• Manning’s n of 0.1 in rural areas; 0.03 in urban areas, to reflect explicit modelling of buildings in urban areas. • No allowance made for local variations in drainage, pumping or other works constructed for the purpose of flood risk management. • The ‘>0.3m’ layer shows where modelled flooding is greater than 0.3m deep.
6 • Topography is derived from 64.5% LIDAR (on 0.25m-2m grids; original accuracy ± 0.15m) and 35.5% NEXTMap SAR (on 5m grid; original accuracy ± 1.0m), processed to remove buildings & vegetation, then combined on a 2m grid; buildings added with an arbitrary height of 5m based on OS MasterMap 2009 building footprints, then resampled to a 5m grid DTM. Manual edits applied where flow paths clearly omitted e.g. below bridges.• Flow routes dictated by topography; a uniform allowance of 12mm/hr has been made for manmade drainage in urban areas. Infiltration allowance reduces runoff to 39% in rural areas and 70% in urban areas.• Areas that may flood are defined by dynamically routing a 1.1 hour duration storm with 1 in 200 chance of occurring in any year over the DTM using JBA’s JFLOW–GPU model. • Manning’s n of 0.1 in rural areas; 0.03 in urban areas, to reflect explicit modelling of buildings in urban areas. • No allowance made for local variations in drainage, pumping or other works constructed for the purpose of flood risk management. • The ‘>0.1m’ layer shows where modelled flooding is greater than 0.1m deep.
City of Bristol ST5942072340 City of Bristol Flood Map for Surface Water (FMfSW) - 1 in 200
Probability refers to the probability of the rainfall event, in this case producing flooding of greater than 0.1m depth.
200 Surface runoff High Natural exceedance Natural flood Yes 36300 Detailed GIS 300 Critical Infrastructure buildings.
7 • Topography is derived from 64.5% LIDAR (on 0.25m-2m grids; original accuracy ± 0.15m) and 35.5% NEXTMap SAR (on 5m grid; original accuracy ± 1.0m), processed to remove buildings & vegetation, then combined on a 2m grid; buildings added with an arbitrary height of 5m based on OS MasterMap 2009 building footprints, then resampled to a 5m grid DTM.
City of Bristol ST5942072340 City of Bristol Flood Map for Surface Water (FMfSW) - 1 in 200 deep
Probability refers to the probability of the rainfall event, in this case producing
200 Surface runoff High Natural exceedance Natural flood Yes 12800 Detailed GIS 100 Critical Infrastructure buildings.
of 5m based on OS MasterMap 2009 building footprints, then resampled to a 5m grid DTM. Manual edits applied where flow paths clearly omitted e.g. below bridges.• Flow routes dictated by topography; a uniform allowance of 12mm/hr has been made for manmade drainage in urban areas. Infiltration allowance reduces runoff to 39% in rural areas and 70% in urban areas.• Areas that may flood are defined by dynamically routing a 1.1 hour duration storm with 1 in 200 chance of occurring in any year over the DTM using JBA’s JFLOW–GPU model. • Manning’s n of 0.1 in rural areas; 0.03 in urban areas, to reflect explicit modelling of buildings in urban areas. • No allowance made for local variations in drainage, pumping or other works constructed for the purpose of flood risk management. • The ‘>0.3m’ layer shows where modelled flooding is greater than 0.3m deep.
case producing flooding of greater than 0.3m depth.
8 • Areas Susceptible to Groundwater Flooding (AStGWF) is a strategic scale map showing groundwater flood areas on a 1km square grid• This data has used the top two susceptibility bands of the British Geological Society (BGS) 1:50,000 Groundwater Flood Susceptibility Map, which was developed on a 50m grid from:• NEXTMap 5m grid DTM.• National Groundwater Level data on a 50m grid• BGS 1:50 000 geological mapping, with classifications of permeability• It covers consolidated aquifers (chalk, limestone, sandstone etc.) and superficial deposits.• Flood plains are not explicitly identified; the mapping identifies where groundwater is likely to emerge, and not where the water is subsequently likely to flow or pond.• No allowance is made for engineering works, or for groundwater rebound or abstraction to prevent groundwater rebound.
City of Bristol ST5942072340 City of Bristol Areas Susceptible to Groundwater Flooding (AStGWF)
Does not describe a probability, but shows places where groundwater emergence more likely to occur.
Unknown Groundwater High Natural exceedance Natural flood Yes 129400 Detailed GIS 1100 Critical Infrastructure buildings
prevent groundwater rebound.• Shows the proportion of each 1km grid square which is susceptible to groundwater emergence, using four area categories.

Annex 2 Future floods
Yes 3000 Detailed GIS It is estimated that 55.8km of roads and 3.41km of railways will be affected. As the area in question is predominantly urban only 0.1km2 of agricultural land is anticipated to flood, including 0.01km2 of grade 2 land, no grade 1 land affected.
Yes 0.03km2 of internationally designated sites. 5 IPPC sites, 1 Active Radio Active Sites Authorisations and 1 Active Radio Active Sites Registrations. 43 Waste Licence sites in Avonmouth Ward.
Yes 162 Listed Buildings affected by this flood outline. 39 buildings located in one 1km grid square in Cabot Ward, centered on the Floating Harbour. 0.12km2 of historic Parks and Gardens, but no Scheduled Ancient Monuments affected.
• 100 Hotspots (67% of Study Area).• 597 Residential buildings at risk to the west of Temple Meads. • Greatest number of Non-Residential buildings (231) at risk located to the north of Temple Meads. • 8 Critical Infrastructure buildings at risk in Hengrove.• Greatest flood extent and percentage of flooding located within Hengrove Ward (0.24km2 or 6.6%).
Environment Agency 2.83 Medium-Low 2010-11 JFLOW-GPU Depth-duration-frequency curves derived from FEH CD-ROM, from centre of each 5km model, with areal reduction factor applied to convert point rainfall estimate to more representative figure. Curve then used to derive 1.1 hr, 1:30 chance rainfall depth; this is converted to hyetograph, using summer rainfall profile. See "Description of assessment method" for allowances for infiltration and drainage.
Rainfall Hyetograph, EA 2m Composite DTM, OSMM Topography
Unmarked UKE06000023F0004
Yes 800 Detailed GIS It is estimated that 11.8km of roads and 0.43km of railways will be affected. As the area in question is predominantly urban only 0.02km2 of agricultural land is anticipated to flood, however only flooding to grade 3 land occurs.
Yes No internationally or nationally designated sites; only 0.01 km2 of ancient woodland affected. 3 IPPC sites, 7 Waste Licence sites prodominantly located in Avonmouth Ward which could cause pollution if flooded.
Yes 53 Listed Buildings affected by this flood outline. 9 buildings located in one 1km grid square in Cabot Ward, centered on the Floating Harbour. 0.03km2 of historic Parks and Gardens, but no Scheduled Ancient Monuments
• 44 Hotspots (28% of Study Area).• 267 Residential buildings and 101 Non-Residential buildings at risk to the north of Temple Meads. • 7 Critical Infrastructure buildings at risk in Hengrove• Greatest flood extent
Environment Agency 0.73 Medium-Low 2010-11 JFLOW-GPU Depth-duration-frequency curves derived from FEH CD-ROM, from centre of each 5km model, with areal reduction factor applied to convert point rainfall estimate to more representative figure. Curve then used to derive 1.1 hr, 1:30 chance rainfall depth; this is converted to hyetograph, using summer rainfall profile. See "Description of assessment method" for allowances for infiltration and drainage.
Rainfall Hyetograph, EA 2m Composite DTM, OSMM Topography
Unmarked UKE06000023F0005
to grade 3 land occurs. Ancient Monuments affected.
• Greatest flood extent and percentage of flooding located within Hengrove Ward (0.069km2 or 2%).
Yes 7400 Detailed GIS During this event it is estimated that 166km of roads and 8km of railways will be affected. As the area in question is predominantly urban only 0.33km2 of agricultural land will be flooded, including 0.01km2 of grade 1 and 0.02km2 of grade 2 land.
Yes 0.06km2 of internationally designated, 0.01 of nationally designated and 0.08km2 of locally designated sites. 13 IPPC sites, 3 Active Radio Active Sites Authorisations, 2 Active Radio Active Sites Registrations and 79 Waste Licence sites.
Yes 425 Listed Buildings affected by this flood outline. 88 buildings located in one 1km grid square in Cabot Ward, centered on the Floating Harbour. 0.12km2 of historic Parks and Gardens, but no Scheduled Ancient Monuments affected.
• 125 Hotspots (84% of Study Area).• 1328 Residential buildings at risk at the centre of the City, around the Floating Harbour. • 448 Non-Residential properties at risk in Newtown area.• 11 Critical Infrastructure buildings at risk in Lower Knowle.• Greatest flood extent located in Avonmouth Ward (0.94km2).• Greatest percentage of flooding located within Hengrove Ward (0.51km2 or 14.4%).
Environment Agency 8.64 Medium-Low 2010-11 JFLOW-GPU Depth-duration-frequency curves derived from FEH CD-ROM, from centre of each 5km model, with areal reduction factor applied to convert point rainfall estimate to more representative figure. Curve then used to derive 1.1 hr, 1:200 chance rainfall depth; this is converted to hyetograph, using summer rainfall profile. See "Description of assessment method" for allowances for infiltration and drainage.
Rainfall Hyetograph, EA 2m Composite DTM, OSMM Topography
Unmarked UKE06000023F0006
Yes 2500 Detailed GIS During this event it is estimated that 43km of roads and 3km of railways will be
Yes 0.01km2 of internationally designated, no nationally designated
Yes 155 Listed Buildings affected by this flood outline. 32 buildings located in one 1km grid
• 88 Hotspots (59% of Study Area).• 634 Residential buildings at risk at the
Environment Agency 2.77 Medium-Low 2010-11 JFLOW-GPU Depth-duration-frequency curves derived from FEH CD-ROM, from centre of each 5km model, with areal reduction factor applied to convert point rainfall estimate to more
Rainfall Hyetograph, EA 2m Composite DTM, OSMM Topography
Unmarked UKE06000023F0007
railways will be affected. As the area in question is predominantly urban only 0.09km2 of agricultural land will be flooded, with only grades 3 and 4 being affected.
nationally designated and 0.01km2 of locally designated sites flooded. 6 IPPC sites, 2 Active Radio Active Sites Authorisations, 1 Active Radio Active Sites Registrations and 32 Waste Licence sites.
located in one 1km grid square in Cabot Ward, centered on the Floating Harbour. 0.12km2 of historic Parks and Gardens, but no Scheduled Ancient Monuments affected.
buildings at risk at the centre of the City, around the Floating Harbour. • 230 Non-Residential properties at risk in Newtown area.• 9 Critical Infrastructure buildings at risk in Lower Knowle.• Greatest flood extent located in Hengrove Ward (0.19km2).• Greatest percentage of flooding located within Bedminster Ward (0.15km2 or 5.9%).
convert point rainfall estimate to more representative figure. Curve then used to derive 1.1 hr, 1:200 chance rainfall depth; this is converted to hyetograph, using summer rainfall profile. See "Description of assessment method" for allowances for infiltration and drainage.
Topography
Yes 18,500 Detailed GIS During this event it is estimated that 1014km of roads and 37km of railways will be affected. 4.36km2 of agricultural land will be flooded, with 0.06km2 of grade 1 and 0.21 grade 2 land affected.
Yes 2.1km2 of internationally designated, 0.4km2 of Ancient Woodland and 0.73km2 of locally designated sites flooded. 16 IPPC sites, 3 Active Radio Active Sites Authorisations, 3 Active Radio Active Sites Registrations and 95
Yes 1160 Listed Buildings affected by this flood outline. 280 buildings located in one 1km grid square in Cabot Ward, centered on the Floating Harbour. 4km2 of historic Parks and Gardens and 0.13km2 Scheduled Ancient Monuments affected.
Data developed specifically for PFRA, and is unlikely to be suitable for any other purposes.• 99 Hotspots (66% of Study Area)• If grid square poses a potential risk of groundwater flooding all NRD points within are calculated as being
Environment Agency 87.1 Low 2010-11 ArcGIS Uses data which is developed from published BGS groundwater level contours, groundwater levels in BGS WellMaster database and some river levels. No probability is associated with this data.
British Geological Society (BGS) DiGMapGB-50 [Susceptibility to Groundwater Flooding].
Unmarked UKE06000023F0008
Registrations and 95 Waste Licence sites.
affected. are calculated as being at risk, hence the resulting high values entered in the spreadsheet. • Data provides an inaccurate account of risk posed by this flood source.

Annex 2 Future floods
9 • Modelling developed from combination of national (2004) and local (generally 1998-2010) modelling.• Topography derived from LIDAR (on 0.25m-2m grids; original accuracy ± 0.15m), NEXTMap SAR (on 5m grid; original accuracy ± 1.0m), processed to remove buildings & vegetation. For local modelling, topography may include ground survey.• Location of watercourses and tidal flow routes dictated by topographic survey.• Areas that may flood are defined for catchments >3km² by routing appropriate flows for that catchment through the model to ascertain water level and thus depth and extent. • Manning’s n of 0.1 used for national fluvial modelling; variable (calibrated) values for national tidal modelling; appropriate values selected for local modelling. Channel capacity assumed as QMED for national fluvial modelling; local survey methods used for local modelling. • For the purpose of flood risk management, models assume that there are no raised defences.
City of Bristol ST5942072340 City of Bristol Flood Map (for rivers and sea) - flood zone 3
Fluvial 1 in 100, tidal 1 in 200
100 Main rivers Sea, ordinary watercourses
Medium Natural exceedance Natural flood Yes 4300 Detailed GIS 100 Critical Infrastructure buildings.
10 • Modelling developed from combination of national (2004) and local (generally 2004-2010) modelling.• Topography derived from LIDAR (on 0.25m-2m grids; original accuracy ± 0.15m), NEXTMap SAR (on 5m grid; original accuracy ± 1.0m), processed to remove buildings & vegetation. For local modelling, topography may include ground survey.• Location of watercourses and tidal flow routes dictated by topographic survey.• Areas that may flood are defined for catchments >3km² by routing appropriate flows for that catchment through the model to ascertain water level and thus depth and extent. • Manning’s n of 0.1 used for national fluvial modelling; variable (calibrated) values for national tidal modelling; appropriate values selected for local modelling. Channel capacity assumed as QMED for national fluvial modelling; local survey methods used for local modelling. • For the purpose of flood risk management, models assume that there are no raised defences.
City of Bristol ST5942072340 City of Bristol Flood Map (for rivers and sea) - flood zone 2
Extreme flood outline is 1 in 1000, and includes some historic where judged that this gives an indication of areas at risk of future flooding.
1000 Main rivers Sea, ordinary watercourses
Medium Natural exceedance Natural flood Yes 10300 Detailed GIS 200 Critical Infrastructure buildings.
11 • Surface Water Management Plan Data (100yr rainfall event - 0.5m cutoff)• Modelling developed from combination of local (generally 2004-2010) models from various sources including EA (River Models) and Wesex Water (sewer models).• Topography derived from LIDAR (on 4m grids; original accuracy ± 0.15m), NEXTMap SAR (on 5m grid; original accuracy ± 1.0m), processed to remove buildings & vegetation. For local modelling, topography may include ground survey and MasterMap for property footprints.• Areas that may flood are defined for all catchments by routing appropriate flows for that catchment through the model to ascertain water level and thus depth and extent. • Manning’s used are variable based on depth of flow • Ancilaries modeled - pumps; CSO's; sewers greater than 450 mm dia.; water escaping manholes; gullies; watercourses;• 24h superstorm (critical storm for the whole catchment)• FSR data allowing dinamic loss model to be used and Wallingford dynamic loss model used.
City of Bristol ST5942072340 City of Bristol Surface Water Flood Map
Flood modelled is representative of the 1 in 100 year surface water flood event with threshold of 0.5m used.
100 Surface runoff High Natural exceedance Natural flood Yes 29200 Detailed GIS 200 Critical Infrastructure buildings.

Annex 2 Future floods
Yes 3100 Detailed GIS During this event it is estimated that 123km of roads and 13km of railways will be affected. As the area in question is predominantly urban only 2.48km2 of agricultural land will be flooded, with 0.11km2 of grade 2 land affected and no grade 1.
Yes 1.98km2 of internationally designated, no nationally designated and 0.12km2 of locally designated sites flooded. 15 IPPC sites, 1 Active Radio Active Sites Authorisations, 1 Active Radio Active Sites Registrations and 73 Waste Licence sites.
Yes 109 Listed Buildings affected by this flood outline. 33 buildings located in one 1km grid square in Cabot Ward, centered on the Floating Harbour. 0.13km2 of historic Parks and Gardens and 0.02km2 Scheduled Ancient Monuments affected.
Data updated quarterly. To understand the likelihood of future flooding, taking account of defences, refer to Areas Benefitting from Defences and National Flood Risk Assessment (NaFRA) data. Marked 'Protect' for complete national dataset only. • 49 Hotspots (33% of Study Area).• 560 Residential buildings at risk within Avonmouth Ward. • 326 Non-Residential and 18 Critical Infrastructure buildings at risk within the same square in Avonmouth Ward.• Greatest flood extent and percentage of flooding occurs within Avonmouth Ward (14.59km2 or 81%).
Environment Agency 19.35 Medium 2010-11 Varies but mainly JFLOW, ISIS, HEC-RAS, TUFLOW for fluvial, and HYDROF for tidal.
National methodology described in "National Generalised Modelling for Flood Zones - Fluvial & Tidal Modelling Methods - Methodology, Strengths and Limitations". A national dataset (for England and Wales) of fluvial flood peak estimates was derived from the Flood Estimation Handbook (FEH) to generate a 1 in 100 chance fluvial flood. Local fluvial modelling uses FEH methods. Peak tidal water levels from either Dixon & Tawn (DT3) or local data sets to derive 1 in 200 chance tide levels including surge from POL CSX model.
NextMap SAR DTMe, UKHO Admiralty Charts, 1:50K CEH River Centre Line, CEH FEH Q(T) Grids, POL CSX Peak Extreme Water Levels, POL CS3 Astronomical Tides, UKHO Admiralty Tide Time-Series Calibration Locations, OS 1:10 Boundary Line MHW
Protect Commercial UKE06000023F0009
Yes 5100 Detailed GIS During this event it is estimated that 178km of roads and 15km of railways will be affected. As the area in question is predominantly urban only 2.59km2 of agricultural land will be flooded, with 0.11km2 of grade 2 land affected and no grade 1.
Yes 2.01km2 of internationally designated, no nationally designated and 0.12km2 of locally designated sites flooded. 17 IPPC sites, 2 Active Radio Active Sites Authorisations, 1 Active Radio Active Sites Registrations and 78 Waste Licence sites.
Yes 279 Listed Buildings affected by this flood outline. 114 buildings located in one 1km grid square in Cabot Ward, centered on the Floating Harbour. 0.16km2 of historic Parks and Gardens and 0.02km2 Scheduled Ancient Monuments affected.
Data updated quarterly. To understand the likelihood of future flooding, taking account of defences, refer to National Flood Risk Assessment (NaFRA) data. Marked 'Protect' for complete national dataset only. • 65 Hotspots (43% of Study Area).• 1198 Residential buildings at risk within 1 grid square located to the east of the Floating Harbour.• 478 Non-Residential buildings at risk in Newtown. • 19 Critical Infrastructure buildings at risk within 1 grid square in Avonmouth Ward.• Greatest flood extent and percentage of flooding occurs within Avonmouth Ward (15km2 or 84%).
Environment Agency 23.07 Medium 2010-11 Varies but mainly JFLOW, ISIS, HEC-RAS, TUFLOW for fluvial, and HYDROF for tidal.
National methodology described in "National Generalised Modelling for Flood Zones - Fluvial & Tidal Modelling Methods - Methodology, Strengths and Limitations". A national dataset (for England and Wales) of fluvial flood peak estimates was derived from the Flood Estimation Handbook (FEH) to generate a 1 in 1000 chance fluvial flood. Local fluvial modelling uses FEH methods. Peak tidal water levels from either Dixon & Tawn (DT3) or local data sets to derive 1 in 1000 chance tide levels including surge from POL CSX model.
NextMap SAR DTMe, UKHO Admiralty Charts, 1:50K CEH River Centre Line, CEH FEH Q(T) Grids, POL CSX Peak Extreme Water Levels, POL CS3 Astronomical Tides, UKHO Admiralty Tide Time-Series Calibration Locations, OS 1:10 Boundary Line MHW, Historic Flood Map
Protect Commercial UKE06000023F0010
Yes 5000 Detailed GIS During this event it is estimated that 54.43km of roads and 4.65km of railways will be affected. 0.44km2 of agricultural land will be flooded, with 0.01km2 of grade 2 and 0.02 of grade 1 land affected.
Yes 0.03km2 of internationally, 0.02km2 of locally and 0.01km2 of policy designated sites. 7 IPPC sites, 3 Active Radio Active Sites Authorisations, 2 Active Radio Active Sites Registrations and 39 Waste Licence sites.
Yes 540 listed buildings are affected by this flood outline. 88 buildings located in the area of Kingsdown, Cabot Ward. 10.22km2 of Historic Parks and Gardens and no Scheduled Ancient Monuments are affected.
111 Hotspots (74% of Study Area).• 2301 Residential buildings at risk within Cabot Ward, the centre of Bristol indicated as being at greatest risk of surface water flooding.• 410 Non-Residential buildings at risk in the kingsdown area of Cabot Ward. • 8 Critical Infrastructure buildings at risk within 1 grid square to the east of Kingsdown.• Greatest flood extent and percentage of flooding occurs within Southville Ward (0.31km2 or 6.32%).
City of Bristol Council 4.8 High-Medium 2011 UKE06000023F0011

2011s4891 2011s4891 BCC PFRA draft pm3.docx 49
A.3 Records of Flood Risk Areas and their rationale (preliminary assessment report spreadsheet)

Annex 3 Flood Risk Areas
ANNEX 3: Records of Flood Risk Areas and their rationale (preliminary assessment report spreadsheet)
Field: Flood Risk Area ID Name of Flood Risk
Area
National Grid
Reference
Main source of
flooding
Additional source(s)
of flooding
Confidence in main
source of flooding
Main mechanism of
flooding
Main characteristic
of flooding
Significant
consequences to
human health
Human health
consequences -
residential properties
Property count method Other human health
consequences
Significant economic
consequences
Number of non-
residential properties
flooded
Mandatory / optional: Mandatory Mandatory Mandatory Mandatory Optional Optional Mandatory Mandatory Mandatory Optional Optional Optional Mandatory Optional
Format: Unique number
between 1-9999
Max 250 characters 12 characters: 2
letters, 10 numbers
Pick from drop-down Max 250 characters,
same source terms
Pick from drop-down Pick from drop-down Pick from drop-down Pick from drop-down Number between 1-
10,000,000
Pick from drop-down Max 250 characters Pick from drop-down Number between 1-
10,000,000
Notes: A sequential number
starting at 1 and
incrementing by 1 for
each record.
Name of the locality
associated with the
Flood Risk Area; a
town, city, or county.
National Grid
Reference of the
centroid (centre point,
falls within polygon) of
the Flood Risk Area.
Pick the source from
which there is a
significant flood risk.
Refer to the PFRA
guidance for
definitions of sources.
If there is also
significant flood risk
generated by another
source (other than the
Main source of
flooding), report the
source(s) here, using
the same source
terms.
Pick a broad level of
confidence in the Main
source of flooding
from; 'High'
(compelling evidence
of source - about 80%
confident that source
is correct), 'Medium'
(some evidence of
source but not
compelling - about
50% confident that
source is correct) 'Low'
(source assumed -
about 20% confident
that source is correct)
Pick a mechanism
from; 'Natural
exceedance' (of
capacity), 'Defence
exceedance'
(floodwater
overtopping defences),
'Failure' (of natural or
artificial defences or
infrastructure, or of
pumping), 'Blockage or
restriction' (natural or
artificial blockage or
restriction of a
conveyance channel
or system), or 'No
Pick a characteristic
from; 'Flash flood'
(rises and falls quite
rapidly with little or no
advance warning),
'Natural flood' (due to
significant
precipitation, at a
slower rate than a
flash flood), 'Snow
melt flood' (due to
rapid snow melt),
'Debris flow'
(conveying a high
degree of debris), or
'No data'. Most UK
Has the Flood Risk
Area been identified as
a result of significant
consequences to
human health?
Record the number of
residential properties
where the building
structure would be
affected either
internally or externally
by the flood.
Where residential or
non-residential
properties have been
counted, it is important
to record the method
of counting, to aid
comparisons between
counts. Choose from;
'Detailed GIS' (using
property outlines, as
per Environment
Agency guidance),
'Simple GIS' (using
property points),
'Estimate from map',
or 'Observed number'.
If the Flood Risk Area
has been identified as
a result of other
Significant
consequences to
human health,
describe them (such
as information about
the number of critical
services flooded).
Has the Flood Risk
Area been identified as
a result of significant
economic
consequences?
Record the number of
non-residential
properties where the
building structure
would be affected
either internally or
externally by the flood.
that source is correct)
or 'Unknown'.
or system), or 'No
data'.
'No data'. Most UK
floods are 'Natural
floods'.
or 'Observed number'.
Example: 1 London SX1234512345 Surface runoff NA High Natural exceedance Natural flood Yes 50000 Detailed GIS No
Records begin here: 1 Bristol ST5942072340 Surface runoff N/A High Natural exceedance Natural flood Yes 31,600 Detailed GIS 200 Critical
Infrastructure
buildings
Yes 5,700

Annex 3 Flood Risk Areas
Property count method Other economic
consequences
Significant
consequences to the
environment
Environment
consequences
Significant
consequences to
cultural heritage
Cultural heritage
consequences
Origin of Flood Risk
Area
Amended Flood Risk
Area rationale
New Flood Risk Area
rationale
Rationale detail European Flood Risk Area Code
Optional Optional Mandatory Optional Mandatory Optional Mandatory Mandatory Mandatory Mandatory Auto-populated
Pick from drop-down Max 250 characters Pick from drop-down Max 250 characters Pick from drop-down Max 250 characters Pick from drop-down Pick from drop-down Pick from drop-down Max 1,000 characters Max 42 characters
Where residential or
non-residential
properties have been
counted, it is important
to record the method
of counting, to aid
comparisons between
counts. Choose from;
'Detailed GIS' (using
property outlines, as
per Environment
Agency guidance),
'Simple GIS' (using
property points),
'Estimate from map',
or 'Observed number'.
If the Flood Risk Area
has been identified as
a result of other
Significant economic
consequences,
describe them (such
as information about
the area of agricultural
land flooded, length of
roads and rail flooded).
Has the Flood Risk
Area been identified as
a result of significant
consequences to the
environment?
If the Flood Risk Area
has been identified as
a result of Significant
consequences to the
environment, describe
them (such as
information about
national and
international
designated sites
flooded, and pollution
sources flooded).
Has the Flood Risk
Area been identified as
a result of significant
consequences to
cultural heritage?
If the Flood Risk Area
has been identified as
a result of Significant
consequences to
cultural heritage,
describe them (such
as information about
the number and type
of heritage assets
flooded).
Pick the origin from
either; 'Indicative'
Flood Risk Area,
'Amended' Flood Risk
Area (in which case
Amended Flood Risk
Area rationale is
mandatory), or 'New'
Flood Risk Area (in
which case New Flood
Risk Area rationale is
mandatory).
Pick the main rationale
from either;
'Geography', 'Past
floods', or 'Future
floods'. Then provide
further detail in
Rationale detail. This is
not mandatory if the
Flood Risk Area was
an indicative Flood
Risk Area and has not
been amended, or is a
new Flood Risk Area.
Pick the main rationale
from either 'Past
floods', or 'Future
floods'. Then provide
further detail in
Rationale detail. This is
not mandatory if the
Flood Risk Area was
an indicative Flood
Risk Area.
Summarise the rationale for amending an indicative Flood Risk Area, or identifying a new
Flood Risk Area. Refer to Defra & WAG guidance to LLFAs on "Selecting and reviewing
Flood Risk Areas for local sources of flooding". If the Flood Risk Area was an indicative
Flood Risk Area and has not been amended, record "indicative Flood Risk Area".
This field will autopopulate using the LLFA
name provided on the "Instructions" tab, and
the Flood Risk Area ID. It is an EU-wide
unique identifier and will be used to report the
Flood Risk Area information.
Format: UK<ONS Code><A><LLFA Flood
ID>. "ONS Code" is a unique reference for
each LLFA. "A" indicates it is a Flood Risk
Area. "LLFA Flood ID" is a sequential number
beginning with 0001.
or 'Observed number'.
No No Indicative NA NA indicative Flood Risk Area UKE10000012A0001
Detailed GIS It is estimated that
71.8km of roads and
6.05km of railways will
be affected. 1.56km2
of agricultural land is
anticipated to flood,
including 0.1km2 of
grade 1 and 0.17km2
of grade 2 land.
Yes 0.03km2 of
internationally
designated, 0.06km2
of locally designated
and 0.24km2 of
Ancient Woodland
sites potentially
flooded from 2 IPPC
sites, 5 Active Radio
Active Sites (Auths), 2
Yes 512 Listed Buildings
affected by this flood
outline. 0.2km2 of
historic Parks and
Gardens, and
0.004km2 of
Scheduled Ancient
Monuments affected.
Indicative Indicative Flood Risk Area UKE06000023A0001
Active Sites (Auths), 2
Active Radio Active
Sites (Regs) and 20
Waste Licence sites.

2011s4891 2011s4891 BCC PFRA draft pm3.docx 50
A.4 Review checklist

Notes for completion Environment Agency area reviewEnvironment Agency
national review
Step 1
1.1Have appropriate governance and partnership
arrangements been set up?
Refer to section 2.3 of guidance. Governance and partnership
arrangements should be to the satisfaction of the LLFA.
1.2
Who in the LLFA reviewed the PFRA and when
was it done?
Please state the review and approval process and when approval
was gained e.g. Officer, Scrutiny Committee, Cabinet. Refer to
Section 5 of the guidance.
Step 2
2.1Has a data management system been established
and implemented?
See Annex 5 for information about data standards
Step 3
3.1Has information been requested from all relevant
partners?
See Flood Risk Regulations Part 6 Co-operation.
3.2
Are there any gaps in available information? (This
could include gaps which could have been filled but
weren't, or gaps which couldn't be filled because
the information wasn't available)
LLFAs - Are there gaps in certain locations, or for certain events
that you are aware of, or for certain sources of flooding (such as
groundwater). Respond with Yes/No and provide comments on any
missing information.
EA Review - Has all available information has been gathered and
included?
Step 4
4.1
Which dataset (or combination of datasets) has
been determined as "locally agreed surface water
LLFAs - Select from drop down. Refer to "Locally agreed surface
water information" text box in section 3.5.1 (p.17) of guidance.
Yes
Yes
Yes
Determine appropriate data systems
No
Determining locally agreed surface water information
Combination of FMfSW and other local
information
Preliminary Flood Risk Assessment Checklist
LLFA Name:
Checklist questions LLFA
Collate information on past and future floods and their consequences
Set up governance and develop partnerships
4.1 been determined as "locally agreed surface water
information"?
water information" text box in section 3.5.1 (p.17) of guidance.
EA review - Has this been agreed?
4.2
Has the locally agreed surface water information
been clearly stated and presented (on a map) in the
Preliminary Assessment Report?
LLFAs - Select Yes/No from drop down list. Refer to "locally
agreed surface water information" text box in section 3.5.1 (p.17)
of guidance.
4.3
If available, what is the total property count for
locally agreed surface water information in the
LLFA?
If known, please enter the total number of properties at risk in the
LLFA.
4.4
If applicable, has the method for counting
properties been described in the Preliminary
Assessment Report?
Refer to text box on page 17 of guidance
4.5
Has available information on local drainage
capacity (where used to inform the determination of
locally agreed surface water information) been
included in the report?
Refer to text box on page 17 of guidance. Information provided on
drainage may inform options for any future improvements to the
Flood Map for Surface Water.
Yes
Yes
34,200 (Res + Non Res)
information
Yes

Notes for completion Environment Agency area reviewEnvironment Agency
national review
Preliminary Flood Risk Assessment Checklist
LLFA Name:
Checklist questions LLFA
Step 5
5.1
Does the Preliminary Assessment Report cover all
the content described in Annex 1 of the
Environment Agency's PFRA guidance?
LLFAs - If the Preliminary Assessment Report contains all the
content described in Annex 2 of the PFRA guidance, respond with
a 'Yes'. If there are some elements missing, please provide a brief
explanation.
EA Review - Include comments on any missing content.
5.2Has a summary table of flood events been
produced?
Refer to section 3.4 and 3.5 of guidance
5.3Has a description of past flood events been
included?
Refer to section 3.4 and 3.5 of guidance
5.4
Has additional information been included on
climate change and long term developments?
Refer to 3.6 of guidance. Standard text has been provided for
Preliminary Assessment Reports which meets the minimum
requirements of the Flood Risk Regulations. Please respond with
Yes or No, and if additional information has been included, please
state the information source(s)
Step 6
6.1
Are records of past flooding with significant harmful
consequences recorded on the Preliminary
Assessment Report spreadsheet (Annex 1 of
Prelminary Assessment Report) ?
LLFAs - past flooding should be recorded on the spreadsheet and
included as Annex 1 of the Preliminary Assessment Report.
EA review - Are all the mandatory fields complete?
6.2
Are there any past floods with significant harmful
consequences that have not been recorded? If so,
please explain why not.
LLFAs - Respond with Yes or No. If No, provide additional
information e.g. anecdotal information on flood, but not enough
evidence to include
EA review - Do you agree with LLFA response and comments?
Have any additional records of future flooding LLFAs - future flooding information should be recorded on the
Record information on past and future floods with significant consequences in spreadsheet
Yes
Yes
No
Yes
No
Yes
Yes
Complete Preliminary Assessment Report Document
6.3
Have any additional records of future flooding
(other than the national dataset information which is
already completed) been recorded on the future
flooding Preliminary Assessment Report
spreadsheet (Annex 2 of Preliminary Assessment
Report)
LLFAs - future flooding information should be recorded on the
spreadsheet and included as Annex 2 of the Preliminary
Assessment Report.
EA review - Are all mandatory fields complete?
Step 7
7.1Have summary maps been produced for past and
future floods?
Refer to section 3.4 and 3.5 of guidance
Step 8
8.1Is your LLFA within an indicative Flood Risk Area? Indicative Flood Risk Areas were provided to LLFAs by the
Environment Agency in December 2010.
8.2
If the answer to 8.1 is yes, have you reviewed it
using the locally agreed surface water information,
and relevant local information in the Preliminary
Assessment Report?
Refer to section 4 of guidance. LLFAs should identify whether they
have reviewed against local information or just used the indicative
Flood Risk Area information provided by the Environment Agency.
Yes
Yes
Illustrate information on past and future floods
Yes
Review indicative Flood Risk Areas
Yes

Notes for completion Environment Agency area reviewEnvironment Agency
national review
Preliminary Flood Risk Assessment Checklist
LLFA Name:
Checklist questions LLFA
Step 9
9.1
Is a Flood Risk Area proposed? LLFA - select a response from the drop down list and then
complete the relevant questions 9.1.1 - 9.1.5. (NB. Indicative Flood
Risk Areas can be amended due to Geography, past flooding
and/or future flooding.)
9.1.1
If the proposed Flood Risk Area is exactly the same
as the indicative Flood Risk Area, please confirm.
LLFA - please confirm that the boundary of the indicative Flood
Risk Area has not been changed and no change has been made to
the flood risk indicators.
EA review - please confirm
9.1.2
If changes have been made to the indicative Flood
Risk Area because of geography, please identify
what changes have been made.
Use the drop down list to identify the reasons for the change.
Options are the same as the table on page 26 of the PFRA
guidance.
EA review - please confirm evidence supports change
9.1.3
If changes have been made to the indicative Flood
Risk Area because of past / historic flooding,
please indicate the changes and the reasons why.
LLFA - identify the scale of the changes made e.g. major/minor
increase or decrease in size of Flood Risk Area and the source of
information used e.g. records of historic flooding.
EA review - confirm scale of the changes made and provide
indication of confidence in the evidence provided e.g. anecdotal
evidence versus detailed report on flooding event.
9.1.4
If changes have been made to the indicative Flood
Risk Areas because of future flooding, please
indicate the changes and the reasons why.
LLFA - identify the scale of the changes made e.g. major/minor
increase or decrease in size of Flood Risk Area and the source of
information used e.g. detailed modelling as part of SWMP.
EA review - confirm scale of the changes made and indication of
confidence in the evidence
9.1.5
If a new Flood Risk Area is being proposed, does it
meet the Defra / WAG thresholds?
Criteria and thresholds are set out in the Defra/WAG guidance on
selecting and reviewing Flood Risk Areas for local sources of
flooding
n/a
Yes - it is exactly the same as the indicative
Flood Risk Area (go to question 9.1.1)
n/a
N/A
Yes
Identify Flood Risk Areas
9.1.5 flooding
EA review - identify the evidence provided to support this and
indicate degree of confidence in the evidence.
9.2
Does the proposed Flood Risk Area include
flooding from interactions with main river, reservoirs
or the sea?
LLFAs should respond with Yes or No.
EA Review - Summarise the location and nature of interactions i.e.
river or sea.
9.3
Has an indicative Flood Risk Area been deleted? LLFA - Respond with Yes/No and if an indicative Flood Risk Area
has been deleted please provide a short description why.
EA - confirm the evidence presented to support this is aligned to
'locally agreed surface water information'
Step 10
10.1
If proposing Flood Risk Areas, have the mandatory
fields in the spreadsheet been completed?
LLFAs - the spreadsheet indicates mandatory columns to be
completed.
EA Review - Are all mandatory fields complete?
10.2
Has a rationale and evidence for
amending/adding/deleting Flood Risk Areas been
included in the Preliminary Assessment Report?
LLFAs - Refer to Table 5 on page 26 of the PFRA guidance and
Annexes A-D of the Defra/WAG Guidance. Rationale should be
included in "Identification of Flood Risk Areas" section of
Preliminary Assessment Report.
EA Review - Confirm that supporting evidence for any
amendments/additions/deletions has been provided in the
Preliminary Assessment Report and annexes
Yes
N/A
Record information including rationale - ONLY COMPLETE IF ANSWER TO 9.1 IS YES
No
No

2011s4891 2011s4891 BCC PFRA draft pm3.docx 51
A.5 GIS layer of flood risk area

Offices at
Atherstone
Doncaster
Edinburgh
Haywards Heath
Limerick
Newcastle upon Tyne
Newport
Northallerton
Saltaire
Skipton
Tadcaster
Wallingford
Warrington
Registered Office South Barn
Broughton Hall
SKIPTON
North Yorkshire
BD23 3AE
t:+44(0)1756 799919 e:[email protected]
Jeremy Benn Associates Ltd Registered in England 3246693
Visit our website
www.jbaconsulting.co.uk


![TE - PIA Preliminary Impact Assessment · Web viewEuropean Aviation Safety Agency Preliminary Impact Assessment Preliminary Impact Assessment – [Title] TE.RPRO.00091-001© European](https://static.fdocuments.us/doc/165x107/5ea0558447409873380e0624/te-pia-preliminary-impact-assessment-web-view-european-aviation-safety-agency.jpg)